Amani M. Allen, Ph.D., M.P.H. Divisions of Community Health Sciences and Epidemiology Center for Health Equity Seminar Series January. 15,2020 Race, Racism and Biological Embedding: A ‘critical’ approach to population health and health inequities Berkeley Center for Social Medicine • University of California, Berkeley
Transcript
Amani M. Allen, Ph.D., M.P.H.Divisions of Community Health Sciences and Epidemiology
Center for Health Equity Seminar Series
January. 15,2020
Race, Racism and Biological Embedding:
A ‘critical’ approach to population health and health inequities
Berkeley Center for Social Medicine • University of California, Berkeley
Physiognomy RACE
PHYSIOGNOMY
CULTURE/
ETHNICITY
SOCIETAL
HEALTH/ILLNESS
BEHAVIOR
EXTERNAL
RISK EXPOSURE
RACE DIFFERENCES
IN HEALTH STATUS
LaVeist TA. Ethn Dis. 1996; 6(1-2):21-9.
Socially-assigned race
US: Black Brazil: White
020
40
60
80
100
39.4
55.1
63.1
perc
ent
of re
spo
nd
en
ts
Report excellent or very good health
Hispanic-Hispanic Hispanic-White White-White
General health status, by self-identified and socially-assigned "race"
24.8
18.9
12.7p
erc
ent
of re
spo
nd
en
ts
Report fair or poor health
Socially-Assigned Race
Jones CP, Truman BI, Elam-Evans LD, et al. Ethnicity & Disease. 2008;18(4):496-504
Jones CP, Truman BI, Elam-Evans LD, et al. Ethnicity & Disease. 2008;18(4):496-504Jones CP, Truman BI, Elam-Evans LD, et al. Ethnicity & Disease. 2008;18(4):496-504
Racism and Discrimination Defined
Racism is an organized system premised on the categorization and ranking of social groups into races and devalues, disempowers, and
differentially allocates desirable societal opportunities and resources to racial groups regarded as inferior (Bonilla-Silva, 1996; D. Williams,
2004).
Racism often leads to the development of negative attitudes(prejudice) and beliefs (stereotypes) toward non-dominant,
stigmatized racial groups and differential treatment (discrimination) of these groups by both individuals and social institutions.
The Lifecourse Lu and Halfon, 2003
Generalized Susceptibility
“Do we not always find the diseases of the populace traceable to defects in society? No matter whether
meteorological conditions, general cosmic changes…never do these in themselves make epidemics, they only induce them whenever, through poor social
conditions, the people have lived under abnormal conditions for a long time”
- Rudolph Virchow, 1849
Stress
General Adaptation Syndrome “fight or flight”
H Selye, 1954
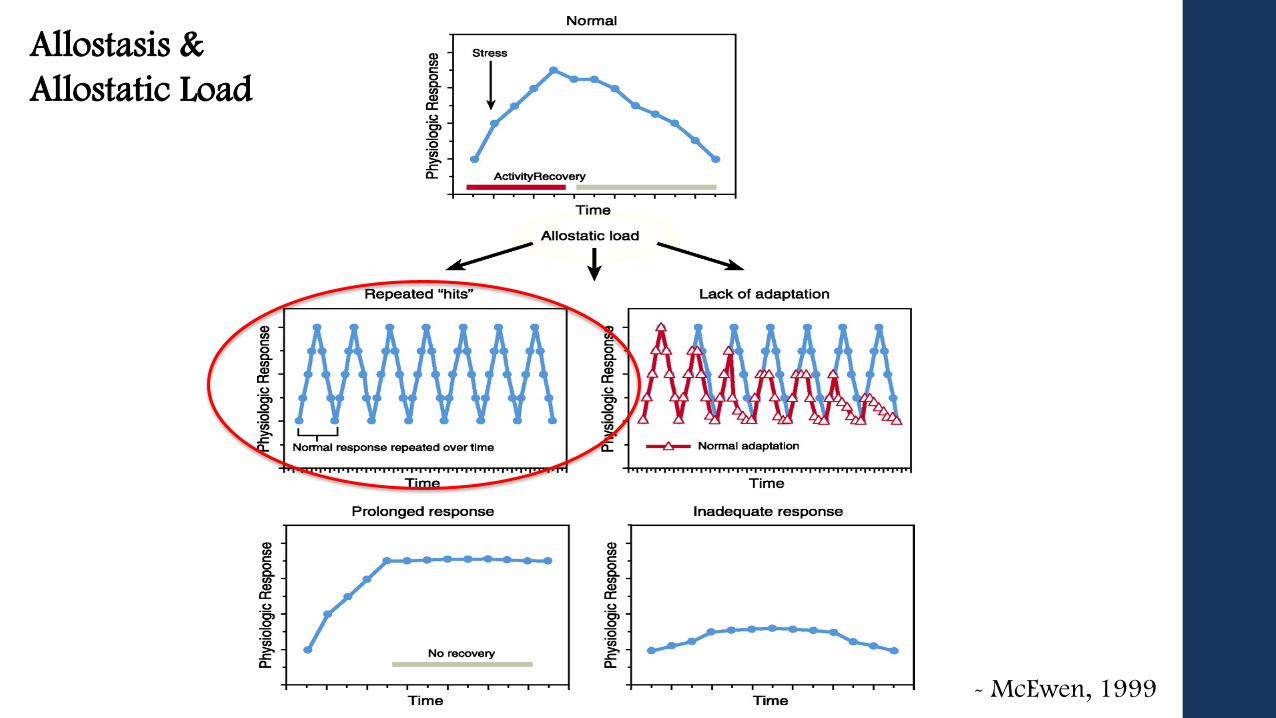
McEwen, 1998- McEwen, 1999
Allostasis &
Allostatic Load
Example: Cortisol
• Allostasiso Glucose metabolism
o Blood pressure regulation
o Immune function
o Inflammatory response
• Dysregulationo Impaired cognitive fn
o Blood-sugar imbalance
o Hbp
o Immune suppression
o Adrenal failure
o Abdominal fat → heart attack, stroke
o ↑ LDL
o Decreased bone density
Stress
Stress is a process “in which environmental
demands tax or exceed the adaptive capacity of an
organism, resulting in psychological and biological changes
that may place a person at risk for disease.”
- Lazarus & Folkman, 1984
The Stress Response Process
McEwen, B. N Engl J Med 1998; 338:171-179
McEwen, 1999
Gendered Racism & “Weathering”
• Black women up to 5X higher
odds of allostatic load
compared to White men and
women and Black men
• Higher psychosocial stress
among women vs. men
• “Weathering”: early
physiologic aging associated
with chronic social stress
Geronimus et al., 2006
Telomeres
Race and gender differences in Telomeres
• Black women 49-55 are 7.5 years older biologically than white women (Geronimus 2010)
• Black men 30-50 with an anti-black bias and who report higher levels of racial discrimination are 2.5 years older (Chae, Nuru-Jeter et al, 2014)
Prevalence of most common CVDs and related disorders in adults ages 20+ by race and gender, United States
Source: Heart Disease and Stroke Statistics, 2010 Update, American Heart Association; Kiberd B. The Chronic Kidney Disease Epidemic.
J Am Soc Nephrol 2006;17:2967-2973. *Percentages are for Mexican-Americans; †Lifetime risk estimated using 2003 data; Prevalence
estimates for Asians lowest of all groups; Estimates for Pacific Islanders and Native Americans/Alaska Natives unreliable.
How Does “Race” Get Into the Body?
Race x Gender → ?
Stress and CVD
• Black women are ranked among the most at-risk groups for CVD in the U.S.
• Chronic stress plays a role in the etiology and progression of CVD (Black et al 2002; Toth 2008)
• Chronic stress linked with CVD via pro-inflammatory mediators. Psychosocial pathways unclear! (Black et al 2002)
• Focus on physiologic mechanisms with limited attention to the psychosocial processes regulating these mechanisms.
Racism Stress and CVD?
• Racism a chronic stressor among Black women (Krieger 1991,
Krieger and Sidney 1996, Cozier et al 2006)
• Black women report greater distress from racism than Black men (Brown et al 2000)
• Black women use unique cognitive appraisal strategies and coping styles (Nuru-Jeter et al 2009; Woods-Giscombe 2010)
• Integrated specificity: stress exposure x stress appraisal x coping = distinct physiologic stress response (Kemeny 2003)
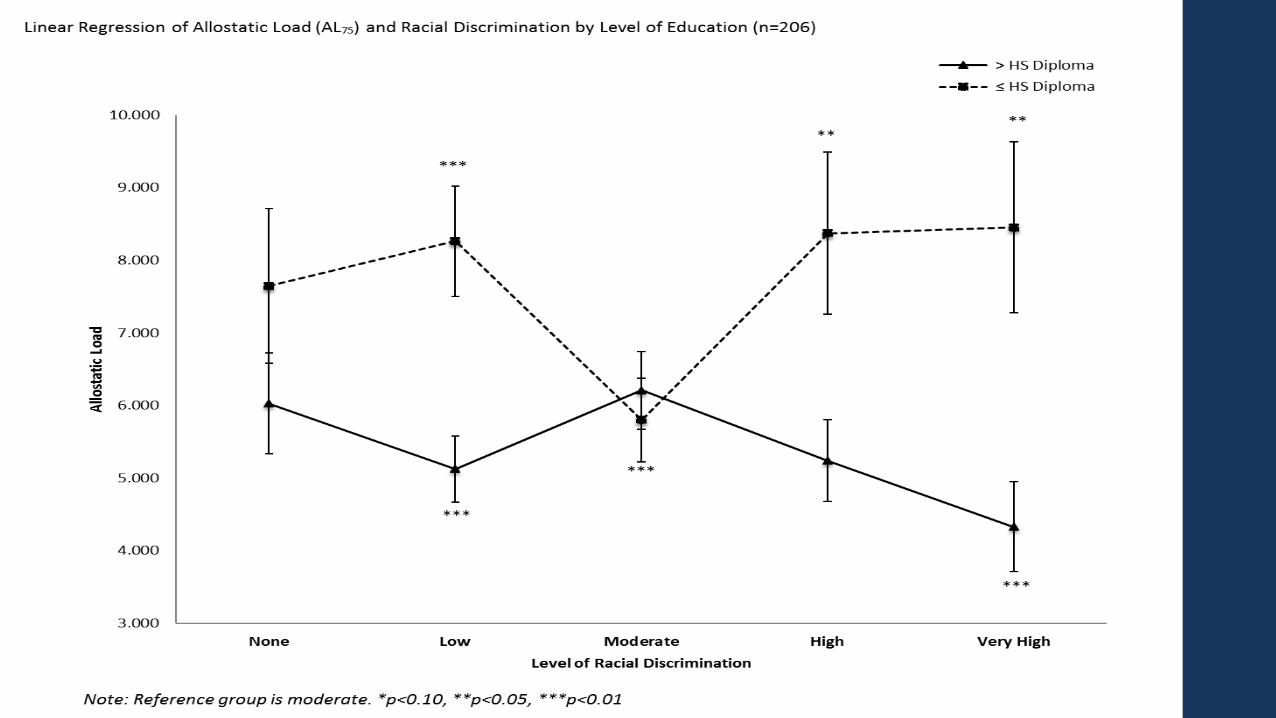
Measures of Racism & Social Status Project (MORS)
Nuru-Jeter A, Dominguez TP, Hammond WP, Leu J, Skaff M, Egerter S, Jones CP, Braveman
P. “It’s the Skin You’re In”: African American Women Talk about Their Experiences of Racism. Matern Child Health J. 2009; 13(1):29-39.
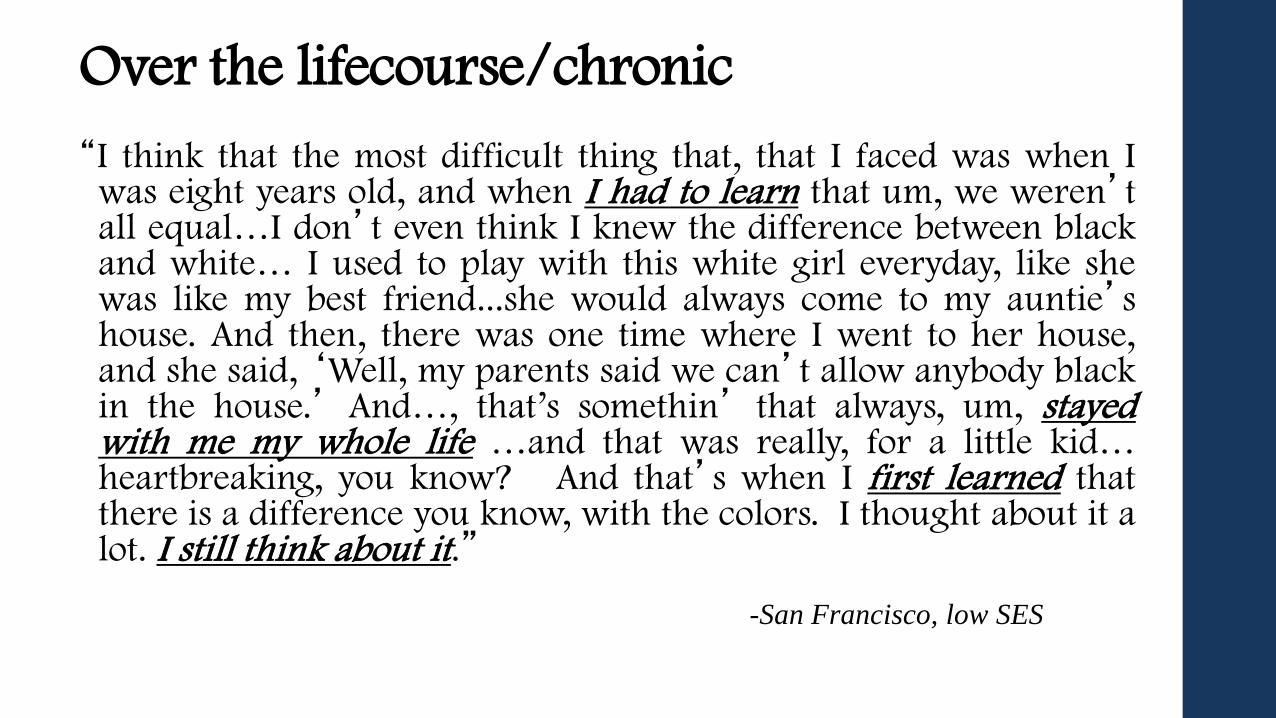
Over the lifecourse/chronic
“I think that the most difficult thing that, that I faced was when Iwas eight years old, and when I had to learn that um, we weren’tall equal…I don’t even think I knew the difference between blackand white… I used to play with this white girl everyday, like shewas like my best friend...she would always come to my auntie’shouse. And then, there was one time where I went to her house,and she said, ‘Well, my parents said we can’t allow anybody blackin the house.’ And…, that’s somethin’ that always, um, stayedwith me my whole life …and that was really, for a little kid…heartbreaking, you know? And that’s when I first learned thatthere is a difference you know, with the colors. I thought about it alot. I still think about it.”
-San Francisco, low SES
Concern for children/micro-aggressions/ ignore/self-neglect
“I’m stressed because now that my kids are getting older…they go
through it all the time... I take that in internally. It’s subtle, it’s
not out in the open like slavery days, it’s like hidden, but you feel
it still…as adults it seems like I could overlook it…But you have
kids coming home everyday, oh he called me a nigger or black.
That affects you as a parent ... I go through the hurt when they gothrough the hurt.”
- Sacramento, high SES
Anticipatory vigilance/Emotion suppression
“it’s like you get tense. Because you know…I know this person isgoing to say something that’s going to make me, my heart rate [goup], or maybe have to hold back my tears while I’m talking tothem. I don’t want them seeing me crying, cause I don’t wantthem thinking I’m sad, I’m not sad, I’m mad… you just get tense,cause you know you have to brace yourself for something stupidthat they’re gonna say… with a White person, you know thatsome level of racism is going to hop out of their mouth…and soyou have to prepare your body for that.”
- Oakland, high SES
Suppression/acceptance/try harder
• “Realistically, it’s going to affect you…it does bother you, you just put it in a different place.”
- Berkeley, low SES
• “I think that when it happens to you so much that you not necessarily learn to accept it, but you learn to not trip off of it no more.”
- Oakland, low SES
• “You’ve just got to work harder I guess.” - Oakland, low SES
• “I don’t think I really think about it. I just know it’s the skin you’re in. It’s just another part of your life.”
- San Francisco, low SES
Impression management
• “To this day when I’m talking to people other than black I say ‘father’ instead of ‘fathers’”
- Berkeley, high SES
• “I prepare myself …it’s like I will take forever to find me something to wear because I feel I’m not going to be treated right when I go shopping…and I feel I shouldn’t have to do that, but I do that because I’m treated different.”
- Sacramento, high SES
Physical signs of stress
• “My heart starts beating fast.”- San Francisco, low SES
• “My stomach. My, like my baby. I know my baby is stressed out… My stomach is in a knot when I come over here.”
- San Francisco, low SES
• “I get a stomach ache, I’ve broken out.”- Oakland, high SES
Biopsychosocial Model of Racism Stress
Clark et al. 1999
African American Women’s Heart & Health Study
• Study Aim: examine the association
between chronic social stress and both
mental and physical health among
African American women in the SF bay
area.
• Stress framework
exposure → appraisal →response
• Mixed methods study
• How do Black women manage their
racism experiences?
Recruitment & study sample
• Community sample of 200 AA women ages 30-50, San Francisco Bay area