A Density Management Diagram for Even-Aged Sierra Nevada Mixed-Conifer Stands James N. Long and John D. Shaw We have developed a density management diagram (DMD) for even-aged mixed-conifer stands in the Sierra Nevada Mountains using forest inventory and analysis (FIA) data. Analysis plots were drawn from FIA plots in California, southern Oregon, and western Nevada which included those conifer species associated with the mixed-conifer forest type. A total of 204 plots met the selection criteria for analysis, which were for even-agedness and species composition. Even-agedness was characterized by a ratio between two calculations of stand density index. Species composition included admixtures of the species characterizing the Sierra Nevada mixed-conifer type with up to 80% of stand basal area contributed by ponderosa and Jeffrey pines. The DMD is unbiased with respect to species composition and therefore should be broadly applicable to the mixed-conifer type. The DMD is intended for use in even-aged stands, but may be used for uneven-aged management where a large-group selection system is used. Examples of density management regimes are illustrated, and guidelines for use are provided. Keywords: silviculture, maximum stand density index, stocking diagram, mixed species D ensity management diagrams (DMD) are simple graphical models of even-aged stand dynamics. A DMD is based on fundamental assumptions about the influence of density on important stand properties and processes including allometries, competition, site occupancy, and self-thinning ( Jack and Long 1996, Newton 1997, Farnden 2002). Details of formatting vary, but all of the DMDs include representation of absolute density (e.g., trees per acre), relative density, volume (stand or mean tree) and quadratic mean diameter. In contrast to stocking charts, DMDs include the important feature of representation of top heights so that when paired with appropriate site or top height growth curves, DMDs can be used to project future growth (Drew and Flewelling 1979, McCarter and Long 1986, Jack and Long 1996). DMDs are useful tools in developing, evaluating and displaying alternative density management regimes for objectives ranging from increasing resistance to bark beetle attack and protection forest func- tion, to maintaining habitat for birds, ungulates and forest carni- vores (Smith and Long 1987, Anhold et al. 1996, Sturtevant et al. 1998, Long and Shaw 2005, Shaw and Long 2007, Whitehead et al. 2007, Vacchiano et al. 2008). A number of DMDs have been pub- lished for species in western Canada and the western United States (Table 1). In addition to conforming to some approximation of even- agedness, conventional DMDs are built with data from, and are intended to be used with, essentially single-species stands. For ex- ample, a ponderosa pine DMD (Long and Shaw 2005) is intended for use with stands in which ponderosa pine represents at least 80% of total stand basal area. For many management situations, the single-species restriction is not a serious limitation; however, there are several forest cover types in the western United States that are explicitly mixed-species (Eyre 1980). An important example is the Sierra Nevada mixed-conifer type (Helms 1994). Species composi- tion of the type has been variously characterized, but stands typically include California white fir (Abies concolor var. lowiana (Gord.) Lemm.), ponderosa pine (Pinus ponderosa var. ponderosa Dougl.), sugar pine (Pinus lambertiana Dougl., incense-cedar (Calocedrus decurrens (Torr.) Florin), California black oak (Quercus kelloggii Newb.), and Douglas-fir (Pseudotsuga menziesii (Mirb.) Franco) (Eyre 1980). Jeffrey pine (Pinus jeffreyi Grev. & Balf.) can be an important component of stands at higher elevations and particularly on serpentine soils (Helms 1994). California red fir (Abies magnifica A. Murr.) can occur in stands at higher elevations (Eyre 1980). The Sierra Nevada mixed-conifer type, common at mid-elevations on east-facing slopes of the Coast Ranges and west-facing slopes in the Sierra Nevada, is the forest type in California with the largest area (Helms 1994). We describe the construction of a DMD for even-aged mixed- conifer stands in California, southern Oregon, and western Nevada. We examine whether differences in species composition within the broad mixed-conifer type might impact utility of the DMD. Use of the DMD is illustrated with several management examples. Development Database Because forests of the mixed-conifer type are compositionally and geographically diverse, we obtained data available in the US forest service forest inventory and analysis (FIA) surveys completed in Washington, Oregon, California and Nevada between 1989 and 2009 (n 9917). The FIA program defined a California mixed- conifer type (Arner et al. 2001), but we did not use this forest type as a selection criterion because it is restricted to a few counties in Manuscript received October 10, 2011; accepted May 21, 2012. http://dx.doi.org/10.5849/wjaf.11-036. James N. Long ([email protected]), Utah State University, Department of Forest, Range and Wildlife Sciences and Ecology Center, Logan, UT 84322-5215—Phone: (435) 797-2574. John D. Shaw ([email protected]), USDA Forest Service. This research was supported in part by the Utah Agricultural Experiment Station, Utah State University, Logan, Utah 84322-4810. Approved as journal paper no. 8330. Wanda Lindquist assisted with preparation of the figures. This article was written and prepared by a US Government employee on official time, and it is therefore in the public domain and not copyrightable. WEST. J. APPL.FOR. 27(4) 2012 187 ABSTRACT
Transcript
A Density Management Diagram for Even-AgedSierra Nevada Mixed-Conifer Stands
James N. Long and John D. Shaw
We have developed a density management diagram (DMD) for even-aged mixed-conifer stands in the Sierra Nevada Mountains using forest inventory andanalysis (FIA) data. Analysis plots were drawn from FIA plots in California, southern Oregon, and western Nevada which included those conifer species associatedwith the mixed-conifer forest type. A total of 204 plots met the selection criteria for analysis, which were for even-agedness and species composition.Even-agedness was characterized by a ratio between two calculations of stand density index. Species composition included admixtures of the species characterizingthe Sierra Nevada mixed-conifer type with up to 80% of stand basal area contributed by ponderosa and Jeffrey pines. The DMD is unbiased with respect tospecies composition and therefore should be broadly applicable to the mixed-conifer type. The DMD is intended for use in even-aged stands, but may be usedfor uneven-aged management where a large-group selection system is used. Examples of density management regimes are illustrated, and guidelines for useare provided.
Keywords: silviculture, maximum stand density index, stocking diagram, mixed species
Density management diagrams (DMD) are simple graphicalmodels of even-aged stand dynamics. A DMD is based onfundamental assumptions about the influence of density
on important stand properties and processes including allometries,competition, site occupancy, and self-thinning ( Jack and Long1996, Newton 1997, Farnden 2002). Details of formatting vary,but all of the DMDs include representation of absolute density(e.g., trees per acre), relative density, volume (stand or mean tree)and quadratic mean diameter. In contrast to stocking charts, DMDsinclude the important feature of representation of top heights sothat when paired with appropriate site or top height growth curves,DMDs can be used to project future growth (Drew and Flewelling1979, McCarter and Long 1986, Jack and Long 1996).
DMDs are useful tools in developing, evaluating and displayingalternative density management regimes for objectives ranging fromincreasing resistance to bark beetle attack and protection forest func-tion, to maintaining habitat for birds, ungulates and forest carni-vores (Smith and Long 1987, Anhold et al. 1996, Sturtevant et al.1998, Long and Shaw 2005, Shaw and Long 2007, Whitehead et al.2007, Vacchiano et al. 2008). A number of DMDs have been pub-lished for species in western Canada and the western United States(Table 1).
In addition to conforming to some approximation of even-agedness, conventional DMDs are built with data from, and areintended to be used with, essentially single-species stands. For ex-ample, a ponderosa pine DMD (Long and Shaw 2005) is intendedfor use with stands in which ponderosa pine represents at least 80%of total stand basal area. For many management situations, thesingle-species restriction is not a serious limitation; however, thereare several forest cover types in the western United States that areexplicitly mixed-species (Eyre 1980). An important example is the
Sierra Nevada mixed-conifer type (Helms 1994). Species composi-tion of the type has been variously characterized, but stands typicallyinclude California white fir (Abies concolor var. lowiana (Gord.)Lemm.), ponderosa pine (Pinus ponderosa var. ponderosa Dougl.),sugar pine (Pinus lambertiana Dougl., incense-cedar (Calocedrusdecurrens (Torr.) Florin), California black oak (Quercus kelloggiiNewb.), and Douglas-fir (Pseudotsuga menziesii (Mirb.) Franco)(Eyre 1980). Jeffrey pine (Pinus jeffreyi Grev. & Balf.) can be animportant component of stands at higher elevations and particularlyon serpentine soils (Helms 1994). California red fir (Abies magnificaA. Murr.) can occur in stands at higher elevations (Eyre 1980). TheSierra Nevada mixed-conifer type, common at mid-elevations oneast-facing slopes of the Coast Ranges and west-facing slopes in theSierra Nevada, is the forest type in California with the largest area(Helms 1994).
We describe the construction of a DMD for even-aged mixed-conifer stands in California, southern Oregon, and western Nevada.We examine whether differences in species composition within thebroad mixed-conifer type might impact utility of the DMD. Use ofthe DMD is illustrated with several management examples.
Development
DatabaseBecause forests of the mixed-conifer type are compositionally
and geographically diverse, we obtained data available in the USforest service forest inventory and analysis (FIA) surveys completedin Washington, Oregon, California and Nevada between 1989 and2009 (n � 9917). The FIA program defined a California mixed-conifer type (Arner et al. 2001), but we did not use this forest type asa selection criterion because it is restricted to a few counties in
Manuscript received October 10, 2011; accepted May 21, 2012. http://dx.doi.org/10.5849/wjaf.11-036.
James N. Long ([email protected]), Utah State University, Department of Forest, Range and Wildlife Sciences and Ecology Center, Logan, UT 84322-5215—Phone: (435)797-2574. John D. Shaw ([email protected]), USDA Forest Service. This research was supported in part by the Utah Agricultural Experiment Station, Utah State University, Logan,Utah 84322-4810. Approved as journal paper no. 8330. Wanda Lindquist assisted with preparation of the figures.
This article was written and prepared by a US Government employee on official time, and it is therefore in the public domain and not copyrightable.
WEST. J. APPL. FOR. 27(4) 2012 187
AB
ST
RA
CT
California and thus too restrictive for the purposes of diagram con-struction and field application. Instead, we selected plots that in-cluded combinations of the species characteristic of the Sierranmixed-conifer types (Franklin and Halpern 2000, Barbour andMinnich 2000): California red fir, white fir, Douglas-fir, ponderosapine, Jeffrey pine, sugar pine, incense-cedar, and California blackoak.
The FIA database included separate tables for trees, plots, andconditions. FIA plots can sample one or more conditions, whereeach condition was identified as a relatively homogeneous portion ofa plot based on stand size class, composition, or other criteria—i.e.,an FIA condition was approximately equivalent to a stand. Variablessuch as forest type, stand size class, and productivity class wereassigned to the condition and not the plot. Condition proportionwas recorded for each condition, based on the fraction of the plotfootprint occupied. Plot-level data included mostly site characteris-tics, such as latitude, longitude, slope, aspect, elevation, and eco-region. For each tree � 1.0 in dbh we obtained the following vari-ables from the FIA database: state, county, plot number, species,diameter, height, trees per acre (expansion factor), and individualtree cubic-foot volume. FIA data included volume on a per tree basiscalculated using local volume equations (Miles et al. 2001). Wecalculated total number of trees, cubic-foot volume, and basal areaon a per acre basis for each species represented in the stand, andcomputed basal area percentage of each of the species indicative ofthe forest type. Stand top height was defined as the mean height ofthe 40 tallest trees per acre found on each subplot in the FIA plot(HTAvg). This method of estimating stand top height gave compa-rable results to more complicated approaches—e.g., determiningthe mean height of the 40 tallest trees acre—and eliminated thepossibility that stand top height could be heavily influenced by aclump of tall trees on a single subplot. Stand density index (SDI;Reineke 1933) was calculated using the quadratic mean diameterand summation methods (SDIDq in Equation (1) and SDIsum inEquation (2)).
SDIDq � �Dq
10�1.6
� TPA (1)
where SDI is stand density index, Dq is quadratic mean diameter ininches at breast height, and TPA is the number of trees per acre.
SDIsum � ��TPAj � �Dj
10�1.6�
where Dj is the diameter (in inches) of the jth tree in the sample, andTPAj is the number of trees represented by the jth tree.
The two methods have been shown to produce values of SDI thatare essentially equal for even-aged stands, but increasingly divergentwith increasing skewness of the diameter distribution (Long andDaniel 1990, Shaw 2000, Ducey 2009, Curtis 2010). Ducey andLarson (2003) quantified the relationship between SDIsum andSDIDq using a Weibull model and showed that the ratio of the two
values approached 1 for stands that were even-aged (i.e., diameterdistribution weighted heavily about the mean diameter). Therefore,we calculated the ratio of SDIsum:SDIDq for the purpose of separat-ing relatively even-aged stands from stands with more complexstructures. SDI ratio fell below 0.94 for stands with bimodal diam-eter distributions, with lower values found in stands where themodes were more widely separated. For example, a stand with a
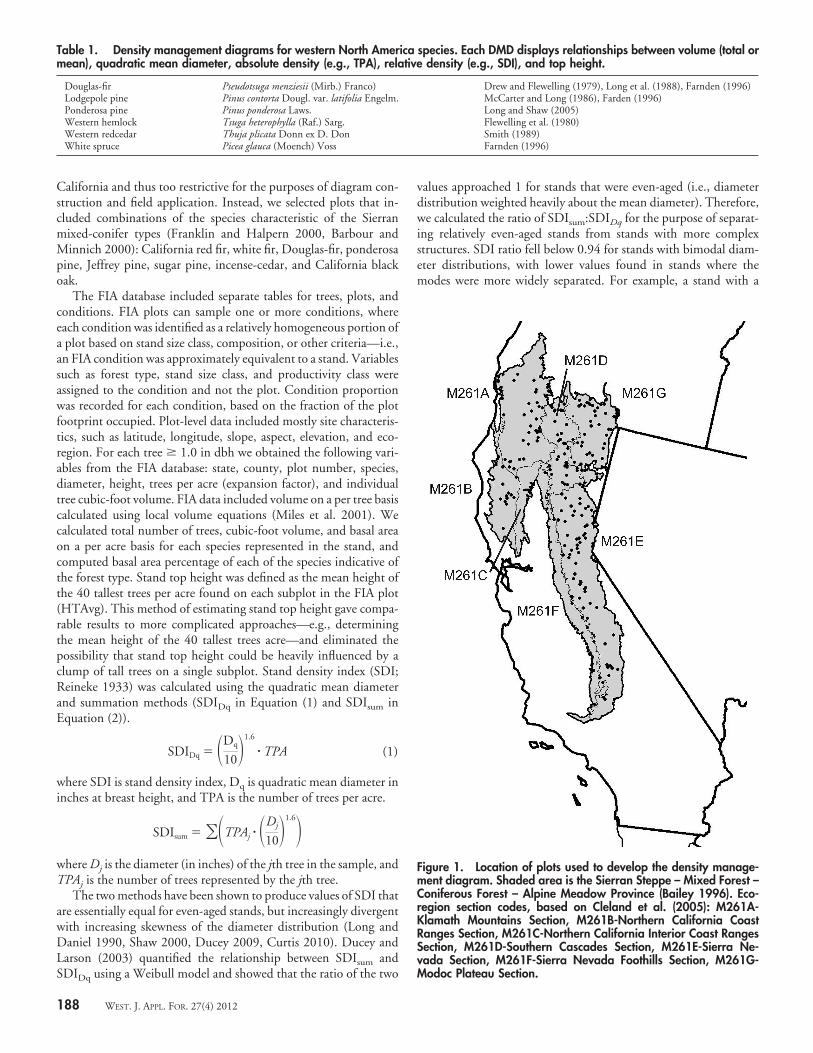
Figure 1. Location of plots used to develop the density manage-ment diagram. Shaded area is the Sierran Steppe – Mixed Forest –Coniferous Forest – Alpine Meadow Province (Bailey 1996). Eco-region section codes, based on Cleland et al. (2005): M261A-Klamath Mountains Section, M261B-Northern California CoastRanges Section, M261C-Northern California Interior Coast RangesSection, M261D-Southern Cascades Section, M261E-Sierra Ne-vada Section, M261F-Sierra Nevada Foothills Section, M261G-Modoc Plateau Section.
Table 1. Density management diagrams for western North America species. Each DMD displays relationships between volume (total ormean), quadratic mean diameter, absolute density (e.g., TPA), relative density (e.g., SDI), and top height.
Douglas-fir Pseudotsuga menziesii (Mirb.) Franco) Drew and Flewelling (1979), Long et al. (1988), Farnden (1996)Lodgepole pine Pinus contorta Dougl. var. latifolia Engelm. McCarter and Long (1986), Farden (1996)Ponderosa pine Pinus ponderosa Laws. Long and Shaw (2005)Western hemlock Tsuga heterophylla (Raf.) Sarg. Flewelling et al. (1980)Western redcedar Thuja plicata Donn ex D. Don Smith (1989)White spruce Picea glauca (Moench) Voss Farnden (1996)
188 WEST. J. APPL. FOR. 27(4) 2012
large-tree component averaging 22 inches and a small-tree compo-nent averaging 5 inches would have an SDI ratio of about 0.86(Ducey 2009).
Because some of the characteristic species have broad ranges andform mixtures outside our compositional range of interest (e.g.,Douglas-fir-dominant mixtures that do not include others of thecharacteristic species noted above), we initially filtered plots in thefour-state area according to the following criteria: the presence ofeither ponderosa or Jeffrey pine with any of the other species notedabove. As a result of selecting plots based on composition ratherthan strict geographic boundaries, the California mixed-conifertype was found to occur over a broader area than the name implies—approximately coinciding with the extent of the Sierran Steppe –Mixed Forest – Coniferous Forest – Alpine Meadow Province de-scribed by Bailey (1996) and most recently revised by Cleland et al.(2005) (Figure 1). Only plots from this province were considered forfurther analysis.
The data were filtered to eliminate plots with: (1) fewer than 25trees per acre because relatively few (�5) trees were measured onthese plots, (2) a condition proportion � 0.75, to eliminate smallsampling areas, (3) quadratic mean diameters � 2.0 inches, and(4) the ratio of SDIsum:SDIDq � 0.94. Using a minimum conditionproportion of 0.75 ensured that only one condition could be usedfrom each plot, so the term “plot” will be used hereafter, even whenit does not refer to the entire FIA plot. The selection of 0.94 as acutoff for SDI ratio represented an approach for retaining even-agedof stands in the sample. It is noteworthy that this cutoff also resultedin the elimination of stratified mixtures, even those that were even-aged. There was no filtering with respect to previous disturbances.
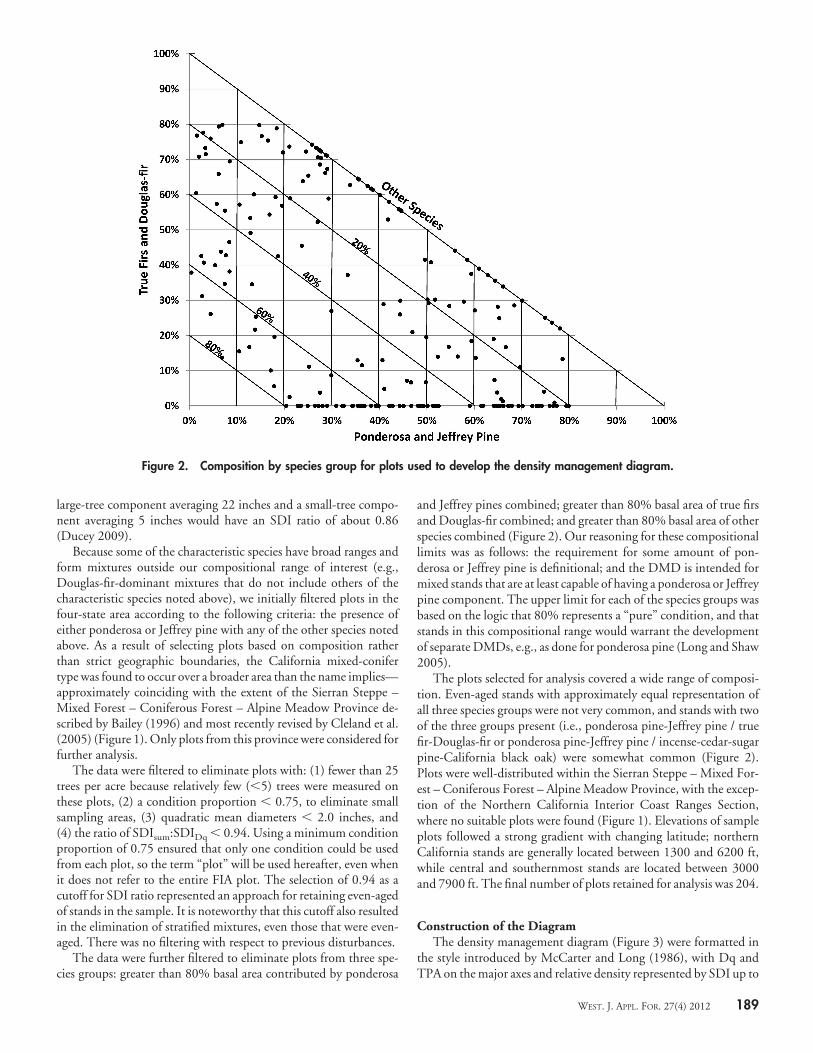
The data were further filtered to eliminate plots from three spe-cies groups: greater than 80% basal area contributed by ponderosa
and Jeffrey pines combined; greater than 80% basal area of true firsand Douglas-fir combined; and greater than 80% basal area of otherspecies combined (Figure 2). Our reasoning for these compositionallimits was as follows: the requirement for some amount of pon-derosa or Jeffrey pine is definitional; and the DMD is intended formixed stands that are at least capable of having a ponderosa or Jeffreypine component. The upper limit for each of the species groups wasbased on the logic that 80% represents a “pure” condition, and thatstands in this compositional range would warrant the developmentof separate DMDs, e.g., as done for ponderosa pine (Long and Shaw2005).
The plots selected for analysis covered a wide range of composi-tion. Even-aged stands with approximately equal representation ofall three species groups were not very common, and stands with twoof the three groups present (i.e., ponderosa pine-Jeffrey pine / truefir-Douglas-fir or ponderosa pine-Jeffrey pine / incense-cedar-sugarpine-California black oak) were somewhat common (Figure 2).Plots were well-distributed within the Sierran Steppe – Mixed For-est – Coniferous Forest – Alpine Meadow Province, with the excep-tion of the Northern California Interior Coast Ranges Section,where no suitable plots were found (Figure 1). Elevations of sampleplots followed a strong gradient with changing latitude; northernCalifornia stands are generally located between 1300 and 6200 ft,while central and southernmost stands are located between 3000and 7900 ft. The final number of plots retained for analysis was 204.
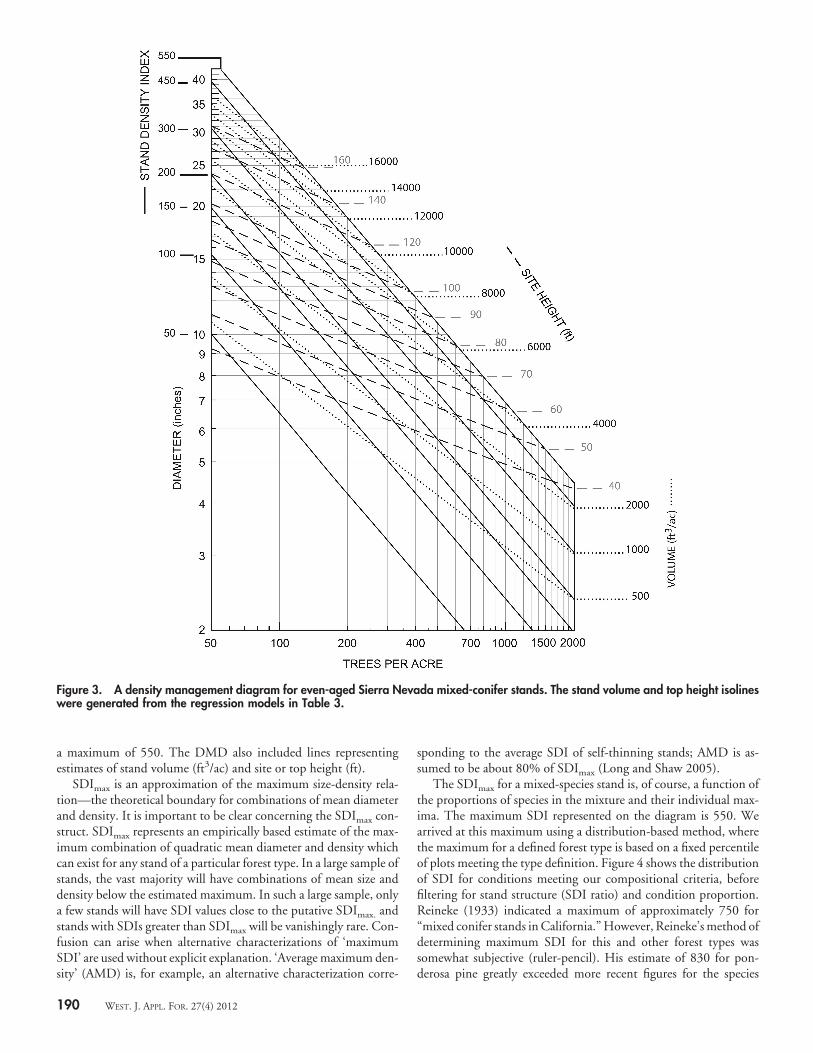
Construction of the DiagramThe density management diagram (Figure 3) were formatted in
the style introduced by McCarter and Long (1986), with Dq andTPA on the major axes and relative density represented by SDI up to
Figure 2. Composition by species group for plots used to develop the density management diagram.
WEST. J. APPL. FOR. 27(4) 2012 189
a maximum of 550. The DMD also included lines representingestimates of stand volume (ft3/ac) and site or top height (ft).
SDImax is an approximation of the maximum size-density rela-tion—the theoretical boundary for combinations of mean diameterand density. It is important to be clear concerning the SDImax con-struct. SDImax represents an empirically based estimate of the max-imum combination of quadratic mean diameter and density whichcan exist for any stand of a particular forest type. In a large sample ofstands, the vast majority will have combinations of mean size anddensity below the estimated maximum. In such a large sample, onlya few stands will have SDI values close to the putative SDImax. andstands with SDIs greater than SDImax will be vanishingly rare. Con-fusion can arise when alternative characterizations of ‘maximumSDI’ are used without explicit explanation. ‘Average maximum den-sity’ (AMD) is, for example, an alternative characterization corre-
sponding to the average SDI of self-thinning stands; AMD is as-sumed to be about 80% of SDImax (Long and Shaw 2005).
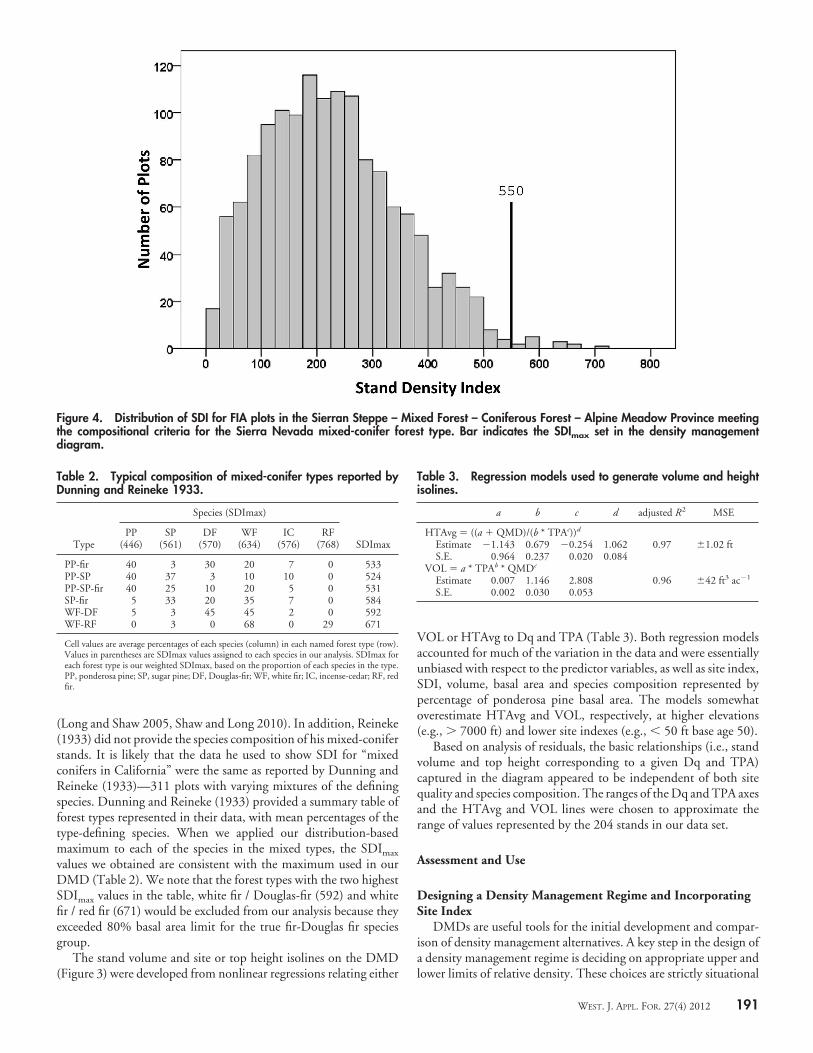
The SDImax for a mixed-species stand is, of course, a function ofthe proportions of species in the mixture and their individual max-ima. The maximum SDI represented on the diagram is 550. Wearrived at this maximum using a distribution-based method, wherethe maximum for a defined forest type is based on a fixed percentileof plots meeting the type definition. Figure 4 shows the distributionof SDI for conditions meeting our compositional criteria, beforefiltering for stand structure (SDI ratio) and condition proportion.Reineke (1933) indicated a maximum of approximately 750 for“mixed conifer stands in California.” However, Reineke’s method ofdetermining maximum SDI for this and other forest types wassomewhat subjective (ruler-pencil). His estimate of 830 for pon-derosa pine greatly exceeded more recent figures for the species
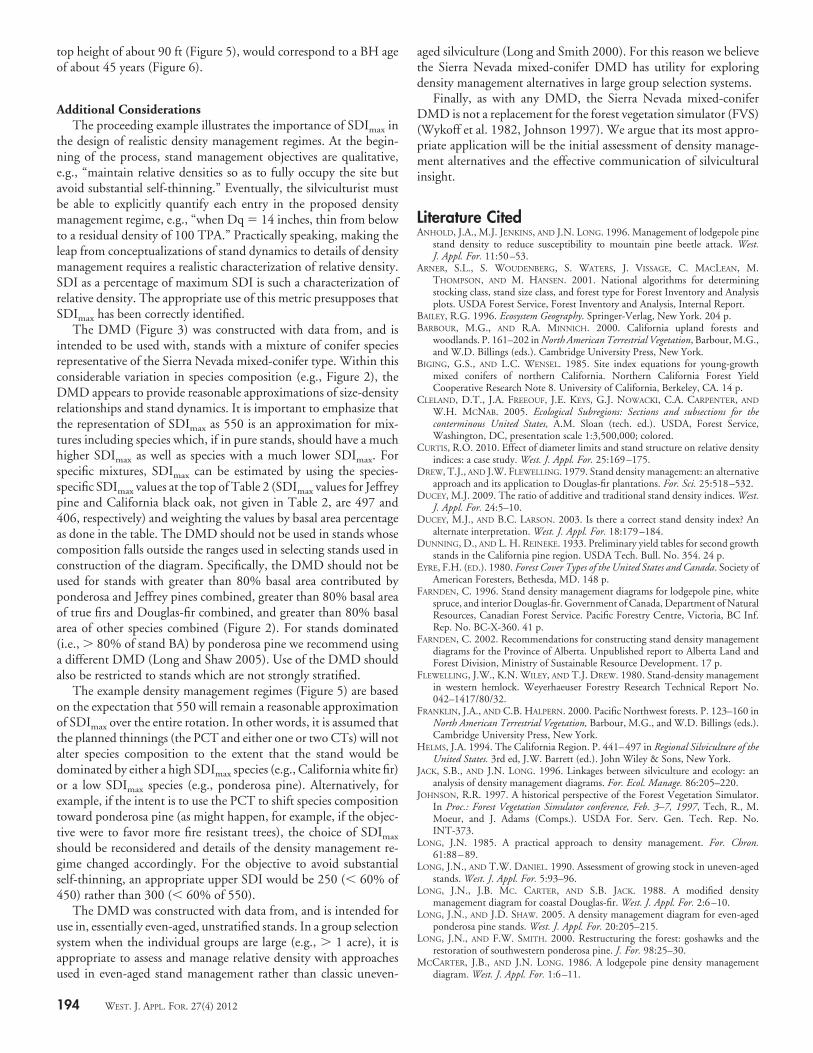
Figure 3. A density management diagram for even-aged Sierra Nevada mixed-conifer stands. The stand volume and top height isolineswere generated from the regression models in Table 3.
190 WEST. J. APPL. FOR. 27(4) 2012
(Long and Shaw 2005, Shaw and Long 2010). In addition, Reineke(1933) did not provide the species composition of his mixed-coniferstands. It is likely that the data he used to show SDI for “mixedconifers in California” were the same as reported by Dunning andReineke (1933)—311 plots with varying mixtures of the definingspecies. Dunning and Reineke (1933) provided a summary table offorest types represented in their data, with mean percentages of thetype-defining species. When we applied our distribution-basedmaximum to each of the species in the mixed types, the SDImax
values we obtained are consistent with the maximum used in ourDMD (Table 2). We note that the forest types with the two highestSDImax values in the table, white fir / Douglas-fir (592) and whitefir / red fir (671) would be excluded from our analysis because theyexceeded 80% basal area limit for the true fir-Douglas fir speciesgroup.
The stand volume and site or top height isolines on the DMD(Figure 3) were developed from nonlinear regressions relating either
VOL or HTAvg to Dq and TPA (Table 3). Both regression modelsaccounted for much of the variation in the data and were essentiallyunbiased with respect to the predictor variables, as well as site index,SDI, volume, basal area and species composition represented bypercentage of ponderosa pine basal area. The models somewhatoverestimate HTAvg and VOL, respectively, at higher elevations(e.g., � 7000 ft) and lower site indexes (e.g., � 50 ft base age 50).
Based on analysis of residuals, the basic relationships (i.e., standvolume and top height corresponding to a given Dq and TPA)captured in the diagram appeared to be independent of both sitequality and species composition. The ranges of the Dq and TPA axesand the HTAvg and VOL lines were chosen to approximate therange of values represented by the 204 stands in our data set.
Assessment and Use
Designing a Density Management Regime and IncorporatingSite Index
DMDs are useful tools for the initial development and compar-ison of density management alternatives. A key step in the design ofa density management regime is deciding on appropriate upper andlower limits of relative density. These choices are strictly situational
Figure 4. Distribution of SDI for FIA plots in the Sierran Steppe – Mixed Forest – Coniferous Forest – Alpine Meadow Province meetingthe compositional criteria for the Sierra Nevada mixed-conifer forest type. Bar indicates the SDImax set in the density managementdiagram.
Table 2. Typical composition of mixed-conifer types reported byDunning and Reineke 1933.
Cell values are average percentages of each species (column) in each named forest type (row).Values in parentheses are SDImax values assigned to each species in our analysis. SDImax foreach forest type is our weighted SDImax, based on the proportion of each species in the type.PP, ponderosa pine; SP, sugar pine; DF, Douglas-fir; WF, white fir; IC, incense-cedar; RF, redfir.
Table 3. Regression models used to generate volume and heightisolines.
and must be made in the context of stand-specific managementobjectives (Long 1985). For example, an objective to avoid substan-tial density-related mortality (self-thinning) would imply an upperlimit less than � 60% SDImax, and avoiding what Drew and Flewel-ling (1979) characterized as the zone of imminent competition-mortality. A lower limit of at least 35% of SDImax would ensure fullsite occupancy and might be associated with an objective involvingmaximizing volume production.
We provide a simple, hypothetical example to illustrate use of theSierra Nevada mixed-conifer DMD and to motivate further consid-eration of SDImax. In this example, we are exploring alternativedensity management regimes for a naturally regenerated mixed-conifer stand which currently has about 1500 saplings per acre. Weare considering an immediate precommercial thinning (PCT), but,of course, we wish to consider long- as well as short-term alterna-tives. For this hypothetical stand our general management objectives
include avoiding substantial self-thinning, maintaining reasonablyfull site occupancy and an end-of-rotation (EOR) Dq of 20 inches.We also assume we have the option of considering commercial thin-ning (CT) as long as the before-thinning Dq is at least 10 inches andat least 1000 ft3/ac are removed.
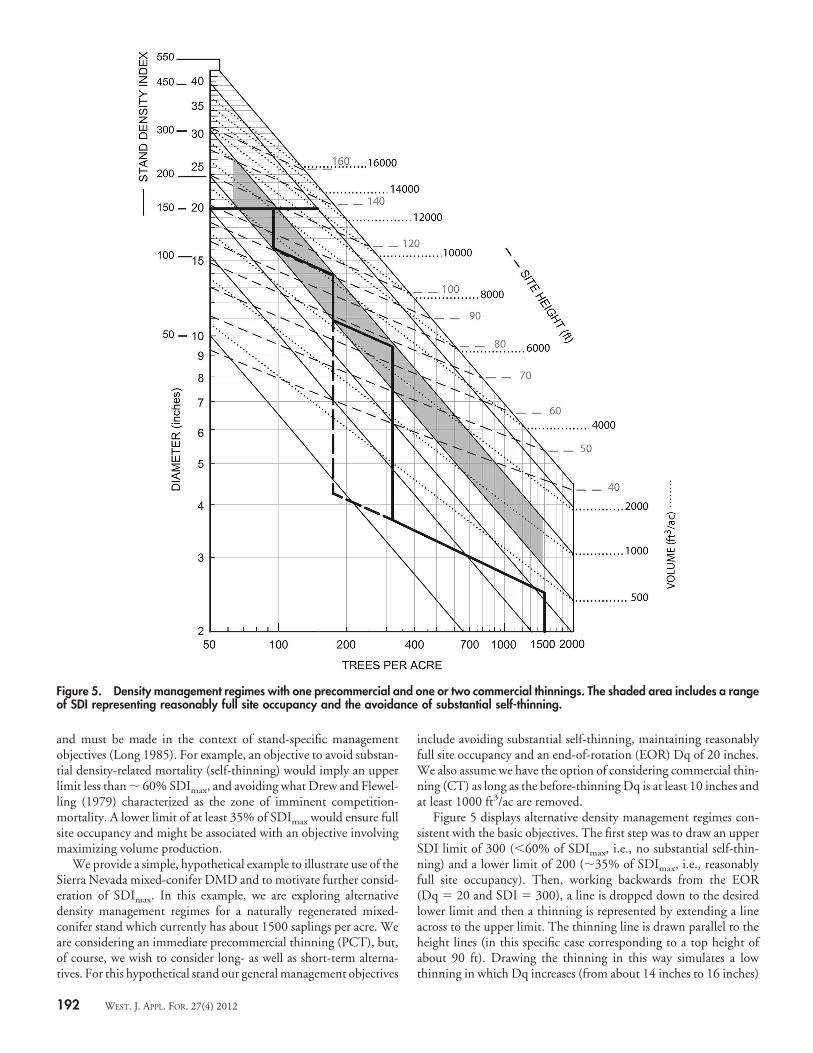
Figure 5 displays alternative density management regimes con-sistent with the basic objectives. The first step was to draw an upperSDI limit of 300 (�60% of SDImax, i.e., no substantial self-thin-ning) and a lower limit of 200 (�35% of SDImax, i.e., reasonablyfull site occupancy). Then, working backwards from the EOR(Dq � 20 and SDI � 300), a line is dropped down to the desiredlower limit and then a thinning is represented by extending a lineacross to the upper limit. The thinning line is drawn parallel to theheight lines (in this specific case corresponding to a top height ofabout 90 ft). Drawing the thinning in this way simulates a lowthinning in which Dq increases (from about 14 inches to 16 inches)
Figure 5. Density management regimes with one precommercial and one or two commercial thinnings. The shaded area includes a rangeof SDI representing reasonably full site occupancy and the avoidance of substantial self-thinning.
192 WEST. J. APPL. FOR. 27(4) 2012
as a result of removing nearly 80, generally smaller than average,trees per acre. A basic assumption is that these relationships areindependent of site quality and changes following thinning are fairlyminor and short-lived ( Jack and Long 1996). The estimated vol-ume removed, about 1000 ft3/ac, is the difference between volumebefore and volume after thinning. Therefore, both the size andvolume criteria for a CT appear to be met.
Continuing in this way results in the display of another potentialCT. The estimated volume removed (�800 ft3/ac) and the smallpiece size may make this CT problematic. We could use the PCT toreduce stand density to about 310 TPA so as to setup this first of twoputative CTs. A more attractive alternative is to forego the marginalCT and use the PCT to reduce stand density to about 170 TPA so asto setup a CT when Dq is about 14 inches. A potential advantage ofthe two CT alternative is a modest increase in yield (i.e., 800 ft3/ac
removed in the first CT). A very serious potential disadvantage ofthis alternative is that when the stand achieves a Dq of 9.5 inches,this putative first CT may not be economically viable. The smallvolume to be removed and the small piece size might make harvestand handling costs prohibitive. Absent the option of a CT, thesilviculturist would be left with two equally undesirable choices forthe stand—conduct a second PCT or allow the stand to self-thin itsway to a mean size sufficient to justify a CT.
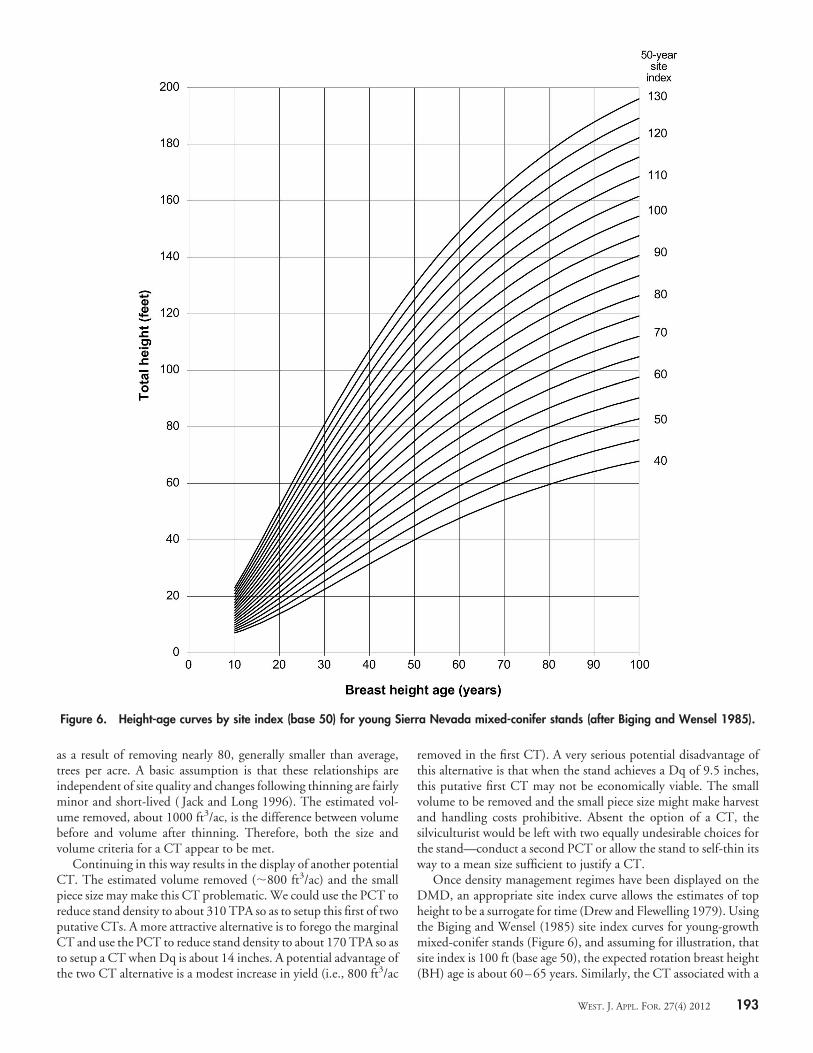
Once density management regimes have been displayed on theDMD, an appropriate site index curve allows the estimates of topheight to be a surrogate for time (Drew and Flewelling 1979). Usingthe Biging and Wensel (1985) site index curves for young-growthmixed-conifer stands (Figure 6), and assuming for illustration, thatsite index is 100 ft (base age 50), the expected rotation breast height(BH) age is about 60–65 years. Similarly, the CT associated with a
Figure 6. Height-age curves by site index (base 50) for young Sierra Nevada mixed-conifer stands (after Biging and Wensel 1985).
WEST. J. APPL. FOR. 27(4) 2012 193
top height of about 90 ft (Figure 5), would correspond to a BH ageof about 45 years (Figure 6).
Additional ConsiderationsThe proceeding example illustrates the importance of SDImax in
the design of realistic density management regimes. At the begin-ning of the process, stand management objectives are qualitative,e.g., “maintain relative densities so as to fully occupy the site butavoid substantial self-thinning.” Eventually, the silviculturist mustbe able to explicitly quantify each entry in the proposed densitymanagement regime, e.g., “when Dq � 14 inches, thin from belowto a residual density of 100 TPA.” Practically speaking, making theleap from conceptualizations of stand dynamics to details of densitymanagement requires a realistic characterization of relative density.SDI as a percentage of maximum SDI is such a characterization ofrelative density. The appropriate use of this metric presupposes thatSDImax has been correctly identified.
The DMD (Figure 3) was constructed with data from, and isintended to be used with, stands with a mixture of conifer speciesrepresentative of the Sierra Nevada mixed-conifer type. Within thisconsiderable variation in species composition (e.g., Figure 2), theDMD appears to provide reasonable approximations of size-densityrelationships and stand dynamics. It is important to emphasize thatthe representation of SDImax as 550 is an approximation for mix-tures including species which, if in pure stands, should have a muchhigher SDImax as well as species with a much lower SDImax. Forspecific mixtures, SDImax can be estimated by using the species-specific SDImax values at the top of Table 2 (SDImax values for Jeffreypine and California black oak, not given in Table 2, are 497 and406, respectively) and weighting the values by basal area percentageas done in the table. The DMD should not be used in stands whosecomposition falls outside the ranges used in selecting stands used inconstruction of the diagram. Specifically, the DMD should not beused for stands with greater than 80% basal area contributed byponderosa and Jeffrey pines combined, greater than 80% basal areaof true firs and Douglas-fir combined, and greater than 80% basalarea of other species combined (Figure 2). For stands dominated(i.e., � 80% of stand BA) by ponderosa pine we recommend usinga different DMD (Long and Shaw 2005). Use of the DMD shouldalso be restricted to stands which are not strongly stratified.
The example density management regimes (Figure 5) are basedon the expectation that 550 will remain a reasonable approximationof SDImax over the entire rotation. In other words, it is assumed thatthe planned thinnings (the PCT and either one or two CTs) will notalter species composition to the extent that the stand would bedominated by either a high SDImax species (e.g., California white fir)or a low SDImax species (e.g., ponderosa pine). Alternatively, forexample, if the intent is to use the PCT to shift species compositiontoward ponderosa pine (as might happen, for example, if the objec-tive were to favor more fire resistant trees), the choice of SDImax
should be reconsidered and details of the density management re-gime changed accordingly. For the objective to avoid substantialself-thinning, an appropriate upper SDI would be 250 (� 60% of450) rather than 300 (� 60% of 550).
The DMD was constructed with data from, and is intended foruse in, essentially even-aged, unstratified stands. In a group selectionsystem when the individual groups are large (e.g., � 1 acre), it isappropriate to assess and manage relative density with approachesused in even-aged stand management rather than classic uneven-
aged silviculture (Long and Smith 2000). For this reason we believethe Sierra Nevada mixed-conifer DMD has utility for exploringdensity management alternatives in large group selection systems.
Finally, as with any DMD, the Sierra Nevada mixed-coniferDMD is not a replacement for the forest vegetation simulator (FVS)(Wykoff et al. 1982, Johnson 1997). We argue that its most appro-priate application will be the initial assessment of density manage-ment alternatives and the effective communication of silviculturalinsight.
Literature CitedANHOLD, J.A., M.J. JENKINS, AND J.N. LONG. 1996. Management of lodgepole pine
stand density to reduce susceptibility to mountain pine beetle attack. West.J. Appl. For. 11:50–53.
ARNER, S.L., S. WOUDENBERG, S. WATERS, J. VISSAGE, C. MACLEAN, M.THOMPSON, AND M. HANSEN. 2001. National algorithms for determiningstocking class, stand size class, and forest type for Forest Inventory and Analysisplots. USDA Forest Service, Forest Inventory and Analysis, Internal Report.
BAILEY, R.G. 1996. Ecosystem Geography. Springer-Verlag, New York. 204 p.BARBOUR, M.G., AND R.A. MINNICH. 2000. California upland forests and
woodlands. P. 161–202 in North American Terrestrial Vegetation, Barbour, M.G.,and W.D. Billings (eds.). Cambridge University Press, New York.
BIGING, G.S., AND L.C. WENSEL. 1985. Site index equations for young-growthmixed conifers of northern California. Northern California Forest YieldCooperative Research Note 8. University of California, Berkeley, CA. 14 p.
CLELAND, D.T., J.A. FREEOUF, J.E. KEYS, G.J. NOWACKI, C.A. CARPENTER, AND
W.H. MCNAB. 2005. Ecological Subregions: Sections and subsections for theconterminous United States, A.M. Sloan (tech. ed.). USDA, Forest Service,Washington, DC, presentation scale 1:3,500,000; colored.
CURTIS, R.O. 2010. Effect of diameter limits and stand structure on relative densityindices: a case study. West. J. Appl. For. 25:169–175.
DREW, T.J., AND J.W. FLEWELLING. 1979. Stand density management: an alternativeapproach and its application to Douglas-fir plantations. For. Sci. 25:518–532.
DUCEY, M.J. 2009. The ratio of additive and traditional stand density indices. West.J. Appl. For. 24:5–10.
DUCEY, M.J., AND B.C. LARSON. 2003. Is there a correct stand density index? Analternate interpretation. West. J. Appl. For. 18:179–184.
DUNNING, D., AND L. H. REINEKE. 1933. Preliminary yield tables for second growthstands in the California pine region. USDA Tech. Bull. No. 354. 24 p.
EYRE, F.H. (ED.). 1980. Forest Cover Types of the United States and Canada. Society ofAmerican Foresters, Bethesda, MD. 148 p.
FARNDEN, C. 1996. Stand density management diagrams for lodgepole pine, whitespruce, and interior Douglas-fir. Government of Canada, Department of NaturalResources, Canadian Forest Service. Pacific Forestry Centre, Victoria, BC Inf.Rep. No. BC-X-360. 41 p.
FARNDEN, C. 2002. Recommendations for constructing stand density managementdiagrams for the Province of Alberta. Unpublished report to Alberta Land andForest Division, Ministry of Sustainable Resource Development. 17 p.
FLEWELLING, J.W., K.N. WILEY, AND T.J. DREW. 1980. Stand-density managementin western hemlock. Weyerhaeuser Forestry Research Technical Report No.042–1417/80/32.
FRANKLIN, J.A., AND C.B. HALPERN. 2000. Pacific Northwest forests. P. 123–160 inNorth American Terrestrial Vegetation, Barbour, M.G., and W.D. Billings (eds.).Cambridge University Press, New York.
HELMS, J.A. 1994. The California Region. P. 441–497 in Regional Silviculture of theUnited States. 3rd ed, J.W. Barrett (ed.). John Wiley & Sons, New York.
JACK, S.B., AND J.N. LONG. 1996. Linkages between silviculture and ecology: ananalysis of density management diagrams. For. Ecol. Manage. 86:205–220.
JOHNSON, R.R. 1997. A historical perspective of the Forest Vegetation Simulator.In Proc.: Forest Vegetation Simulator conference, Feb. 3–7, 1997, Tech, R., M.Moeur, and J. Adams (Comps.). USDA For. Serv. Gen. Tech. Rep. No.INT-373.
LONG, J.N. 1985. A practical approach to density management. For. Chron.61:88–89.
LONG, J.N., AND T.W. DANIEL. 1990. Assessment of growing stock in uneven-agedstands. West. J. Appl. For. 5:93–96.
LONG, J.N., J.B. MC. CARTER, AND S.B. JACK. 1988. A modified densitymanagement diagram for coastal Douglas-fir. West. J. Appl. For. 2:6–10.
LONG, J.N., AND J.D. SHAW. 2005. A density management diagram for even-agedponderosa pine stands. West. J. Appl. For. 20:205–215.
LONG, J.N., AND F.W. SMITH. 2000. Restructuring the forest: goshawks and therestoration of southwestern ponderosa pine. J. For. 98:25–30.
MCCARTER, J.B., AND J.N. LONG. 1986. A lodgepole pine density managementdiagram. West. J. Appl. For. 1:6–11.
194 WEST. J. APPL. FOR. 27(4) 2012
MILES, P.D., G.J. BRAND., C.L. ALERICH, L.F. BEDNAR, S.W. WOUDENBERG, J.F.GLOVER AND E.N. EZZELL. 2001. The forest inventory and analysis database:database description and users manual version 1.0. USDA For. Serv. Gen. Tech.Rep. No. NC-218. 130 p.
NEWTON, P.F. 1997. Stand density management diagrams: Review of theirdevelopment and utility in stand-level management planning. For. Ecol. Manage.98:251–265.
REINEKE, L.H. 1933. Perfecting a stand-density index for even-aged forests. J. Agric.Res. 46:627–638.
SHAW, J.D. 2000. Application of stand density index to irregularly structured stands.West. J. Appl. For. 15:40–42.
SHAW, J.D., AND J.N. LONG. 2007. A density management diagram for longleaf pinestands with application to red-cockaded woodpecker habitat. South. J. Appl. For.31:28–38.
SHAW, J.D., AND J.N. LONG. 2010. Consistent definition and application ofReineke’s Stand Density Index in silviculture and stand projection. P. 199–209in Integrated management of carbon sequestration and biomass utilizationopportunities in a changing climate: Proc. of the 2009 National SilvicultureWorkshop, 2009 June 15–18, Boise, ID. Proceedings RMRS-P-61. Jain, T.B,
R.T. Graham, J. Sandquist (eds.). U.S. Department of Agriculture, ForestService, Rocky Mountain Research Station, Fort Collins, CO.
SMITH, N.J. 1989. A stand-density control diagram for western red cedar, Thujaplicata. For. Ecol. Manage. 27:235–244.
SMITH, F.W., AND J.N. LONG. 1987. Elk hiding and thermal cover guidelines in thecontext of lodgepole pine stand density. West. J. Appl. For. 2:6–10.
STURTEVANT, B.R., J.A. BISSONETTE, AND J.N. LONG. 1998. Stand densitymanagement diagram for mixed balsam fir-black Spruce stands. North. J. Appl.For. 15:17–22.
VACCHIANO, G., R. MOTTA, J.N. LONG, AND J.D. SHAW. 2008. A densitymanagement diagram for Scots pine (Pinus sylvestris L): a tool for assessing theforest’s protective effect. For. Ecol. Manage. 255:2542–2554.
WHITEHEAD, R.J., L. SAFRANYIK AND T.L. SHORE. 2007. Preventive management.P. 173–192 in The Mountain Pine Beetle: A Synthesis of Biology, Management andImpacts on Lodgepole Pine, Safranyik, L. and B. Wilson (eds.). Natural ResourcesCanada, Canadian Forest Service, Pacific Forestry Centre, Victoria, BritishColumbia. 299 p.
WYKOFF, W.R., N.L. CROOKSTON AND A.R. STAGE. 1982. User’s guide to the StandPrognosis Model. USDA For. Serv. Gen. Tech. Rep. No. INT-133. 112 p.