research papers J. Synchrotron Rad. (2020). 27 https://doi.org/10.1107/S1600577520004440 1 of 13 Received 10 February 2020 Accepted 31 March 2020 Edited by K. Kvashnina, ESRF – The European Synchrotron, France Keywords: Wolter type 1 mirrors; soft X-ray spectrometer; resonant inelastic X-ray scattering spectroscopy. A design of resonant inelastic X-ray scattering (RIXS) spectrometer for spatial- and time-resolved spectroscopy Yi-De Chuang,* Xuefei Feng, Per-Anders Glans-Suzuki, Wanli Yang, Howard Padmore and Jinghua Guo* Advanced Light Source, Lawrence Berkeley National Laboratory, 1 Cyclotron Road, MS 6-2100, Berkeley, CA 94720, USA. *Correspondence e-mail: [email protected], [email protected]The optical design of a Hettrick–Underwood-style soft X-ray spectrometer with Wolter type 1 mirrors is presented. The spectrometer with a nominal length of 3.1 m can achieve a high resolving power (resolving power higher than 10 000) in the soft X-ray regime when a small source beam (<3 mm in the grating dispersion direction) and small pixel detector (5 mm effective pixel size) are used. Adding Wolter mirrors to the spectrometer before its dispersive elements can realize the spatial imaging capability, which finds applications in the spectroscopic studies of spatially dependent electronic structures in tandem catalysts, heterostructures, etc. In the pump–probe experiments where the pump beam perturbs the materials followed by the time-delayed probe beam to reveal the transient evolution of electronic structures, the imaging capability of the Wolter mirrors can offer the pixel-equivalent femtosecond time delay between the pump and probe beams when their wavefronts are not collinear. In combination with some special sample handing systems, such as liquid jets and droplets, the imaging capability can also be used to study the time-dependent electronic structure of chemical transformation spanning multiple time domains from microseconds to nanoseconds. The proposed Wolter mirrors can also be adopted to the existing soft X-ray spectrometers that use the Hettrick– Underwood optical scheme, expanding their capabilities in materials research. 1. Introduction With the advent of third-generation synchrotron facilities that can deliver low emittance, high coherence, high brightness soft X-rays for materials research, some X-ray spectroscopies have undergone transformative changes over the past decades. One such technique is resonant inelastic soft X-ray scattering (RIXS) spectroscopy. In the RIXS process, the X-ray photons with energies tuned to the elemental absorption edges reso- nantly excite the core electrons to the unoccupied states, followed by the re-emission of lower energy photons when the core holes are filled by the electrons decaying from the occupied states (de Groot & Kotani, 2008). This coherent process couples to various elementary excitations whose nature is manifested by the electronic correlations. Since the dispersion relation of these excitations can be directly deter- mined from the transferred photon energy and momentum, RIXS is thus an ideal technique for studying the electronic correlations that underpin the intriguing materials properties such as high temperature superconductivity, multiferroicity, quantum topological states, etc. (Kuiper et al., 1998; Nordgren & Guo, 2000; Kotani & Shin, 2001; Schu ¨ lke, 2007; Ament et al., 2011; Simon & Schmitt, 2013; Schmitt et al., 2014). RIXS is a second-order (two-photon) process with a very small cross ISSN 1600-5775
Transcript
research papers
J. Synchrotron Rad. (2020). 27 https://doi.org/10.1107/S1600577520004440 1 of 13
Received 10 February 2020
Accepted 31 March 2020
Edited by K. Kvashnina, ESRF – The European
Synchrotron, France
Keywords: Wolter type 1 mirrors; soft X-ray
spectrometer; resonant inelastic X-ray
scattering spectroscopy.
A design of resonant inelastic X-ray scattering(RIXS) spectrometer for spatial- and time-resolvedspectroscopy
section in the soft X-ray and EUV regimes; therefore, to make
the measurements feasible within the limited experimental
time, the throughput of the RIXS instrument was emphasized
over its spectral resolution. But with the intense soft X-ray
beam from undulators in the new generation of synchrotrons
that can be tightly focused down to a few micrometres in size,
high resolution RIXS spectroscopy in the soft X-ray regime
became available about a decade ago and is now routinely
performed to study the electronic structures and excitations of
correlated, functional, and energy materials under UHV and
even in situ/operando conditions (Ament et al., 2011; Yang et
al., 2013; Liu et al., 2014, 2015).
The key instrument for soft X-ray RIXS spectroscopy is the
grating-based spectrometer (referred to as the spectrometer
hereafter) for analysing the energies of inelastically scattered
X-rays from the sample. The grating inside the spectrometer
disperses the X-rays with respect to their energies onto the
imaging detector, while in the transverse direction the X-rays
can either be collimated or focused to increase the angular
acceptance of the instrument. These spectrometers, whether
using spherical or plane gratings with constant or varied line
spacing (VLS) rulings, can have disparate size and resolving
power optimized for their science missions (Nordgren et al.,
1989; Hague et al., 2005; Hatsui et al., 2005; Chuang et al., 2006,
2017; Ghiringhelli et al., 2006; Agaker et al., 2009; Fuchs et al.,
2009; Strocov et al., 2010; Harada et al., 2012; Yamane et al.,
2013; Chiuzbaian et al., 2014; Lai et al., 2014; Warwick et al.,
2014; Yin et al., 2015; Dvorak et al., 2016; Brookes et al., 2018).
However, using them to study the electronic structures of
materials that are expected to exhibit strong spatial inhomo-
geneity can be challenging. For example, in tandem catalysts
where multiple metal–metal-oxide interfaces tailored for
different chemical reactions are assembled to perform multi-
step reactions (Yamada et al., 2011; Su et al., 2016; Kim et al.,
2017; Xie et al., 2017), the electronic structures of reaction sites
will depend on their distances to the respective interfaces [see
the schematic illustration of such tandem catalyst in Fig. 1(a)].
In the case of CO2 methanation using Co nanocatalysts, the
reduction of catalysts by hydrogen produced from the nearby
Pt nanoparticles is expected to depend on the distance
between Co and Pt nanoparticles (Beaumont et al., 2014).
The traditional way of scanning tandem catalysts across the
focused X-ray beam and measuring the electronic structures
during the catalytic reactions can only offer the ‘snap-shot’
view of each reaction site in this dynamic process. Further-
more, to avoid averaging spectra from vastly different reaction
sites, the X-ray beam size needs to be extremely small,
presumably on the order of 100 nm. Such a small X-ray beam
can have extremely high fluence to induce non-linear or even
sample heating/damage effects (Bostedt et al., 2016; Wallander
& Wallentin, 2017; Warren et al., 2019). Mitigating these
effects by reducing the X-ray flux density will lead to an
excessively long measurement time, making the experiments
impractical.
Such caveat can be circumvented if the spectrometer can
differentiate the X-rays emitted from different reaction sites.
This capability requires an additional spatial imaging
component in the spectrometer so that the position informa-
tion of source points can be relayed onto the detector. The
optical design of such X-ray mirrors was pioneered by
H. Wolter more than 60 years ago (Wolter, 1952a,b; Saha,
1987) and various types of Wolter X-ray mirrors have been
used in X-ray telescopes (see http://chandra.harvard.edu/) and
microscopes (Matsuyama et al., 2010). Using Wolter mirrors
in a cross-dispersion configuration was recently proposed to
enable the recording of RIXS maps in the single acquisition
(Warwick et al., 2014). Following that approach, we will show
that the Hettrick–Underwood-style soft X-ray spectrometer
using a spherical mirror, instead of an elliptical cylindrical
mirror, can also benefit from the Wolter mirrors (Hettrick &
Underwood, 1986). The spectrometer will have dispersive and
imaging subassemblies that will be separately described in this
paper. Besides energy materials research, in ultrafast pump–
probe RIXS spectroscopy the imaging capability of Wolter
mirrors can offer pixel-equivalent femtosecond temporal
resolution with non-collinear pump and probe beams.
research papers
2 of 13 Yi-De Chuang et al. � Spatial- and time-resolved IXS spectrometer J. Synchrotron Rad. (2020). 27
Figure 1(a) Schematic illustration of a tandem catalyst consisting of threematerials A, B, and C that are tailored for reactions 1 and 2. (b) Opticallayout of proposed spectrometer. WM1, WM2, SM, and SG denote theWolter mirror 1, Wolter mirror 2, spectrometer mirror, and spectrometergrating, respectively. rSM, rMG, and rGD are the distances from source toSM1, SM1 to SG, and SG to detector, respectively. The incidence anglefor SM is � and the included angle for SG is � + �, where � is defined as apositive value. For imaging subassembly, r1 and r2 are the distances fromsource to WM1 and WM1 to WM2. The grazing incidence angles forWM1 and WM2 are �1 and �2.
nominal flat figure with at most >10 km residual spherical
radius removal to meet the 0.25 mrad RMS slope error
requirement over three tangential traces). Even higher quality
optics can be purchased from vendors like JTEC that utilizes
the ultra-high-precision elastic emission machining (EEM)
technology.
Two gratings are used to cover the operating photon energy
range from 250 eV to 1500 eV. The gratings will be operated in
outside (�1) order with nearly constant included angle. The
low energy (LEG) and high energy (HEG) gratings will cover
the photon energy range from 250 eV to 700 eV and 500 eV to
1500 eV, respectively. They are designed to completely correct
the aberrations at 300 eV and 600 eV target photon energies
with their central line densities and VLS terms scaled by a
factor of two. One can also prescribe the VLS parameters
specifically for C and O K-edges for LEG and HEG, respec-
tively (see later discussion). Per our previous effort in devel-
oping the modular X-ray spectrometers (MXS) at the ALS, we
intend to use nearly identical mechanical components for the
optics chamber (Chuang et al., 2017). This requirement sets
the dimension of optics and the mounting scheme. In addition,
limited by the space around the beamline and endstation area,
the overall length of the spectrometer cannot exceed 3.5 m.
With these considerations, we choose the nominal length of
the spectrometer to be 3.1 m (distance measured from sample
to the detector sensor).
The optical layout of the spectrometer is illustrated in
Fig. 1(b). Like in the case of MXS, we follow the approach by
Amemiya et al. (1996) and Amemiya & Ohta (2004) to
analytically determine the VLS parameters for LEG. These
parameters, adjusted to work with the measured 2438.3 cm
meridian radius, are summarized in Table 1. In this table, rSM,
rMG, and rGD are the distances from sample (source) to the
spectrometer mirror (SM), SM to the spectrometer gratings
(SG), and SG to the detector. �, �, and � are the incidence
angle of SM, incidence and exit angles of SG, respectively. The
included angle of SG is � + �, where � is defined as a positive
value. This included angle will be changed slightly with respect
to the photon energies to minimize the aberrations (see later
discussion). g0, g1, g2, and g3 are the constant, linear, quadratic,
and cubic terms in the VLS prescription: g(!) = g0 + g1! +
g2!2 + g3!
3, where g(!) is the local groove density and ! is the
signed tangential distance from the grating pole on the grating
surface. We adopt the SHADOW convention such that the
positive ! points to the downstream direction.
2.2. SHADOW simulations confirming the resolving power
The performance of the dispersive subassembly of this
spectrometer is simulated using SHADOW (Sanchez del Rio
et al., 2011). The results for LEG at selected photon energies
are summarized in Figs. 2(a)–2( f) [for HEG, the resolving
power should be the same as that of the LEG at scaled photon
energies if the slope error contributions are not considered].
In each figure, rays with three different energies are propa-
gated through the optical system and projected onto the
detector plane normal to the optical principal axis. The central
ray energy and the energy detuning are listed in each figure.
In the simulations, the source is a 5 mm (H) � 100 mm (W)
rectangle. The vertical beam divergence is set to 4.5 mrad,
matching the 80 mm (L) � 80 mm (W) clear aperture of SM.
research papers
J. Synchrotron Rad. (2020). 27 Yi-De Chuang et al. � Spatial- and time-resolved IXS spectrometer 3 of 13
Table 1Parameters for LEG and HEG.
The VLS terms are defined as g(!) = g0 + g1! + g2!2 + g3!
3, where ! is the signed distance to the gratingpole along the tangential direction. Positive ! points to the downstream direction. Note that R is themeasured value.
rSM (cm) rMG (cm) rGD (cm) � (�) � + � (�) n R (cm)
The ruling area of SG is 80 mm (L) � 35 mm (W), so the
horizontal beam divergence will be limited by the detector
width unless it exceeds 110 mm. The commercial CCD
detector with 27 mm square sensor will have a horizontal
acceptance of 8.7 mrad; but, for the custom detectors, this
acceptance angle can be even larger. To simplify the simula-
tions, the horizontal beam divergence is limited to �100 mrad.
We also do not include the slope error contributions from SM
and SG in the simulations because they are expected to be
negligible due to the relatively large source size.
From these figures, we see that the spectrometer can
achieve >5000 resolving power below 500 eV, meeting the
design requirement. The resolving power increases mono-
tonically with decreasing the photon energy until below
300 eV where the aberrations start to dominate. Even if the
slope error contributions from SM and SG are included, the
resolving power of LEG will still be higher than 5000 at
285 eV due to the source-limited reso-
lution at the low energy end. For HEG,
since it has the scaled VLS prescription
g(!) as the LEG, it is expected to have
>5000 resolving power at 540 eVas well.
When photon energies are tuned
away from the target energies (300 eV
for LEG and 600 eV for HEG), we can
perform additional optimization by
slightly varying the grating included
angle (� + �) to minimize the vector
sum of the coma F30 and spherical
aberration F40 terms while keeping the
detector in focus (F20 = 0). This opti-
mization procedure only works for
photon energies above 300 eV because
it yields � > 90� below this energy. As
shown in Fig. 2(g), the procedure leads
to a <0.3� change in the included angle (open squares, left
axis) and �1 mm change in rGD (filled circles, right axis). Such
small changes can be easily accommodated by motorized
grating rotation and detector translation (see later discussion).
With this optimization, the spectral quality can be significantly
improved. This is particularly important for photon energies
that are far away from the target energies, such as in the case
of 700 eV shown in Figs. 2( f) (with optimization) and 2(h)
(without optimization) for the LEG. The aforementioned
optimization procedure is not unique to the Hettrick–Under-
wood optical scheme because a similar procedure was
proposed and used in high resolution RIXS spectrometers
with VLS spherical gratings (Strocov et al., 2011).
In Fig. 3(a), we show the source (red open squares) and
detector pixel (blue filled circles) limited resolutions. These
two contributions are not balanced at 300 eV; instead, they
are balanced around 500 eV: below it, the energy resolution is
research papers
4 of 13 Yi-De Chuang et al. � Spatial- and time-resolved IXS spectrometer J. Synchrotron Rad. (2020). 27
Figure 3(a) 5 mm source (red open squares) and 27 mm detector pixel (blue filled circles) limited resolutionsfor LEG. The dashed lines mark the corresponding resolving power. (b) Calculated efficiency forLEG and HEG with Ni and Au coatings, respectively.
Figure 2SHADOW simulations for LEG showing the images at the detector plane at selected photon energies: (a) 250 eV, (b) 300 eV, (c) 400 eV, (d) 500 eV,(e) 600 eV, and ( f ) 700 eV. In each figure, three photon energies are used for simulation with energy detuning listed on the top. (g) The amount ofchanges in included angle � + � (open blue squares, left axis) and the grating-detector distance rGD (red filled circles, right axis) with minimization ofvector sum of aberrations F30 and F40. (h) Simulation showing the effect without minimizing the vector sum of aberrations at 700 eV.
dominated by the source size whereas, above it, it is dominated
by the detector pixel size. This plot implies that even without
improving the detector pixel resolution the resolving power of
the spectrometer can still be increased by closing down the
beamline exit slit at the expense of photon flux. We point out
that the target photon energy is intentionally chosen below
500 eV (1000 eV) for LEG (HEG) to achieve better optimi-
zation on the vector sum of F30 and F40, thereby extending the
operating photon energy range with good spectral quality.
2.3. Grating efficiency
The grating efficiency calculated using GSolver is shown
in Fig. 3(b). In the calculation, we have assumed the blazed
profile for both gratings and the apex angle is set to 165�. The
LEG will have an Ni coating to enhance the efficiency below
800 eV and the HEG will have an Au coating to avoid the
elemental absorption edges below 1500 eV. The LEG and
HEG will have blazed angles of 1.2� and 1.6�, respectively. The
calculation shows that with these blazed angles the grating
efficiency will be close to 25% at 500 eV and remains above
7% below 1200 eV. In addition, there is a crossover region
between 500 eV and 800 eV where one can choose either the
LEG or HEG for high efficiency or high resolution mode of
operation. The acquired gratings from the vendor (Inprentus)
have been measured and the peak efficiency for LEG (HEG)
is 15% (6%) at 500 eV (800 eV). The reduction in efficiency
can be traced to the variation and imperfection in the blazed
profile over the ruled area, which can be simulated with
GSolver by considering the contributions from more than ten
randomly sampled local blazed profiles.
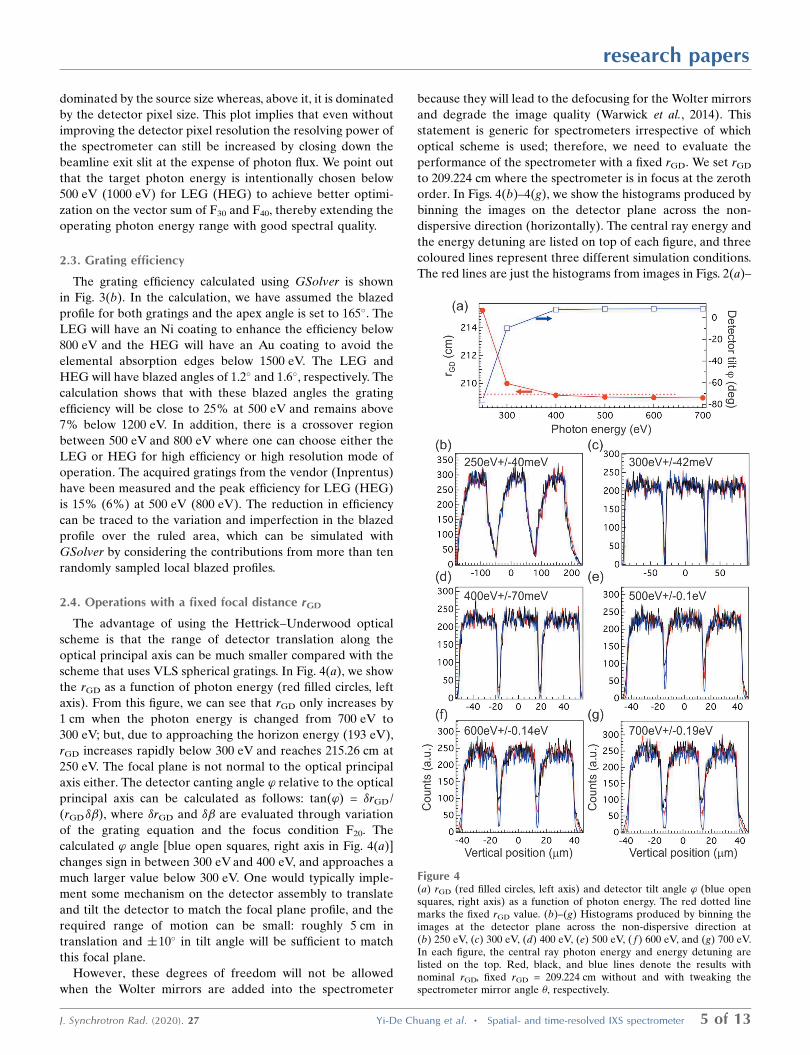
2.4. Operations with a fixed focal distance rGD
The advantage of using the Hettrick–Underwood optical
scheme is that the range of detector translation along the
optical principal axis can be much smaller compared with the
scheme that uses VLS spherical gratings. In Fig. 4(a), we show
the rGD as a function of photon energy (red filled circles, left
axis). From this figure, we can see that rGD only increases by
1 cm when the photon energy is changed from 700 eV to
300 eV; but, due to approaching the horizon energy (193 eV),
rGD increases rapidly below 300 eV and reaches 215.26 cm at
250 eV. The focal plane is not normal to the optical principal
axis either. The detector canting angle ’ relative to the optical
principal axis can be calculated as follows: tan(’) = �rGD/
(rGD��), where �rGD and �� are evaluated through variation
of the grating equation and the focus condition F20. The
calculated ’ angle [blue open squares, right axis in Fig. 4(a)]
changes sign in between 300 eV and 400 eV, and approaches a
much larger value below 300 eV. One would typically imple-
ment some mechanism on the detector assembly to translate
and tilt the detector to match the focal plane profile, and the
required range of motion can be small: roughly 5 cm in
translation and �10� in tilt angle will be sufficient to match
this focal plane.
However, these degrees of freedom will not be allowed
when the Wolter mirrors are added into the spectrometer
because they will lead to the defocusing for the Wolter mirrors
and degrade the image quality (Warwick et al., 2014). This
statement is generic for spectrometers irrespective of which
optical scheme is used; therefore, we need to evaluate the
performance of the spectrometer with a fixed rGD. We set rGD
to 209.224 cm where the spectrometer is in focus at the zeroth
order. In Figs. 4(b)–4(g), we show the histograms produced by
binning the images on the detector plane across the non-
dispersive direction (horizontally). The central ray energy and
the energy detuning are listed on top of each figure, and three
coloured lines represent three different simulation conditions.
The red lines are just the histograms from images in Figs. 2(a)–
research papers
J. Synchrotron Rad. (2020). 27 Yi-De Chuang et al. � Spatial- and time-resolved IXS spectrometer 5 of 13
Figure 4(a) rGD (red filled circles, left axis) and detector tilt angle ’ (blue opensquares, right axis) as a function of photon energy. The red dotted linemarks the fixed rGD value. (b)–(g) Histograms produced by binning theimages at the detector plane across the non-dispersive direction at(b) 250 eV, (c) 300 eV, (d) 400 eV, (e) 500 eV, ( f ) 600 eV, and (g) 700 eV.In each figure, the central ray photon energy and energy detuning arelisted on the top. Red, black, and blue lines denote the results withnominal rGD, fixed rGD = 209.224 cm without and with tweaking thespectrometer mirror angle �, respectively.
2( f). The black lines are the results with
rGD = 209.224 cm after slightly varying
the included angle of SG for optimiza-
tion. As one can see, fixing rGD does not
change the full width at half-maximum
(FWHM) of histograms except intro-
ducing spectral tails. These tails are
negligible below 400 eV, but they
become more pronounced at higher
energies. The tail structure can be
suppressed if one changes the incidence
angle � of SM, which is shown as blue
lines in the figures. The amount �� is very small: about
0.00025� (4.3 mrad) per 100 eV from 300 eV, thus one only
needs to change � by 0.001� at 700 eV to achieve almost
perfect focusing. In fact, the resulting image quality is even
better than just optimizing the included angle of SG (red and
black curves). This finding suggests that the Hettrick–Under-
wood-type spectrometer has enough flexibility to be operated
with fixed focal length if both incidence angle � of SM and the
included angle (� + �) of SG can be tuned accordingly.
Before discussing the imaging subassembly, we would like
to point out that one can also prescribe the VLS parameters
specifically at 285 eV and 540 eV for LEG and HEG, respec-
tively, to achieve the best performance at these two photon
energies. The prescribed parameters are listed in parentheses
in Table 1. Since these target photon energies are close to
300 eV and 600 eV, we expect to see very similar performance
linear with respect to the source movement, with largest
deviation about 13 mm at +70 mm source movement. This
13 mm deviation from linearity is approximately 70% of one
image width. The plot suggests that the dispersion can be view
as linear within this 140 mm FOV.
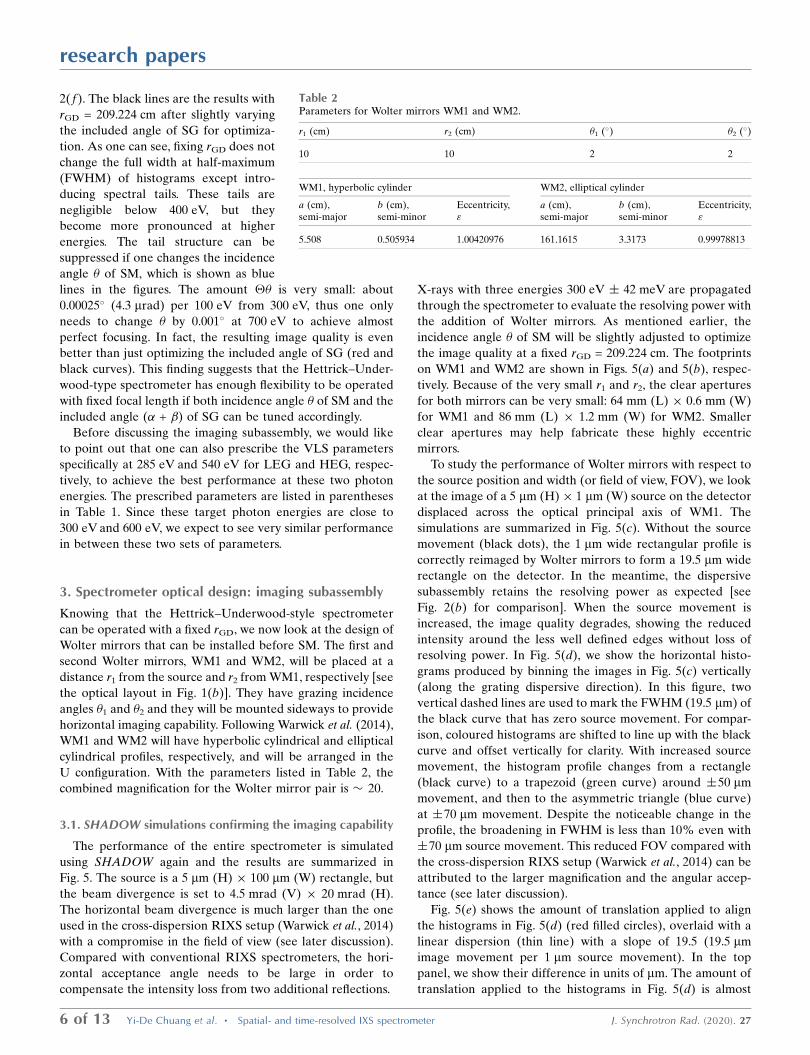
3.2. Imaging quality and FOV of Wolter mirror pair
Based on the results in Figs. 5(d) and 5(e), one can assert
that with �20 mm source movement there is negligible
degradation in the image quality. With �50 mm source
movement one expects that X-rays emitted from a 1 mm wide
source point will have �50% unweighted contribution from
the neighbouring source points (�25% from each side). That
fraction goes up to 100% at �70 mm source movement.
However, after weighting the contributions by evaluating the
area of the trapezoid and the triangle outside the dashed lines,
the fraction goes down to <15% and �25% for �50 mm and
�70 mm source movement, respectively. In that regard, one
can assert that the FOV of this Wolter mirror pair can be up to
100 mm with a good imaging quality.
The size of the FOV will depend on the acceptance angle of
the Wolter mirror pair: the larger the acceptance angle, the
smaller the FOV becomes. This is shown in Fig. 5( f) where we
compare histograms with different horizontal beam diver-
gence at�70 mm source movement to simulate the masking of
WM1. In this figure, the beam divergence is reduced from
20 mrad (bottom curve) to 10 mrad, 5 mrad, and 2 mrad (top
curve). With reducing the beam divergence, the triangular
profile evolves to trapezoidal and to almost rectangular,
suggesting an improved image quality. With this evolution, one
can say that the FOV can be increased by at least a factor of
two with reduced acceptance angle down to 5 mrad; never-
theless, this implies a trade-off with the throughput.
In the previous simulations, we do not specify the spatial
resolution of the Wolter mirror pair. The factor of �20
magnification cannot be extrapolated to infinitesimal length
scales on the sample because the spatial resolution of the
Wolter mirrors will be limited by the quality of the optics and
the effective detector pixel size (without considering the
challenging alignment of these mirrors). The slope errors of
SM and SG will have a 1/cos(�) forgiveness factor due to their
sagittal arrangement, thus they are neglected in the estima-
tion. With the state-of-the-art mirror fabrication capability, we
expect to have <0.2 mrad RMS slope error for the highly
eccentric aspheric mirrors. With these slope errors and without
considering the system alignment, stability, and other envir-
onmental factors, the spatial resolution of Wolter mirrors will
likely be around 100 nm. But to realize this resolution, the
detector pixel size needs to be better than 2 mm in the current
design (if considering the Nyquist limit with two pixels, the
detector pixel resolution will need to be better than 1 mm).
research papers
J. Synchrotron Rad. (2020). 27 Yi-De Chuang et al. � Spatial- and time-resolved IXS spectrometer 7 of 13
Figure 5(a) Footprint of WM1. (b) Footprint of WM2. (c) Images at the detector plane from a 5 mm (V) � 1 mm (H) source with horizontal source movementlisted in the figure. The incident photon energies are 300 eV � 42 meV. The horizontal beam divergence is �10 mrad. The incident angle � of SM ischanged by 0.0002� to optimize the image quality at the fixed rGD = 209.224 cm. (d) Horizontal histograms [bin the image in panel (c) vertically] showingthe changes in image profile with respect to the source movement listed in the figure. The histograms are shifted horizontally for comparison and offsetvertically for clarity. (e) Bottom: the amount of translation used in aligning the histograms in panel (d) (red filled circles) versus the linear dispersiondescribed in the text. Top: difference between the translation of histograms (red filled circles) and the linear dispersion (black line). ( f ) Horizontalhistograms showing the change of image profile with respect to the angular acceptance of Wolter mirrors at �70 mm source movement. The numberslisted in the figure are the source divergence in mrad. Dashed lines in panels (d) and ( f ) denote the FWHM of the histograms.
3.3. Feasibility of the optical design
As we discussed in the previous section, we have acquired
high quality SM and SG substrates from commercial sources
that meet the specifications, and even higher quality optics can
be fabricated using current technology like EEM. Although
we do not have the hyperbolic and elliptical cylinders for the
imaging subassembly, we have learned from another project
at the ALS (QERLIN, see Warwick et al., 2014). The Wolter
mirrors used in that project produce a smaller magnification
and are less challenging to fabricate. The vendor (JTEC) has
delivered these optics that meet the slope error requirement
(<0.25 mrad RMS). The proprietary EEM method can in
principle achieve the atomic layer-by-layer material removal,
and, working closely with the metrology laboratory at the ALS
(XROL) to produce even more challenging mirrors for ALS-
U, we believe the proposed Wolter mirrors in Table 2 can be
fabricated from the improved polishing technique out of such
collaboration. If the mirror figures turn out to be slightly off
from the designed profiles, the effect can be partly mitigated
by slightly adjusting the mirror positions and changing their
incidence angles (Yashchuk et al., 2019).
The blazed gratings we have were produced using the AFM
ruling technique pioneered by Inprentus Inc. The placement
of grating grooves with this technique over a small length scale
(hundreds of micrometres) is expected to have the AFM
precision; however, such precision cannot be retained over a
large length scale like the entire clear aperture. Presently,
there is no reliable method to measure the groove placement
precisely to evaluate the level of error; but, according to the
vendor, the groove placement accuracy can be ensured to
achieve a resolving power around 50000 over a 100 mm clear
aperture, which is far better than what we designed for the
spectrometer.
If one needs to achieve an even higher accuracy, one can
resort to a proprietary grating fabrication technique that
utilizes the commercial EUV lithography mask writer to
produce the VLS groove pattern and then transfer that
pattern onto a miscut Si(111) substrate to produce the blazed
gratings. The process has been demonstrated to achieve
�15 nm precision in the groove placement over a 120 mm
clear aperture at high groove density (10000 lines mm�1).
We have one such blazed VLS grating with 5000 lines mm�1
line density fabricated for the QERLIN project (Voronov et
al., 2017).
If one resorts to holographically ruled laminar gratings,
there could be a larger discrepancy between the prescribed
and fabricated VLS parameters. The Hettrick–Underwood
optical scheme is quite powerful in compensating these errors
compared with the VLS spherical grating scheme because it
separates the tasks of focusing, energy monochromatization,
and aberration correction into two optical elements; however,
if the VLS g2 and g3 terms are off by 2% and 5% from the
prescribed values, respectively (g1 can be largely corrected by
translating the detector to vary the rGD and is typically within
<0.1% of the design value), it becomes challenging to recover
the spectral resolution without reducing the angular accep-
tance (hence the throughput). Such caveat can be circum-
vented by close collaboration with vendors to change the VLS
terms to globally reduce the spectral tail, and typical beamline
monochromator gratings fabricated using such holographic
ruling technique can achieve >20000 resolving power.
Therefore, it is feasible to obtain the designed optics even with
current state-of-the-art fabrication technologies. Besides, the
proposed mechanical design will enable the combined motion,
i.e. SM pitch angle and detector translation, to reduce the
spectral broadening by incorrect VLS parameters. For imaging
subassembly, translating/pitching WM1 and WM2 can be used
to compensate the figure error as shown by Yashchuk et al.
(2019).
3.4. Alignment tolerance, precision and the range ofmechanical motion
We have used SHADOW to simulate the effect of optical
misalignment relative to the source (X-ray beam spot on the
sample). To set the alignment tolerance for the dispersive
subassembly, we require that the broadening in the FWHM of
the histograms like those in Fig. 4 shall not exceed 10% or
present noticeable spectral tail even if the broadening is less
than 10%. For the imaging subassembly, we assume a full
angular acceptance (20 mrad) in the simulation and look at the
spatial profile of the histograms like those in Fig. 5(d). We set
the criterion that the trapezoidal profile should not be worse
than the green curves in Fig. 5(d). We also do not consider
using the combined motion to increase the alignment toler-
ances as we reserve this option for correcting the errors in the
optics figure and the grating ruling. The resulting numbers for
alignment tolerance, the precision and range of mechanical
motion are summarized in Table 3.
For the stability requirement, we set it to be 10% of the
alignment tolerance. Based on Table 3, the stability require-
ments are set to be 500 nm vertical and 200 nm transverse over
the course of 24 h. The floor scan around the area of the
spectrometer confirms the required stability and the FEA also
validates the mechanical design for the optics chamber and
granite base for the spectrometer to meet these requirements.
4. Notes on the applications
Current in situ/operando soft X-ray spectroscopy techniques
(XAS, XES, and RIXS) at the ALS already provide element-
specific access to the local chemical states in liquids, gas-phase
molecules, and at the liquid/solid and gas/solid interfaces
during the catalytic and/or electrochemical reactions. The
particular challenge, however, remains to be able to conduct
the in situ/operando characterization of electronic structure
and the control of, for example, charge transfer and electron
flow in ‘real world’ systems such as the solid/gas and solid/
liquid interfaces, while simultaneously probing the chemical
transformations on multiple time and length scales. RIXS is
a particularly powerful soft X-ray technique for studying
elementary excitations, such as vibrational (at high energy
resolution), d–d (f–f), and charge transfer excitations that are
research papers
8 of 13 Yi-De Chuang et al. � Spatial- and time-resolved IXS spectrometer J. Synchrotron Rad. (2020). 27
critical for energy-related materials and chemical functions.
An extension of this technique to facilitate the spatially and
temporally resolved measurements of electronic dynamics will
open a new direction for research in materials science and
chemical transformation.
4.1. Mitigating the sample heating issue
The typical way of extending the spectroscopy into the
spectromicroscopy is to use a highly focused, nanometre size
beam for probing the samples to achieve the spatial resolution.
Unfortunately, such an approach has witnessed various tech-
nical issues for today’s material studies. First, in the soft X-ray
regime, the very large horizontal beam size in third-generation
synchrotron storage rings will require the reflective focusing
mirrors to have enormous demagnifications to focus the beam
down to the submicrometre; thus instead of using mirrors,
zone plates are often used for such tight focusing (Samson &
Ederer, 2000). However, zone plates have very low transmis-
sion (�1% transmission) that renders most spectroscopies
with low cross section unsuitable for microscopic applications.
Additionally, the limited sample manipulation space in a
system based on a zone plate focusing makes it difficult to
incorporate the versatile real-world sample environments
for in situ/operando studies. Second, with diffraction-limited
storage rings that will deliver fully coherent soft X-ray beam
with nearly round profile, one can envision using highly
demagnifying KB mirrors (horizontal demagnification on the
order of 100) to accomplish this goal (for example, see
Eriksson et al., 2014 and the focused issue therein contained).
The fully coherent soft X-rays also boost the zone-plate
transmission.
However, the tightly focused X-ray beam can cause issues
previously encountered in the free-electron laser facilities.
One such issue is the very high X-ray fluence that can intro-
duce non-linear effects to distort the electronic structures or
even sample damaging, and the effect would be more
noticeable with a longer pulse like that in the storage ring
where the notion of ‘destruction after measurement’ no longer
applies. In particular, RIXS is a photon-hungry technique such
that the radiation sensitivity issue cannot be simply mitigated
by reducing the photon flux. Although the exact X-ray fluence
for causing these effects will be sample-dependent, it has been
found recently that even some transition-metal oxide systems
can suffer radiation damage in RIXS experiments with a
relatively low soft X-ray dose and a much relaxed beam
size (Lebens-Higgins et al., 2019). In general, a value like
1 mJ cm�2 is a good number to go with (for example, see
Gregoratti et al., 2009; Wang et al., 2012). For 1000 eV photons,
this fluence is equivalent to a flux density of 6 � 1012 photons
cm�2, or 6 � 104 photons mm�2, per pulse. With a storage ring
that operates at 500 MHz repetition rate, the flux density
becomes 3 � 1013 photons s�1 mm�2. Although this value is at
most an order of magnitude higher than what is available at
an existing high-resolution beamline, with improved coating
and mirror/grating fabrication technology a comparable flux
density for new high-resolution beamlines can be envisioned.
Without doubt, the situation becomes even more dire with the
beam focused down to the sub-micrmetre in both dimensions.
For those beamlines, focusing the beam spot down to 1 mm2
with reflective mirrors will reach this threshold flux density.
The mere reason that this fluence issue is not encountered in
most third-generation synchrotron facilities thus far is due to
the very low efficiency zone plates used to produce the tightly
focused X-ray beam.
A less addressed issue is the local average heating and the
associated mechanical stress from the enormous power
density. This issue, in fact, takes place at an even lower fluence.
With the 1 keV X-ray beam that reaches the 1 mJ cm�2
threshold fluence per shot (3 � 1013 photons s�1) over the
1 mm2 area, the deposited power will be 5 mW and the asso-
ciated power density will be 5 kW mm�2. The temperature rise
can be roughly estimated using the following equation: �T =
nðPl=�AÞ, where n is a pre-factor depending on the geometry
and is on the order of 1, � is the thermal conductivity, P is the
research papers
J. Synchrotron Rad. (2020). 27 Yi-De Chuang et al. � Spatial- and time-resolved IXS spectrometer 9 of 13
Table 3Alignment tolerance, precision and range of mechanical motion.
Note that we adopt the SHADOW convention for the coordinates: on theoptical surface, X is transverse to the beam path, Y is along the beam path, andZ is normal to the optical surface.
Alignmenttolerance
Mechanical motion(step resolution; range)
Spherical mirrorMX (transverse) �25 mm N/AMY (along beam path) �25 mm N/AMZ (up/down) �5 mm N/AM�X (pitch) �0.01� 0.0001�/step; 2�
SpectrometerSX (transverse) �100 mm N/ASY (along the beam) �100 mm N/ASZ (up/down) �10 mm N/A (or source vertical move)
DetectorDY (along the beam) N/A 1 mm/step; 150 mm
Wolter mirrors WM1WM1X 100 mm N/AWM1Y �5 mm 0.5 mm/step; 1 mmWM1Z �2 mm 0.2 mm/step; 100 mmWM1�X �0.001� 0.0001�/step; 0.1�
WM1�Y �0.01� N/AWM1�Z �0.01� N/A
Wolter mirrors WM2WM2X 100 mm N/AWM2Y �10 mm 0.5 mm/step; 1 mmWM2Z �2 mm 0.2 mm/step; 100 mmWM2�X �0.001� 0.0001�/step; 0.1�
WM2�Y �0.005� N/AWM2�Z �0.01� N/A
deposited power, l is the penetration depth, and A is the
footprint of the beam. With the assumption of a 100 nm X-ray
penetration depth and 1 mm2 area, the temperature rise �T
will be around 50 K over the probe volume with � =
10 W m�1 K�1 (typical for transition metal oxides). Although
the average heating can lead to a considerable temperature
rise on the sample when the X-ray beam is tightly focused
down to the sub-micrometre level in size, the FEA shows that
the transient heating will be even more severe and will follow
the temporal profile of the X-ray beam that cannot be easily
mitigated (Wallander & Wallentin, 2017). Further analysis will
be required to investigate this issue for practical samples like
quasi-two-dimensional oxides that host a variety of intriguing
emerge physics phenomena.
But with the aforementioned spectrometer using the Wolter
mirror pair for horizontal imaging, one does not have to
tightly focus the beam horizontally. In fact, a wider beam spot
that matches the FOV of Wolter mirrors will be more ideal.
Use of a Wolter mirror pair not only avoids the high fluence
high power density issue even when the vertical beam size is
reduced down to �100 nm but also allows the spectro-
microscopy to be implemented before the availability of the
diffraction-limited storage ring.
4.2. Achieving femtosecond time resolution
Besides using the spectrometer to study the spatially
dependent electronic structures of materials, this spectrometer
can also be used in pump–probe RIXS experiments. There,
one can utilize the imaging capability of Wolter mirrors to
achieve pixel-equivalent femtosecond time resolution. The
idea is sketched in Fig. 6 and has been employed in the optical
cross-correlation to mitigate the time jittering in free-electron
lasers (for example, see Beye et al., 2012). In this figure, �x and
�l are the incidence angles of the probe X-ray beam (blue
lines) and the pump laser beam (red lines) relative to the
sample surface normal. ’ is the emission angle to the spec-
trometer (green lines). L is the characteristic length scale,
which can be the spatial resolution or FOV of Wolter mirror
pair (with sufficient detector pixel resolution).
From this figure, one can see that the time difference
between the wavefronts of pump and probe beams on
the sample as viewed by the spectrometer detector is
[L/cos(’)][sin(�x) � sin(�l)]/c, where c is the speed of light. If
the pump and probe beams are collinear, �x = �l, there will
be no time difference across the horizontal direction on the
detector plane. To achieve the best temporal resolution per
pixel, cos(’) needs to be close to 1; or, equivalently, the sample
should be placed close to normal emission geometry.
Assuming the spatial resolution of Wolter mirror pair is L =
250 nm (using the 5 mm detector pixels and 20� magnifica-
tion), the pixel-equivalent temporal resolution is (0.83 fs) �
[sin(�x) � sin(�l)]. Based on this equation, the worst temporal
resolution per pixel will be 0.83 fs when pump and probe
beams are almost normal to each other. Even if the spatial
resolution of the Wolter mirrors is larger than 250 nm, which
leads to a larger pre-factor than 0.83 fs, one still can adjust �x
and �l (making them more collinear) to achieve sub-femto-
second temporal resolution. We would like to point out that
synchronizing the pump and probe beams to achieve femto-
second time delay is by no means an easy task, and is subjected
to the time jittering and drift over the acquisition time.
One may be interested in recording a larger time-delay
window per acquisition with reduced temporal resolution to a
few femtoseconds. In this scenario, L is the FOV of a Wolter
mirror pair and can be as large as 100 mm (see previous
discussion). If the probe X-ray beam is perpendicular to both
pump laser beam and the spectrometer, then the available
time delay window will be �(0.33 ps)/cos(’). One can then
increase ’ to achieve a picosecond recordable time window.
4.3. Probing chemical transformation in space and time
An increasing number of experiments are performed under
in situ or operando conditions in order to study the funda-
mental mechanisms underlying the complex processes such
as the electrochemical energy conversion in realistic working
conditions. A fundamental obstacle, however, remains to
bridge the spatial, temporal, and thermodynamic scales that
are simultaneously relevant for the outcome of chemical
reactions. Often chemistry is based on statistical processes.
Fluctuations in large ensembles lead to local conditions under
which, at any given time, a small number of molecules can
undergo chemical transformations. However, these conditions
are only met for a very short period of time and only in a few
specific locations. It is then and there where one needs the best
possible spectral, temporal, and spatial resolution in spectro-
scopy in order to capture the correlated intra- and inter-
molecular dynamics that are at the heart of chemical trans-
formations. The location and time, however, of statistical
processes is, by definition, not known. The discrepancy
between the spatiotemporal heterogeneity of chemical reac-
tions and the tight spatiotemporal restrictions of virtually all
probes for fundamental interactions is one of the biggest
challenges in the study of ‘real-world chemistry.’
A key challenge in understanding the aqueous-phase
chemical reactions of organic molecules is developing novel
ways of observing the formation of reactive intermediates in
real time. Fully characterizing the mass and electronic struc-
research papers
10 of 13 Yi-De Chuang et al. � Spatial- and time-resolved IXS spectrometer J. Synchrotron Rad. (2020). 27
Figure 6Schematic illustration of a pump–probe experiment setup. �x, �l, and ’ arethe incidence angles of X-ray (blue) and laser (red) beams onto thesample, and the emission angle to the spectrometer (green).
ture of transient intermediates formed in a bimolecular reac-
tion is central for elucidating condensed-phase reaction
mechanisms. Direct observations of these short-lived species
remain an outstanding hurdle due to the finite mixing times
of current macroscopic reaction vessels (e.g. stopped flow
kinetics) that are often longer than the lifetime of key reactive
intermediates. For example, key free radical intermediates
(e.g. peroxy and alkoxy radicals) in the atmospheric degra-
dation of organic material often have condensed-phase life-
times that are microseconds or shorter.
We envision, for slower bimolecular reactions, that the use
of levitated liquid droplets may be advantageous for exam-
ining the millisecond and longer time scale kinetics. One
scheme illustrated in Fig. 7(a) that enables the simultaneous
X-ray diffraction and hard X-ray emission spectroscopy (at
Mn K-edge) studies using the ultrashort, ultrabright FEL
X-ray pulses was established to probe the intact atomic
structure of PS II microcrystals and the intact electronic
structure of its Mn4CaO5 cluster at room temperature (Kern et
al., 2013). The similar experimental method for a synchrotron
based RIXS will help mitigate the soft X-ray photoreduction
and radiation damage to the organic and biological samples.
Another proposed experimental scheme could be the liquid
jet or droplets levitation tools designed to access a broad
range of reaction timescales when coupled to the X-ray beam.
The time resolution of 1 ns can be achieved when the spatial
resolution of 100 nm, with the help of Wolter mirrors in the
spectrometer, is realized on a liquid jet at 100 m s�1 speed, so
as to the time window of microseconds (over the 100 mm FOV
of Wolter mirror pair) and multiple time domains can be
readily obtained by adjusting the jet speed and the interaction
point between the X-ray beam and the initial mixing location.
For example, two droplets will be levitated and rapidly mixed
using holographic optical tweezers as shown in Fig. 7(b). The
reaction can be monitored both by the optical Raman spec-
troscopy and soft X-ray spectroscopy. This approach would
foster the revolutionary opportunities to probe chemistry in
merged trapped particles in the water window and above the
carbon K-edge to achieve chemical contrast. The setup will
provide information on compositional gradients and reaction
intermediates within the liquid jet or droplets after they fuse
and as the reaction progresses. The final droplet size would be
changed to examine how greater degrees of confinement alter
the chemistry.
5. Summary and conclusions
We have presented an optical design of a Hettrick–Under-
wood-style spectrometer that uses a Wolter mirror pair
consisting of a hyperbolic cylinder and an elliptical cylinder
arranged in the U configuration for horizontal imaging. We
show that this spectrometer can achieve a high resolving
power (resolving power exceeding 10000) over the operating
photon energy range from 250 eV to 1500 eV, if the small pixel
detector and a small beamline exit slit setting are used. By
tweaking the incidence angle � of the spherical mirror and the
included angle (� + �) of the VLS plane grating, the spec-
trometer can be operated with a fixed detector position rGD
without losing the spectral quality. By placing the Wolter
mirrors close to the sample, a combined magnification of �20
can be achieved. With this magnification, the spatial resolution
of the Wolter mirror pair can be around 250 nm with 5 mm
detector pixel (or 500 nm considering the two-pixel Nyquist
limit) and the FOV can exceed 100 mm with good imaging
quality. This FOV can be further increased at the expense of
throughput. For spectromicroscopy, the tightly focused X-ray
beam can have fluence exceeding 1 mJ cm�2. This excessive
local heating can take place at an even lower fluence and cause
the non-linear effect, thermal inhomogeneity, and mechanical
stress to distort the electronic structures of materials under
study. The impact can be even greater with longer X-ray pulses
like in the synchrotron storage ring where the thermal
response can track the temporal profile of the X-ray beam. We
show that the issues can be mitigated by using the Wolter
mirror pair to allow the detector to perform the spatial
imaging without the need of a tightly focusing the X-ray beam
down to the sub-micrometre level in both dimensions. We
argue that besides using the spectrometer to study the
heterogeneous electronic structures of materials, the imaging
capability of Wolter mirrors can offer the pixel-equivalent
femtosecond temporal resolution in the pump–probe experi-
ments and the spatial- and temporal-resolution at the nano-
metre and nanosecond, respectively, in the chemical reaction
processes.
Acknowledgements
YDC thanks the insightful discussion with Dr Yashchuk and
Dr Voronov about the metrology and novel grating fabrication
technologies.
Funding information
This research used resources of the Advanced Light Source,
which is a DOE Office of Science User Facility under contract
No. DE-AC02-05CH11231.
research papers
J. Synchrotron Rad. (2020). 27 Yi-De Chuang et al. � Spatial- and time-resolved IXS spectrometer 11 of 13
Figure 7The schemes of RIXS sample systems: (a) the timing protocol consists ofa fixed time of flight �t between the optical pump and X-ray probe beams(X-ray excitation and RIXS detection) (Kern et al., 2013); (b) twodroplets are levitated and rapidly mixed.
References
Agaker, M., Andersson, J., Englund, C.-J., Olsson, A., Strom, M. &Nordgren, J. (2009). Nucl. Instrum. Methods Phys. Res. A, 601, 213–219.
Amemiya, K., Kitajima, Y., Ohta, T. & Ito, K. (1996). J. SynchrotronRad. 3, 282–288.
Amemiya, K. & Ohta, T. (2004). J. Synchrotron Rad. 11, 171–176.Ament, L. J. P., van Veenendaal, M., Devereaux, T. P., Hill, J. P. & van
den Brink, J. (2011). Rev. Mod. Phys. 83, 705–767.Andresen, N. C., Denes, P., Goldschmidt, A., Joseph, J., Karcher, A. &
Tindall, C. S. (2017). Rev. Sci. Instrum. 88, 083103.Beaumont, S. K., Alayoglu, S., Specht, C., Michalak, W. D.,
Pushkarev, V. V., Guo, J.-H., Kruse, N. & Somorjai, G. A. (2014).J. Am. Chem. Soc. 136, 9898–9901.
Beye, M., Krupin, O., Hays, G., Reid, A. H., Rupp, D., Jong, S., Lee, S.,Lee, W.-S., Chuang, Y.-D., Coffee, R., Cryan, J. P., Glownia, J. M.,Fohlisch, A., Holmes, M. R., Fry, A. R., White, W. E., Bostedt, C.,Scherz, A. O., Durr, H. A. & Schlotter, W. F. (2012). Appl. Phys.Lett. 100, 121108.
Bostedt, C., Boutet, S., Fritz, D. M., Huang, Z., Lee, H. J., Lemke,H. T., Robert, A., Schlotter, W. F., Turner, J. J. & Williams, G. J.(2016). Rev. Mod. Phys. 88, 015007.
Brookes, N. B., Yakhou-Harris, F., Kummer, K., Fondacaro, A., Cezar,J. C., Betto, D., Velez-Fort, E., Amorese, A., Ghiringhelli, G.,Braicovich, L., Barrett, R., Berruyer, G., Cianciosi, F., Eybert, L.,Marion, P., van der Linden, P. & Zhang, L. (2018). Nucl. Instrum.Methods Phys. Res. A, 903, 175–192.
Chiuzbaian, S. G., Hague, C. F., Avila, A., Delaunay, R., Jaouen, N.,Sacchi, M., Polack, F., Thomasset, M., Lagarde, B., Nicolaou, A.,Brignolo, S., Baumier, C., Luning, J. & Mariot, J.-M. (2014). Rev.Sci. Instrum. 85, 043108.
Chuang, Y.-D., Pepper, J., McKinney, W., Hussain, Z., Gullikson, E.,Batson, P., Qian, D. & Hasan, M. Z. (2006). J. Phys. Chem. Solids,66, 2173–2178.
Chuang, Y.-D., Shao, Y.-C., Cruz, A., Hanzel, K., Brown, A., Frano,A., Qiao, R., Smith, B., Domning, E., Huang, S. W., Wray, L. A.,Lee, W. S., Shen, Z. X., Devereaux, T. P., Chiou, J. W., Pong, W. F.,Yashchuk, V. V., Gullikson, E., Reininger, R., Yang, W., Guo, J.-G.,Duarte, R. & Hussain, Z. (2017). Rev. Sci. Instrum. 88, 013110.
Dvorak, J., Jarrige, I., Bisogni, V., Coburn, S. & Leonhardt, W. (2016).Rev. Sci. Instrum. 87, 115109.
Eriksson, M., van der Veen, J. F. & Quitmann, C. (2014). J.Synchrotron Rad. 21, 837–842.
Fuchs, O., Weinhardt, L., Blum, M., Weigand, M., Umbach, E., Bar,M., Heske, C., Denlinger, J., Chuang, Y.-D., McKinney, W., Hussain,Z., Gullikson, E., Jones, M., Batson, P., Nelles, B. & Follath, R.(2009). Rev. Sci. Instrum. 80, 063103.
Ghiringhelli, G., Piazzalunga, A., Dallera, C., Trezzi, G., Braicovich,L., Schmitt, T., Strocov, N. V., Betemps, R., Patthey, L., Wang, X. &Grioni, M. (2006). Rev. Sci. Instrum. 77, 113108.
Gregoratti, L., Mentes, T. O., Locatelli, A. & Kiskinova, M. (2009).J. Electron Spectrosc. Relat. Phenom. 170, 13–18.
Groot, F. M. F. de & Kotani, A. (2008). Core Level Spectroscopy.Boca Raton: CRC Press.
Hague, C. F., Underwood, J. H., Avila, A., Delaunay, R., Ringuenet,H., Marsi, M. & Sacchi, M. (2005). Rev. Sci. Instrum. 76, 023110.
Harada, Y., Kobayashi, M., Niwa, H., Senba, Y., Ohashi, H.,Tokushima, T., Horikawa, Y., Shin, S. & Oshima, M. (2012). Rev.Sci. Instrum. 83, 013116.
Hatsui, T., Setoyama, H., Shigemasa, E. & Kosugi, N. (2005). J.Electron Spectrosc. Relat. Phenom. 144–147, 1059–1062.
Hettrick, M. C. & Underwood, J. H. (1986). Appl. Opt. 25, 4228–4231.Kern, J., Alonso-Mori, R., Tran, R., Hattne, J., Gildea, R. J., Echols,
N., Glockner, C., Hellmich, J., Laksmono, H., Sierra, R. G.,Lassalle-Kaiser, B., Koroidov, S., Lampe, A., Han, G., Gul, S.,Difiore, D., Milathianaki, D., Fry, A. R., Miahnahri, A., Schafer,D. W., Messerschmidt, M., Seibert, M. M., Koglin, J. E., Sokaras, D.,
Weng, T.-C., Sellberg, J., Latimer, M. J., Grosse-Kunstleve, R. W.,Zwart, P. H., White, W. E., Glatzel, P., Adams, P. D., Bogan, M. J.,Williams, G. J., Boutet, S., Messinger, J., Zouni, A., Sauter, N. K.,Yachandra, V. K., Bergmann, U. & Yano, J. (2013). Science, 340,491–495.
Kim, D., Kley, C. S., Li, Y. & Yang, P. (2017). Proc. Natl Acad. Sci. 114,10560–10565.
J. J. M., de Groot, F. M. F. & Sawatzky, G. A. (1998). Phys. Rev. Lett.80, 5204–5207.
Lai, C. H., Fung, H. S., Wu, W. B., Huang, H. Y., Fu, H. W., Lin, S. W.,Huang, S. W., Chiu, C. C., Wang, D. J., Huang, L. J., Tseng, T. C.,Chung, S. C., Chen, C. T. & Huang, D. J. (2014). J. Synchrotron Rad.21, 325–332.
Lebens-Higgins, Z. W., Vinckeviciute, J., Wu, J., Faenza, N. V., Li, Y.,Sallis, S., Pereira, N., Meng, Y. S., Amatucci, G. G., Der Ven, A. V.,Yang, W. L. & Piper, L. F. J. (2019). J. Phys. Chem. C, 123, 13201–13207.
Liu, X., Yang, W. & Liu, Z. (2014). Adv. Mater. 26, 7710–7729.Liu, Y.-S., Glans, P.-A., Chuang, C.-H., Kapilashrami, M. & Guo, J.-H.
(2015). J. Electron Spectrosc. Relat. Phenom. 200, 282–292.Matsuyama, S., Wakioka, T., Kidani, N., Kimura, T., Mimura, H.,
Sano, Y., Nishino, Y., Yabashi, M., Tamasaku, K., Ishikawa, T. &Yamauchi, K. (2010). Opt. Lett. 35, 3583–3585.
Nordgren, J., Bray, G., Cramm, S., Nyholm, R., Rubensson, J.-E. &Wassdahl, N. (1989). Rev. Sci. Instrum. 60, 1690–1696.
Nordgren, J. & Guo, J.-H. (2000). J. Electron Spectrosc. Relat.Phenom. 110–111, 1–13.
Saha, T. T. (1987). Appl. Opt. 26, 658–663.Samson, J. A. & Ederer, D. L. (2000). Vacuum Ultraviolet Spectro-
scopy. New York: Academic Press.Sanchez del Rio, M., Canestrari, N., Jiang, F. & Cerrina, F. (2011).
J. Synchrotron Rad. 18, 708–716.Schmitt, T., de Groot, F. M. F. & Rubensson, J.-E. (2014). J.
Synchrotron Rad. 21, 1065–1076.Schulke, W. (2007). Electron Dynamics by InelasticX-ray Scattering.
Oxford University Press.Simon, M. & Schmitt, T. (2013). J. Electron Spectrosc. Relat. Phenom.
188, 1–2.Strocov, V. N., Schmitt, T., Flechsig, U., Patthey, L. & Chiuzbaian, G. S.
(2011). J. Synchrotron Rad. 18, 134–142.Strocov, V. N., Schmitt, T., Flechsig, U., Schmidt, T., Imhof, A., Chen,
Q., Raabe, J., Betemps, R., Zimoch, D., Krempasky, J., Wang, X.,Grioni, M., Piazzalunga, A. & Patthey, L. (2010). J. SynchrotronRad. 17, 631–643.
Su, J., Xie, C., Chen, C., Yu, Y., Kennedy, G., Somorjai, G. A. & Yang,P. (2016). J. Am. Chem. Soc. 138, 11568–11574.
Tremsin, A. S., Vallerga, J. V., McPhate, J. B. & Siegmund, O. H. W.(2015). Nucl. Instrum. Methods Phys. Res. A, 787, 20–25.
Voronov, D. L., Gullikson, E. M. & Padmore, H. A. (2017). Opt.Express, 25, 23334–23342.
Wallander, H. & Wallentin, J. (2017). J. Synchrotron Rad. 24, 925–933.
Wang, T., Zhu, D. L., Wu, B., Graves, C., Schaffert, S., Rander, T.,Muller, L., Vodungbo, B., Baumier, C., Bernstein, D. P., Brauer, B.,Cros, V., de Jong, S., Delaunay, R., Fognini, A., Kukreja, R., Lee, S.,Lopez-Flores, V., Mohanty, J., Pfau, B., Popescu, H., Sacchi, M.,Sardinha, A. B., Sirotti, F., Zeitoun, P., Messerschmidt, M., Turner,J. J., Schlotter, W. F., Hellwig, O., Mattana, R., Jaouen, N., Fortuna,F., Acremann, Y., Gutt, C., Durr, H. A., Beaurepaire, E., Boeglin,C., Eisebitt, S., Grubel, G., Luning, J., Stohr, J. & Scherz, A. O.(2012). Phys. Rev. Lett. 108, 267403.
Warren, A. J., Axford, D. & Owen, R. L. (2019). J. Synchrotron Rad.26, 991–997.
Warwick, T., Chuang, Y.-D., Voronov, D. L. & Padmore, H. A. (2014).J. Synchrotron Rad. 21, 736–743.
Wolter, H. (1952a). Ann. Phys. 445, 94–114.
research papers
12 of 13 Yi-De Chuang et al. � Spatial- and time-resolved IXS spectrometer J. Synchrotron Rad. (2020). 27
Wolter, H. (1952b). Ann. Phys. 445, 286–295.Xie, C., Chen, C., Yu, Y., Su, J., Li, Y., Somorjai, G. A. & Yang, P.
(2017). Nano Lett. 17, 3798–3802.Yamada, Y., Tsung, C.-K., Huang, W., Huo, Z., Habas, S. E., Soejima,
T., Aliaga, C. E., Somorjai, G. A. & Yang, P. (2011). Nat. Chem. 3,372–376.
Yamane, H., Kosugi, N. & Hatsui, T. (2013). J. Electron Spectrosc.Relat. Phenom. 188, 155–160.
Yang, W., Liu, X., Qiao, R., Olalde-Velasco, P., Spear, J. D., Roseguo,L., Pepper, J., Chuang, Y.-D., Denlinger, J. D. & Hussain, Z. (2013).J. Electron Spectrosc. Relat. Phenom. 190, 64–74.
Yashchuk, V. V., Lacey, I., Gevorkyan, G. S., McKinney, W. R., Smith,B. V. & Warwick, T. (2019). Rev. Sci. Instrum. 90, 021711.
Yin, Z., Peters, H. B., Hahn, U., Agaker, M., Hage, A., Reininger, R.,Siewert, F., Nordgren, J., Viefhaus, J. & Techert, S. (2015). Rev. Sci.Instrum. 86, 093109.
research papers
J. Synchrotron Rad. (2020). 27 Yi-De Chuang et al. � Spatial- and time-resolved IXS spectrometer 13 of 13