Page 1
A digital Compton suppression spectroscopy withoutgamma-ray coincidence-summing loss using list-modemultispectral data acquisition
Weihua Zhang • Pawel Mekarski • Maxime Dion •
Jing Yi • Kurt Ungar
Received: 8 December 2011 / Published online: 27 December 2011
� Akademiai Kiado, Budapest, Hungary 2011
Abstract The study demonstrates the advantages of an
innovative list-mode multispectral data acquisition system
that allows simultaneous creation of several different sin-
gle, summed, coincident and anticoincident spectra with a
single measurement. One of the consequences of list-mode
data file offline processing is a reconstructed spectrum with
Compton continuum suppression and without any full-
energy peak efficiency deduction owing to true coincidence
summing. The spectrometer is designed to read out ana-
logue signal from preamplifier of gamma-ray detectors and
to digitalize it using DGF/Pixie-4 software and card
package (XIA LLC). This is realized by converting an
Ortec Compton suppression data acquisition system into an
all-digital spectrometer. Instead of using its timing elec-
tronic chain to determine the coincidence event, the analog
signals from primary and guard detectors were connected
directly into the Pixie-4 card for pulse height and time
coincident measurement by individually logging and time
stamping each electronic pulse. The data acquired in list-
mode included coincidence and anticoincidence events
consisting of records of energy and timestamp from pri-
mary and guard detectors. Every event was stored in a text
file for offline processing and spectral reconstruction. A
sophisticated computer simulation was also created with
the goals of obtaining a better understanding of the
experimental results and calculating efficiency.
Keywords Digital gamma–gamma coincidence/
anticoincidence counting � List-mode data acquisition �Compton suppressions
Introduction
The Compton continuum suppression technique has been
used for several decades in the areas of neutron activation
analysis (NAA) [1–5], low-level radioactive waste and
environmental naturally occurring radioactivity measure-
ments [6–8]. One of the most important advantages of
Compton suppression gamma-ray spectrometry is the
substantial decrease of background activity, leading to
improved detection limits. However, its applications are
limited to certain types of disintegration schemes of the
nuclide used in the analysis. For examples, W. Zhang and
A. Chatt have judiciously applied the Compton suppression
NAA methods for a few trace element analyses such as,
iodine using 128I 442.9 keV gamma-ray, vanadium using52V 1,434.2 keV gamma-ray, copper using 66Cu
1,039.2 keV gamma-ray and arsenic using 76As 559.1 keV
gamma-ray with significant background suppression and
negligible full-energy peak deduction [9–12].
The limitations of the spectroscopic performance can be
ascribed to the basic principles of how a Compton sup-
pression spectrometer works. The Compton continuum is
caused by scattered photons escaping from the principal
detector. Each count in the Compton continuum is
accompanied by an escaping gamma-ray which can be used
to differentiate this count from photoelectric events by
employing anticoincidence and coincidence techniques.
The result is the suppression of the Compton continuum in
the gamma-ray spectrum. The most common method of
Compton continuum suppression involves the use of an
annular detector surrounding the principal detector crystal.
Compton scattering in the principal detector may produce
scattered gamma-rays that interact with the surrounding
annulus. If the two detectors are operated in anticoinci-
dence mode, most of the Compton interactions in the
W. Zhang (&) � P. Mekarski � M. Dion � J. Yi � K. Ungar
Radiation Protection Bureau, Health Canada,
775 Brookfield Road, Ottawa, ON K1A 1C1, Canada
e-mail: [email protected]
123
J Radioanal Nucl Chem (2012) 292:1265–1272
DOI 10.1007/s10967-011-1588-7
Page 2
principal detector can be rejected. The photoelectric events
do not involve the escape of scattered radiation and thus are
not affected by the use of anticoincidence counting. One
disadvantage of this approach is also apparent. Nuclides
with complex decay schemes may emit many gamma rays
in coincidence. There is a possibility of two gamma-rays
from the same disintegration being detected by both
detectors at the same time. These events will be considered
as Compton events and rejected, leading to the undesired
full-energy peak efficiency deductions.
In order to solve this problem, a coincidence counting
technique has been developed. The same equipment as that
for the anticoincidence system is used except that it is in
the ‘‘coincidence mode’’ and ‘‘an energy window setting’’
of the surrounding detector is set up. When a specified
energy is deposited in the surrounding detector, it triggers
an output timing signal. The principal detector events
which are in coincidence with such a signal, and hence a
selected energy event in surrounding detector, will be
recorded in the spectrum. The idea is that one of the cas-
cading gamma-rays is used to gate the analog-to-digital
converter (ADC) so that another peak in the spectrum is
recorded with very low background. This technique is quite
suitable for cases of coincident gamma-ray emitting nuc-
lides because this additional energy requirement maintains
high full-energy peak efficiency while at the same time
reduces the Compton background. The major disadvantage
of this technique, however, is its special energy window
setting which explains why this technique cannot be used
for the multi-nuclides measurement. Even though extre-
mely low background can be obtained using the coinci-
dence counting technique, the problem of full-energy peak
deduction still cannot be solved as the cascaded gamma-
rays cannot be detected with a coincidence efficiency of
100%.
For low level radionuclide environmental monitoring
applications, an Ortec Compton suppression system [13]
was purchased and installed in our laboratory a few years
ago. The major difference between the system and other
conventional HPGe spectrometers was that it had two sets
of electronics. One set was sensitive to the timing rela-
tionship between signals from the principal and guard
detectors. Each timing electronic chain consisted of a
timing filter amplifier (TFA) and a constant fraction dis-
criminator (CFD). The signals from principal and guard
detectors were fed to separate TFAs. The negative analog
outputs from each TFA were then changed into timing
logic pulses in the CFD. The time logic pulses provided by
the primary detector and the guard detector were then
supplied to the start and stop inputs of a time to amplitude
converter/single channel analyzer (TAC/SCA), respec-
tively. The combined function of the TAC/SCA is to
determine coincidence events and generate gating pulse.
Whenever a coincidence event is detected, the energy
signal from the principal detector will be gated off, causing
the Compton continuum to be suppressed. The system can
also operate in conventional and coincidence counting
modes, but these methods have to run at different time with
a corresponding spectrum.
To be able to do simultaneous anticoincidence and
coincidence counting, the system has been converted into a
digital spectrometer in the study. Instead of using timing
electronic chain to determine the coincidence event, the
analog signals from primary and guard detectors were
connected directly into a Pixie-4 card (XIA LLC) for pulse
height and time coincident measurement. The data
acquired in list-mode (or time stamped) include coinci-
dence events consisting of records of energy and timestamp
from primary and guard detectors. Every single event is
processed and stored in a list-mode format text file for
offline analysis. The simplicity of the present coincidence
system is especially apparent in contrast to the system
associated with many NIM-based analog processing mod-
ules. The advantages of list-mode data acquisition include
individually logging and time stamping each electronic
pulse arising for each gamma-ray or X-ray interacting with
the spectrometer, which allows the simultaneous creation
of several different single, summed, coincident and anti-
coincident spectra from a single measurement. One of the
consequences of list-mode data file offline processing is a
reconstructed spectrum with Compton suppression and
without any full-energy gamma-ray peak efficiency loss.
Experimental
System description and calibration
The primary detector used in this study was an Ortec n-type
GMX HPGe coaxial detector with a crystal diameter of
66.2 mm and a length of 69.0 mm. This detector had a
peak-to-Compton ratio of 60:1 for the 1,332.5 keV peak of60Co, a relative efficiency of 25% with respect to a standard
NaI(Tl) detector at 1,332.5 keV of 60Co, and a resolution
(FWHM) of 0.85 keV at 122.1 keV peak of 57Co. The
HPGe detector endcap was made entirely of carbon fibre to
meet the high radiation transmission requirement. The
guard detector used in the system consisted of a 900 9 900
NaI(Tl) annulus with four photomultiplier tubes (PMTs)
and a 300 9 300 NaI(Tl) plug with one PMT. The peak-to-
Compton plateau ratio of this system was 1,065:1 at the
661.7 keV peak of 137Cs, using the IEEE convention of the
number of counts per channel in the Compton plateau
(358–382 keV). The geometric arrangement of primary
and guard detectors is shown in Fig. 1. As shown in the
figure, the primary HPGe detector was inserted into one
1266 W. Zhang et al.
123
Page 3
end of the NaI(Tl) annular guard detector; and a NaI(Tl)
plug was placed at the other end to maximally detect
photons escaped from the HPGe. Two separate high volt-
age (HV) power supplies (Ortec model 556) were used for
the NaI(Tl) detectors. One of them was connected to the
PMT of the plug detector. Each of the four PMT on the
annulus was connected through a junction box to the other
HV power supply. The outputs from all four PMTs were
collected using T-connection into one cable which was
used for annulus detector waveform signal output.
The data-acquisition system for the spectrometer utilizes
all-digital electronics based on the XIA LLC Digital
Gamma Finder (DGF)/Pixie-4 software and card package
[14]. The Pixie-4 card is a four channel digital pulse-pro-
cessing module. As shown in Fig. 1, the waveform signals
from preamplifier of HPGe, PMTs of NaI(Tl) annulus and
PMT of NaI(Tl) plug detectors were fed into three different
channels of the Pixie-4 card for pulse height and time
coincident measurement. At each channel, the input signals
were continuously sampled and digitized by a 14-bit ADC.
The signal pulse height was determined to 16-bit resolution
by a programmable digital trapezoidal energy filter
implemented in a field-programmable gate array (FPGA).
Event timing and pulse-pileup inspection was also carried
out in the FPGA by a fast programmable trapezoidal trigger
filter. Events were time-stamped at the full ADC rate of
75 MHz. The coincidence time window was also set in the
software with a step of 13.33 ns and a lower limit of
79.33 ns, thus allowing accurate reconstruction of coinci-
dent interactions. Table 1 gives a list of all the coincident
and anticoincident events that were stored in the list-mode
data file.
The Pixie-4 card is deployed on a chassis with Compact
PCI/PXI backplane from National Instruments. A host desktop
PC controls the pulse processing module and performs data
readout. All operating parameters, including the filter values,
are user adjustable in the software on the host PC. The
parameters of trapezoidal trigger and energy filter, such as
trigger threshold, filter rise and flat top time, are optimized by
maximizing the output and input count rate ratio and mini-
mizing the 661.7 keV peak resolution of 137Cs. Whenever a
valid event is detected, a digital signal processor (DSP) reads
out the energy filter values, reconstructs the pulse height, and
bins the energy. In the case of coincidence counting, the DSP
obtains the coincidence pattern of active channels in a given
event. Three certified standard point sources (137Cs, 22Na and60Co) from Eckert and Ziegler Analytics were used for the
energy, resolution and full-energy peak efficiency calibrations
of each detector. By tuning each PMT’s high-voltage supply,
and gain, and offset of each Pixie-4 card input channel, the
same full-energy gamma-ray appears in almost the same center
channel for both NaI(Tl) and HPGe detectors.
System modeling
The system modeling was conducted using the Geant4
Toolkit [15]. All of the data processing and output was
performed through the implementation of abstract inter-
faces for data analysis (AIDA) [16]. The HPGe detector
consisted of a cylinder with a diameter of 66.2 mm and a
height of 69.0 mm, which was placed within a 0.76 mm
thick carbon end cap with an inner diameter of 75.8 mm.
The radioactive source was defined to be either a point
source or a small cylindrical source, either of which were
Fig. 1 Schematic drawing of
the detector arrangement and
Pixie-4 digital multispectral
acquisition spectrometer
Table 1 Allowed coincidence hit patterns by Pixie-4 card
Event descriptions NaI(Tl) plug,
channel-1
HPGe,
channel-2
NaI(Tl) annulus,
channel-3
1. Coincidence between HPGe and NaI(Tl) plug 1 1 0
2. Coincidence between HPGe and NaI(Tl) annulus 0 1 1
3. Triple coincidence in HPGe and NaI(Tl) plug and annulus 1 1 1
4. Anticoincidence between HPGe and NaI(Tl) plug and annulus 0 1 0
Digital Compton suppression spectroscopy 1267
123
Page 4
placed directly on top of the carbon end cap. The NaI(Tl)
annulus had an inner diameter of 91.0 mm and an outer
diameter of 229.0 mm, which was surrounded by alumi-
num shielding of varying thickness. The plug detector was
a solid cylinder of NaI(Tl) that was placed above the ger-
manium detector, in the central hole of the annulus. The
distance of the plug could be changed depending on the
simulation to move the plug closer or farther away from
the end cap and radioactive source. The diameter of the
NaI(Tl) in the plug was 76.2 mm and it was also sur-
rounded by 3.15 mm thick aluminum shielding.
The standard electromagnetic (EM) package was used in
this simulation. It contained the following processes:
photo-electric effect, Compton scattering, pair production,
bremsstrahlung, ionization, multiple scattering, and anni-
hilation. Its effective energy range begins from 100 eV and
0.5
5
50
500
5000
50000
(a)
(b)
0 500 1000 1500 2000
Cou
nts
Energy, keV
HPGe normal spectrum
HPGe-plug coincidence
HPGe-annulus coincidence
HPGe-plug-annulus triple coincidence
HPGe anticoincidence with plug and annulus
0.5
5
50
500
5000
50000
0 500 1000 1500 2000
Cou
nts
Energy, keV
HPGe normal spectrum
HPGe-plug coincidence
HPGe-annulus coincidence
HPGe-plug-annulus triple coincidence
HPGe anticoincidence with plug and annulus
Fig. 2 a List-mode data offline
processed normal, coincidence
and anticoincidence HPGe
gamma-ray spectra of 22Na from
one measurement;
b computational modelling
calculated spectra using Geant4
1268 W. Zhang et al.
123
Page 5
extends up to the TeV energy range. Along with the EM
package the standard decay and radioactive decay physics
processes were also included.
Results and discussion
The 22Na standard point source was measured by the sys-
tem. The list-mode data were collected by the measurement
over 120 s at a 92.66 ns coincidence window. As listed in
Table 1, the data acquired in list-mode included coinci-
dence and anticoincidence events consisting of records of
energy in DSP units and timestamp from HPGe, NaI(Tl)
plug and NaI(Tl) annulus detectors. The list-mode data
collected on an event-by-event basis, which is like
‘‘solidified electronic pulses’’, were stored in a text file for
offline analysis. During offline analysis, the events (or solid
electronic pulses) were initially grouped into different
coincidence and anticoincidence counting mode arrays.
The DSP units for each coincidence and anticoincidence
events in these arrays were divided by detector’s [HPGe or
NaI(Tl)] energy calibration factor, then histogrammed to
gamma–gamma coincident or anticoincident energy spec-
trum, correspondingly. The one-dimensional histogrammed
HPGe spectra in different counting mode obtained by
offline list-mode data process are illustrated in Fig. 2a.
Compared with the HPGe normal spectrum, as shown in
Fig. 2a, the Compton continuum has been extensively
suppressed in the anticoincidence spectrum. However as a
result of the annihilation process, the 511.0 keV peak areas
were significantly reduced by 97%, as listed in Table 2.
The 1,274.5 keV peak areas were also reduced by 86%
compared to HPGe normal spectrum, which is slightly less
than that of 511.0 keV peak. The reason is that there is
about 10% of all the 1,274.5 keV gamma-ray emitted from22Na proceed by electron capture instead of positron decay.
It should also be noted in Table 2 that the rejected 511.0
and 1,274.5 keV counts in anticoincidence counting have
mostly been recorded by other coincidence counting
modes. In the same measurement, the rejected 511.0 keV
gamma-rays in anticoincidence counting have been mostly
registered by the triple coincidence (56%) secondly by the
HPGe and NaI(Tl) plug coincidence (32%); HPGe and
NaI(Tl) annulus coincidence only registered 8%. The
rejected 1,274.5 keV counts in anticoincidence counting
have also been mostly recorded by the triple coincidence
(44%). The HPGe and annulus coincidence counting is
about 37%; while the HPGe and plug coincidence counting
only registered 6%, which shows a different pattern from
that observed with 511.0 keV peak. This is due to the fact
that the two 511.0 keV annihilation gamma-rays emit
always with an angle of 180� between each other.
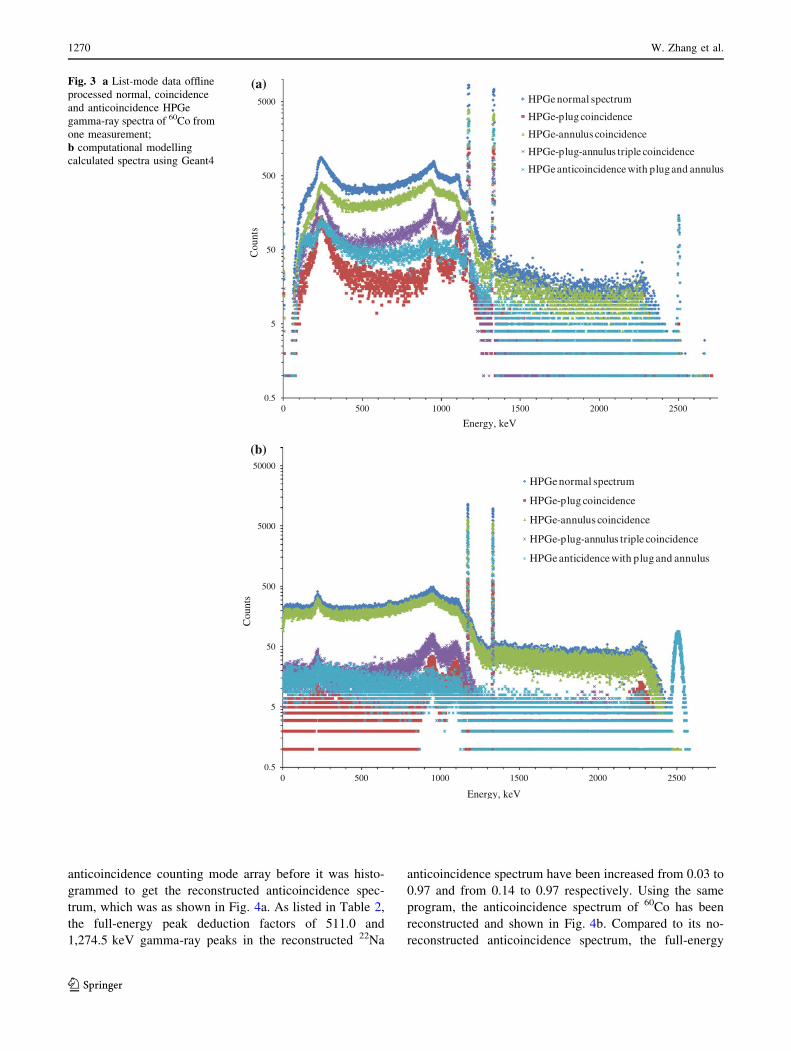
The 60Co standard source was also measured by the
system. Using the same procedure, the spectra in different
counting mode obtained by offline list-mode data process
were illustrated in Fig. 3a. The 60Co decays primarily by
the emission of two coincident gamma-rays with a mean
life time of 8 9 10-13 s for the 1,332.5 keV gamma-ray
excited state. This time is so short that the events detected
by the HPGe detector and the NaI(Tl) annulus or plug
detector will be seen as taking place at the same time and
be rejected as a Compton event. As shown in Fig. 3a, in the
anticoincidence spectrum, the peak areas of 1,173.2 and
1,332.5 keV gamma-rays are reduced both by 70% com-
pared to the normal HPGe spectrum. As listed in Table 2,
the rejected counts in anticoincidence counting have been
registered mostly by the HPGe and annulus coincidence
counting (about 47% for both), then followed by HPGe and
plug coincidence counting (about 16% for both), and the
triple coincidence (about 8% for both). The coincidence
recovery rates of the two gamma-ray peaks show the same
behaviours.
A computer program was made that could specifically
search all the 511.0 and 1,274.5 keV peaks in different
coincidence counting spectra and select relevant evens or
solid pulses in these coincidence counting mode arrays
created by offline list-mode data processing in the 22Na
measurement. These selected events were then added to the
Table 2 The peak areas in different counting mode from the 22Na and 60Co measurement as shown in Figs. 2a and 3a
Gamma-ray energy (keV) The counts of peak area
Coincidence Anticoincidence
HPGe-plug, HPGe-annulus, triple No-constructed, constructed
By the 22Na measurement
511.0 121,962 (0.32), 24,985 (0.08), 201,126 (0.56) 14,788 (0.03), 354,664 (0.97)
1,274.5 5,032 (0.06), 24,313 (0.37), 35,650 (0.44) 11,019 (0.14), 73,393 (0.97)
By the 60Co measurement
1,173.2 16,872 (0.15), 33,936 (0.47), 8,298 (0.09) 41,866 (0.30), 92,977 (0.99)
1,332.5 15,322 (0.16), 27,973 (0.47), 5,811 (0.08) 34,705 (0.29), 82,300 (0.99)
The full-energy peak efficiency deduction factors (i.e. the ratios of corresponding peak area to normal spectrum) are listed in bracket
Digital Compton suppression spectroscopy 1269
123
Page 6
anticoincidence counting mode array before it was histo-
grammed to get the reconstructed anticoincidence spec-
trum, which was as shown in Fig. 4a. As listed in Table 2,
the full-energy peak deduction factors of 511.0 and
1,274.5 keV gamma-ray peaks in the reconstructed 22Na
anticoincidence spectrum have been increased from 0.03 to
0.97 and from 0.14 to 0.97 respectively. Using the same
program, the anticoincidence spectrum of 60Co has been
reconstructed and shown in Fig. 4b. Compared to its no-
reconstructed anticoincidence spectrum, the full-energy
0.5
5
50
500
5000
(a)
(b)
0 500 1000 1500 2000 2500
Cou
nts
Energy, keV
HPGe normal spectrum
HPGe-plug coincidence
HPGe-annulus coincidence
HPGe-plug-annulus triple coincidence
HPGe anticoincidence with plug and annulus
0.5
5
50
500
5000
50000
0 500 1000 1500 2000 2500
Cou
nts
Energy, keV
HPGe normal spectrum
HPGe-plug coincidence
HPGe-annulus coincidence
HPGe-plug-annulus triple coincidence
HPGe anticidence with plug and annulus
Fig. 3 a List-mode data offline
processed normal, coincidence
and anticoincidence HPGe
gamma-ray spectra of 60Co from
one measurement;
b computational modelling
calculated spectra using Geant4
1270 W. Zhang et al.
123
Page 7
peak efficiency deduction factors of 1,173.2 and 1,332.5 keV
gamma-rays were increased from about 0.30 to 0.99. The
background resulting from Compton scatters in both
reconstructed anticoincidence spectra could still be kept
low as before.
The multiple spectra of 22Na and 60Co in Figs. 2b and
3b were obtained by Geant4 simulations. The comparison
of simulated and experiment spectra in Figs. 2 and 3 show
an overall agreement between the measurement and sim-
ulation, except the presence of the apparent Compton
continuum discrepancy in the different counting modes.
Generally, the simulation gives lower Compton continuum
than those obtained by measurement with the exceptions
of HPGe-plug coincidence of 22Na measurement and
0.5
5
50
500
5000
50000
(a)
(b)
0 500 1000 1500 2000
Cou
nts
Energy, keV
HPGe normal spectrum
Reconstructed HPGe anticoincidence with plug and annulus
0.5
5
50
500
5000
0 500 1000 1500 2000 2500
Cou
nts
Energy, keV
HPGe normal spectrum
Reconstructed HPGe anticoincidence with plug and annulus
Fig. 4 Comparison of the
HPGe normal gamma-ray
spectrum and reconstructed
anticoincidence spectrum from
the same measurement by 22Na
(a) and 60Co (b)
Digital Compton suppression spectroscopy 1271
123
Page 8
HPGe-annulus coincidence of 60Co measurement. The
discrepancy may be possibly attributed to the contributions
of shielding materials that is not included in the Geant4
simulation code and to the lack of precise dimension of the
crystal and its position in the detector housing. Even if the
differences between the simulated and measured responses
are mainly caused by inaccuracies in the modeling of the
physical geometry and material behaviour, the gaps can be
made smaller by properly optimizing the integrated para-
metric timing of the trapezoidal trigger and energy filters,
as well as pulse fitting. The events in the simulation do not
involve any electronic timing parameters. It always gives
the best case scenarios in the timing. Comparing simulated
Compton continuum with experimental results may be a
good way of shedding light on many distinctive features of
experiment spectra and could be used to predict and opti-
mize the performance of the system to get the best coin-
cidence/anticoincidence counting.
Conclusions and future work
In this study, an Ortec Compton suppression system has
been converted into a digital spectrometer that is able to do
simultaneous gamma–gamma anticoincidence and coinci-
dence multispectral counting with list-mode data acquisi-
tion. It has been demonstrated that the reconstructed HPGe
anticoincidence spectra by 22Na and 60Co point sources
have significant Compton background suppression without
any gamma-ray coincidence-summing losses at their full-
energy photon peaks. The gamma–gamma coincident event
distributions in different parts of the NaI(Tl) guard detector
with HPGe primary detector for 511.0, 1,274.5, 1,173.2
and 1,332.5 keV photons are also studied. It has been
shown that a significant coincidence pattern in various
parts of guard detector exists due to gamma–gamma
directional correlation by different radioactive decay
modes. Future development of the spectroscopy includes
the integrated parametric timing optimization and a com-
parative study of analog and digital detector systems to
increase the peak to Compton ratio of the newly developed
digital system. A computer program is also under devel-
opment for processing complex spectra containing several
unknown nuclides.
References
1. Kapsimalisa R, Landsbergera S, Ahmedb YA (2009) The deter-
mination of uranium in food samples by Compton suppression
epithermal neutron activation analysis. Appl Radiat Isot 67(12):
2097–2099
2. Landsberger S, Kapsimalis R (2009) An evaluation of Compton
suppression neutron activation analysis for determination of trace
elements in some geological samples. Appl Radiat Isot 67(12):
2104–2109
3. Nyarko BJB, Akaho EHK, Fletcher JJ, Chatt A (2008) Neutron
activation analysis for Dy, Hf, Rb, Sc, Se in some Ghanaian
cereals, vegetables using short-lived nuclides, Compton sup-
pression spectrometry. Appl Radiat Isot 66(8):1067–1072
4. Nicholson G, Landsberger S, Welch L, Gritzo R (2008) Char-
acterization of a Compton suppression system, the applicability
of Poisson statistics. J Radioanal Nucl Chem 276(3):577–581
5. Stover T, Lamaze G (2005) Compton suppression for neutron
activation analysis applications at the national institute of stan-
dards, technology (NIST). Nucl Instrum Methods Phys Res Sect
B: Beam Interact Mater Atoms 241(1–4):223–227
6. Nyarko BJB, Bredwa-Mensah Y, Serfor-Armah Y, Dampare SB,
Akaho EHK, Osae S, Perbi A, Chatt A (2007) Investigation of
trace elements in ancient pottery from Jenini, Brong Ahafo
region, Ghana by INAA and Compton suppression spectrometry.
Nucl Instrum Methods Phys Res Sect B: Beam Interact Mater
Atoms 263(1):196–203
7. Bacchi MA, Santos LGC, De Nadai Fernandes EA, Bode P,
Tagliaferro FS, Franca EJ (2007) INAA with Compton suppres-
sion: how much can the analysis of plant materials be improved?
J Radioanal Nucl Chem 271(2):345–351
8. Nyarko BJB, Akaho EHK, Fletcher JJ, Zwicker B, Chatt A
(2006) Simultaneous determination of short-to-medium lived
nuclides in Ghanaian food items using INAA, Compton sup-
pression counting. J Radioanal Nucl Chem 270(1):243–248
9. Zhang W, Chatt A (1998) Compton suppression spectrometry
coupled to instrumental neutron activation for iodine in biological
materials. Trans Am Nucl Soc 78:95–96
10. Zhang W, Chatt A (2000) Determination of vanadium by
instrumental neutron activation analysis in conjunction with
Compton suppression gamma-ray spectrometry. Trans Am Nucl
Soc 83:486–488
11. Zhang W, Chatt A (2000) Determination of copper by neutron
activation analysis in conjunction with Compton suppression
gamma spectrometry. Trans Am Nucl Soc 82:92–93
12. Zhang W, Chatt A (1997) Compton suppression spectrometry for
arsenic in biological reference materials. Trans Am Nucl Soc
77:11–12
13. Paulus TJ, Keyser RM (1991) Compton suppression systems for
environmental measurements. In: International conference on
methods and applied radioanalytical chemistry (MARC-II), Kona
14. Hennig W, Chua YX, Tana H, Fallu-Labruyerea A, Warburtona
WK, Grzywaczb R (2007) The DGF Pixie-4 spectrometer:
compact digital readout electronics for HPGe clover detectors.
Nucl Instrum Methods Phys Res Sect B Inter Mater Atoms
263(1):175–178
15. Geant4 Collaboration, Agostinelli S et al (2003) Accelerators,
spectrometers, detectors and associated equipment. Nucl Instrum
Methods Phys Res A 506(3):250–303
16. Vincenzo I, Lorenzo M, Andreas P (2003) Review of the abstract
interfaces for data analysis (AIDA) from a developer’s perspec-
tive. CERN version1.0
1272 W. Zhang et al.
123