1 A Digital PSK31 Meter Building a digital field strength meter for your PSK31 station by George Rothbart, KF6VSG Presented at the ARRL and TAPR 22nd Annual Digital Communications Conference September 19-21, 2003 -- Hartford, Connecticut No need to take notes! This entire presentation is available at www.ssiserver.com/info/pskmeter Phase shift keying—the basics Zero bits are signaled by 180 o phase reversals: To avoid harmonics, the amplitude passes through zero at the instant of the reversal of phase. There is no need to change the amplitude when we don’t change phase. Thus, we might see a signal amplitude like this: Example of a phase reversal PSK31 signaling These phase changes occur every 32 milliseconds (31.25 Hz). Why this rate? Because: n It can be easily derived from the 8KHz signal generated by your sound card (8000 Hz divided by 256 = 31.25 Hz), and n 30 or so bits per second translates to about 50 wpm, the fastest you can type. A zero (space) is defined as a 180 degree phase reversal from the prior sample, A one (mark) is defined as no phase change from the prior sample. PSK31 signaling Phase shift by 180, bit is a ‘0’ Phase shift by 180, bit is a ‘0’ Phase shift by 180, bit is a ‘0’ Phase shift by 180, bit is a ‘0’ Phase unchanged, bit a a ‘1’ Therefore, this signal is detected as 00100, which we will soon see is the representation of the character “SPACE”. PSK31 signaling Let’s look at PSK31 in the real world on an oscilloscope: PSK31 sequence of zero bits Same signal shifted 1 bit (32 msec) Notice that when we shift the signal one bit width (32 msec), and compare, the phase shift of 180 degrees is clear. This also gives us a clue for how PSK-31 is detected and converted back to the digital world. The PSK-31 Station Sound Card PSK-31 Application COM Port DTR or RTS of, COMn* Computer HF Transceiver Antenna Mic Input* Speaker Out a b* a=Line In b=Line Out *=not needed to monitor RF Out
Transcript
1
A Digital PSK31 MeterBuilding a digital field strength meter for your
PSK31 station
by
George Rothbart, KF6VSG
Presented at the
ARRL and TAPR 22nd Annual
Digital Communications ConferenceSeptember 19-21, 2003 -- Hartford, Connecticut
No need to take notes! This entire presentation is available at www.ssiserver.com/info/pskmeter
Phase shift keying—the basicsZero bits are signaled by 180o phase reversals:
To avoid harmonics, the amplitude passes through zero at the instant of the reversal of phase. There is no need to change the amplitude when we don’t change phase. Thus, we might see a signal amplitude like this:
Example of a phase
reversal
PSK31 signaling
These phase changes occur every 32 milliseconds (31.25 Hz). Why this rate? Because:
n It can be easily derived from the 8KHz signal generated by your sound card (8000 Hz divided by 256 = 31.25 Hz), and
n 30 or so bits per second translates to about 50 wpm, the fastest you can type.
A zero (space) is defined as a 180 degree phase reversal from the prior sample,
A one (mark) is defined as no phase change from the prior sample.
PSK31 signaling
Phase shift by
180, bit is a ‘0’
Phase shift by
180, bit is a ‘0’
Phase shift by
180, bit is a ‘0’
Phase shift by
180, bit is a ‘0’
Phase unchanged,
bit a a ‘1’
Therefore, this signal is detected as 00100, which we will soon see is the representation of the character “SPACE”.
PSK31 signalingLet’s look at PSK31 in the real world on an oscilloscope:
PSK31 sequence
of zero bits
Same signal
shifted 1 bit (32 msec)
Notice that when we shift the signal one bit width (32 msec), and compare, the phase shift of 180 degrees is clear. This also gives us a clue for how PSK-31 is detected and converted back to the digital world.
The PSK-31 Station
Sound Card
PSK-31 Application
COM Port
DTR orRTS of,COMn*
Computer
HFTransceiver
Antenna
MicInput*
SpeakerOut
a
b*
a=Line Inb=Line Out
*=not needed to monitor
RFOut
2
Tuning up in PSK-31
n Improperly tuned PSK-31 can result in uUndermodulation—your signal will
be too weak to be received or copied
uOvermodulation—your signal will have high Intermodulation Distortion (IMD) and splatter, and possibly will have poor copy also.
Tuning up in PSK-31
n Tuning up involves settingu Transceiver RF frequency
u Transceiver microphone gain
u Transceiver power setting
u Turning off the speech processor
u Turning off AGC
u Sound card line out audio level
Setting Audio Levelsn It’s all in the Window’s “mixer.”
n At the mixer’s main display…
n De-select everything but “Wave” (that’s your line out).
n Set the Wave volume to maximum.
n Now you can adjust the sound level by the Volume Control slider.
Setting the audio leveln Click “TX” button of your PSK-31
software, so that you are sending an idle PSK signal to the transceiver.
n Starting with the maximum sound level, observe the transmitter’s power output and back off the mixer’s audio level until the power level is at about 50%.
n You should observe an S-shaped curve like the one I measured at 1500 Hz.
n The proper audio level in this case would be about 50% of maximum.
0
10
20
30
40
50
60
70
80
90
0 20 40 60 80 100 120
Sound Level (% of Max)
Po
wer
Ou
tpu
t
Setting the audio leveln Avoid the temptation to crank up
the audio level to get more power! n You will only produce horrendous
splatter, have very poor IMD, and be less copiable!
n Properly tuned, you will have a low IMD figure (-25 to –30 dB), and a clean spectrum with maximum copy—a signal you can be proud of.
Setting the Audio Level is not a one-time Adjustment!n The ideal audio level is a function of
audio frequency. What works at 1500 Hz will not be a good setting at 300 Hz or 2500 Hz.
n Your rig’s audio frequency response is not flat over the audio range but peaks in the mid-range from 1000-2000 Hz.
n Audio levels set by your Windows mixer will change as you use other applications.
3
The Oscilloscope Solution
Sound Card
PSK-31 Application
COM Port
DTR orRTS of,COMn*
Computer
HFTransceiver
Antenna
MicInput*
SpeakerOut
a
b*
a=Line Inb=Line Out
*=not needed to monitor
RFOut
Scope
Feed line T’d to scope input
What’s the downside?
n Poor use of a costly resource
n Bulky, power consumptive (not a good solution for a portable PSK-31 station)
n No place to get a good trigger signal
n Still a manual operation (you fiddle with the volume control slider).
An alternate solution: let your computer be your scope
n A computer with display is guaranteed to be available
n Automatic graphical interface (if running a Windows OS)
n Only need to add an Analog to Digital Converter (ADC)
n Can do more than monitor RF—can dynamically set your audio for perfect output!
Adding an ADCn Let’s use a PIC microcontroller as an
inexpensive way to add an 8-bit ADC to your computer.
n The PIC 16F876 comes with a built-in UART that can communicate with your computer’s COM port
n Has a built in I2C (2 wire) bus interface, so you can u Add more memoryu Interface to a USB chip that can
communicate with your computer’s USB port
PIC 16F876
Component Block Diagram
SignalConditioning
ADCHF
Transceiver UART
USB Driver
Computer
CPURAMROM
PowerRegulation
Antenna
I2C Driver
Com Port
USBPort
PCB
PIC 16F876
Signal Processing-Step 1
SignalConditioning
ADCHF
Transceiver UART
USB Driver
Computer
CPURAMROM
PowerRegulation
Antenna
I2C Driver
Com Port USB
Port
PCB
•Signal peak voltage on the feedlineexceeds the 5 volt limitation of the ADC input:
•P= E2/2R. For a 50 ohm load:
E = 10P½. So a 1 watt signal has a peak-voltage that exceeds the maximum ADC input!
•This calls for a resistive voltage divider at the front end and maybe even a Zenerdiode to protect the ADC.
4
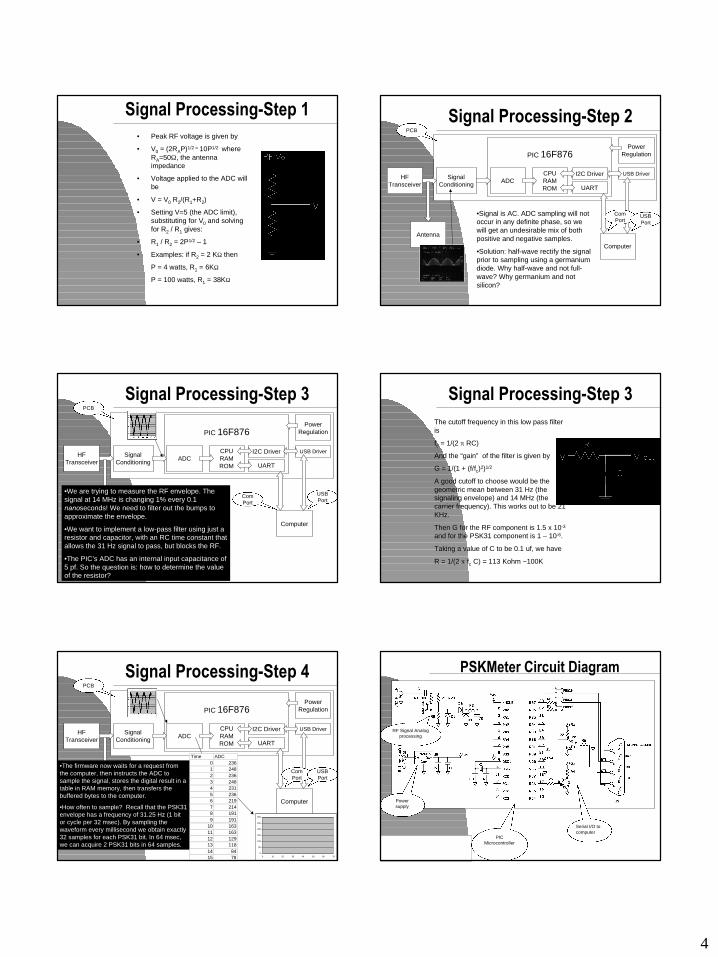
Signal Processing-Step 1 • Peak RF voltage is given by
• V0 = (2RAP)1/2 = 10P1/2 where RA=50Ω, the antenna impedance
• Voltage applied to the ADC will be
• V = V0 R2/(R1+R2)
• Setting V=5 (the ADC limit), substituting for V0 and solving for R2 / R1 gives:
• R1 / R2 = 2P1/2 – 1
• Examples: if R2 = 2 KΩ then
P = 4 watts, R1 = 6KΩ
P = 100 watts, R1 = 38KΩ
R1
R2
PIC 16F876
Signal Processing-Step 2
SignalConditioning
ADCHF
Transceiver UART
USB Driver
Computer
CPURAMROM
PowerRegulation
Antenna
I2C Driver
Com Port
USBPort
PCB
•Signal is AC. ADC sampling will not occur in any definite phase, so we will get an undesirable mix of both positive and negative samples.
•Solution: half-wave rectify the signal prior to sampling using a germanium diode. Why half-wave and not full-wave? Why germanium and not silicon?
PIC 16F876
Signal Processing-Step 3
SignalConditioning
ADCHF
Transceiver UART
USB Driver
Computer
CPURAMROM
PowerRegulation
Antenna
I2C Driver
Com Port
USBPort
PCB
•We are trying to measure the RF envelope. The signal at 14 MHz is changing 1% every 0.1 nanoseconds! We need to filter out the bumps to approximate the envelope.
•We want to implement a low-pass filter using just a resistor and capacitor, with an RC time constant that allows the 31 Hz signal to pass, but blocks the RF.
•The PIC’s ADC has an internal input capacitance of 5 pf. So the question is: how to determine the value of the resistor?
Signal Processing-Step 3 The cutoff frequency in this low pass filter is
fc = 1/(2 π RC)
And the “gain” of the filter is given by
G = 1/(1 + (f/fc)2)1/2
A good cutoff to choose would be the geometric mean between 31 Hz (the signaling envelope) and 14 MHz (the carrier frequency). This works out to be 21 KHz.
Then G for the RF component is 1.5 x 10⁻³
and for the PSK31 component is 1 – 10-6.
Taking a value of C to be 0.1 uf, we have
R = 1/(2 π fc C) = 113 Kohm ~100K
PIC 16F876
Signal Processing-Step 4
SignalConditioning
ADCHF
Transceiver UART
USB Driver
Computer
CPURAMROM
PowerRegulation
Antenna
I2C Driver
Com Port
USBPort
PCB
•The firmware now waits for a request from the computer, then instructs the ADC to sample the signal, stores the digital result in a table in RAM memory, then transfers the buffered bytes to the computer.
•How often to sample? Recall that the PSK31 envelope has a frequency of 31.25 Hz (1 bit or cycle per 32 msec). By sampling the waveform every millisecond we obtain exactly 32 samples for each PSK31 bit. In 64 msec, we can acquire 2 PSK31 bits in 64 samples.
/* wait for the command byte 's' or 'v' to be received from the windows application */
docommand = getc();
while ((command != 's') && (command != 'v'));
if (command == 'v')showversion();
elsesenddata();
while (TRUE);
Copyright & Version Info
Take & report data
Initialization
PC Software Flow Diagram—Part 1
Initialization
Send 's' command tometer
Receive 64 bytesfrom meter, or time
out
Timeout or <64bytes?
"PSK METER NOTRESPONDING"
All channels <=1?
"NO SIGNAL"
Wait 1 measurementtime (e.g., 1 second)
YES
NO
YES
Loop waiting for a valid 64 byte envelope measurement
PC Software Flow Diagram—Part 2
Find Zero Cross(minimum of rectified
envelope)
Rotate array so thatzero phase starts in
first channel
Using a Fourierdecomposition,
compute amplitudesof first 10 harmonics
Normalize amplitudeto unit amplitude
NO
Compute Mean &RMS deviation from
sine function
Raw signal
Phase & Amplitude
Normalized
Time DomainAnalysis
FrequencyDomainAnalysis
Computing RMS and Mean deviation in the time domain:
for i:=1 to 32 do beginerror := s[i] – sin(theta[i]);rms := rms + sqr(error);mean := mean +error;
end;rms := sqrt(rms)/(32);mean := mean/32;
Computing harmonics in the frequency domain:
for j:=1 to 10 dofor i:=1 to 64 do begina[j] := a[j] + s[i]*sin(j*theta[i]);b[j] := b[j] + s[i]*cos(j*theta[i]);end;
Metrics of Distortionn RMS is a time domain metric of the departure of
the signal from a perfect sinusoidal waveform. An RMS of zero indicates a perfect signal. Greater RMS values indicate clipping and other forms of distortion that result in splatter.
n Mean deviation is another time domain metric that is used to establish if the signal is overdriven (over-modulated) or underdriven (under-modulated). If the mean >0, the signal is over modulated. If the mean <0, the signal is under modulated.
n Software can make decisions regarding the quality of the signal based on these two metrics.
n However, we usually think in frequency space…
n The discrete Fourier coefficients, anand bn are the real and imaginary amplitudes of the signal’s fundamental frequency (31.25Hz) and its harmonics (62.5, 93.75, etc.)
n The absolute amplitude at each frequency is sqrt(an
2+ bn2).
n A perfect signal would consist only of the fundamental (n=1). The amplitude of all the harmonics (n>1)would be exactly zero.
n The amount of energy in the harmonics gives us the Inter-modulation Distortion, or IMD. Since the energy is proportional to the square of the amplitude, we have
n IMD = 10 Log10(H/E).
Metrics of Distortion-Part 2
for j:=1 to 10 do
E := E + sqr(a[j])+ sqr(b[j]);
H := E - (sqr(a[1]) + sqr(b[1]));
F := H/E;
IMD := 10*log10(F);
Metrics of Distortion—Part 3
n IMD = 10 Log10(H/E)n Since the energy in the harmonics
will always be less than the total energy, H/E will always be a fraction, so IMD will always be negative.
n IMD is quoted in units of dB.n Large absolute IMD is better.
Smaller absolute IMD is worse.
7
Example: IMD vs. Clipping
-40
-35
-30
-25
-20
-15
-10
-5
0
0 20 40 60 80 100
Percentage of Signal Clipping
IMD
in d
b
Perfect signal
20% clipping
50% clipping
To create this example, I simulated a PSK31 signal with a small amount of white noise, and then computed the IMD from the Fourier analysis for various degrees of “clipping”, I.e., flat-topping the signal.
In the real world, an IMD is –30db is excellent. Don’t expect to do better. An acceptable IMD (one that won’t result in noticeable splatter) would be in the range of –20 to –30.
If you are getting IMD reports of –10, you are splattering all over the band!
PC Software Flow Diagram—Part 3
RMS > 0.20?"SIGNAL OK"
Mean error <0?"UNDERDRIVING"
"SPLATTER!"
YES
NO
YES
NO
RMS > 0.20?"SIGNAL OK"
Mean error <0?"UNDERDRIVING"
"SPLATTER!"
YES
NO
YES
NO
IncreaseAudio Volume
DecreaseAudio Volume
Go to Startfor next
Measurement
PC Software Flow Diagram—Part 4
Automate the system:Add a
proportional negative
feedback loop!
Monitor and Control
n The PSK Meter monitors your RF output and provides a visual, scope-like display to confirm that your signal is clean.
n However, the software also controls the audio level of your sound card to obtain the largest signal without splatter—automatically!
Control variables—what to use?
-40
-35
-30
-25
-20
-15
-10
-5
0
0 1 2 3 4 5 6 7
RMS (%)
IMD
(d
b)
•RMS (deviation from ideal signal), in percent
•IMD (harmonic disortion), in dB
•Average deviation—discerns betweenovermodulation and undermodulation
In most cases, RMS and IMD can be
used interchangablyas the control
variable
A graphical look at feedback
n Plot the peak PSK31 envelope vs audio level.
n Notice that clipping occurs for the top 1/3 in audio level.
n Define underdriving as the bottom 1/3 in audio level.
n The feedback loop in the software attempts to find and place the audio level in the middle third, tending to the largest signal without distortion.
0
0.51
1.5
2
2.5
3
3.54
4.5
5
0 20 40 60 80 100 120
Audio Level (%)
RF
En
velo
pe
(Vo
lts)
Distortion RegionUndermodulation
Region
Region of Optimum
Audio Level
8
A look at the PSKMeter Software
n When PSKMeter is launched, it displays the COM port it uses to connect to the PSKMeter hardware.
n If the hardware fails to respond, a message is displayed.u Wrong COM Port
u No serial cable
u No PSKMeter hardware
u PSKMeter hardware not powered up
COM Port to
hardware
Audio Level
IndicatorError reported
A look at the PSKMeter Software
n If the hardware connects, the software periodically issues a request for waveform sample.
n When you are not in transmit mode, no signal is returned.
Absence of Signal
A look at the PSKMeter Softwaren In transmit mode, the RF
output is periodically sampled and displayed.
n The best-fit sine wave curve is displayed. Variation of the signal from this sine wave is a measure of distortion.
n RMS variation from the sine wave is displayed.
n IMD is displayed.n If RMS is small and IMD is
large, the indication “SIGNAL OK” is displayed. Your signal is clean, and no adjustment (automatic or manual) is necessary.
RMS variation of
signal
Distortion figure Sound
Card Audio Level
Best fit sine wave
A look at the PSKMeter Softwaren If you are over-driving your
transmitter, your signal is going to show visible evidence of distortion.
n Example: flat-topping (clipping).
n The RMS will be large and the IMD will be small.
n The result is splatter, as indicated. You are causing interference to other portions of the band, and your signal will not be as copiable!
n When in automatic mode, the software will automatically reduce the sound card’s audio level to completely remove the splatter.
Signal shows
“flattoping”
A warning is displayed
Too much audio!
A look at the PSKMeter Softwaren If you are under-driving your
transmitter, your signal will be weak and noisy, but not distorted.
n Because your signal is weak, you will not be ascopiable.
n When in automatic mode, the software will automatically increase the sound card’s audio level, boosting your output power without introducing distortion. Feeble
audioA warning
is displayed
PSKMeter Benefit:
n Bottom line: PSKMeterautomatically finds the “sweet spot” in the audio level setting that outputs the highest power from your transmitter without creating splatter.
Low audio=Poor S/N (noisy),
Poor copy
High Audio=Poor IMD (splatter),
Poor copy
“Sweet spot”=Highest possible output power with
good IMD (no splatter)
9
PSKMeter User Interface
n Right-click on the meter brings up the user interface menu:
n Com port selection
n Mode selection (PSK31/PSK63)
n Refresh (sampling) rate
n Force window to be always visible
n View data numerically
n Force automatic control of audio level
n Gain selection
n Desired IMD selection
n Noise (floor) threshold
n Maximum power emission selection
n Sound card selection
Mode Selectionn “Standard” mode is PSK31
(31.25 Hz = 32 msec per bit)
n Recently we have the ability to transmit PSK63 (62.50 Hz = 16 msec per bit)
n By selecting PSK63, a command it sent to the firmware that instructs it to use ½ msec sampling time instead of 1 msec. Everything else works the same way.
Maximum Power Selection
n PSKMeter is capable of controlling the power output to a specified level
n From P=E2/2R = E2/100, we know the peak RF voltage given an average power level (i.e., E=10 sqrt(P)).
n But what is the relationship between the peak voltage seen at the ADC to the peak RF voltage?
ADC voltage vs RF voltagen Shown below is a measurement of the
signal at the ADC as a function of the RF peak voltage:
ADC voltage vs RF voltage (QRP setting)
y = -0.0032x2 + 0.1995x - 0.0144
0
0.5
1
1.5
2
2.5
3
3.5
0 5 10 15 20 25 30 35
RF peak voltage
AD
C p
eak
volt
age
n Notice that the relationship is linear only for low power. The function is well approximated by a cubic polynomial over a wide range of power.
n Thus, given a desired power level, the software computes the RF peak voltage, then using this polynomial fit to the empirical data determines the voltage at the input to the ADC.
n The software then sets the audio level to obtain this voltage, thereby achieving the desired radiated power.
Maximum Power Selection Building one for yourselfn Circuit diagram, parts list,
assembly instructions,pskmeter.exe and firmware hex file are available at no charge at http://www.ssiserver.com/info/pskmeter.
n Alternatively, PSKMeter is available in kit form; ordering can be done via a link at the same web site page shown above.
n Use one of the RS232 control lines to power the circuit—eliminates the need of a power adapter (wall wart)(adds dependencies on specific com port implementations—will it work for all computers and laptops?)
n Use an op-amp IC with diodes to obtain precision rectification—increases accuracy of the IMD calculation (714 lacks bandwidth, LM318 is fussy and tends to oscillate; high speed op-amp will add to cost)
Future Enhancements Future Enhancementsn Port the existing pskmeter.exe
application to a DLL (with a published API), to be accessed at first by Digipan and MixW and would allow Digipan and MixW to embed and incorporate PSKMeter functionality.
n Modify hardware to pass the PTT control signal to the rig interface--only a single COM port would be required.PSKMeter would be “in line” between the computer and the rig interface. Also, PSKMeter would know when the transmitter is keyed up eliminating the need to poll the hardware when in receive mode.
n Include rig interface circuitry on thePSKMeter printed circuit board, further reducing the complexity to the user (and the need for a separate rig interface) (adds parts and costs, but would be optional)
Future Enhancements Where to go for more infowww.ssiserver.com\info\pskmeter. Download a copy of this presentation in PDF format (starting Monday), assembly instructions, circuit diagrams, firmware and software, software upgrades, order PSKMeter kits, readFAQs, etc.
Attend Steve Ford’s WB8IMY talk “Introduction to PSK31” tomorrow at 1pm in Windor I.
Wireless Digital Communications: Design and Theory, Tom McDermott, N5EG