A discrete-continuous model of freight mode and shipment size choice Megersa Abate (presenter), The Swedish National Road and Transport Research Institute (VTI); Inge Vierth, VTI ; Gerard de Jong, Significance, Uni. of Leeds, CTS, Stockholm
Transcript
A discrete-continuous model of freight mode and shipment
size choice
Megersa Abate (presenter), The Swedish National Road and Transport Research Institute
(VTI);
Inge Vierth, VTI ; Gerard de Jong, Significance, Uni. of Leeds, CTS, Stockholm
Introduction – The Swedish National Freight Model
• The main feature of the Swedish freight transport model (SAMGODS) is incorporation of a logistic model component in the traditional freight demand modeling framework
• The SAMGODS model consists of
1. Product specific demand PC-matrices (producers-consumers)
2. Logistics model (LOGMOD)
3. Network model
Structure of SAMGODS model: ADA
ADA model based on de Jong and Ben-Akiva (2007)
Aggregate flows PWC flows OD Flows Assignment Disaggregation A C Aggregation B Disaggregate firms Firms Shipments and shipments (agents) Logistic decisions
Introduction: Deterministic cost minimization
• The current logistic model is based on a deterministic cost minimization model where firms are assumed to minimize annual total logistic cost [G(.)]
argmin
• The cost trade-off involves order costs; transport, consolidation and distribution costs; cost of deterioration and damage during transit; capital holding cost; inventory cost; stock-out costs
Limitation of the current logistic model
• The current logistic model lacks two mains elements:
1. other determinants of shipment size and transport chain choice ( decisions are solely based on cost)
2. stochastic element ( it is deterministic)
Objective of the current project
• This project is a first step towards estimating a full random/stochastic utility logistic model
• We formulate econometric models to analyze the determinants of firms’ transport chain and shipment size choices
• Parameter estimates from this model will later be used to set-up a stochastic logistic model
• Estimation of elasticity for policy analysis
Stochastic logistic model
• A full random utility logistic model was planned but has not yet been estimated on disaggregate data ( de Jong and Ben-Akiva, 2007)
• The model is specified as:
Ul = -Gl – l
where Ul is the utility derived from logistics and transport chain choice, Gl is logistics cost, and l is a random variable
Modeling framework
• The main econometric work involves modeling the interdependence between shipment size and transport chain choices
• This interdependence implies the use of a joint ( e.g. discrete-continuous) econometric model to account for the simultaneity problem
Econometric model
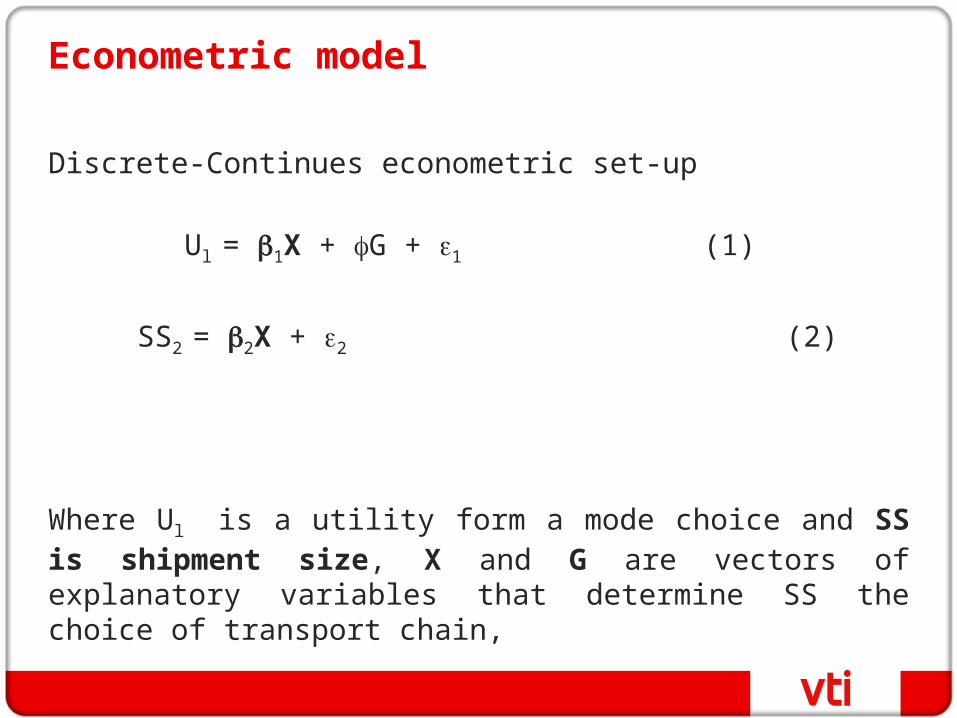
Discrete-Continues econometric set-up
Ul = 1X + G + 1 (1)
SS2 = 2X + 2 (2)
Where Ul is a utility form a mode choice and SS is shipment size, X and G are vectors of explanatory variables that determine SS the choice of transport chain,
Modeling approaches in the literature
1. An independent discrete mode choice model (which is the most common formulation)
Ul = 1X + 1 (1)
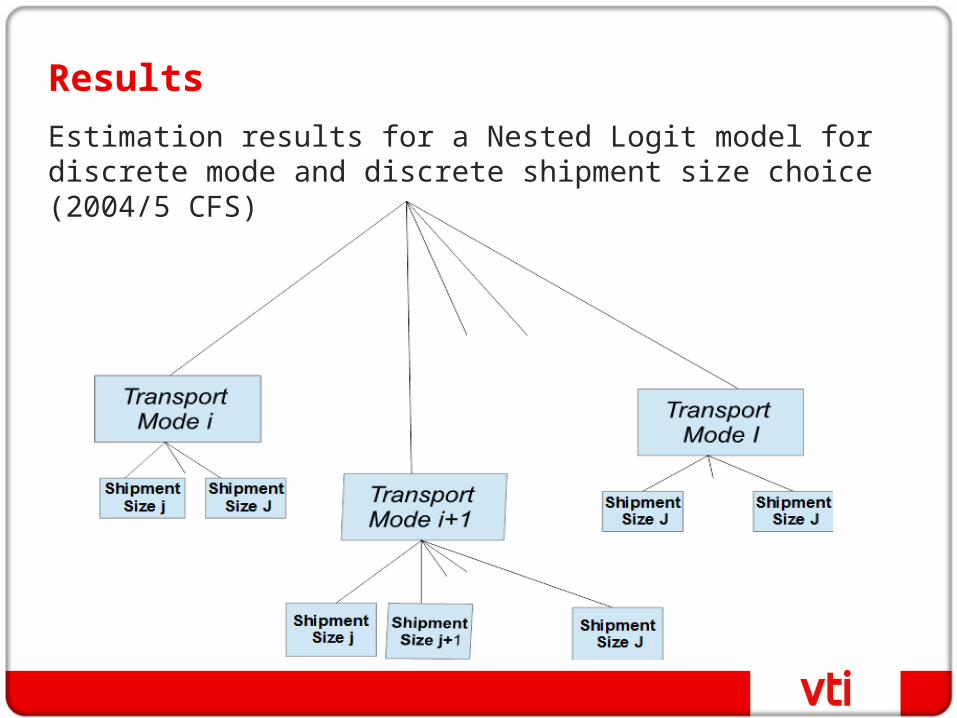
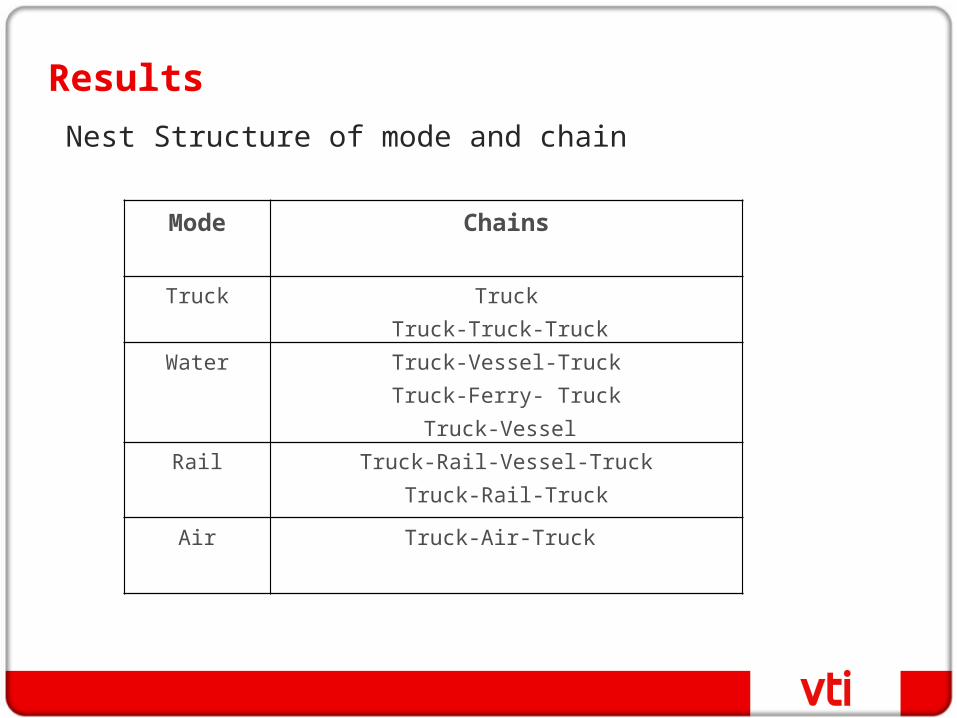
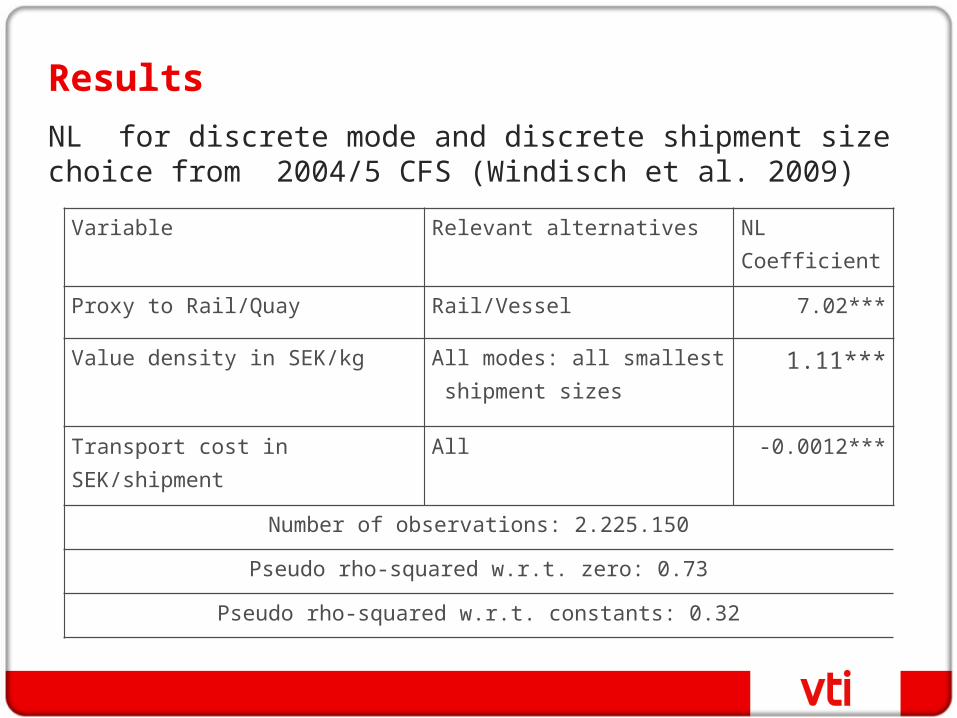
2. A joint model with discrete mode and discrete shipment size choice (e.g. Chiang et al. 1981; de Jong, 2007; Windisch et al. 2009)
Ul = 1X + G + 1 (1’)
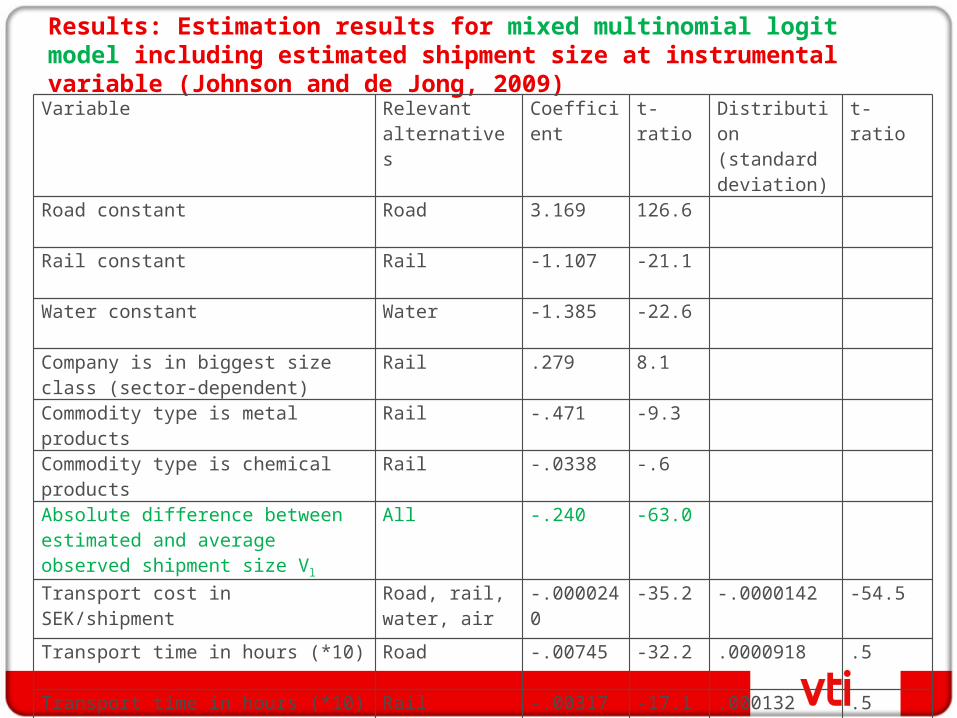
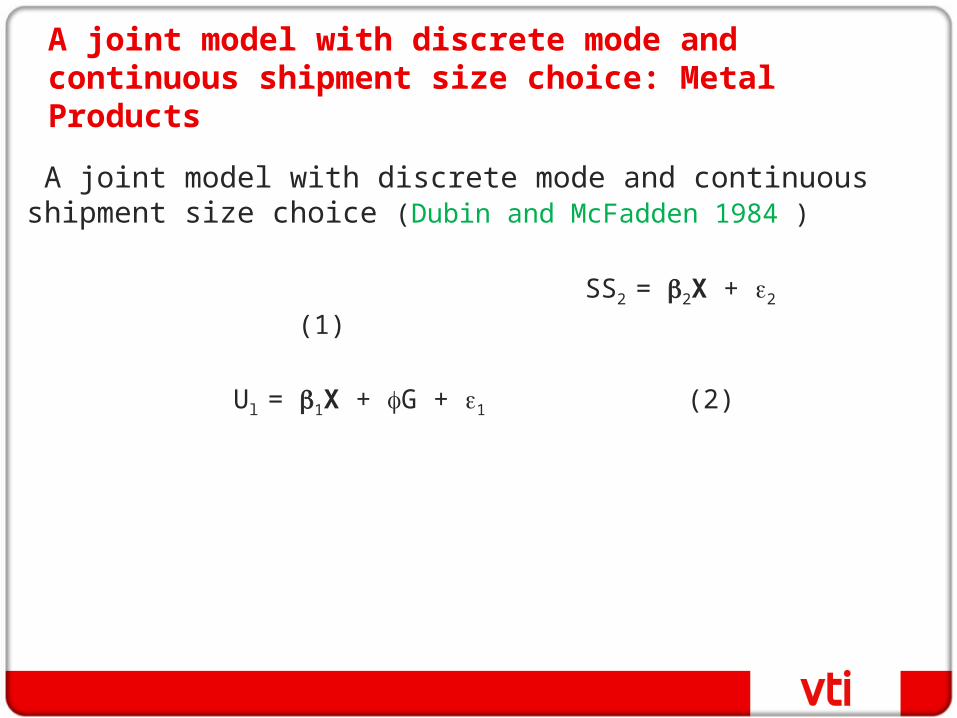
3. A joint model with discrete mode and continuous shipment size choice ( Abate and de Jong, 2013; Johnson and de Jong, 2010; Dubin and McFadden 1984; Abdelwahab and Sargious,1992;Holguín-Veras ,2002)
Ul = 1X + G + 1 (1)
SS2 = 2X + 2 (2)
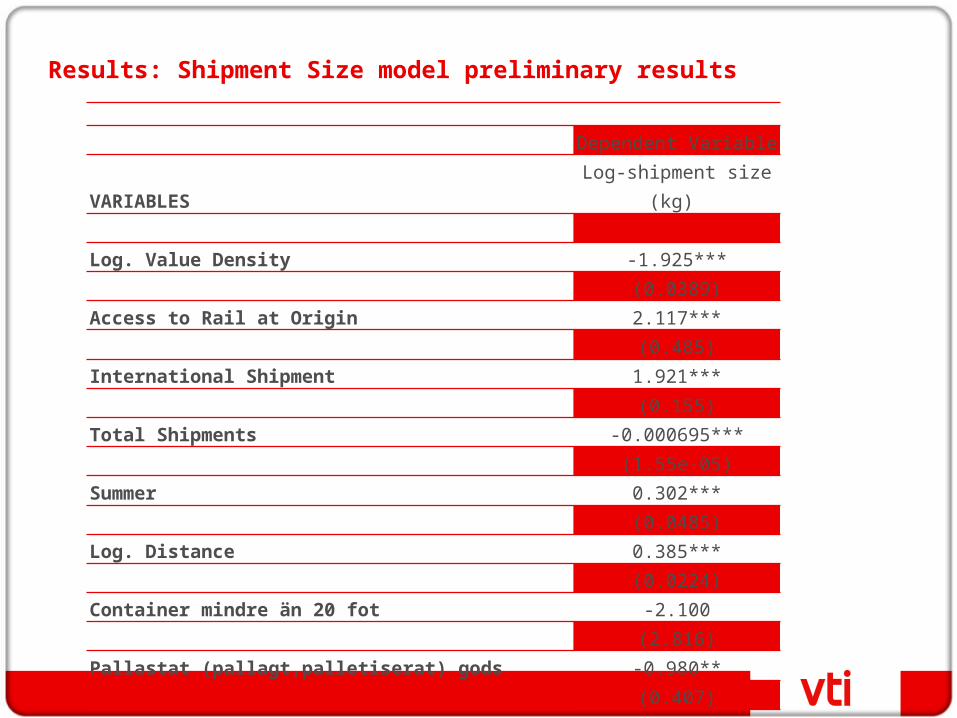
Determinants of shipment size/transport chain choice
Variables (in X and G) Effect on SS Effect on mode/chain choice
Transport Cost Negative
Transport Time Negative
Value Density Negative ?
Access to Rail/Quay ? ?
Firm Characteristics ? ?
Network Characteristics ? ?
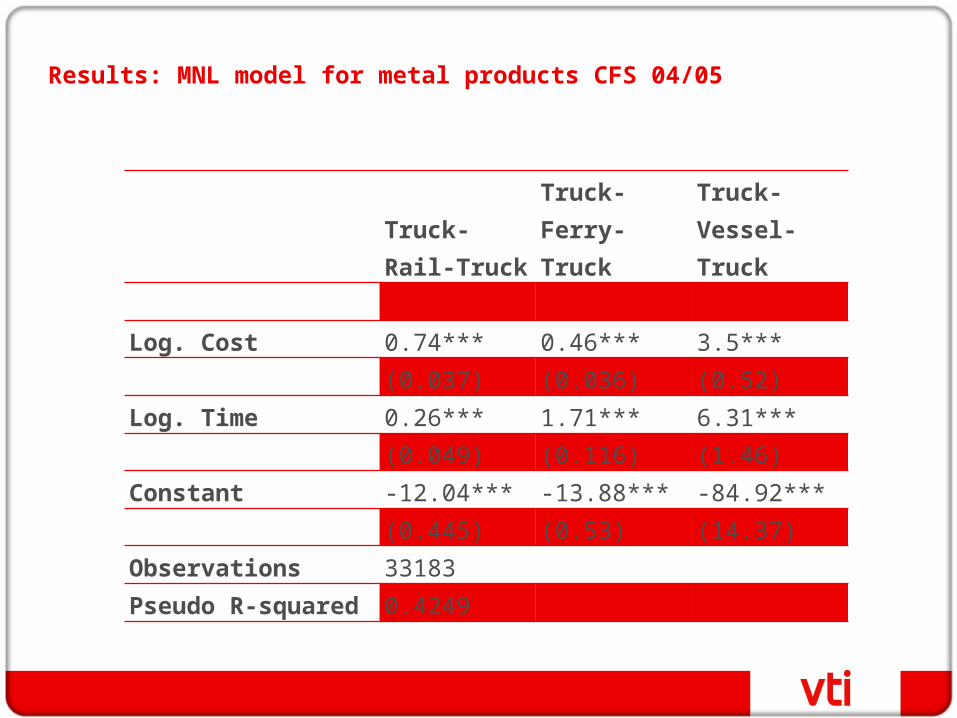
Data
Main data source :
- National Commodity Flow Survey 2004/05 (CFS) based on the US CFS
- Network data – mainly transport time and cost variables from the logistics module of SAMGODS
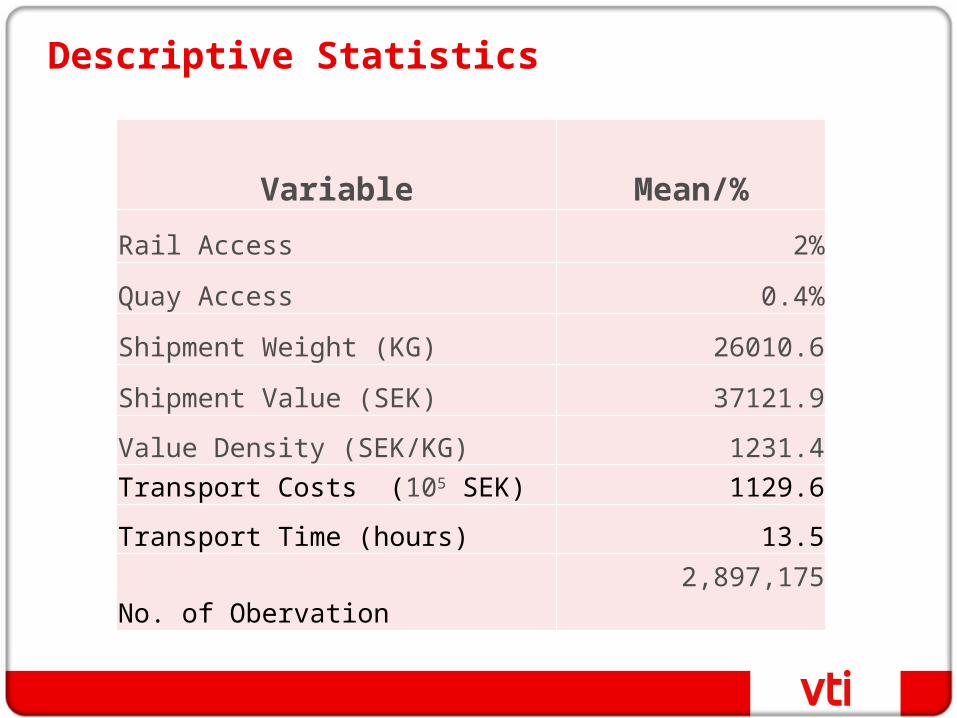
Descriptive Statistics
Variable Mean/%
Rail Access 2%
Quay Access 0.4%
Shipment Weight (KG) 26010.6
Shipment Value (SEK) 37121.9
Value Density (SEK/KG) 1231.4
Transport Costs (105 SEK) 1129.6
Transport Time (hours) 13.5
No. of Obervation 2,897,175
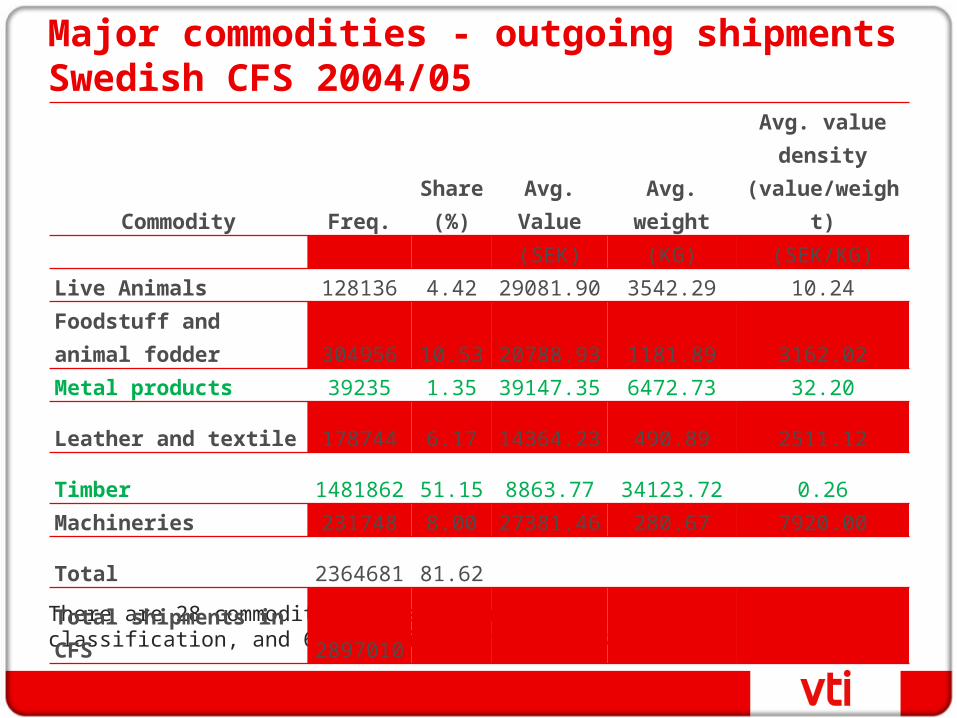
Major commodities - outgoing shipments Swedish CFS 2004/05
There are 28 commodity groups in the CFS based on the SAMGODS classification, and 6 commodities make up 80% of the shipment
Results: Marginal Effects of cost – Truck-Rail-Truck
0.2
.4.6
.8E
ffect
s o
n P
r(M
odec
hain
_S=
=1
21)
0 2 4 6 8 10 12 14 16 18logcost
Average Marginal Effects of logcost
Results: Marginal Effects of cost – Truck-Ferry-Truck
-.2
0.2
.4.6
Effe
cts
on
Pr(
Mod
echa
in_S
==
131
)
0 2 4 6 8 10 12 14 16 18logcost
Average Marginal Effects of logcost
Results: Marginal Effects of cost – Truck-Vessel-Truck
2.8
33.
23.
43.
6E
ffect
s o
n P
r(M
odec
hain
_S=
=1
41)
0 2 4 6 8 10 12 14 16 18logcost
Average Marginal Effects of logcost
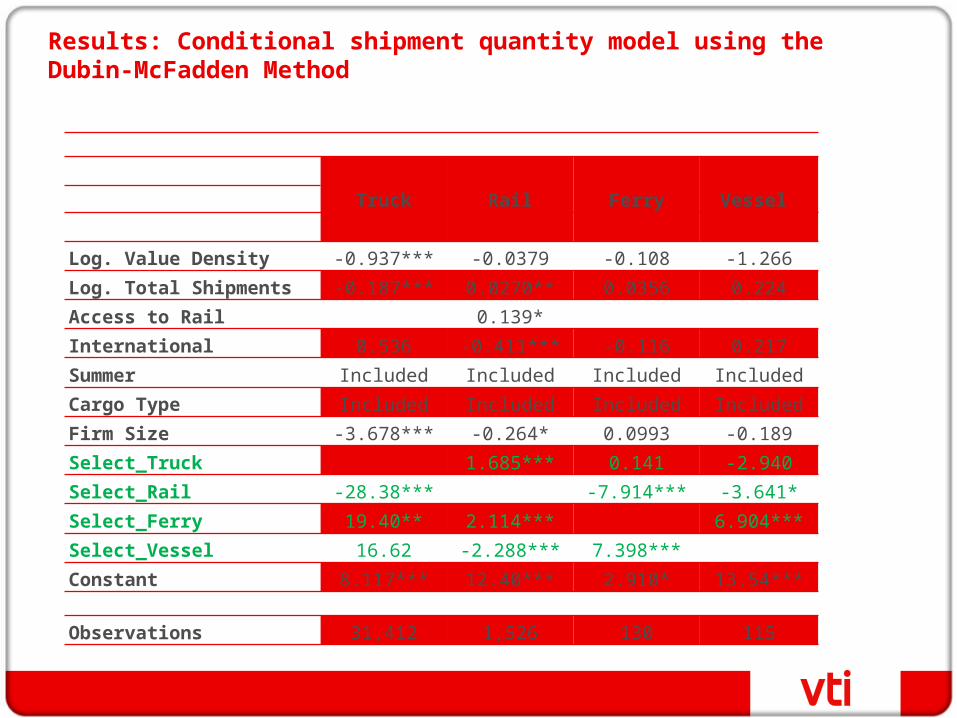
Results: Conditional shipment quantity model using the Dubin-McFadden Method
Truck Rail Ferry Vessel
Log. Value Density -0.937*** -0.0379 -0.108 -1.266
Log. Total Shipments -0.187*** 0.0270** 0.0356 0.224
Access to Rail 0.139*
International 0.536 -0.411*** -0.116 0.217
Summer Included Included Included Included
Cargo Type Included Included Included Included
Firm Size -3.678*** -0.264* 0.0993 -0.189
Select_Truck 1.685*** 0.141 -2.940
Select_Rail -28.38*** -7.914*** -3.641*
Select_Ferry 19.40** 2.114*** 6.904***
Select_Vessel 16.62 -2.288*** 7.398***
Constant 8.117*** 12.40*** 2.910* 13.54***
Observations 31,412 1,526 130 115
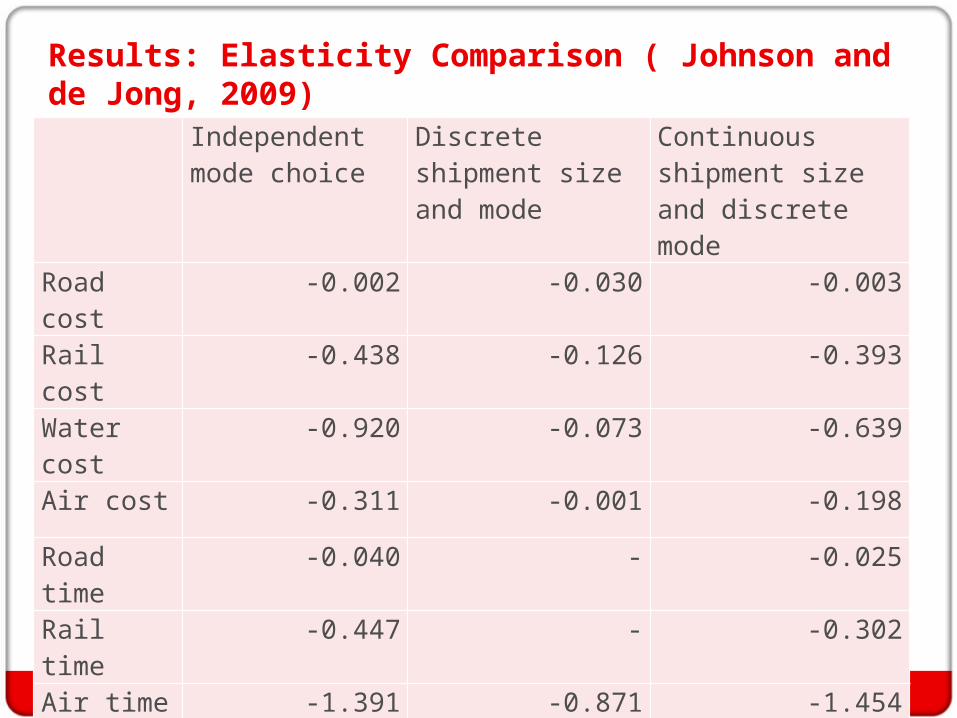
Results: Elasticity Comparison ( Johnson and de Jong, 2009) Independent
mode choiceDiscrete shipment size and mode
Continuous shipment size and discrete mode
Road cost -0.002 -0.030 -0.003
Rail cost -0.438 -0.126 -0.393
Water cost -0.920 -0.073 -0.639
Air cost -0.311 -0.001 -0.198
Road time -0.040 - -0.025
Rail time -0.447 - -0.302
Air time -1.391 -0.871 -1.454
Conclusions
Transport Cost , Transport Time and Firm characteristics such as access to rail and quay at origin are important determinants of transport chain and shipment size choices.
Low elasticity for road (truck) transport cost
It is important to handle the simultaneous nature of the decisions on mode/transport chain and shipment size choices
Due to large data, estimation can be difficult to utilize the most
1. Abate, M. and de Jong, G. (2013) The optimal shipment size and truck size choice- the allocation of trucks across hauls" manuscript
2. Abdelwahab, W. M. and M. A. Sargious (1992) Modelling the Demand for Freight Transport, Journal of Transport Economics and Policy 26(1), 49-70.
3. Chiang, Y., P.O. Roberts and M.E. Ben-Akiva (1981) Development of a policy sensitive model for forecasting freight demand, Final report. Center for Transportation Studies Report 81-1, MIT, Cambridge, Massachusetts.
4. Dubin, J.A. & McFadden, D.L., 1984. An Econometric Analysis of Residential Electric Appliance Holdings and Consumption. Econometrica, 52 (2), pp.345--362.
5. Holguín-Veras, J. (2002) Revealed Preference Analysis of the Commercial Vehicle Choice Process, Journal of Transportation Engineering, American Society of Civil Engineers 128(4), 336-346.
6. Jong, G.C. de and M.E. Ben-Akiva (2007) A micro-simulation model of shipment size and transport chain choice, Special issue on freight transport of Transportation Research B, 41, 950-965.
7. McFadden, D.L., C. Winston, and A. Boersch-Supan (1985) Joint estimation of freight transportation decisions under non-random sampling, in E.F. Daughety (Ed.) Analytical Studies in Transport Economics, Cambridge University Press, Cambridge.
8. Windisch, E. (2009) A disaggregate freight transport model of transport chain and shipment size choice on the Swedish Commodity Flow Survey 2004/05, MSc Thesis, Delft University of Technology.