266


2 | P a g e
A DISSERTATION
ON
FACTORS AFFECTING KNOWLEDGE
MANAGEMENT IN THE SECTOR SME;WITH
SPECIAL CONTEXT OF ADVERTISING IN
PAKISTAN
A thesis submitted to the Superior College, Lahore in partial
fulfillment of the requirements for the degree of
Doctor of Philosophy in Business Administration
Submitted by:
Ch. Abdul Khaliq
Roll # PDBA ------------
Session 2012–2015
Department of Business and Management Sciences
Supervised by:
_____________________________
3 | P a g e
Factors Affecting Knowledge Management inthe Sector SMEwith Special Context of
Advertising in Pakistan
By
Ch. Abdul Khaliq Roll No. PDBA – --------------- Session: 2012–2015
Thesis submitted to
The Superior College, Lahore
In partial fulfillment of the requirements for the degree of
Doctor of Philosophy in Business Administration Approved by: _________________________ Prof. Dr. Muhammad Ilyas Dean Research Degrees _________________________ _______________________ Prof. Dr. Khawaja Hisham-Ul-Hassan Research Supervisor Controller Examination

4 | P a g e
Declaration of Originality
I, Ch. Abdul Khaliq hereby solemnly declare that this project:
a) is my original work, except where otherwise acknowledged in the text
b) and that any additional sources of information have been duly cited
c) shall not be submitted by me in future for obtaining any degree from this or any other
university or institution
d) has incorporated the HEC Plagiarism Policy
e) I understand that after submitting my thesis I may be called for viva and it is my
responsibility to make myself available to attend this viva.
3.1 Scholar’s Full Signature
3.2 Date

5 | P a g e
Dedication
This work is dedicated to my parents and members of my family. God bless them,
Amen.

6 | P a g e
Acknowledgement
All praise is for Almighty Allah (the most merciful, the most beneficial), Who enabled me to
complete this research thesis. I express my gratitude to Him from the core of my heart. All
respects to the Holy Prophet (Peace Be Upon Him) who enabled us to recognize our Creator and
whose spiritual teachings guide us in every matter of our lives.
It is a great pleasure for me to give my sincere thanks to my supervisor Dr. _______________
and co-supervisors Dr. Muhammad Ilyas and Dr. Muqqadas Rehman whose kind and meticulous
guidance paved the way for me to complete my research work. I might not have been able to
finish this dissertation without their help, guidance and encouragement.
I want to express my great indebtedness to my parents and to members of my family for their
endless prayers for my success.
I also want to extend my deepest gratitude to the honorable Chairman of the Superior Group,
Prof. Dr. Ch. Abdul Rehman, and Pro-Rector, Prof. Dr. Sumaira Rehman for their courteous and
compassionate deeds, and for the helpful hand they extended towards me at one time or another.
They have been a permanent source of encouragement and guidance for me, in the completion of
my work.
Ch. Abdul Khaliq

7 | P a g e
Table of Contents
1. Introduction ......................................................................................................................... 1
1.1 Background of the Study .................................................................................................................. 1
1.2 Significance of the Study .................................................................................................................. 9
1.2.1 Theoretical Contribution ....................................................................................................... 9
1.2.2 Managerial Contribution ....................................................................................................... 9
1.3 Problem Statement ........................................................................................................................ 10
1.4 Research Questions ....................................................................................................................... 11
1.5 Rationale of the Research .............................................................................................................. 12
1.6 Scope of the Study ......................................................................................................................... 13
1.7 Conceptualization of the Variables ................................................................................................ 15
1.7.1 Market Orientation ............................................................................................................. 15
1.7.2 Learning Orientation ........................................................................................................... 17
1.7.3 Entrepreneurial Orientation ............................................................................................... 18
1.7.4 Knowledge Management .................................................................................................... 19
1.7.5 Marketing Capabilities ........................................................................................................ 20
1.7.6 Market Performance ........................................................................................................... 20
1.7.7 Product Development ......................................................................................................... 21
1.7.8 Financial Performance ........................................................................................................ 22
1.8 Research Objectives ....................................................................................................................... 23
1.9 Research Hypotheses ..................................................................................................................... 23
1.10 Structure of this Thesis ............................................................................................................... 24
2. Literature Review.............................................................................................................. 26
2.1 Market Orientation ........................................................................................................................ 27
2.1.1 Customer Orientation ......................................................................................................... 34
2.1.2 Competitor Orientation ...................................................................................................... 37
2.1.3 Interfunctional Coordination .............................................................................................. 40
2.2 Learning Orientation ...................................................................................................................... 43
2.2.1 Commitment to Learning .................................................................................................... 48
2.2.2 Open-mindedness ............................................................................................................... 49
2.2.3 Shared Vision ...................................................................................................................... 52
8 | P a g e
2.2.4 Creativity ............................................................................................................................. 54
2.3 Entrepreneurial Orientation .......................................................................................................... 58
2.3.1 Entrepreneurship ................................................................................................................ 58
2.3.1.1 Marketing and Entrepreneurship ....................................................................................... 60
2.3.2 Organizational Performance and Entrepreneurship ........................................................... 62
2.3.3 Entrepreneurial Orientation ............................................................................................... 64
2.3.3.1 Innovative ........................................................................................................................... 65
2.3.4 Proactivity ........................................................................................................................... 69
2.3.5 Competitive Aggressiveness ............................................................................................... 72
2.4 Firm Performance .......................................................................................................................... 74
2.5 Marketing Capabilities ................................................................................................................... 82
2.6 Knowledge Management ............................................................................................................... 88
2.6.1 Evolution of Knowledge Management ............................................................................... 89
2.6.2 Knowledge Management: A Trend ..................................................................................... 91
2.6.3 Understanding Knowledge .................................................................................................. 92
2.6.3.1 What is Knowledge? ........................................................................................................ 92
2.6.3.2 Types of Knowledge ........................................................................................................ 93
2.6.3.3 Dimensions of Knowledge ............................................................................................... 94
2.6.4 Strategic Implication of Knowledge .................................................................................... 95
2.6.5 Knowledge Stickiness .......................................................................................................... 95
2.6.6 Knowledge Transfer for Overcoming Knowledge Stickiness ............................................... 96
2.6.7 The Hidden Side of Tacit Knowledge .................................................................................. 97
2.6.8 Human Information Processes: Factors affecting Knowledge Construction ...................... 97
2.6.8.1 Perception and Recognition ............................................................................................ 97
2.6.8.2 Cognitive Styles ............................................................................................................... 97
2.6.8.3 Heuristics and Biases in Judgment .................................................................................. 98
2.6.8.4 Functional Fixedness and Mental Set ............................................................................. 98
2.6.8.5 Mental Models ................................................................................................................ 98
2.6.9 Variation in Learning Styles and Knowledge Acquisition .................................................... 98
2.7 A Firm’s Search for Decision-making Information ......................................................................... 99
2.7.2 The Nature of Business Advice ............................................................................................ 99
2.7.3 Theory Explaining the Market for Business Advice ........................................................... 100

9 | P a g e
2.7.4 Business Advice and the Strategic Management Literature ............................................. 100
2.7.5 Transaction Cost Economics ............................................................................................. 100
2.8 Knowledge Management Capabilities ......................................................................................... 101
2.8.1 Technology ........................................................................................................................ 102
2.8.2 Structure ........................................................................................................................... 103
2.8.3 Culture ............................................................................................................................... 104
2.8.4 Process Capability ............................................................................................................. 105
2.8.5 Acquisition Process ........................................................................................................... 105
2.8.6 Conversion Process ........................................................................................................... 106
2.8.7 Protection Process ............................................................................................................ 107
2.8.8 Knowledge Management Elements .................................................................................. 108
2.9 Transaction Cost Economics ........................................................................................................ 108
2.10 Contribution of Professional Services ....................................................................................... 109
2.11 SME Environment and the Advisory Service Market ................................................................ 112
2.11.1 SME Performance and Consultancy .................................................................................. 113
2.12 Theoretical Framework ............................................................................................................. 115
3. Research Methodology ................................................................................................... 116
3.1 Research Objectives ..................................................................................................................... 116
3.2 Research Approach ...................................................................................................................... 116
3.3 Research Strategy ........................................................................................................................ 118
3.4 Data Collection Method ............................................................................................................... 119
3.5 Design of Questionnaire .............................................................................................................. 119
3.5.1 Devising Questionnaire ..................................................................................................... 120
3.5.1.1 Item Generation ............................................................................................................ 120
3.5.1.2 Item Reduction .............................................................................................................. 120
3.5.2 Questionnaire Formatting ................................................................................................. 120
3.5.2.1 Stem Format ................................................................................................................. 121
3.5.2.2 Response Format .............................................................................................................. 121
3.5.3 Questionnaire Composition .............................................................................................. 121
3.5.4 Likert Scale ........................................................................................................................ 121
3.5.5 Testing the Questionnaire ................................................................................................. 122
3.5.5.1 Pre-testing ..................................................................................................................... 122

10 | P a g e
3.5.5.2 Pilot Study ..................................................................................................................... 123
3.6 Sample ......................................................................................................................................... 124
3.6.1 Sample Unit .............................................................................................................................. 124
3.6.2 Sample Technique ............................................................................................................. 124
3.6.3 Reaching out to Respondents ........................................................................................... 124
3.6.4 Sample Size ....................................................................................................................... 125
3.7 Data Analysis ................................................................................................................................ 126
3.7.1 Reliability and Validity ....................................................................................................... 127
4. Analysis and Results ....................................................................................................... 129
4.1 Descriptive Statistics ....................................................................................................................... 129
4.1.1. Demographic Profile of Respondents ..................................................................................... 129
4.1.2 Descriptive Summary ............................................................................................................... 130
4.1.3 Reliability Analysis .................................................................................................................... 133
4.1.4 Correlation ............................................................................................................................... 134
4.1.5 Factor Analysis ......................................................................................................................... 135
4.1.5.1 KMO Measure of Sampling Adequacy Test and Bartlett`s Test of Sphericity ................... 135
4.1.5.2 Eigenvalues ....................................................................................................................... 136
4.1.6 Factor Loading .......................................................................................................................... 137
4.2. Analyses ......................................................................................................................................... 140
4.2.1 Regression Analysis .................................................................................................................. 140
4.2.1.1 Regression of Marketing Orientation Dimension (Independent Variable) and Knowledge
Dimensions’ Tools Responsiveness to Knowledge (Dependent Variable) .................................... 140
4.2.1.2 Regression of Marketing Orientation Dimension (Independent Variable) and Knowledge
Acquisition .................................................................................................................................... 143
4.2.1.3 Regression of Marketing Orientation Dimension (Independent Variable) and Knowledge
Dissemination ............................................................................................................................... 145
4.2.1.4 Regression of Learning Orientation Dimension (Independent Variable) and Knowledge
Dimensions’ Tools Responsiveness to Knowledge (Dependent Variable) .................................... 148
4.2.1.5 Regression of Learning Orientation Dimension (Independent Variable) and Knowledge
Acquisition (Dependent Variable) ................................................................................................. 151
4.2.1.6 Regression of Learning Orientation Dimension (Independent Variable) and Knowledge
Dissemination (Dependent Variable) ............................................................................................ 153
4.2.1.7 Regression of Entrepreneurial Orientation (Independent Variable) and Knowledge
Dimensions’ Tools Responsiveness to Knowledge (Dependent Variable) .................................... 156

11 | P a g e
4.2.1.8 Regression of Entrepreneurial Orientation (Independent Variable) and Knowledge
Dissemination (Dependent Variable) ............................................................................................ 159
4.2.1.9 Regression of Entrepreneurial Orientation (Independent Variable) and Knowledge
Acquisition (Dependent Variable) ................................................................................................. 161
4.2.1.10 Regression of Marketing Orientation (Independent Variable) and Knowledge
Management (Dependent Variable) ............................................................................................. 164
4.2.1.11 Regression of Learning Orientation (Independent Variable) and Knowledge Management
(Dependent Variable) .................................................................................................................... 166
4.2.1.12 Regression of Entrepreneurial Orientation (Independent Variable) and Knowledge
Management (Dependent Variable) ............................................................................................. 168
5. Discussion ....................................................................................................................... 171
5.1 Market Orientation and Knowledge Management .................................................................... 172
5.1.1 Market Orientation and Knowledge Acquisition ..................................................................... 173
5.1.2 Market Orientation and Knowledge Dissemination ................................................................ 176
5.1.3 Market Orientation and Responsiveness to Knowledge.......................................................... 179
5.2 Learning Orientation and Knowledge Management ...................................................................... 182
5.2.1 Learning Orientation and Knowledge Acquisition ................................................................... 183
5.2.2 Learning Orientation and Knowledge Dissemination .............................................................. 186
5.2.3 Learning Orientation and Responsiveness to Knowledge ....................................................... 189
5.3 Entrepreneurial Orientation and Knowledge Management ........................................................... 193
5.3.1 Entrepreneurial Orientation and Knowledge Acquisition ........................................................ 194
5.3.2 Entrepreneurial Orientation and Knowledge Dissemination ................................................... 196
5.3.3 Entrepreneurial Orientation and Responsiveness to Knowledge ............................................ 198
6. Conclusion and Recommendations ................................................................................. 201
6.1 Conclusion ....................................................................................................................................... 201
6.2 Recommendations .......................................................................................................................... 205
6.3 Directions for Future Research ....................................................................................................... 206
7. References ...................................................................................................................... 208
8. Appendix A ..................................................................................................................... 208
12 | P a g e
List of Abbreviations
BSC balanced scorecard
CA competitive advantage
EO entrepreneurial orientation
KM knowledge management
KMO Kaiser-Meyer-Olkin
LO learning orientation
MO marketorientation
R&D research and development
SME small medium enterprises
SOP Standard Operating Procedures
TCE transaction cost economics
USA United States of America
UK United Kingdom

13 | P a g e
List of Figures
Figure 1: McDonald’s Knowledge Management Model ............................................................ 26
Figure 2: Theoretical Framework ............................................................................................. 115

14 | P a g e
List of Tables
Table 4. 1: Descriptive Statistics ................................................................................................ 129
Table 4. 2: Descriptive Statistics of survey items ....................................................................... 131
Table 4. 3: Reliability of Measurement ....................................................................................... 133
Table 4. 4: Correlation among different constructs ................................................................... 134
Table 4. 5: KMO and Bartlett`s Test .......................................................................................... 136
Table 4. 6: Eigen Values and Total Variance Explained............................................................ 137
Table 4. 7: Component Matrix .................................................................................................... 138
Table 4. 8: Regression of Marketing Orientation and responsiveness to knowledge ................. 140
Table 4. 9: Regression of Marketing Orientation dimension and knowledge acquisition .......... 143
Table 4. 10: Regression of Marketing Orientation dimension and knowledge dissemination ... 145
Table 4. 11: Regression of Learning Orientation dimension and responsiveness to knowledge 148
Table 4. 12: Regression of Learning Orientation dimension and knowledge acquisition.......... 151
Table 4. 13: Regression of Learning Orientation dimension and knowledge dissemination ..... 153
Table 4. 14: Regression of Entrepreneurial Orientation and knowledge responsiveness .......... 156
Table 4. 15: Regression of Entrepreneurial Orientation and knowledge dissemination ........... 159
Table 4. 16: Regression of Entrepreneurial Orientation and knowledge acquisition ................ 162
Table 4. 17: Regression of Marketing Orientation and knowledge management ...................... 164
Table 4. 18: Regression of Learning Orientation and knowledge management ........................ 166
Table 4. 19: Regression of Entrepreneurial Orientation and knowledge management ............. 168

15 | P a g e
Abstract
Gradually,SMEsattainedimportance in the political, economic and social perspectives of the world. They
contributedto the financial and non-financial prosperity of communities. They emerged as a strong and
individual entity in all disciplines, includingeducation, health and advertising. Their research and
development continuously provided products and services to meet the needs of this dynamic era.
The aims of this research study are to examine the impacts of market orientation, learning orientation and
entrepreneurial orientation on knowledge management in the advertising sector of SMEs in Pakistan. The
results were analyzed statistically. The first section of the analysis discusses the descriptive profile of the
data in which mean, standard deviation, reliability and validity of the constructs are measured. The
demographics of the respondents are discussed in this section and the respondents’ internal consistency
reliability is also measured in this section. The second section discusses the results of correlationsand
regressions in which the relationships of the variables are discussed.
Over the last decadeadvertising has witnessed a steady growth in Pakistan. The growth was stimulated by
the development of new media, growth of private media channels, internet boom and a consumption-
based economy. Further, advertising is considered one of the main segments of the corporate
worldbecause the success of many businesses is dependent on the utilization of effective marketing
services and taking other marketing initiatives. There still is a need to develop this segment and ensure
sustainability of this sector in any way possible.
The study found a significant and positive impact of all three business orientations on knowledge
management: learning orientation explained the highest variance in knowledge management, followed by
market orientation and entrepreneurial orientation. All three orientations were further subdivided into sub-
dimensions and the impact of these sub-dimensions on each component of knowledge managementwas
also investigated.
The business orientation has sub-dimensions of customer orientation, competitor orientation and
interfunctional coordination. Two of the three dimensions (i.e. competitor orientation and interfunctional
coordination) were found to have a significant impact on the knowledge acquisition aspect of knowledge
management, while customer orientation was found to have an insignificant impact on the knowledge
acquisition aspect of knowledge management. This indicates that competitor orientation provokes
knowledge acquisition relating to the market and competitors, interfunctional coordination encourages
knowledge acquisition, while customer orientation did not have a relationship with knowledge

16 | P a g e
acquisition. Thus, customer orientation does not provoke knowledge acquisition. Further, all three sub-
dimensions of market orientation yielded a significant impact on both knowledge dissemination and
responsiveness to knowledge. This indicates that market orientation supports knowledge management
within an organization, but having customer orientation could hinder an organization’s ability to acquire
new knowledge from the market.
The second business orientation considered was learning orientation, which has sub-dimensions of
commitment to learning, shared vision, open-mindedness and creativity. It was found that only sub-
dimensions of commitment to learning, shared vision and open-mindedness explained knowledge
acquisition in the firms, while the sub-dimension of creativity did not have any impact on knowledge
acquisition. This indicates that knowledge acquisition can be made through knowledge management,
shared vision and open-mindedness, whereas creativity is not required to acquire new knowledge from the
market. This indicates that the procedure to acquire knowledge is straightforward and no complexity is
involved, and that is why there is no involvement of creativity inknowledge acquisition. Further, only the
sub-dimensions of shared vision and open-mindedness were found to have a significant relationship with
knowledge dissemination;thesub-dimensions of commitment to learning and creativity were not related to
knowledge dissemination. This again suggests that knowledge dissemination is a simple process and no
complexity is involved, and commitment to learning does notplay a role in it. Lastly, all four sub-
dimensions of learning orientation were found to have a significant impact on responsiveness to
knowledge which is knowledge exploitation dimension. This seems a more complex process that requires
top-down commitment and integrated efforts.
The last business orientation considered was entrepreneurial orientation, which hassub-dimensions of
proactivity, competitiveness and innovativeness;I investigated whether the dimensions of business
orientation were related to all three aspects of knowledge management (i.e. knowledge acquisition,
knowledge dissemination and responsiveness to knowledge). It was found that all three sub-dimensions of
entrepreneurial orientation had a significant relationship with all three aspects of knowledge management.
This indicates that entrepreneurial orientation on the whole explains knowledge management in a
complete manner.
Key Words: Marketorientation, Learning orientation, Entrepreneurial orientation, Knowledge
management

1 | P a g e
Chapter 1
Introduction
1.1 Background of the Study
In the twentieth century the emergence of small medium enterprises (SMEs) was a big
development in the economic growth of the world. An SME is an enterprise that has less than
250 employees and an annual turnover of less than 250 million euro(Mulhern,
1995).Gradually,SMEs attained importance in the political, economic and social perspectives of
the world(Ayyagari, Beck, & Demirguc-Kunt, 2007). They contributedto the financial and non-
financial prosperity of communities. Theyemerged as a strong and individual entity in all
disciplines, including education, healthand advertising. Their research and development(R&D)
continuously provided products and services to meet the needs of this dynamic era(Hillary,
2000).Some of the factors involved in the emergence of SMEs are summarized below.
The volatility of the SME sector depends upon different economic, social and political problems.
Macro-level and micro-level factors of the economy,such as inflation and unemployment,
directly affectSMEs(Narula, 2001). SMEssupport and serve local and international communities
by providing quality products and services around the globe. In this dynamic era, in
whichcreativity and innovation are prime values in every business,there are opportunities
forSMEs to bring their new and unique innovative products and services to the market.
Nowadays, large sector mass production is discouraged because market demand changes rapidly
and only those enterpriseswitha flexible working environment will survive(Child, 1972). Large
enterprises have complex organizational structures and it is very difficult to bring changes to
their organizational culture.

2 | P a g e
Social factors also providedanenvironment for the emergence of SMEs in which there were
opportunities for local people who had skills and expertise, and they lessened the downsizing
burden on society. Societal cultural norms and values enhanced the organizational loyalty and
commitment level of the employees in SMEs. SMEsemerged with a different social and cultural
identity and faced dynamic situations through which employees developed their skills and met
the needs of this changing world(Ellis & Pecotich, 2001).They provided products and services to
meet challenging environmental situations that ignited their entrepreneurial drive and encouraged
people to start their own businesses. Entrepreneurial drive is one of the key factors for the
success and prosperity of a nation. Inspiration is required to start a business and to face all the
challenges with valor and come up with new distinctive ideas and strategies thatexploit market
niches.Entrepreneurial drive brings economic and social prosperity toall the communities of the
world(Knight, 2000).
The competitiveness of the market and the need for continuous improvementmade the
organizational culture of SMEs focus on the driving factors through which they could improve
their performance(Çakar & Ertürk, 2010). In order to understand their structure,how they
optimally utilize their existing resources, how they survive and compete around the globe,
different studies need to be conducted. Worldwide studies have been conducted to determine the
factors that affectSMEs and help them to convert into large-sized businesses(Ghosh & Kwan,
1996).
One of the major drawbacks experienced bySMEs is a lack of business strategy and
entrepreneurial drive(Wang, Walker, & Redmond, 2007). Studies have shown that a sense of

3 | P a g e
clarity and long-term vision builds a strong company structure and it serves the company’s
mission and vision. Most small businesses only focus on the internal operations of their business
rather than on the external market (Zaharia, Stancu, Stoian, & Diaconu, 2010). A successful
business hasboth strong internal networking and external linkages and operations. SMEs
facechallenges in the form of internal operations, logistic issues and changing market demands as
well as problemsin developing external links, such as with creditors and suppliers (Gilmore,
Carson, & Rocks, 2006).
After World War II,small firmswere promoted to prevent economic decline. They became part of
free market economies and gave a trade route to national and international markets for economic
as well as social prosperity.They enhanced the living standard of people and slowly brought
social improvement. Brown and Lockett (2004) described the importance of SMEs in
revitalizing the economy; therefore,not only do all nations need to promote this sector but it also
brings cultural harmony among the people. As a result, different governments took different
promotional initiatives forSMEs;theUnited Kingdom (UK) and United States of America (USA)
were the countries that most explored opportunities to revive corporate groups(Mulhern,
1995).In the 1970s and 1980s, new business ventures were started and entrepreneurs such as
Steve Jobs and Michael Dell grabbedmarket opportunities; entrepreneurs became heroes who
revived the economies of nations.
SMEs nowadays play an important role in the development of every nation because they
represent a portion of every sector of the economy. SMEsare the capabilities of individual

4 | P a g e
entities to contribute to the economy, such asgross national product and per capita income. They
also help to reduce the unemployment rate of the economy.
Knowledge is a vague concept which can be defined in many ways (e.g. Hedlund, 1994;
Spender, 1996). According to Grant (2011), knowledge is an intangible asset combined with
other resources such as physical and financial assets to create capabilities. Knowledge can be
categorized into two types: tacit,which can also be described as implicit; and explicit, which can
also be described ascodified(Massingham, 2014). Tacit knowledge resides in mind, behavior and
perceptions and it requires practice and interactions among people (Martensson, 2000). Explicit
(codified) knowledge is knowledge that is transferrable through reports or documents or through
any formalized way (Duffy, 1999). This distinction is important as knowledge management
(KM) methods are likely to be identified through either tacit-oriented or explicit-oriented
perception (Choi& Lee, 2002).
The success of an organization is determined by the achievement of its goals. One of the ways an
organization can fulfill its goals is through KM. KM is aimed at developing and managing
organizational knowledge and includes interdependent activities to achieve both the financial and
non-financial success of organizations (Liao, 2011). Knowledge sharing includes cognitive and
communication skills in a specific context (Widen-Wulff &Ginman, 2004). The early literature
focused on the technological aspect of KM but the focus has now shifted to human
relations;now, the management of people is strongly related to KM (Meso&Smith, 2000;
Narasimha, 2000). KM is positively linked to organizational performance; KMcan be defined in
three steps: creation, acquirement and utilization of knowledge(Bassi, 1997). KM, for the

5 | P a g e
purpose of managing knowledge, can be further categorized through KM strategy. According to
Massingham (2014),KM can be categorized best through Product versus Process while the
somewhat similar terms of Codification and Personalization were used by (Robinson et al.,
2005).
In Product view, knowledge is considered a thing that can be manipulated as well as be locatable
bythose other than its knower. According to Product view, knowledge can be converted into
documents, databases, files and so on which can be used again. It is about sharing best practices,
standard operating procedures, and about storage and retrieval of knowledge. The Codification
approach is similar to Product view in that codification and reuse of knowledge should be done
with sharing in a formalized way (Liao, 2011). This view of KM tries to separate the knowledge
from the knower (Papavassiliou, Mentzas & Abecker, 2002). This type of KM strategy works
best when organizations want to provide standardized information. To reduce complexity for the
sharing of information and to attain organizational efficiency through a Codification approach,
organizations can invest in information systems (Markus, 2001; Hendriks& Vriens, 1999;
Mirchandani& Pakath, 1999).
The Process view places emphasis on ways to promote, motivate, encourage, nurture or guide the
process of knowing, and abolishes the idea of trying to capture and distribute knowledge
(Papavassiliou, Mentzas & Abecker, 2002).The focus in this strategy is on tacit knowledge and
its sharing through interpersonal experience, interaction, communication and cooperation.
Knowledge is part of the knower and the Process view does nottry to separate the knowledge
from the knower. The Personalization strategy is also aligned with this view. As knowledge is

6 | P a g e
considered tacit, employees have to interact with other colleagues to obtain knowledge and SOPs
are abandoned. As compared to Codification view, organizations implementing the
Personalization approach invest in appraisal and compensation systems and use task force
groups; they emphasize organizational learning mechanisms and encourage employee interaction
for the sharing of knowledge.
KM affects organizational efficiency and success. The literature indicates that KM is a primary
source of excellence for any firm (Drucker, 1994; Stewart, 1998; Choy et al., 2006). According
to knowledge-based theory,abilities to create and exploit valuable knowledge enhance outcomes
(Grant, 1996; Hult et al., 2004). This theory was originally based on the resource-based view
which emphasizes competitive advantage (CA). As competition increases or firms face
uncertainties they have to go for CA (Elo, Harima&Freiling, 2015). The creation of a CA is
sometimes necessary to be a successful player in the market. Many organizations’CA is based on
KM and its development(Peng Wong &Yew Wong, 2011). Knowledge development starts at an
individual level and then it moves to an organization level through distribution, review and
revision which converts individual knowledge to organization knowledge (Bhatt, 2000).
Organization knowledge will either lead to the success or failure of an organization.
KM has been described as a process opted for by organizations to generate capital from their
intellectual assets (Evans, Dalkir, & Bidian, 2015). Alavi and Leidner (2001)found that an
appropriate use of KM can assist organizations to turn into more flexible and better learning
settings. According to Lee and Sukoco (2007), to achieve better organizational performance, it is
not only important to successfully invest in tangible resources but also in improved KM.

7 | P a g e
Therefore, over the years, investment in KM has dramatically increased including 16% increase
in investments in KM software in US organizations from 2007 to 2008(Mcgreevy, 2007). One of
the rationales behind such increased investments in KM is to create the knowledge capability of
an organization which assists effective knowledge acquisition, knowledge dissemination and
responsiveness to knowledge (Alavi & Leidner, 2001). Becerra-Fernandez and Sabherwal
(2014)found that these resources are linked to the KM capability of an organization, which in
turn is linked to different determinants of organizational performance. In addition, the role of
social capital is also important in assisting an organization to enhance its performance.
Nowadays, an increasing trend has been observed regarding empirical investigation of the
relationship between KM and organization performance(Zack, McKeen, & Singh, 2009).
KM is one of the main factors in an organization in this contemporary era. Due to the
increasingly competitive nature of global economic systems, growth has been the major focus of
more and more organizations.KM is directly related to innovations, such as rapidly evolving
technology, shorter product lifecycles and a higher rate of new product development (Du Plessis,
2007).To gain a competitive edge and to remain viable, every organization has to be innovative.
However, innovation is getting increasingly complex due to changing customer needs, extensive
competitive pressure and rapid technological change (Tamer Cavusgil, Calantone, & Zhao,
2003). Innovation of an organization is highly dependent on KM. The availability of knowledge
and its complexity, and the explosion of richness as well as profundity of knowledge have to be
recognized and managed to achieve successful innovation in organizations(Adams & Lamont,
2003). Innovation and KMare mutually dependent.

8 | P a g e
KM creates a competitive business environment. Creating, building and maintaining a CA is
mostly the outcome ofKM and innovativeness (Carroll & Shabana, 2010). Acquiring knowledge,
skills and abilities through collaboration within organizations leads to the successful
development of innovativeness and ultimately a competitive edge for organizations.KM also
reduces the complexity of the innovation process. More knowledge leads to complexity in the
design of a product under an innovation process. If such information is not managed, it will
disrupt the innovation process (Shani, Sena, & Olin, 2003). So KM is not only the mechanism
through which innovation complexity is catered for but it also assists the innovation process
through managing the existing knowledge as a resource for the innovation process (Cavusgil et
al., 2003).
KM integrates both internal and external knowledge so that improved innovativeness and
competitiveness of an organization can be achieved. Nowadays customer relations and KM have
become potential areas for the researcher because an organization’s prime objective is value
creation which dependson customer relations.Customer relationship management and KMare
used by organizationsto gainCAs in the market by optimally utilizing their internal and external
resources. Although these concepts seem to be different, when they are integrated it creates
synergy which brings fruitful results for an organization. A very famous saying is that it is very
easy to attract a new customer but it is very difficult to retain a new customer. In order to
develop a long-term sustaining relationship with the customer, knowledge about the customer
and products or services should be explicitly or implicitly communicated to employees
(Davenport & Völpel, 2001).

9 | P a g e
The KM model serves as a supporting model for an organization in which knowledge is
managed, which in itself is very valuable, but these models are mostly applied in the services
sector instead of the manufacturing sector because in the manufacturing sector, the process
managers solely focus on cost and benefit analysis (Demarest,1997). KM is one of the core
drivers in an organization (Drucker, 1999). KM determines how much knowledge is transferred
from top management to lower management and the ways of knowledge transfer (Demarest,
1997). The KM model gives different insights on the organizational learning environment and on
how efficiently resources have been utilized.
1.2 Significance of the Study
1.2.1 Theoretical Contribution
This study contributesto the existing literature on the factors which influenceKM in SMEs in the
advertising sector of Pakistan by investigating the impact ofmarketorientation (MO), learning
orientation (LO) and entrepreneurial orientation (EO) on KM in the Pakistani context. It has been
already established that firms get a CA through KM.
1.2.2 Managerial Contribution
This study helps managers to devise policies for the optimum utilization of existing resources
and it helps managers to acquire new resources in the long term in the light of the company’s
vision for gaining aCA in the market.
Managers can develop an information bank through KM which helps them to take better and
faster decisions. As we know, time is money for an organization and if an organization has a
systemized KM system regarding the market and customers, thenit can tune up its structure and
can make prompt decisions in any situation.This study helps managers to think in multiple

10 | P a g e
dimensions about the specific problem and can generate different ideas for the prosperity of their
organization.
With the help of this study, managers can effectively utilize their knowledge workers because
they know what kinds of skills and expertise they have and can therefore ensure that any task or
project can be efficiently and effectively done.This study improves the communication skills of
the organization internally as well as externally to ensure smooth operations.For optimum
utilization of skills,communication should be excellent to maintain and develop new external
linkages, and to updateexternal links to the market and customers. Standardized policies and
procedures can be developed with the help of KM because knowledge of organization flows and
the existing framework enables easy modification.
This study also helps managers to understand the diverse cultural environment of the
organization through which they can manage interpersonal conflicts and enhance the
teambuilding skills of their organization.This study also helps the government to design policies
regarding the acquisition of resources by indicating what kind of resources are needed and how
to effectively manage them in order to achieve the desired results. Government can also devise
policies regarding utilization of knowledge and suggest how to effectively utilize information
and respond to situations according to given circumstances.
1.3 Problem Statement
KM evolved gradually in six phases. The first phase consisted of agrarian economies in which
goods were produced for the purpose of consumption and they were exchanged as a mode of
barter system.Gradually, society evolved and entered into natural resource economies in which it
exploited natural resources and increase inuniqueness of supplies to the customer for earning

11 | P a g e
vast amount of profit. In second phase, we had the industrial revolutionin which the mass
production of products and services started. Men were replaced by machines which encouraged
cost cutting behavior, operational excellence andanemphasis on the efficiency and effectiveness
of the task irrespective of employee conditions and problems in society. Then the product
revolution phase started where the product was given prime importance and leadership focused
on the sophistication of the product. In this phase creativity and innovative ideas were promoted.
In this phase employees were encouraged to think in new ways in order to respond to existing
problems and to develop new products and services. After the product phase, the information
phase started where information was the prime focus.Everyone in an organization started to
acknowledge the importance of information on products, customers and suppliers;databases were
introducedfor the decision-making process.In the last phase, the knowledge paradigm emerged
where the customer is king and all the policies, procedures and strategies of an
organizationrevolve around customer needs and markets opportunities.
This is an era in which skilled workers, business strategies and customized products are
developed to attain a greater market share and maximization of profitability. There is a need to
conduct research to determine the factors that have the most influential effect on KM to ensure
that we become a driving force in the marketand can deliver to the nation.
1.4 Research Questions
Does market orientation affect knowledge management in the advertising sector of SMEs
in Pakistan?
Doeslearning orientation affect knowledge management in the advertising sector of
SMEs in Pakistan?
12 | P a g e
Doesentrepreneurial orientation affect knowledge management in the advertising sector
of SMEs in Pakistan?
1.5 Rationale of the Research
In the last quarter of the twentieth century, the management of small enterprises emerged as an
issue in research. It was the period during which the social, political and economic importance of
small firms was realized for the first time in commercial history. Since then, considerable
developments have been recorded locally and globally; several events in regional as well as
international communities have shaped this discipline as a highly differentiated business
discipline. These developments have resulted in public discussions and widespread debates on
the subject matter and activities in the form of specialist publications, literature, services,
education and research (Storey, 1994; Autio, 2007).
The status of SMEs has been elevated by a large number of factors. The most important factor is
the perception thatSMEs contribute significantly toward the economy, specifically in resolving
problems faced by the economies of developed countries over many years. These problems may
include uncompetitive business performance, unemployment, inflationary instability and
grueling recessions. These small firms are abundant and diverse commercial entities that have
the potential to prevent economies from experiencing the deteriorating effects of the
abovementioned problems. SMEs are able to build prosperity and wealth at a national and
international scale (Gray &Stanworth, 1991; Karpin, 1995).
Some of the significant developments in the markets have made it possible forSMEs to operate
and perform activities that were beyond their reach before. These developments include a decline

13 | P a g e
in industrial mass production, innovation-intensive high-tech sectors, expansion of services, and
greater product specialization and customization (Robinson & Pearce, 1984). Small businesses
can respond to these trends more flexibly and quickly because their infrastructure is less
congested and less complex, and it is easier to remove obstacles, as compared to large
organizations.
The rationale of this study is to identify how an organization learns through the phases of
transformation from small to large firm and the importance of KM in deciding the fate of the
organization. Organizations are in continuous interaction with internal and external customers
(also known as stakeholders) and learning is the key process that continues throughout the
interactions of the company. There are six phases of KM through which the process is
completed. The primary objective of this study is to identify the impact of MO,LOandEO in the
advertising sector of small businesses in Pakistan. There is a huge gap existing in the small
businesses sector for such research especially in the advertising sector.
1.6 Scope of the Study
The researcher focused his attention on small businesses because of their ability to contribute
significantly towards the economy and commercial applications. The research has targeted
factors that impact the performance of small businesses and how they can be managed
effectively. The researcher has realized that it is a challenging task to study small firms. The
researcher has identified that management of small firms is more difficultthan managing large
firms, and these firms have a greater struggle to become successful and grow in the marketplace
as compared to larger firms. Most researched factors in this regard have been how small firms
14 | P a g e
survive in the marketplace and what factors impact the transformation of small firms into large
business concerns (Fitzsimons&Gorman, 2005).
Most of the researchers as well as the practitioners who work with small business communities
found that management of business strategy is the most important factor while studying the
survival and growth of small business concerns which is stimulated by entrepreneurship.
Different studies have indicated that the experience of growth pushes small firms to develop
long-term objectives and a strategy to direct achievement of these goals. Owners of small firms
who also manage the firms are preoccupied with the macro-dimensions of their firms. They place
greater emphasis on setting objectives and assessing the potential of their company as compared
to other companies in the market. Their objectives include larger product and customer bases and
they plan to achieve the infrastructure necessary to achieve those objectives (Fornell, 1992).
Moreover, it has been found that there are significant transformations observed in the case of
growing firms. These transformations occur in their internal operational environment as well as
in their interactions with the external environment. When the firm is growing, it is faced with
several operational issues including higher demands for products from the customers, increasing
complexity of the infrastructure of the organization, increasing logistic issues and increased
operational activity. As a result of these issues, changes will take place in the company’sbusiness
and learning relationships with agents, landlords, financers, suppliers, customers and sometimes
with members of the organization. There will be a need to bring changes to the internal
infrastructure of the company according to these transformations in order to make the changes

15 | P a g e
successful. In order to gain greater control, quality and efficiency in their operations, significant
transformations in the infrastructure are required.
1.7 Conceptualization of the Variables
1.7.1 Market Orientation
According to Narver and Slater (1990), MOin an organizational culture is dependent on three
behavioral components of equal importance; these components are customer orientation,
competitor orientation and interfunctional coordination. In MO businesses, the employees spend
more time with their customers and try to give them superior value in order to achieve their goals
(Slater & Narver, 1994).
In order to create superior value or worth demands for customers, companies have to focus on
their customers. It is necessary for the companies to focus on their competitors, technologies and
the products that act as the alternatives to satisfy their customers. It is also necessary to
understand the main competitors of the companies, and the short-term strengths and the long-
term opportunities and goals of the companies. Many times, competitors have become the source
of new ideas for developing and innovating products, so by knowing the competitor’s strategies
companies can get new ideas about products (Porter, 1979). In any organization, the employees
can generate competitive intelligence (Slater & Narver, 1994).
MO is also responsible for creating coordination between different resources, such as personnel
resources,to form value for buyers. For example, engineering staff should discuss their regular
tasks, capabilities and limitations with the sales and the marketing staff to increase and enhance

16 | P a g e
the capabilities and to avoid the limitations. When all functions support an increase in value, then
the benefit to the customer will be increased effectively and efficiently.
Kohli and Jaworski (1990) defined MO in a different way; theystated that MO involves different
behavioral activities such as the dissemination, generation and response to information. Hunt and
Morgan(1995) describedMOas: a systematic way of gathering information from both customers
and competitors by using allthe potential and present ways; the systematic analysis of this
gathered information to develop market knowledge and information; and the use of this
information systematically to act as a guide to understand existing knowledge and createnew
knowledge about the information. So MO is very necessary toan understanding of marketing
concepts about products and customer values. Lafferty and Hult (2001) divide the term of MO
into five main categories: decision making, market intelligence, culture base, strategic marketing
behavior and customer orientation.
There are three similarities in the definitions of the term MO: the set of beliefs regarding the
interests of the customers, an ability to generate information about customers and competitors
and use it properly, and coordination of the interfunctional resources to create worth for
customers (Kohli & Jaworski, 1993). So in the MO literature, value is very necessary to any
organization (Narver, Slater& Tietje, 1998).
MO is also sometimes referred to as customer orientation or asa market-driven process. For
example, according to Deshpande et al. (1993),MO is related to customer orientation because it
is driven by the customers. Day (1994) describedMOas the capability of forming the superior
17 | P a g e
ability to attract and understand customers, stating:Organizations can become more market-
oriented by identifying and building special capabilities that set market-driven organizations
apart. Researchers use the term market andMO interchangeably.
1.7.2 Learning Orientation
Sinkula et al. (1997) described LO as “giving rise to the set of organizational values that
influences the propensity of the firms to create and use knowledge.”LO is related to the degree of
the proactive learning. Other researchers describe LO as new personnel inductions with fresh and
updated knowledge and top management expectations.The new personnel hired possess
newideas, innovations and hence enhance the performance of organization.Hurley and Hult
(1998) described LO as present at every level of a firm in the form of strategy, process, structure
and culture of the firm. Its benefits include a fast marketing process, fast information process,
developing new products and high quality performance.
Generally LO is related with three qualities: agreement to learning, learning with an open mind
and shared vision. These values are associated with the organizational culture, where different
individuals work together, share their views and build relationships, and share the sense of
cause;these beliefs are necessary forLO and motivate the learning purpose (Senge, 1990).
Commitment to learning builds aclimate of learning and encourages an organizational learning
process. For example, managers who spend time learning, motivate their employees toward the
learning process. Shared vision is also central to the wide vision of an organizationin the learning
process. Without shared vision, it would be difficult for the employees to understand what they
have to learn or for what thing they are motivated.There are many ideas which are not supported

18 | P a g e
or accepted because of a lack of directions. Open-mindedness is very necessary to accept new
ideas and critically evaluate the operational routine of organizations (Lear, 1998).
Open-mindedness can also be related with unlearning. According to the chief scientist of the
Xerox Palo Alto Research Center, “Unlearning is critical in these chaotic times because so many
of our hard earned nuggets of knowledge, intuitions and just plain opinions depend on
assumptions about the World that are simply no longer true.”Itis important for organizations to
motivate the learning process and to create momentum for the learning process.
1.7.3 Entrepreneurial Orientation
According to the Miller (1983), entrepreneurial companies are those that involve the innovations
of products, assume risky ventures and introduce proactive innovations. EO is the propensity of
organizations to be innovative in making new products and calculating the risk factor. EO does
not focus on the relationship betweenorganizational culture and business orientation but it creates
links between a firm’s structure, management style and performance (Tzokas, Carter &
Kyriazopoulos, 2001).According to Stevenson& Jarillo (2007), entrepreneurship is an approach
to opportunity without having controlled resources.
MO and LO can help managers create quality processes, products and ideas for creating value for
customers. EO provides the stimulus to these activities. MO is related with the primary learning
about customers and competitors while EO is related with learning with experimentation from
MO.Entrepreneurial values encourage the learning and developing of breakthrough products and
services (Hamel & Prahalad, 1994). Some researchers showed that there is a positive relationship

19 | P a g e
between EO and organizational performance because EO performance is related to the
international performance of organizations and it is universal.
1.7.4 Knowledge Management
KM is multifaceted and incorporates different inter-linked processes (Egbu, Botterill & Bates,
2001). The purpose ofKM is to create an environment that enhances the learning process and
promote continuous creation, aggregation, use and reuse of personal and organizational
knowledge to support new business values. Quintas et al. (1997) described KM as the process of
managing the knowledge of the firm, continually, the existing knowledge and the emerging
knowledge to develop new ideas and the products. In the view of Egbu et al.(2005)KMis the
identification, optimization and utilization of knowledge to create value and increase
productivity to gain aCA. Bhatt (2000) describedKM as the interplay between different types of
knowledge to create a continuous cycle of knowledge development. KM includes various terms;
Ruggles (1997) defined these as codifying, generating and transferring knowledge. All the
processes ofKM are interactive, cyclic and have different dimensions (Laudon & Laudon, 2000).
How can knowledge be obtained and utilized? In the twentieth century, the discovery, creation
and the construction of knowledge led to the industrial knowledge and then to the information
revolution. It was not until the mid-1900s thatthe importance of knowledge was recognized by
individuals and organizations in the emerging competitive environment(Wiig, de Hoog & Van
Der Spek, 1997).Prahalad& Hamel (1994) stated that the true meaning of business sustainability
lies in the competition for the future, for the high worth for customers and having a broader
community. This can be achieved by the constant cycle of an organization in reinventing and
recycling processes inKM.

20 | P a g e
In the last few decades, the knowledge revolution has set the foundation for a knowledge
economy and it is becoming more complicated with the passage of time. It is very necessary for
organizations and their employees to know more and more about customerdemands. The role of
the knowledge economy and KM is vital in gaining customer loyalty. It is also important to
know how customers will take part in the innovation process of firms, through their knowledge.
1.7.5 Marketing Capabilities
The resource-based review describes some capabilities such as managerial skills and the
accumulated knowledge for deploying skills to create CA (Teece, Pisano& Shuen, 1997). Day
(1994) described marketing capabilities as an integrative process that is formed to collect the
overall information with the skills and the techniques concerning market-related needs and it
makes a firm able to have aCA by making its services and goods better.Day (1994) categorized
marketing capabilities into three types: outside in, inside out and spanning capabilities. It can
also be categorized into other parts like hierarchical, marketing culture, strategies and marketing
operations. It is also related with the marketing operations of different products and marketing
abilities for different actions.
Many researchers have identified different marketing capabilities as important for getting CA. It
is an important key to success for new firms and businesses. Insightful and professional analysis
reduces the chance of failure in any market. It is also true thatmarketing capabilities is the most
dominating issue that small businesses have to face in their initial process.
1.7.6 Market Performance

21 | P a g e
Market performance is driven by a wide spectrum of disciplines that include finance, human
resource management, marketing operations and strategic management (Marr & Schiuma, 2003).
Market performance is employed to measure the efficiency and the effectiveness of the actions of
employees, which act as problematic issues in business management. There are various
approaches that are applied in business to study and analyze performance;the research setting
ofperformance measurement is a controversial subject for strategic management researchers
(Jogaratnam, Eliza & Olsen, 1999)
One popular measure of market performance is the balanced scorecard (BSC), which was
designed by the Kaplan and Norton in 1992. It is based on the research of 12 companies of one
year of study. It is stated that a financial measure is not sufficientto measure market
performance,and that competence, knowledge and customer focus are also necessary. According
to most researchers, the most common financial measure is the profit margin.
Customer-based measures are gaining popularity because they stress the improvement in quality
of products and services that leads to a company’s profits. These measures include surveys with
customers and customer complaint procedures. These surveys are very helpful in
determiningperformance and guide improvement in quality. Soft measures are also used to
measure improvement in the morale ofemployees.
1.7.7 Product Development
Small companies have to face many problems with their competitorsand with the monopolistic
activities of larger companies. They have to face other problems such as raw materials problems
and customers who do not pay theirbills on time. Poor products or product development issues,
22 | P a g e
operational issues, quality control issues, poor resources and supplies make it difficult for new
firms to survive in the market successfully.
If firms have a positive attitude toward LO, then change can be accepted positively and
effectively. Day (1994) stated that firms who adopt aLO about their market are in a better
position to adapt to change. Market-oriented companies are successful in product development,
relationships with stakeholders and market communications. Along with LO, a well-developed
set of marketing capabilities is also essential forbasic marketing demands like segmentation,
selection of specific market, better products and services and product development.
Vorhies, Harker & Rao (1999) described six market principles: market research, product
development, pricing, channels of distribution, promotion and marketing management. Market
research is the term that combines the consumers and the customers to generate and evaluate
market actions. Marketing processes are specific to every firm (Day, 1994). These processes help
organizations achieve their organizational goals. The firm’s performance is at crest that have
high level of product development and MO. Such performance also contributes in
accomplishment of firms values with high values (Slater & Narver, 2000).
1.7.8 Financial Performance
In the entrepreneurship literature, growth is taken as a substitute for business performance
because it is given more importance than any other financial measure inbusiness (Zahra &
Covin, 1993).Empirical studies have combined financial performance with growth. Business
advice is directed to assist management in the operation of the firmto promote business
sustainability and the growth of the business. Business adviceis related with operational or

23 | P a g e
financial performance in order to make the business better. It can be given in the case of decision
making, marketing advertising and supply chain issues.
Hunt and Morgan (1995) developed the resource advantage theory which does not describe the
performance measures of firms but provides a model of competition among different firms.
1.8 Research Objectives
To examine the impact of market orientation on knowledge management in the
advertising sector of SMEs in Pakistan
To examine the impact oflearning orientation on knowledge management in the
advertising sector of SMEs in Pakistan
To examine the impact of entrepreneurial orientation on knowledge management in the
advertising sector of SMEs in Pakistan
1.9 Research Hypotheses
H1: There is an impact of market orientation on knowledge management.
H1A: There is an impact of customer orientation on knowledge management.
H1B: There is an impact of competitor orientation on knowledge management.
H1C: There is an impact of interfunctional coordinationon knowledge management.
H2: There is an impact of learningorientation on knowledge management.
H2A: There is an impact of learning commitmenton knowledge management.
H2B: There is an impact of shared visionon knowledge management.
H2C: There is an impact of creativity on knowledge management.
H2D: There is an impact of open-mindednesson knowledge management.
H3: There is an impact of entrepreneurial orientation on knowledge management.
H3A: There is an impact of innovation on knowledge management.
H3B: There is an impact of proactivityon knowledge management.
24 | P a g e
H3C: There is an impact of competivenesson knowledge management.
1.10 Structure of this Thesis
Chapter 1: Introduction
This chapter includes the background to and the significance of the study and a problem
statement. The rationale of the research is also discussed in which a research gap in the literature
is identified;variables are conceptualized. Research questions and research objectives are also
defined in this chapter.In addition, the scope of the study is explained and a theoretical
framework is drafted.
Chapter 2: Literature Review
In this chapter the literature was studied in relation to three independent variables and one
dependent variable. The three independent variables were MO, LO, and EO. The dependent
variable was KM. In MO,three different aspects were discussed: Customer Orientation,
Competitor Orientation and Interfunctional coordination. Similarly in LO, four different
facetswere discussed: Learning Commitment, Shared vision, Creativity and Open-mindedness. In
the same way, fivedifferent featuresof EOin the previous literature were discussed:Innovative,
Proactive and Competitive.
Chapter 3: Research Methodology
The approach towards the research and the method used in the research were discussed. The
researcher adopted a quantitative approach to examine the influence of the factors that lead to
KM in organizations in the advertising sector of Lahore, Pakistan. It was difficult to achieve this
goal with a quantitative approach within a short period of time. For this purpose, a questionnaire
was designed with responses on a Likert scale to register respondents’ attitudes and experience.
Another purpose of the research was to find the relationship and significance of different factors
affectingKM in this sector.

25 | P a g e
Chapter 4: Analysis and Results
This chapter discusses the analysis and interpretation of the data. The first section discusses the
descriptive profile of the data, in which mean, standard deviation, reliability and validity of the
constructs are measured. The demographics of the respondents are discussed in this section and
the respondents’ internal consistency reliability is also measured in this section. The second
section discusses the results of correlations in which the relationship of the variables are also
discussed.In addition, the regression results are discussed and the impact of independent
variables on dependent variable is examined.
Chapter 5: Discussion of Results
Strategic orientations considered in this study are MO, LO and EO, and their impact on KM in
the advertising segment of SMEs is considered; KM is measured using the dimensions of
knowledge acquisition, knowledge dissemination and responsiveness to knowledge. This chapter
is divided into three sections in which the three strategic orientations and their impact on KM are
discussed. The first section of the discussion discusses the results on the impact of MO on KM,
the second section of this chapter provides discussion on the impact of LO on KM and the third
section of the chapter discusses the impact of EO on KM.
Chapter 6: Conclusions and Recommendations
This chapter of the thesis concludes the research and also provides implications and
recommendation of the study. Lastly, limitations of the research and directions for future
research are also entailed in this chapter.

26 | P a g e
Chapter 2
Literature Review
KM plays an important role and serves as an important concept for firms in translating their MO,
LO and EO for business performance (Wang, 2008). It is important to know the meaning of KM,
from where it started and its effects on the present knowledge economy era. Many types and
dimensions of KM are present in the literature. This chaptergives a systematic overview of the
studies of KM and their factors, and it will show that knowledge lies in the heart of KM along
with factors thataffect the efficiency and effectiveness of an organization. McDonald (2010)
developed aKM model of SMEs (Figure 1) in which all the factors affectingKM are described
and it also createda link betweenKMand organizational performance.
Figure 1: McDonald’s Knowledge Management Model

27 | P a g e
2.1 Market Orientation
A business can improve its marketing performance by increasing its MO. The effectiveness of
MOhas been claimed by academic researchers as well as marketing management practitioners for
the past 30 years. Given the particular attention paid toMO by marketing managers and
academicians in their textbooks, speeches and research papers, it has been placed at the center of
modern marketing management and marketing strategy development. However, there is no
convincing evidence of the impact of MO on business performance. It is because of this lack of
empirical evidence, that marketing managers do not have any guidance on the proper
implementation ofMO, and they do not know what the impact of the implementation of MOwill
be on modern day business in a competitive environment (Narver & Slater, 1990).
MO refers to that particular situation where the entity gives importance to its all components as
strategic components and analyzes each element according to its significance;this analysis starts
from the identification of the relevant components which can be deemed as true factors or
components of MO. There has been a debate in the literature about the strategic components of
MO. For example,Shapiro (1988) held the view thatMOhas a major relation to decision making;
this point of view ofMOwas first challenged byKohli and Jaworski(1990).Kohli and Jaworski
(1990) were in favor of market intelligence to analyze market sensitivity through the analysis of
customer sensitivity and intensity of response by the customer in the case of any change in
market behavior, which includes change in price or features and change in rivalry level among
existing and potential product producers and sellers or service providers. They described the
scope of market intelligence: first, generate market intelligence, organization-wide by using all
possible means; then disseminate that generated market intelligence at all levels of the
organization in all departments from top to bottom; and then design and develop all processes

28 | P a g e
and procedures in a way thatwould be most effectively and efficiently responsive to the market
intelligence at all levels. The significance of this process of generation of market intelligence and
its spread in all departments at all levels is greater in SMEs than large-scale businessesbecause at
a large scale, almost all business entities are in a position to deploy human and other financial
resources for generating and disseminating market intelligence. This is not as easy in SMEs
because they have limited human and financial resources, moreover they rarely possess a level of
leadership which may be capable of doing such tasks. Hence, this may become an important
factor in the success or failure of SMEs.The market intelligence perspective of MOheld for only
two years. ThenMO entered a new era of cultural-based behavior perspective as advocated by
Narver and Slater (1990).
Narver and Slater (1990) contended that MO is mainly based on the culture and behavior of the
market. If historically a particular market and its buyers follow one pattern of spending in any
given situation, then they will probably follow it again and againin the same scenario as this has
been their continuous and historic behavior.Theirhistoric behavior has become part of their
culture and any trait which becomes part of the culture of any society, population or market is
always expected to be repeated in the same scenario every time. This view of MOheld for a
further two years until 1992,when Ruekert promoted the strategic perspective ofMO.
Ruekert and Walker (1987) suggested that the factors and components which are vital to the
long-term success or failure of any business entity should be treated asMO factors or components
because of their significance and dominance in that particular business.

29 | P a g e
In 1993Deshpande et al. argued that the major component of MO is customer orientation
(Deshpande et al., 1993); MOis king of the market and drives all other forces of and factors of
MO. This argument prevails as a significant part of MO along with other components which
were revealed later by other researchers, such as competitor orientation. For many years,
marketing andMOwere considered to be the same things by some researchers and scholars, but
this was not actually the case.
The two most prominent conceptualizations ofMO are those given by Kohli and Jaworski (1990)
and Narver and Slater (1990). Whereas Kohli and Jaworski (1990) consideredMOto be the
implementation of the marketing concept, Narver and Slater (1990) contended that MOis
organizational culture and behavior. The latter is achieved by any entity when market-oriented
analyses become part of an organization’s processes and procedures at all levels from top to
bottom, as well aspart of strategic decisions and operational day-to-day decisions.According to
Narver and Slater (1990), the marketing concept is a business philosophy, whereas the term MO
refers to the actual implementation of the marketing concept. They added thata market
orientation appears to provide a unifying focus for the efforts and projects of individuals and
departments within that particular business entity.
Narver and Slater (1990) defined MO as "the organization culture that most effectively and
efficiently creates the necessary behaviors required for the creation of superior value for buyers
of the product or users of the service than their perceived values about the products purchased by
the buyers and services rendered by them which our business entity sells and provides and, thus,
continuous superior performance and competitive edge for the business in long term."
30 | P a g e
As such, Narver and Slater (1990) consider MO to be an organizational culture consisting of
three behavioral components, namely, i) customer orientation, ii) competitor orientation and iii)
interfunctional coordination. Empirical study found that among all three behavioral components,
interfunctional coordination, especially that between R&D and marketing has the most
significant influence on new product success. Interfunctional coordination creates synergy
among all the other components and helps in creating superior value for existing and potential
buyers of the product and users of the service. Without interfunctional coordination, the
behavioral components in isolation would be unable to create such value for customers or meet
their perceived level of satisfaction.
It is necessary for an organization to achieve sustainable CA in order to increase its marketing
performance (Porter, 1985). Achieving sustainable CA means creating superior value for
customers which can be sustained as well. The logic of sustainable CA can be understood by an
illustration. For example, a company offers a good ‘X’. It is necessary that the perception of
performance of the particular good must exceed the expectation of the customer for sustainable
CA to be achieved. ‘Value’ can be defined as the difference between the expected benefit and
actually perceived benefit from using the product/service that is offered by the seller of the
product. There are several opportunities for the seller to increase the value for the buyer by
increasing the benefits for the buyer(Forbis & Mehta, 1981).This may be in the form of a product
differentiations strategy. Product differentiation means the addition of some features toa product
which make the product unique or different from other such products being offered by the major
competitors of the sector. The other way to create value for customers may be to adopt the
strategy of cost leadership which means to decrease the cost of products or services which will

31 | P a g e
create value for money and will result in a competitive edge.A decrease in cost will give more
actual value to the buyer than his or her perceived value before purchase; hence, the business
will be able to achieve its corporate objective of greater value for money and competitive edge.
A third way of creating an actual value of a product or service that is more than its perceived
value is to focus on a niche market.
A niche market strategy segments the whole market on a suitable basis; for example,the basis
could be age pool of buyers, income group of buyers, gender, race, place, any specific brand, or
quality level, or any other which are deemed to be fit and reasonable in the given circumstances.
To be a successful segmentation, the segmentation should also consider the other MO
components: customer orientation and competitor orientation. After completing segmentation
successfully,a marketing approach is designedthat appeals to a particular minority market
subgroup. A typical product marketed using a niche strategy will be easily distinguished from
other products, and it will also be produced and sold for only a specialized group of users of the
service and buyers of that particular productwithin its corresponding niche market (Porter, 1985).
Before selecting any of the above-mentioned three strategies (product differentiation, cost
leadership and niche market), a business entity needs to conduct an in-depth analysis of its
external and internal marketsas this isa vital and strategic decision for the success or failure of
sustainable growth of the business.
A business aims to create and maintaina corporate culture which supports value creation for the
customer and a desire to achieve sustainable CA. MO is one of the ways through which this
32 | P a g e
corporate culture is achieved by creating superior customer value through efficiency and
effectiveness. Top leadership set that required level of corporate culture at all levels from top to
bottomthrough their role model contribution and by designing and developing processes and
procedures. This level of effort and culture also helps in achieving superior business
performance(Kohli & Jaworski, 1990; Aaker, 1988; Shapiro, 1988). A seller who believes in the
efficiency and the effectiveness of the MO understands the fact the sustainable CA can be
achieved through creating superior customer value by means of creating additional benefit for
customers or decreasing total cost of acquisition of products/services (Aaker, 1988; Porter,
1985). Such a seller knows that there are a number of these alternatives to achieving sustainable
CA. This seller continuously evaluates the alternatives and adopts the one which helps the
business achieve sustainable CA. Creating and maintaining long-term relationships with the
buyers is also necessary to maximize the performance of the business in the longrun. Market-
oriented sellers understand that they can share the benefits with their buyers to achieve long-term
high performance for their businesses (Hanan, 1985; Jackson, 1985).
There has been extensive debate in the literature about the major factors of MO.From a review of
the literature, three major behavioral categories of MO can be inferred:customer orientation,
competitor orientation and interfunctional coordination.Customer orientation and competitor
orientation are frequentlyreferred to as being part of a firm’s strategic orientation (Gatignon &
Xuereb, 1997).
Strategic orientation should reflect the broad base of those strategic choices that, if implemented
effectively and efficiently,should enhancethe financial and nonfinancial performance indicators

33 | P a g e
of an organization and should ultimately lead toward the successful achievement of the
organizational objectives and the gaining of a competitive edge.Customer orientation and
competitor orientation consist of the activities that are focused on the gathering of information
about the customers as well as competitors in a target market through all available means. This
information is collected as well as disseminated by the business itself in all departments at all
levels of organizational hierarchy. The third behavioral component, interfunctional coordination,
is about making behavioral efforts to develop strategies in response to the information collected
about the buyers and the competitors of the business. The scope of interfunctional coordination
extends beyond the systematic efforts of the marketing department. Marketing is only considered
to be one phenomenon or tool for creating the perception of the product or serviceby using
different means which help the relevant department in approaching the potential customer. Itis
vital that the offered product or service should have superior vale for the buyers of the products
and users of services.Superior value for buyers of a product or service is achieved through the
interfunctional coordination of all the departments of the business. In sum, the behavioral
components of MO are about collecting and disseminating information about the buyers and
competitors of the business and developing coordinating activities for achieving superior
customer value for the business. The inferences made for the behavioral components of MO are
inline with the findings of Kohli and Jaworski (1990).
MO can be defined as, “The organization-wide information generation and dissemination and
appropriate response related to current and future existing and potential customer needs and
preferences” (Narver & Slater, 1990). We now have a thorough understanding of the three above

34 | P a g e
mentioned behavioral components of MO and we are now going to discuss them separately in
detail.
2.1.1 Customer Orientation
Customer orientation is the first and most significant component of the three behavioral
components of MO. The customer orientation factor is the factor which is most closely
connected with the other two factors of MO: competitor orientation and interfunctional
coordination.The term “customer orientation” is used to describe the major emphasis
organizations place on evaluating and addressing customer needs and wants. The literature has
further explained customer orientation in the following ways.
The dissemination of information about customers throughout an organization from top to
bottom and all at all levels for the purpose of formulation of organizational strategies and tactics
to satisfy market needs interfunctionally and an achievement of a sense of company-wide
commitment to these plans of meeting customer need effectively and efficiently(Shapiro, 1988).
Kohli and Jaworski (1990) suggested that customer orientation represents the degree to which
customer information isboth collected and used by the business entity; in order to analyze the
customer needs consider the optimum way to satisfy those wants and achieve the organizational
goal of competitive edgeby fulfilling those wants in the most economical and beneficial
way.Such customer-oriented behavior and analysis helps an organization in creating that
organizational culture whichmost effectively and efficiently creates necessary behaviors among
all the human resources of the entity, which leads towards the creation of superior value for
buyers of organizational products and users of services and responds promptly to their needs and
wants (Narver & Slater, 1990).

35 | P a g e
“That strategy which emerges as a result of obtaining the customer information by all formal and
informal means at all levels and disseminating that information for analysis at all levels to have
such strategy at all organizational levels that gives the premium priority to customer’s prime
interest, and in the meantime it should also not ignore the interests and stakes of all other
stakeholders such as shareholders, managers, employees, lenders, debtors etc. in order to develop
a long-term and sustainably profitable enterprise” (Deshpande et al., 1993).
According to the above discussion in the literature it is clear thatcustomer orientation is an
integral component of a general, underlying organizational culture; therefore, attention to the
information about the customers and potential buyers of products and users of servicesshould be
considered along with the fundamental usual core values and beliefs that are most probably
required to enforcesuch a customer focus and give the entity an edge over its competitors and
result in more customer loyalty and create sustainable long-term growth(Deshpande etal.,1993;
Pelham & Wilson,1995).
The significance of the general nature of customer orientation is clearly highlighted in the
management literature. In particular,researchers in the field of strategic marketing
managementemphasized that a focus on customers wants, the analysis of the importance of those
wants and creating value in the light of the customer wants analysis should be the key factor in
the formulation, developmentand implementation of key business plans to achieve organizational
loyalty and other interrelated corporate objectives, such as long-term sustainable growth and
competitive edge(Webster, 1988).
36 | P a g e
The implication of all such steps that lead toward customer orientation is thatthe practice of
customer orientation at all levels of the entity becomesa cultural attitudeand standard practice of
all organizationalhuman resources at all levels. Many researchers, scholars and marketing leaders
also argued that customer orientation is not only a theoretical phenomenon to list in tan
organization manual but itis all about theimplementation of strategies to build a customer-
oriented organization. In fact, there has been a very strong argument by marketing and
management heads in favor of the adoption of a management approach based on customer
orientation throughout a firm (Slater & Narver, 1994a).
Customer orientation, specifically, is all about collecting and disseminating information about
the potential buyers of the products and users of the services of the business in any specific target
market. Business can develop understanding about the needs and wants of the buyers using this
information and can come up with superior customer value in a rapidly changing marketing
scenario (Levitt, 1960). Customer orientation is about understanding the entire value chain of the
buyer; it is about understanding their present needs as well as their future preferences depending
on the internal and external marketing dynamics (Narver & Slater, 1990).
There are two ways through which a seller can create value for the buyer. First, to increase the
benefit for the buyers in relationship with or compared to cost of products/services. It is also
necessary for the business to understand the cost and revenue dynamics of the buyers andthe
buyer’s buyers because market dynamics are actually driven by their demands. Hence, all levels
of economic as well as political and socialdynamics must be understood by the seller for a
particular marketing channel. This requires development of a comprehensive framework and

37 | P a g e
through this comprehensive framework the business becomes able to understand the needs of its
current customers and the preferences of its future customers(Narver & Slater, 1990; Porter,
1985).
The above discussion is all about the general attitude and culture of entities toward customer
orientation in order to identify and satisfy customer needs regardless of the nature and size of the
business organization. This becomes more vital in the context of SMEs because they normally
have less financial resources and human resources than bigger entities;they also possess a
relatively simple organizational structure, as a result of such constraints,in which they have less
formal procedures to get and process informationto performa reliable and effective customer
analysis which is the backbone to developing a customer-oriented strategy. Moreover,the
development of customer strategy is notworthwhile unless it is implemented; it should be an
integral component of internal controls and procedures to be practically effective for anSME.As
many SMEs cannot effectively and efficiently develop and implement a customer-oriented
strategy due to a lack of resources and lack of required level of competencies,this may become
detrimentalto their success or failure.
2.1.2 Competitor Orientation
Competitor orientation is the second of the three behavioral components of MO;competitor
orientation isan understanding of the short-term strengths and weaknesses of competitors as well
as long-term strategies and capabilities of current and potential competitors of the business
(Aaker, 1988; Porter, 1985). Competitor orientation must consider, like customer orientation, the
needs and wants of the current and potential customers in a particular marketing segment; this

38 | P a g e
requiresdevelopment of a framework of current capabilities to perform an analysis of competitor
orientation (Levitt, 1960).
Competitor analysis is vital,especially ina dynamically changing business environment,becauseit
compels the business to maintain market analysis and quickly respond to changes in its internal
andexternal business environments and competitors are always the biggest players in changesto
the external environment. Competitor analysis, the analysis of principal current and potential
competitors, must include the entire set of technologies capable of satisfying the current and
expected needs of the seller's target buyers of products and target users of servicesbecause it
leads the management to a formulation of a competitors-oriented strategy.The competitors-
oriented strategy will consider the impact of a competitor’s strengths that can fulfill the wants of
existing or potential buyers; failure to do this will lead to a reduction in customer loyalty and
may result in the shifting of existing or potential customers toward the competitor(Levitt, 1960).
In SMEs such ascenario will be seen as more harmfulbecause it might be more difficult for
themto recapturetheir customers once they left due to a not have a competitor-oriented strategy.
Porter’s SWOT analysis model (1979) clearly discussed competitors’ orientation in the form of
external analysis where we analyze the opportunities and threats of external market forces,such
as competitors. The strengths of competitors in competitors’ analysis are the areas where a
competitor is currently or potentially doing well or may have a competitive edge due to its
expertise or capability. The weaknesses of competitors are the areas where currently or
potentially competitors may lack or the required level of expertise or capabilities to effectively
and efficiently satisfy the market needs. The area where the competitor has strengths may create

39 | P a g e
a threat because in that area the competitor may create better value for customers; the area in
which the competitor is weak can become an opportunity to create better value for money and to
satisfy the market needs in a more effective and efficient way and to create further value for
current and potential customers and gain a competitive edge in market. Therefore,an
organization’s internal strengths are vital to grab opportunities and it needs to tackle its
weaknesses so that it does not give its competitors an edge. The strategy developed in the context
of such competitors’ analysis may be considered competitors’-oriented strategy.
The smaller and simpler organizational structure ofSMEs increases the significance of
competitors’ orientation asa smaller and simpler chain of commandaids quick decision making.
This may result in dynamic changes to the whole market; hence, competitors’ orientation should
be part of organizational processes and procedures at every level from top to bottom of the
managerial hierarchy to cope up with changes rather than relying on occasional competitor
analysis.
Competitor orientation is not only limited to analysis of current competitors and their areas of
strengths and weaknesses,butalso includes analysis of competitive intensity as the
competitiveintensity may differ in every scenario. Sometimes,a change in target markets or
change in core features of a product and change in class of customer on the basis of age, gender,
consumption pattern, brand loyalty, price or place, may reduce or increase the intensity of
competition in the same market. Entry and exit barriers analyses also play a vital role in the
competitiveness of entities(Tirole, 1988). Market growth is another strong factor which impacts
the level of competitiveness.If the market growth in a particular sector is fast and that sector of a

40 | P a g e
particular industry is growing rapidly, it may result in a less competitive enjoinment, whereas if
the market size is shrinking and the products of that sector have crossed the maturity level and
moving towards decline,then tough competition is expected in that particular sector.Hence,
competitor-oriented strategies and their effective implementation will be vital to the success or
failure of SMEs in such an environment (Baron & Kenny, 1986). The other important factor in
competitor orientation is the bargaining power of suppliers and the bargaining power of buyers;
the second is more vital because if the bargaining power of the buyer is higher it will lead to
more competitive rivalry among the competitors.Hence,development of a competitor-oriented
strategy and its effective and efficient implementation will become a more necessary factor in the
success and failure of the entity.
2.1.3 Interfunctional Coordination
Interfunctional coordination is the third of the three behavioral components of MO. It is about
creating superior value for current and potential customers of the business through utilizing the
resources of the business through well-planned and coordinated efforts. There is an opportunity
for the seller of a product or service provider to create superior customer value for a buyer at
every step of the value chain of the buyer. In today’s rapidly changing business environment,a
marketing department in isolation can never successfully create value for customers regarding
their products and services;Porter (1985) claims that every segment of primary and secondary
activities from inbound logistics to services is responsible for the creation of value for the
customers. The primary activities that Porter (1985) mentioned, other than marketing,that create
value in the value chain are operations, outbound logistics sales and service. According to Porter
(1985), supporting activities are firm’s infrastructure, human resource management, technology
development and procurement. Hence, every primary and secondary activity with interfunctional

41 | P a g e
coordination helps management in achieving higher value at every activity level and leads to a
higher value for a product and service for the buyer of the product or the user of the service.
Every employee in the company of the seller of the product or service provider entity has the
capacity of adding some value to the value chain (Porter, 1985) of the buyer. Today, creating
value for the buyers is not limited to a marketing function only; rather, it is a responsibility
shared by the every individual human resource in the entity which is selling any particular
product in a competitive environment or providing a service in same capacity(Narver & Slater,
1990).
The coordinated efforts of the employees in the seller company are analogous to a symphony
orchestra in which a conductor tailors the contribution of each subgroup to produce a synergetic
effect. In order to create superior customer value for customers, it is necessary that the seller of
the product or service provider must draw upon the required level of attention and integrate
effectively and adapt to changes as necessary to add optimum value for the customer. The seller
must use physical as well as mental resources to achieve superior customer value for the buyers
of the products or the users of the services. Therefore, it can be interpreted that the task of
achieving superior customer value is not to be accomplished by any individual resource personor
a single department; rather, it is to be achieved by the appropriate focus and structured effort of
the entire business at all levels from top to bottom layer of the managerialhierarchy(Webster,
1988).
The coordinated effort and structured integration of the resources of the business to achieve
value for customers is closely associated with customer orientation as well as competitor

42 | P a g e
orientation. Achieving superior value for buyers is a multidimensional concept, it is necessary
that the functions of the marketing department be coordinated and integrated with all other
segments of the business effectively to develop the marketing strategy of the business in
response to the needs and wants of the existing and potential customers, as well as those of the
existing and potential competitors and their intensity of rivalry(Wind & Robertson, 1983).
It is the role and primary responsibility of the top leadership or those charged with governance
and effective advocacy to overcome the isolation of the functional areas if a tradition of
interfunctional coordination does not exist in a business. It is necessaryto design, develop and
implement such strategy at all levelsto achieve interfunctional coordination within the business
entity. It is also necessary to develop interfunctional dependency and coherence among
departments in order to ensure that the departments consider it necessary to coordinate and
integrate for the completion of their tasks and activities. The participation of each segment or
department of the business will be enhanced by the drive of self-interest because they will be
rewarded for achieving superior customer value as a whole unit (Ruekert & Walker, 1987). The
marketing and advocacy departments of the business must be highly sensitive to the needs and
wants of the interfunctional coordination of all the departments in order to achieve the
interfunctional coordination at all levels of the organization(Anderson, 1982) because in the
current era of close competition and dynamic changes no business can survive in isolation.
Moreover, all the departments and functional units of the business are required to contribute in
value addition of the product or service of the concerned business entity in the value chain of that
particular business as the end product is the representative of the whole organization by creating
a superior value for its customer.This optimum value addition in the value chain is only possible

43 | P a g e
when all the segments, units, departments or components of a value chain are adding value with
a strong coordination at all levels of the entity from top to bottom of the entity. To achieve this,
the management needs to build processes, procedures and flows of the operations that are
interdependent on each other in such a way that they result in perfect interfunctional
coordination. A perfectly developed and designed systematic coordination at every level of
organization from top management to lower level managers and at a worker’s level will be
effectively implemented if it considers both customer orientation and competitor’s orientation.It
will create superior value for the existing and potential customers’ needs and wants and will
respond to any market-oriented change in an effective and efficient way as per the needs of the
relevant market.
2.2 Learning Orientation
The concept of LO was presented by Wang (2008) as values of the firms which have influence
over the process of acquisition of data by the firms. LO is defined as the basic attitude of
organizations towards learning. LOleads to product development and generatesCA for the firm
for its long-term viability in the market. It is considered to be the critical component of learning
organizations (Chiva & Alegre, 2009). LO is viewed as the group of organizational values
thatinfluences the generation and use of knowledge by the organization. The concept of LO is
usually associated with the concept of learning organizations. According to Calantone,
Cavusgil& Zhao,(2002), a learning organization is one that has LO. Also LO is in coordination
with MO. The organization which hasLO generates and uses knowledge to achieve a CA over
competitors. This is the case especially whenLO is adopted in strategic planning and it is being
executed at the organizational level. Calantone et al. (2002) defined the concept of LO asa
“firm’s commitment to learning, shared vision, open-mindedness and intra-organizational

44 | P a g e
knowledge sharing.” Tidd (1997) argued that organizations which have LO are in a better
position to understand several organizational factors influencing new knowledge regarding the
market and technology.
The conception of LO is a high-order construct which has sub-constructs or variables that
include commitment to learning, open-mindedness, shared vision and inter-organizational
knowledge sharing. The higher-order construct of learning organization is considered to be
crucial for the development of CA. Some studies have also proposed that this concept is
important to the improvement of the financial performance of a firm. According to Senge (1990),
the adoption of LO by a firm positively affects the financial performance of the firm, but he
argued that the firm has to incorporate learning into its strategy in order to achieve the benefits in
financial terms.
Shared vision is distinct from the other dimensions ofLO as it drives the direction in which the
learning will occur. To achieve a better theory and practicality of that theory, it is necessary that
one should combine both the direction and intensity so that a good and holistic construct ofLO
can be measured. According to Day (1994), many of the researchers who write about the concept
of learning in organizations believe that shared vision is crucial to learning among members,
departments and organization. The reason might be that it generates the direction as well as the
focus toward learning in organization. Withless commitment to learning and shared vision, it is
less likely that motivation toward learning in an organization can be achieved (Norman, 1985;
Senge, 1990). Furthermore, a shared vision ensures that individuals know what the organization
expects, what the results are that are going to be measured, what theories are in use and what will

45 | P a g e
create coordination among all members of the organization. As the environment in which
organizations operate is very dynamic and organizations face many problems in the form of
completion, customer requirement, quality and so on, it is very difficult to understand what to
learn and why but that does not reduce the importance of learning in organizations.Companies
that do not focus on a shared vision among their members and departments will tend to have
many ideas and learning experiences which will not lead to practical ideas because of many
“Thought Words” (Dougherty, 1989).
Sometimes new productsor services are faced with many different views because of the different
nature of each of the departments and their members (Clark & Fujimoto, 1989). These divergent
views reduce the ability of the management team or members of the organization to develop a
more centralized response to threats or opportunities leaving organizations more vulnerable than
before. However, a learning organization might not face such problems. According to Slater and
Narver (1995), learning organizations are more adaptive than non-learning organizations which
means that they can generate solutions to problems more easily and fluently.
As all organizations are influenced by the environment and basically want to influence it or at
least understand the environment, organizations that are more solution oriented through learning
and innovation will be more viable in the longer term. According to Jaworski and Kohli (1993),
market-oriented organizations able to detect and respond to environmental threats and
opportunities might face better overall financial performance.In the short term, an increase in LO
will likely enhance the quality and quantity of market-based information behaviors, such as
information generation and dissemination, and will indirectly affect the marketing program in a
46 | P a g e
better way. Quality of information and its interpretation by the members of an organizations as
well as organizational performance by enhancing the marketing information programs are likely
to increase in the long run.
The source of information which is collected by an organization is its customers. The
organization uses this information from the customers to improve the quality of products and
services produced by it. It not only increases the sales of the company but also strengthens the
customer base of the company. It also has a positive impact on strengthening of the knowledge
base of the company. The company with a strong knowledge base is able to utilize its resources
more effectively. A strong knowledge base can be critical in the case of traditional
manufacturing firms because they can use the knowledge to improve the effectiveness of the use
of raw materials and machinery of the firm. One of the cornerstones ofLO is acquisition and
application of knowledge effectively (Garvin, 1993). The continuous process of learning helps a
firm to strengthen its knowledge base. This makes the organization a more attractive and
effective collaborator to its customers, suppliers and competitors. The performance of the firm
keeps on increasing as it gains more knowledge about the basics, such as knowledge on how to
fulfill the demands of its customers(Day G. S., 1994). In addition to these functions, LO also
monitors the performance and strategies of competitors in the market, which allows these firms
to learn about, and learn from, the major strengths and weaknesses of the firms(Calantone,
Cavusgil, & Zhao, 2002).
It has been indicated by research that learning organizations have the capability to achieve higher
levels of strategic capabilities. These strategies capabilities are necessary for firms to develop
47 | P a g e
CA for the long run(García-Morales, Lloréns-Montes, & Verdú-Jover, 2007). These firms are in
a better position to understand environmental changes and cope with them more effectively as
compared to firms that do not have these capabilities. However, LO must be implemented
appropriately for this purpose. Garcia-Morales et al. (2007) also emphasized that knowledge
sharing among the employees of an organizations is also a characteristic ofLO. Theyalso
indicated that this characteristic has a positive impact on the financial performance of a firm.
Furthermore, Garcia-Morales et al. (2007) also indicated that errors may occur during the
process of knowledge dissemination and acquisitions, and this may result in a negative impact on
the financial performance of a firm.
Alegre and Chiva (2008) considered LOto be one of the key antecedents of knowledge
orientation. Some other scholars also indicated that bothLOandMOare necessary to achieve the
innovation in firms. Some firms have established the mediating relationship of the LO with the
MO and the firm’s innovativeness. Many researchers have indicated that MO can only enhance a
firm’s performance if it is synergized with LO (Baker & Sinkula, 1999; Farrell, 2000). Other
studies have regarded LO as an important construct to develop employee innovativeness which is
important to achieve the CA of a firm.
Akgun et al. (2007) indicated that the learning capability of a firm is positively associated with
the emotional capability of the firm. They emphasized the emotional capabilities of the firm as
necessary especially at the product development phase of the organization in order to arouse
innovativeness in the employees of the organization. Market-orientated firms only focus on
customers; therefore, they sometimes lose viable opportunities in the form of the emerging
48 | P a g e
customer or lose theirCAto competitors due to lack of technologies. LO by focusing on the
commitment to learning by organizations, its shared vision among employees, open-
mindednessto new products, as well as the sharing of knowledge among employees, develops the
knowledge-questioning and knowledge-enhancing values in an organization; thesebehaviors
adopted by organizations during MO are led to a higher level that enhances the capability of the
organization for breakthrough products or services and technologies, and gives proper focus to
the new markets whether competitors or customers (Farrell, 2000; Slater & Narver, 1995).
2.2.1 Commitment to Learning
As described by Baker and Sinkula (1999), LO is a multidimensional construct. The dimensions
of LO are usually defined in terms of values. Different authors have specified different values to
measure LO and one of the most significant is commitment to learning. Commitment to learning
plays the central and most important role in LO in SMEs.If an organization is not keen to learn, it
will achieve a weak learning environment (Norman, 1985). CA, which is necessary for the
organization for its long-term viability, can also be achieved through commitment to learning.
LO also enhances the performance of a firm by working with MO and EO in SMEs.Commitment
to learning can be defined as value which an organization puts to promote learning so that it can
achieve a learning environment which can ensure its survivability even in an extreme
competitive environment, such as in SMEs of developing countries. As learning is important for
the survival of an organization, it is necessary to obtain a level of commitment in an organization
to break stagnation. The more an organization puts pressure and focus on learning, the more it
will be able to achieve such an environment.Commitment to learning can only be achieved if it is
focused in a strategic manner; however, short-term investment in learning will generate long-
term beneficial results for the firm.In order to foster LO as the core value, the commitment of top

49 | P a g e
management of the organization is necessary because if the importance of learning is not
emphasized, then employees’ commitment to learning and a learning environment in the
organization is less likely to happen.
Top management and the role of managers in supporting this value are emphasized by Bapuji
and Crossan (2004). According to them, managerial support is necessary for developing the
conception of commitment to learning in organizations. They also emphasized the role that
managers can play and the specific moves they can adopt in order to foster LO in their
organization. The general rules of implementing LO have been developed by managers;it is very
important to implement these norms as they set a base for the people who are going to lead the
way to stimulate organization learning in the organization at individual as well as group
levels(Michna, 2009).
2.2.2 Open-mindedness
Another dimension of the multidimensional constructLO is open-mindedness. Open-mindedness
is based on the dominant mental models of an organization (Day, 1994). Organizations perform
some already defined procedures and activities that are based on their best practices; however,
with the passage of time these procedures become so evident in the organization that they tend to
become mental models. The use of mental models means thatwork is always performed in
similar ways which sometimes can be disastrous for organizations. With time these procedures
and work processes may become obsolete and sticking to them restricts the organization’s
growth. These mental models bind us to think and perform in a certain manner unless an
organization is open-minded enough to continuously improve these mental models by
questioning and critically analyzing them (Senge, 1992). Open-mindedness means to critically

50 | P a g e
evaluate the organization’s already established routines of operations while also keeping an open
mind to new ideas for the better production of products or services.
The postindustrial era is more dynamic and fluid than the previous industrial era; therefore, it not
only challenges the already developed methods of origination but also provides an opportunity in
the form of new and emerging markets. According to one study, under time pressure members
are restricted and thus open-mindedness is less likely to happen (Cepeda & Cegarra, 2008) and if
members of the organization believe that they are following or making an important decision
they are more likely to be open-minded. Some researchers also identified thatwe tend to support
those beliefs which we already know; however, a variation in those beliefs or work processes in
an organization changes the mental models of the members and thus forces them to change their
old attitudes.Such changes will identify the redundant procedures and practicesnot just for the
member but for the organization as well (Kegan & Lahey, 2001).
Open-mindedness is, however, difficult from an organization’s point of view because it is a
difficult thing to handle and management of the organization plays the most important role in
maintainingopen-mindedness in an organization. According to Schindehutte et al. (2008),
managers in an organization not only help individuals to understandopen-mindedness, but also
develop the necessary skills so that an organization’s goals can be achieved. Managers should
encouragedivergent ideas and routines as they might lead to an innovative culture in the
organization that will create a CA in industry. Thomke and Reinertsen (1998) reported in their
study that if managers allowed flexible opportunities in project activities and routines, they can
generate innovative behaviors among the members of the team or organization. Change can only

51 | P a g e
take place in those environments that allow individuals to carry out new activities or do not
restrict them from acquiring new skills and behaviors, even if they fail continuously or
repeatedly (Schein, 1993). So management not only has to change their perceptions about the
open-mindedness but also promote it in their employees and for that they have to accept the
small changes and even take risks themselves if any contingencies arise.
One of the most significant and difficult processes of organizations is to cope with competitors,
technology and dynamic markets as they have to change according to the new technologies and
must also develop their employees in order to keep the organization going. Also, knowledge is
not fixed as more and more knowledge is produced everyday, which has practical implications
while abandoning the former obsolete methods. However, organizations can still move on from
previous methods if they maintain open-mindedness towards the new methods (Verona,
1999).Our mental models describe to us how the world works and thus limit our ways of
interpretation and implementation of information and ideas (Day & Nedungadi, 1994). Former
success and failures form these mental models about not only how the world works but
everything in it, such as markets and organizations. These mental models also exist in
organizations restricting while also forming the way organizations work; even when these
models are abandoned, they can still operate within the confinement of the organization unless
organizations areopen-minded to critically question them (Day, 1994; Sinkula, 1994; Senge,
1992).
So open-mindedness is aligned with unlearning (Nystrom & Starbuck, 1984) which is very
important for organizational change. When organizations critically question their routines,

52 | P a g e
values, assumptions and beliefs, they are engaged in the process ofunlearning. As unlearning is
important for organizational change, open-mindedness is necessary to actually transfer the
unlearning process in organizations. Organizational unlearning plays the role of driving force for
new methods. It is important to unlearn old ways to learn new ones. However, it is necessary
foropen-mindedness to exist before the process of organizational unlearning can begin, as open-
mindedness ensuresa learning climate in organizations.
2.2.3 Shared Vision
For better indulgence any value in the organization, it is necessary to implement and share it in
the whole organization. In terms of LO, shared vision means to focus the learning process in the
whole organization(Sinkula et. al, 1997). According to Verona (1999),a shared vision of learning
in an organization is critical to have a meaningful learning experience in members of the
organization.However, members of the organization may want to learn, but it will be difficult for
them if they do not understand what to learn and how.
Another problem in organizations is there arefew creative ideas (i.e. people like to follow already
established rules and ideas) and even if the members of an organization produce creative ideas
they might not be implemented (Hurley &Hult, 1998). Organizations comprise different people
with different natures and due to the diversity of the members of the organization, sometimes
creative ideas are not converted into an implementation. Therefore, it is necessary to have a
single goal or vision to acquire a learning environment in the organization. Having a shared
vision of learning can lead toorganizational strength.

53 | P a g e
Vision that is shared among individuals of an organization is the prominent factor of visible
leadership (Tobin, 1993). According to Galer and van der Heijden (1992), such sharing of vision
or goals in an organization can be described as goal convergence.Shared vision is necessary to
actually have a synergy among MO, LO and EO as conflicting beliefs or goals not only confuse
the management but also reduce the ability of the management and individuals to be on the same
page.Conflicting beliefs or goals can disrupt information acquisition and its processing function,
which leads to poor decisions or responsiveness to challenges and opportunities in the
organization. Lack of shared vision also undermines the motivation of learning among members
of the organization(Tobin, 1993). However, it should be noted that vision or goals cannot only be
examined but also challenged and ultimately evolve. The most important aspect of shared vision
is that it should be understandableas well as known to all the members, which gives the whole
organization a clear direction, everyone will know what they are striving for and it will give
them a sense of purpose.
Organizations have different departments and these departments differ not only in their functions
and responsibilities but also in implementation and acquiring of knowledge (Brown &
Eisenhardt,1995). Thus it is not surprising that members of different departments perceive
innovation and learning in different ways according to their rules, functions and responsibilities.
For example, a member of marketing function might be more concerned about the market and its
knowledge and consider learning to be the outcome of knowledge gained from the market,
whereas a member of R&D department may focus on products and services and innovations in
tangible products which might cause a different interpretation of knowledge and learning.
However, a shared vision of learning not only synergizes the focus of the organization through

54 | P a g e
having a common objective in all the departments of the organization but in return also
achievesdesired objective with better consequences.
Shared vision of learning is like an internal communication and integration of objectives in
which various departments or members of the departments team up to overcomebarriers so that
information can flow between different departments and members of the organization; this leads
to an increased flow of information in different departments and achieves coordination with
other departments so that a shared vision of learning and innovation can be implemented and
achieved wholly (Brown & Eisenhardt,1995). Shared vision coordinates the knowledge among
all departments therefore givingmeaning to activities and tasks performed in the organization.
Thus it makes a desired goal to be achieved by the whole organization but also creates the way to
achieve it.
As a cultural value, LO acts as an antecedent of the knowledge-creation process, organizational
learning and facilitates innovativeness. According to some scholars(Cohen & Levinthal, 1990;
DiBella, Nevis, & Gould, 1996), LO also determines the location of where the learning will take
place and determines the nature of whatever is learnt. It also determines the channels through
which the organization learns and shares the knowledge, utilizes it which are involved in
conversion of the knowledge(Kim, 1998).
2.2.4 Creativity
Many researchers have defined creativity in many different ways. Previous literature provides
many definitions of creativity and according to Michael Mumford (2003)there is no rigid
definition."Over the course of the last decade, however, we seem to have reached a general
agreement that creativity involves the production of novel, useful products"(Mumford, 2003).
55 | P a g e
According to Sternberg andLubart(1999) creativity is producing a new product or service which
is not only new to the market but also expressesoriginality and brings imaginativeness to the real
world. According to Sternberg (2006), creativity has different types such as:
• Replication: Confirming that the given field is in the correct place.
• Redefinition: The attempt to redefine where the field is and how it is viewed.
• Forward incrimination: A creative contribution that moves the field forward in the direction in
which it is already moving.
• Advance forward movement: Which advances the field past the point where others are ready
for it to go.
• Redirection: This moves the field in a new different direction.
• Redirection from a point in the past: Which moves the field back to a previous point to advance
in a different direction
• Starting over/re-initiation: Moving the field to a different starting point.
• Integration: Combining two or more diverse ways of thinking about the field into a single way
of thinking (Sternberg, 2006, p. 96).
Creativity is used not just for the sake of building new products or servicesbut it also generates
CA for the organization. Managers try to instigate almost every type of creativity among
members because it is used as solutions to problems when an organization’s survival or
sustainability is at stake. Technology-oriented organizations are most dependent on creativity
such as Microsoft. These type of organization need creativity on a regular basis because their
normal operations are dependent on it.

56 | P a g e
Creativity is not just restricted to persons specially recruited for it. As organizations are highly
dependent on creativity in this dynamic environment, creativity is expected of employees in
modern organizations. A creative workforce is a resource in the modern era not just to an
organization but also to a country and its economy as a whole (Potts & Cunningham, 2008). In
the postindustrial era, many organizations are so dependent on creativity they generate their
resources and wealth from creative and intellectual properties (Napier & Nilsson, 2006). In
developed countries,the growth of creativity in any industry is faster than theireconomic growth;
the reason might be that organizations are more interested in investing in and following creativity
than other economic activities. More and more organizations are looking forward to developing
creativity in one way or another and in developed countries a large chunk of their economy and
resources come from creative processes and products.Although developing countries are not that
efficient in creativity and its relative processes and procedures, a growing number of studiesshow
a positive trend in creatively focused industries(Keith et al., 2014). Previously, it was
hypothesizedthat more creativity is invested and present in the arts and other studies relating to
it. However, that is not the case anymore. A lot of creative activities are to be seen in marketing
and business orientation strategy, as well as in scientific experimentation and in the R&D
departments of organizations. Now, product design and its development, which is not just only a
core activity but the whole organization’s smooth flow depends on it, are seen to be more and
more dependent on and focused on creativity (Sørensen & Vidal, 2006).
Creativity and KM are highly associated with each other. As creativity generates new knowledge
and ways to perform routine work or new products and services, these can only be performed if

57 | P a g e
there is a proper way through which knowledge is acquired, disseminated and processed within
an organization. According to Nonaka (1991), creativity and knowledge creation which are
essential now for the viability of the organization in the market are highly required features of
organizations and even an organization’s short-term profitability and success depend on it.
Creativity comesinto existence because of tacit knowledge and that knowledge creates
innovation or new products or services (Leonard & Sensiper, 1998), which ultimately reinforces
the concept of creativity among organizations and their members. So an entrepreneurial drive to
innovation,which according to some researchers is necessary to enter a new market or industry,
creates a CA for an organization (Haldin-Herrgard, 2000). Modern organizations rely heavily on
innovation that is actually an outcome of creativity (Amabile, 1988). Creativity is essential to
remain competitive and sustain a position in the market (Gloor, 2005).
Three steps are necessary to develop creativity in organizations among individuals: domain-
relevant skills, creativity-relevant skills and intrinsic task motivation (Amabile, 1996). Creativity
forces individuals to acquire the relevant knowledge that is necessary for the development of
strategies and products in order to cope with the external environment’s challenges and
opportunities (Elliot & McGregor, 2001). To engage in tasks related to creativity, one has to
develop the skill required to actually transform that creative idea into an actual product by
developing an intrinsic interest in achievement of the task.Intrinsic motivation is developed when
a stronger affiliation is developed with the task that generates the creativity in the first place
(Amabile, 1996). These steps of creativity lead to a stronger sense of LO in the individuals. As
LO is aligned with challenges and opportunities, a person with more LO and creativity expects to
face these challenges more easily (VandeWalle, 2001). Also, such an individual is intrinsically
58 | P a g e
motivated to the organization and the tasks and, therefore, more aligned to the creative
procedures and practices.Creativity means to develop and produce something new or relevant
strategies thatare not currently known to an organization (Janssen & Van Yperen, 2004). To
obtain such a level of creativity it is necessary to acquire knowledge that produces the desired
outcome for the organization and for members of the organizationto be engaged and encouraged
in a learning process.
2.3 Entrepreneurial Orientation
2.3.1 Entrepreneurship
Some studies have proposed guiding definitions for the conceptof entrepreneurship. On the basis
of a comprehensive overview of the literature, Cunningham and Lischeron (1991), Long (1983)
and Miles and Arnold(1991) agreed on following definition, “Entrepreneurship is a dynamic
goal-oriented process whereby an individual combines creative thinking to identify marketplace
needs and new opportunities with the ability to manage, secure resources and adapt to the
environment to achieve desired results while assuming some portion of risk for the venture.”
Cunningham and Lischeron (1991) looked for consistent patterns in entrepreneurs and came up
with four major areas: the adaptation of entrepreneurship, management and leadership styles, the
recognition of opportunities, and the study of personal characteristics. A specific set of beliefs is
associated with each area of entrepreneurship. These beliefs varied greatly, starting from
considering entrepreneurs as “great men” with in-borne abilities to considering entrepreneurship
as a process of leadership or organizing. In addition to these patterns, three formal theories of
entrepreneurship were proposed by Long (1983): (1) creative opportunism based on
identification and exploiting ideas, (2) having competency to perform managerial tasks, and (3)

59 | P a g e
risk and uncertainty stemming from a wide range of self-employment and obstacles. In any case,
entrepreneurship is either considered behaviorrelated or traitrelated.
A large number of studies emphasized studying the entrepreneurial abilities of a person. Several
variables have been studied relating to these traits ranging from need of achievement
(McClelland, 1965) to tolerance of ambiguity and internal locus of control (Begley & Boyd,
1987). There are only a few traits which have been supported by the empirical evidence. Cooper
and Dunkelberg (1986) carried out a study including 890 entrepreneurs and came up with several
traits that were associatedwith entrepreneurship. These traits included comparatively higher
education, coming from families thathad owned a business, working in the relevant field of work
and locating the business in the area from where they came. They concluded:“Diversity seems to
be a central characteristic of entrepreneurial activity and the new firms which are then
established”. According to some researchers, traits possessed by entrepreneurs are impossible to
profile(Low & MacMillan, 1988). Others hold the viewpoint that the personality traits of
entrepreneurs are important factors to be studied in future (Carland, Hoy, & Carland, 1984).
Several kinds of activities in which entrepreneurs get involved in while creating include
identifying opportunities in the market, producing products and services, marketing products and
services, securing resourcesand responding to demands of societies and governments(Gartner,
1988). Proactivity, risktaking and innovation are considered to be among the key characteristics
required to perform these activities. From these roles, it can be implied that entrepreneurship
plays a role of active management in which the entrepreneur has to work directly with internal
and external customers as well as members of intermediary channels(Covin & Slevin, 1989). It
60 | P a g e
can also be implied that, in every society, some sort of entrepreneurship exists at some
level(David & Morris, 1991).
The concept of strategic choice is one around which a significant part of entrepreneurship
revolves; although, there are a few studies that have also emphasized the concept of
entrepreneurial strategy (Low & MacMillan, 1988). These concepts are also associated with the
success of entrepreneurs (Carland et al., 1984). According to Bird (1989), “At the earliest stage,
most entrepreneurs will tend to be more or less creative, visionary, opportunistic, intentional, and
controlling. As their enterprises begin to take on lives of their own, intentional action
competencies (e.g., sustaining temporal tension, strategic focus, choosing ends and/or means,
and alignment of self and others into internal and external teams) will take on increasing
importance”.
Entrepreneurship is a behavioral-based as well as a trait-based concept. Mostly, entrepreneurship
is associated with enterprise-building skill; however, the concept of marketing competence and
organizational performance are also associated with it.
2.3.1.1Marketing and Entrepreneurship
Davis, Morris and Allen (1991) suggested a natural bond of value creation exists between
marketing and entrepreneurship. The existence of this natural bond was first indicated by
Schumpeter (1934). It has been recognized by many studies since then (e.g. Carland et al., 1984;
Vesper& Gartner, 1997). Schumpeter argued that entrepreneurial venture is identified by five
behavioral categories: (1) introduction of new lines of goods, (2) introduction of new methods of
production of goods, (3) developing new target markets, (4) searching and developing new

61 | P a g e
sources of supply and (5) industrial recognition. A sixth category was added by Bird (1989)
which is introduction of services. It can be noted that categories (1), (3), (4) and (6) are all
market-oriented.
There are several studies which have indicated and emphasized the important role played by
marketing in entrepreneurial process. Nicholson (1986) identified 10 critical factors of success
for emerging businesses and marketing was one of those 10 factors. This study also recognized
that entrepreneurs may need to exploit certain opportunities which may need some additional
competencies in the form of “sales”, technical information”, “marketing” and “human
resources”. Wortman (1987) also emphasized the importance of the association of
entrepreneurship with one or more of the entrepreneurial functions such as marketing.
Although, the association of marketing with entrepreneurship has been recognized by many
studies and researchers have started to emphasize it as a subject of study, mostly indirect factors
and variables of marketing have been studied in association with entrepreneurship. Recently,
only a few studies have explored the relationship betweenMO and EO. Morris and Paul (1987)
conducted research in Florida in which empirical evidence was collected from 116 companies.
Results of the study indicated that market-oriented companies scored high onEO. These
companies were found to have formal marketing research being carried out in formally
established marketing and research departments. These companies also recognized the
importance of marketing in strategic formulation and innovation, and they had marketing
managers at executive positions in the market. A study carried out by Miles and Arnold (1991)
on 169 furniture manufacturing companies indicated a positive correlation betweenMO and EO.

62 | P a g e
The research was extended and the results suggested that these two types of orientation are
different constructs and represent different underlying business philosophies. One of the key
factors differentiating the two constructs was environmental dynamics.
Van de Ven, Hudson and Schroeder (1984) conducted research on a startup of 14 educational
software companies.A large number of planning variables were included from an organizational
management perspective. The results of the study indicated that the successful entrepreneurs had
high external orientation, which was basically oriented towards developing business plans
thatincluded several factors such as looking for potential target market niche, evaluating
competitors, consulting professionals and quantifying the involvement of potential customers of
the business. Research on EO is at its initial phase (Hills & LaForge, 1992) but current empirical
evidencesupported the fact that entrepreneurs possess marketing competencies.
2.3.2 Organizational Performance and Entrepreneurship
Although there is a large variation in empirical evidence, figures from Small Business
Administration indicate that approximately 60% of small businesses fail within the first six years
of their commencement (Main, 1990). Major issues of importance concerning these small
businesses include high probability of under-capitalization and concerns over cash flows. With
such a high rate of failure of small businesses, a major area of concern for entrepreneurs is
survival of the business. In many studies, the survival of small businesses has been indicated as
the measure of performance of small businesses to study the relationship between organizational
performance and strategic management practices. This measure quantifies the performance of the
business to a limited extent. There are several reasons why this measure isgaining popularity.
One reason is the reluctance of small business personnel to share performance- related data.
63 | P a g e
Other reasons are lack of public information and reliance on trade-supplied aggregated data,
which may be based on accounting systems which are customized to a very high degree (Dess &
Robinson, 1984). Therefore, it is necessary to go beyond the survival of the firm in order to
measure and judge the performance of small firms.
A significant amount of literature also focuses on the planning practices of small firms in
relationship with their performance. Some studies have also indicated a positive relationship of
the performance of the business with continuous planning process. Robinson and Pearce
(1984)conducted a review of more than 50 studies which focused on the planning processes of a
firm. This study concluded that most of the firms were involved in strategic planning in relation
to the ultimate viability of the firms. There were only four studies which focused on continuous
planning by firms and its relationship with the success of the firm.
Covin and Slevin (1989) conducted a study of 161 small manufacturing-related companies. The
results of this study indicated that environmental hostility was significantly related with
entrepreneurial performance and strategic posture. The factor which contributed to
organizational success during hostile environmental conditions was entrepreneurial strategic
posture, while in cases of benign environmental conditions, a conservative approach was found
to be more useful. They concluded their study with:“Performance is, presumably, a function not
only of a firm’s organization structure and strategic posture, but also of the fit between these
variables and the firm’s business practices and competitive tactics.”

64 | P a g e
Morris and Paul (1987) indicated that the interrelationship between the MO andEO is
independent of the bottomline of the organization. Although there is no direct empirical evidence
to support the relationships between the performance of the company, entrepreneurship and the
planning process of the company,planning process has been recognized by the researchers as
important for capitalizing on marketing opportunities and dealing with the instabilities of the
firm (Meziou, 1991). Identifying and capitalizing on new opportunities is one of the key
dimensions of entrepreneurship. Strategic choice is another important factor which has been
associated with entrepreneurship. Literature on the processes of planning has supported the
relationship between continuous planning and success of the business. Entrepreneurs are
considered to be innovative and thought to be capable of conducting environmental scanning,
discovering new opportunities, capitalizing on them, taking risk, and planning for the future; a
relationship can be established between EO and the performance of a firm (Narver & Slater,
1990).
2.3.3 Entrepreneurial Orientation
The concept of EO was first presented by Miller (1983). According toMiller (1983),
entrepreneurial firms are those which are pioneers in introducing proactive innovation, undertake
risky ventures, and are involved in the activities of product marketing innovation. The concept
was further extended by Morris and Paul (1987); they indicated thatEO isa measure of the
propensity ofthe executive management of a company to take a calculated risk in their decisions
while being innovative and proactive at the same time. Lumpkin and Dess (1996)regarded EO as
the characteristic of a firm to act autonomously. Autonomous actions are those which are taken
by individuals and teams independently, which are focused on bringing up the vision or concept
for the business and then taken to its completion by the individual or the team. Another word

65 | P a g e
which is used for this kind of orientation is “aggressive competitiveness.”EO indicates practices
and processes that will lead to entry of the organization in the market. EO is defined in many
ways and by different constructs, such as autonomous, being innovative, taking risk, being
competitive as well as proactivity. It is stated that these terms may be aligned with new
entrepreneurial entrants in the market; however,successful and competitive entrants may only
have some of these characteristics.
EOplaces less emphasis on the relationship between business orientation and organizational
culture and it places more emphasis on firm performance, management style and structure
(Tzokas, Carter, & Kyriazopoulos, 2001). The combination of MO and LO helps organizations
to create superior value for their customers through quality products, services and processes.
Narver and Slater (1990) indicated that the major emphasis ofMO is on the customers and the
competitors of the business, while the major emphasis ofEO is on learning through the process of
experimentation. Competitive aggressiveness, risk taking, and proactive and innovative values
are embodied within the concept of EO (Lumpkin and Dess, 1996). This orientation enhances the
scope and opportunities for developing innovative products and services especially for the un-
served segments of the market (Hemal & Prahald, 1994).
2.3.3.1 Innovative
Innovation and its role in the entrepreneurial process was firstly discussed and emphasized by
Schumpeter in 1932. Schumpeter (1934) discussed a process of creative destruction that signified
that the disruption of existing markets and introduction of new products and services will
develop wealth among new entrants as the resources of existing organizationsmove towards the
new entrant, and thus growth of these organizations occurs. According to Schumpeter (1934),
66 | P a g e
this can only happen when there is a proper cycle of entrepreneurship and entry of new
organizations in the market that will lead to evolution of the economy as a whole.These studies
of Schumpeter opened a way to the important factor of innovativeness in entrepreneurship.
Lumpkin and Dess (1996) also indicated that EO has the dimension of innovativeness which is
necessary to provide solutions to novel and unusual problems, which can inform innovative
products and services or inform new technologies or processes to develop products and services.
According to Hean (2007), innovativeness means to engage in such activities that will promote
creative ideas and processes, while also examining them can result in the formation of new
products or services that are suitable for new and current markets while also changing the
business processes of the organization.If a company has an innovative culture it will probably
have more information flow in the organization (Zaltman, 1979). Innovativeness represents a
firm’s supportiveness to new ideas and its experimentation while also focusing on developing
creative business processes that will lead to new and better products and services or
technological processes. Innovations vary in their degree of change; however, the basic element
of innovation is to change existing processes, practices, technological processes or products and
services (Kimberly& Evanisko, 1981).
The most important and critical distinction in innovation might be between product innovation
and technological innovation. Most research has been done on technological innovativeness
whichincludes product or services development,engineering, or industrial and technical expertise
(Maidique & Patch, 1982). Product innovation emphasizes factors that are more aligned towards
a product and its details, such as its design, product acceptability in market, advertising and
67 | P a g e
promotion of the product (Dougherty, 1992). Both of these types are hard to distinguish as most
of the time product innovation and technological innovation are overlappingand work side by
side. Whatever the case, innovativeness is the most important part of EOas it provides the means
through which organizations can take part in the market by either facing challenges or gripping
new opportunities.
However, measuring the evidence or existence of innovativeness in a firm is not an easy task as
it can occur with different degrees at different intervals and at different times with different
magnitudes. Innovativeness might exist along the continuum or it might be a one-time event,
such as trying new products by designing them or following an experiment of different processes
and practices. To measure such diversity in the range of innovativeness several methods have
been employed by different scholars.For instance, in one study researchers asked managers of
different organizations about their willingness to abolish previous habits and mental frameworks
or practices and follow new alternatives while also examining their beliefs about experimentation
in the organizations (Karagozoglu & Brown, 1988).Expenditures or budget allocated to R&Din
an organization can also signify the willingness of the organization to have an innovative
environment. One study noted that the more engineers or scientists an organization had, the more
likely that the level of innovation in that firm was higher than other organizations deficient in
such human resources (Hage, 1980).Higher levels of innovativeness are associated with more
technically trained specialties in the organization (Miller & Friesen, 1982). Another study
measured the devotion to innovation by an organization by comparing the cost of R&D to
percentage of sales the organization attained. Innovation can also be measured by assessing the
quantity of new products or services launched and variations in products or services processes.

68 | P a g e
However, in technological innovativeness emphasis is on developing the latest and new
technologies and products. Technological innovativeness can also be measured by examining the
development in manufacturing processes of production methods. Many scholars such as Zahra
and Covin (1993) have focused on technological innovativeness by measuring the functions
performed in implementation of technology, such as acquiring, developing and deploying the
technology in the organization. In their study, organizations were questioned about their focus on
technological development and their reputation in acquiring and implementing the new and
advanced technological methods. Many previous studies lacked such measurement because they
were more focused on product-oriented innovation. Saleh and Wang (1993) tried to identify the
efforts which are required to measure innovativeness. In their study they compared low
innovative cultured organizations with highly innovative culturedorganizations. Measures such
as financial or human resources are simple and easy,and useful to measure innovativeness and its
spread in a given organization.
Whatever the case, whether it is product-oriented innovation or technological innovation and
how they are measured, innovation is the most significant construct of EO. Organizations with a
highly innovative culture tend to focus on new ideas and processes that will lead to a CA for the
organization in the short as well as in the long term. However, organizations that emphasize
innovation in more of a strategic manner tend to be more successful and competitive in the
market. They are better able to cope with the external environment and are not just influenced by
it but also try to influence it. Innovation produces a sense of flexibility in the minds of the
members of the organization thus giving them opportunity to break free from the mental

69 | P a g e
framework of the organization and its routine practices and procedures. Such a condition helps
them to translate their ideas into reality and might just make organization more competitive. Also
innovation tends to make members of the organizations more fluent in presenting their ideas to
top management as they know they are not restricted to do so. Innovation is also helpful in
creating a synergy among the members as well as departments of organizations and even within
organizations. In an innovative culture, members will present their ideas to one another more
easily thus making the organization more focused towards their goals. This will also ensure an
easy flow of information because everyone will bring their ideas and information to share with
others so that the organization can move forward in a more competitive way.Innovation willnot
only initiate creative behaviors and ideas in members of the organization, but also the flow of
information and the shared ideas will ensure that these ideas are properly discussed among
members of an organizations and its departments; thiswill probably result in more new products
and services and a smooth flow in the development phase of products (Han et al., 1998).Many
researchers also suggested that in order to survive and to remain viable in the current competitive
market, innovation might be the only solution for organizations (Kim & Maubourgne, 2005).
2.3.4 Proactivity
Proactivity can be defined as anticipation of and actions on future needs and wants existing in the
market. Through proactivity organizations try to dominate their competitors to produce a CA by
initiating aggressive moves, such as introducing new products and services or capturing new
markets and opportunities, while also facing challenges and doing activities to fulfill expected
future demands in order to either create, shape or change the existing environment (Keh et al.,
2007).These steps provide the first moving advantage that will generate the CA for an
organization.
70 | P a g e
Organizations satisfy their customers by constantly scanning their external environment and
acquiring knowledge about the needs of their customers and their relevant competitors(Slater &
Narver, 1998). Proactivity of the organization towards its external environment generates the
information that is not only necessary to properly engage in market-oriented activities but also
impact competitors (Hean, 2007). For a better position in the market it is necessary to develop
proactivity, as the constant scanning of the external environment will ensure the organization
avails itself of the opportunities and capturesnew markets. To take advantage of new market
opportunities, organizations have to be more focused on proactivity and innovation because they
will generate new products and services (Lumpkin & Dess, 1996). A higher degree of
proactivityleads to attainment of resources by exploiting the environment and those resources are
invested in new products and services. Organizations that are more proactivity oriented are better
able to understand their environment and in return are more competitive and productoriented.
Changes in the environment and uncertainty create challenges for organizations but also generate
opportunities. Organizations that are more responsive to the external environment are better able
to understand the market signals and make decisions relevant to customer needs (Morris et al.,
2005). Taking decisions and making plans in such conditions is difficult and can create problems
for the organization, but exploitation of such opportunities or challenges might create a CA for
the organization. Proactivity helps in such conditions and such exploitation of opportunities will
in return provide a further opportunity to exploit new markets. Moreover, this will create a sense
of security as top management and members of the organization will not feel threatened as they
are already providing new products and services in the market. Also such steps will ensure them
71 | P a g e
sustainability in the market (Leonard-Barton, 1992). Proactive organizations make strategic plans
for the existing market or to enter a new one. Highly proactive organizations tend to be the first
movers and set trends and rules and regulations for the followers in industry and thus reap the
benefits ofCA in the relevant market(Smith & Cao, 2007).Firms with a high level of proactivity
exploit the environment and thus enjoy high demand of customers and their loyalty and
profitability. These firms also change the way industry works; therefore, they not only increase
competition in the market but also pressurize the competitors to follow the new rules and
regulations set by them (Smith & Cao, 2007).
As globalization is the major concern, organizations have to proactively sort out the
opportunities and challengesto maintain their presence in the market (Knight & Cavusgil, 2004).
By doing so, organizations not only attain a better image in their home country, but these
aggressive steps of proactivity will provide them the opportunity to go for the foreign markets
and develop a CA (Pérez-Luño et al., 2011). Organizations more aligned towards the needs of
the foreign market are better able to exploit opportunities in the international market by
managing their capabilities (Morris et al., 2005).
However, costs are also aligned to understanding the nature of foreign markets, their trends,
customers and suppliers, materials inflow and outflow, as well as the time and resources to
properly move towards foreign markets (Calabrese et al., 2005). An organization with high
proactivity might bear such costs but organizations with low proactivity have to make deals to
obtain knowledge from the markets by looking either at some core customer processes or by
looking towards competitors’ processes (Unger, Rauch, Frese & Rosenbusch, 2011). As most
72 | P a g e
SMEs are resource deficient, latent is the most suitable option as it reduces the cost, is less time
consuming and obviously resources are easily managed for such operations.
Organizations with low proactivity are pushed towards the foreign markets and they strive for the
survival, such organizations make their way to new market find themselves in the hump of
competitors but efficiently manage their business (Gassmann & Keupp, 2007). And even though
they might not perform like highly proactive organizations they do well in the foreign markets
and might even reach a high level of recognition in the new countries just like highly proactive
organizations (Johanson & Vahlne, 2009).Organizations with a moderate level of the
proactivitymight not be market oriented or able to identify relative opportunities yet they still try
to understand their foreign market and investigate the feasibility of the market better than other
organizations (Arenius & De Clercq, 2005). However, such organizations do not move
aggressively towards foreign markets but they also do not follow other organizations to increase
their band of service in other countries, due to which it is possible that such organizations are not
that visible in other countries. Such firms thus incur costs in their search for suitable markets and
in finding out about customers and suppliers (Leonidou et al., 2007).
2.3.5 Competitive Aggressiveness
Competitive aggressiveness is the final dimension; it refers to the high level of effort carried out
by a company to compete with and outperform its competitors in the industry. According to
Lumpkin and Dess (1996), competitive aggressiveness means the degree to which any
organization performs so that it can surpass its rivals or competitors in an industry by being
responsive to a competitor’s strategies and providing tough competition. Most of the moves in
competitive aggressiveness are characterized by aggressive responses aimed to overcome threats

73 | P a g e
and improve the position of the company in a competitive environment (Lumpkin & Dess,
1996).An organization can also be reactive to competitors when it is defending its market
position or when it enters a new market where a previous organization or competitor has hold of
the market share. So the main part in competitive aggressiveness is about challenging rivals in an
industry to gain a CA and that can be done through many strategies such as cutting the price of
the product, leveraging profitability, taking bold steps to reduce the sales of the competitor,
increasing your advertisement budget and improving a product’s quality in comparison to the
competitor.
As said earlier, proactivity is used to attain resources from the market to develop new products or
services; however, competitive aggressiveness is used to defend those resources. An organization
first tries to make a new market and if that happens, it defends it from other competitors (i.e.
competitive aggressiveness). As a competitive aggressiveness organization tries to reduce the
influence of competitors in the market, it can also bolster the innovation and proactivity in its
culture to do so. Managers mostly use a competitive aggressive technique to save the
organization from a sudden attack of competitors or when survival is at stake, such as in case of
new industry trends. First movers or industry leaders have to be competitive aggressive as they
hold the competitive edge over the followers in the industry.
Organizations also have to be technology oriented because otherwise they can lose their edge or
lose theirmarket share. According to Dess & Lumpkin (2005), organizations can achieve more
EO through competitive aggressiveness in the market by either reducing the price of their
products or by imitating the practices and procedures of their successful competitors. Making an

74 | P a g e
announcement about new products or services can also be a strategy of competitive
aggressiveness to check the position of the competitor on relevant matters or to discourage them
from producing such products, as well as pressuring them to come up with new products.
However, overly competitive aggressive can be a disaster for an organization as well because it
is not necessary that competitive aggressiveness will lead to CA. Many organizations and their
CEOs have severely damaged their good image by being highly competitive aggressive, such as
Microsoft. Therefore, competitive aggressiveness is best served when used moderately rather
than aggressively as organizations that tend to follow competitive aggressiveness and exploit
opportunities might be more profitable than their competitors inthe long as well as in the short
term if they tend to reduce the powers of their competitors not to totally remove them from the
equation.
In contrast to these concepts is taking risks which is about the willingness of an entrepreneur to
allocate significant resources to business ventures that might fail. Risks are calculated and
moderated most of the time and firms are usually aware and prepared for the unknown before
entering into aventure.
2.4 Firm Performance
Different measures and procedures of measuring firm performance have been developed by
different disciplines of academics including sociology, strategic management, psychology,
operations management, marketing, human resource management, economics and accounting
(Marr & Shiuma, 2003). Firm performance is measured on the basis of procedures adopted by
the particular discipline to judge the efficiency and effectiveness of the performance of the firm;
however, in business research, the issue of measuring firm performance continues to be debated

75 | P a g e
by researchers (Fahy, et al., 2000). Methodological heterogeneity is found among the procedures
developed and used by different business researchers.
Murphy, Trailer & Hill(1996) suggested that it is necessary to indicate the dimensions upon
which the performance of the firm is to be judged especially when carrying out entrepreneurial
research. The rationale of this research must be based on theory and it is recommended that
multiple measures of measuring firm performance must be utilized when it is feasible to do so.
Measurement of the performance of a firm can be ambiguous so the variables of age and size of
the firm must be used as control variables in such research.
A traditional measure used for measuring the performance of a firm is BSC. Kaplan and Norton
(1992) were the first to introduce this technique in a study; they carried out the study on 12 firms
over a period of approximately one year. This study suggested that in order to carry out a study
on the performance of a firm, carrying out a study of financial measures is not necessary, and
there are other variables that must be considered while carrying out a study on the performance
of the firm including customer focus, knowledge and competence of the firm. There are four
major areas of a firm that are targeted by the BSC approach and provide a holistic view of the
performance of a firm: (1) internal business which deals with how the business achieves the
balance between profits and customer satisfaction; (2) learning and innovation which deals with
the development and innovative procedures while working in a competitive environment; (3)
meeting the needs and wants of customers to deliver satisfaction resulting in their recommending
the business to other customers; and (4) finances which deals with meeting the needs and wants
of the internal customers of the business. Internal customers include employees and shareholders

76 | P a g e
of the company who are expecting good returns on their stakes in the company. Kaplan and
Norton (2005) suggested that there should be a balance between these four areas to align the
performance measures with the business strategy of the company. Gumbus (2005) reported that
approximately 50% of the companies included in the Fortune 500 use BSC as their performance
measure; however, its use in the case of SMEs is rare. It is very difficult for the managers of
firms to handle and use this tool because there are a very large number of measures of
performance of the company. It is difficult to comprehend the results of measures based on this
tool. Gumbus and Lussier (2006) indicated that managers can modify BSC according to their
own needs and it can be used to accomplish the needs of wide variety of firms.
In addition to the BSC, there are a number of qualitative as well as quantitative measures of
performance of firms which are recommended by researchers to business managers (Vorhies &
Morgan, 2005). Quantitative measures are mostly concerned with the cost involved in
manufacturing concerns and measure the performance of the firm solely on the basis of the
financial performance of the firm. However, it is not possible to quantify all the measures of
performance of the firm (Galayini, Noble, & Crowe, 1997). The most common financial
measures of the performance of a firm include return on equity, return on assets and return on
sales/profit margins. Qualitative measures of firm performance consist of measures based on the
satisfaction of internal and external customers of the company. Internal customers of the
company include employees and shareholders of the company while the external customers
include the customers of products and services of the company. Stone and Banks (1997) reported
that approximately 23,000 employees have been employed by large firms and the firms which
were studied in this research mainly emphasized financial performance of the firm. Results

77 | P a g e
indicated that 43% of the firms emphasized their profitability, 24% of the firms emphasized
customers, while 13% on the employees of the firm were dependent upon financial performance.
Due to recent emphasis on quality improvements led by the customers of the firms, measures
which are based on customers are gaining popularity. These measures also reflect positively on
the profitability of the firms. Customers are surveyed for feedback and complaints, and the
measures of performance are based on this feedback (Stones & Banks, 1997).
While studying the role of employees of the company as performance measures, a big role is
played by the perception of culture. Employees from different cultural backgrounds make
decisions differently at all levels of a firm. Surveys are conducted at organizational levels which
help in suggesting changes in the environment at workplaces. They also indicate the feelings and
state of welfare of the employees by obtaining feedback from employees(Stone & Banks, 1997).
Qualitative measures of firm performance include team spirit, morale, improved communications
and induction of cultural changes.
For small firms, non-financial and subjective measures of performance are more relevant as
compared to the quantitative measures. They are in the form of intuitive quality measures. In the
case of small businesses, the owner of the business is usually the manager of the business. For
such a business,the smooth flow of cash inflows is necessary (Jarvis et al., 2000). Monkhouse
(1995) indicated that small firms rely on internal benchmarks developed by the owner-manager
and they are non-financial in most cases. In benchmarking importance is given to, in ascending
order,innovation, flexibility, resource utilization, competitive performance, and quality. The
78 | P a g e
researcher of this study also indicated that qualitative or soft measures of performance cannot be
abused or over-used.
There are some quantitative measures of performance which are easy to be ascertained as
compared to the qualitative or soft measures of performance, including staff turnover, number of
complaints registered by customers, and financial ratios. As compared to these quantitative
measures, qualitative or soft measures, such as customer perception, leadership or employee
morale are very difficult to ascertain (Pun & White, 2005). It is necessary that the performance
measure used by a firm at any level in an organization be associated with the achievement of the
strategy of the firm. The achievement strategy of the firm can take several forms, such as
innovating products and services, improving the performance of products and services,
motivating employees, pleasing and valuing the stakeholders of the company (Pun & White,
2005).
A review of the literature of organization performance suggests that it is a multidimensional
construct. Among its several dimensions, customer, operational and financial-related
performance domains are the most important dimensions (Kaplan &Norton, 2000). Researchers
who intend to measure the performance of firmsneed to take a multidimensional perspective.
Measures of efficiency and effectiveness can be used to determine the performance of a firm.
Efficiency is related to optimal resource allocation while effectiveness is associated with the
consolidation of market positions, which include new product success, market share, sales, image
and customer satisfaction (Gonzalez-Benito & Gonzalez-Benito, 2005). In the case of large
firms, it is very difficult to determine when the firms are earning profits because there are several

79 | P a g e
opportunities of earning profits which are foregone by the firm due to several purposes. If this
perspective is taken to be true, then a small business which is growing cannot said to be suffering
from loss if it is earning low proportions of profit margins (Covin & Slevin, 1989). Slater and
Narver (1996) indicated that an accurate measure of determining organizational performance can
be achieved by balancing the growth in sales of the company with its profitability.
Dawes (1999) suggested objective as well as subjective measures of performance of a firm. The
objective measures are based on recording observable facts while the subjective measures are
based on the estimates and opinions of respondents. Subjective measures are mostly
qualitativeand are based on interviewing respondents, while the objective measures are based on
asking the respondents about their opinions on quantified measures. Objective measures are also
based on recording and analyzing secondary data (Vorhies &Morgan, 2003). Selnes et al. (1996)
reviewed a large number of studies that reported on the association between firm performance
and MO. This study included studies in which firm performance was measured by the
researchers objectively as well subjectively. Dawes (1999) indicated there was a consistency
between the objective and subjective measures of performance for more than 50% of the studies
which were included in the research. Gonzalez-Benito and Gonzalez Benito (2005) indicated that
the association found betweenMO and firm performance measured using subjective measures in
which firm performance was measured. Jaworski and Kohli (1993) reported a positive
association between the performance of a firm measured using subjective measures andMO but
this relationship was insignificant when the subjective measures of performance were replaced
by objective measures of performance. Unger et al(2011) carried out a meta-analysis of the

80 | P a g e
literature of EO and found that EO was associated positively with the performance of firms when
the performance was measured using objective measures of firm performance.
In contrast, Santos-Vijande, Sanzo-Perez, Alvarez-Gonzalez & Vazquez-Casielles (2005) used a
pre-established objective to evaluate the performance of afirm; this objective was based on a
comparison of performance outcomes with expectations. Subjective measures of firm
performance are very useful in measuring performance across organizations existing in a
particular segment of market or particular industry because subjective measures allow
quantification of the objectives of the competitors and comparison with the objectives of the firm
(Fahy et al.,2000). Rauch et al. (2009) indicated that the perceptual measures of performance of a
firm are more closely associated with the personality of the manager-owner than the outcomes of
an organization. However, using such a method of measuring performance may result in
producing a “halo-effect” which is the bias in measuring the performance of the firm. Gonzalez-
Benito and Gonzalez-Benito (2005) indicated that when single respondents are involved in a
study, a false correlation can be observed between the desire to portray a positive image and
response styles. A solution has been provided by research to address the issue which involves
including a large number of respondents and customers from within and outside the company
(Slater & Narver, 2000). The social desirability of a firm’s action is measured through this
process; however, the methodological alternatives used by the organizations increase the cost to
the business.
Uncles (2000) argued that within the domain of MO, “Virtually all studies rely on self-assessed
business performance, rather than formal assessments (e.g. little use is made of formal financial,
81 | P a g e
operational and customer related performance measures)”. Although positive association
betweenMO and subjective firm performance was reported by Jaworski and Kohli (1993), the
researchers of this study suggested a narrow range of measures of firm performance to be used,
“it would be useful to explore the complexities of the relationship between marketing orientation
and alternative dimensions of business performance in future studies”. Harris& Ogbonna (2001)
and Slater and Narver (1994) emphasized that it is necessary to study the impact of MO on the
performance of the firm when it is measured using the objective measures of firm performance.
Objective approaches are preferred by some researchers because difficulties are associated with
objective measures of performance because most of firms are reluctant to share financial data
(Caruana, 1998). Return on assets, profitability and sales growth is among the most commonly
used objective measures of firm performance. Hult and Ketchen (2001) indicated a positive
association between organizational learning, entrepreneurship, innovativeness and MO on
performance of a firm when measured in terms of stock prices, income change and five-year
average return on investments.
Growth of an organization is used as the proxy for the performance of a firm in entrepreneurship
literature. This measure is preferred in entrepreneurship literature because it is more accessible
and accurate as compared to confidential financial performance measures (George & Zahra,
2002). Financial performance evaluations such as relative cash inflows, profitability and gross
margin have been used in combination with growth (i.e. growth in number of employees or
growth in sales of the company). Davidsson and Wilkund (2001) argued that the financial
measures growth in sales of a company is more relevant in the case of small firms. Their
explanation for this is thatan increase of $10,000 in revenue as compared to previous year’s total

82 | P a g e
revenue of $10,000 is a very large and significant increase in the case of small firms; however,
this increase is very minor and insignificant in the case of large firms where the previous year’s
annual revenue was $1,000,000. In contrast, large firms are favored by the utilization of absolute
growth.
2.5 Marketing Capabilities
Literature which is based on resource-based view defines capabilities as the accumulated
knowledge and managerial skills required creating CA through deploying assets appropriately
(Teeceet al., 1997). Day (1994) defined marketing capabilities as an integrative process which is
designed by the marketing managers for application of accumulated knowledge, resource and
skills of the firm concerning the markets in order to fulfill the needs of the business. It enables a
business to survive in a competitive environment and makes it able to add value to products and
services of the business. Three major classifications of marketing capabilities have been
presented by Day (1994): (1) inside-out capabilities which ensure effective marketing
participation on behalf of a company in activities such as marketing management, human
resource management and financial management; (2) outside-in capabilities which provide
business with the necessary guidance for comprehension of clientele and markets, and helps
developing strong reputation of the firm which results in strong relationships with the key
customers of the business providing long-term benefit to the business; and (3) spanning
capabilities which integrate inside-out and outside-in approaches, and contribute in the form of
activities such as internal communication and new product development. According to Fahy et
al. (2000), outside-in and spanning capabilities are those which are reported to have a positive
empirical and significant impact on the performance of firms. Marketing capabilities can be
arranged in the form of a hierarchy starting from marketing culture, proceeding with marketing

83 | P a g e
strategy and ending with marketing operations (Fahyet al., 2000). According to Smart & Conant
(2011), there is no distinction between different classifications of marketing capabilities. Other
terms which have been used for marketing capabilities include marketing-related actions and
marketing competencies. Marketing-related activities in firms include effectiveness of marketing
communication, ability to differentiate among the marketing offerings, marketing knowledge,
control and evaluation. Such evaluations are carried out by firms to survive and thrive in a
competitive environment.
According to many researchers including Moller and Anttila (1987), and Guenzi and Troilo
(2006), in order to achieve CA, it is necessary to achieve marketing capabilities. In order to
survive and thrive in a competitive environment, marketing is the key among other business
operations. It is because marketing helps in professional and insightful analyses of target markets
of the firm and can reduce the risk of venture failures (Dencker et al., 2009). However, in the
case of small businesses, it is one of the most significant issues faced by managers because of
higher levels of uncertainty as well as constraints of resources such as capital and finances. One
of the major issues faced in the area of marketing by any newly started business is low awareness
among the potential customers and consumers of the business. Some issues are also raised by the
geographic location or market factors in which the business operates. Potential customers of the
business, even when they are aware of the activities, products and services of the business are
reluctant to put trust in a newly started business and there are very limited opportunities for
growth at the initial stages (Dencker et al., 2009).
There are no quantitative marketing hypotheses for small business startups. Mostly they rely on
objectives, motivations, attitudes, beliefs and sometimes even on gut-feelings (Carson &

84 | P a g e
Gilmore, 2000). However, small business owners might put effort into their businessesto
organize their activities. Planning is haphazard and informal at initial stages and it is almost
never documented. Consequently, weak planning results in poor decision-making and marketing
planning. A partial emphasis is placed on marketing activities by entrepreneurs in response to
current needs of the company but emphasis on organizational planning is placed very rarely.
New business owners do not conduct an analysis for potential customers and no strategy is
developed in this regard (Carson & Gilmore, 2000). The owners of new small businesses are
very much busy in responding to the current competitive pressure and rarely focus on marketing
capabilities and competencies to locate their potential customers to stimulate revenue generation
for the company (Stokes, 2000).
Medium-sized, high performance manufacturing firms in the UK conduct marketing research for
proactive planning and spend a lot of time in developing strategies for survival and succeeding in
the future as compared to their counterparts in the USA. High performance firms can be defined
as the firms which self-report on a number of factors such as return on investment, market share,
sales volume and profit, as an attempt to become able to outperform their competitors
(Brooksbank et al., 2003). Their study also indicated that marketing research is carried out by
these firms at a very large scale, including focus group sessions and survey questionnaires. The
main objective of such research performed by high performance firms is to develop a long-term
strategy and explore new perspectives, which help them developCA that ensures their success in
the future. Marketing is seen as a tool of stimulating revenue and increasing sales in medium-
sized enterprises (Brooksbank et al., 2003).
85 | P a g e
The concept of networking has been employed by the marketing/entrepreneurship interface as a
means of marketing (Miles & Darroch, 2008). Network marketing is considered one of the key
roles to be performed by the entrepreneur and it is accomplished through creating and developing
networks of personal contacts (Gilmore et al., 2006). One of the major advantages of marketing
observed in the local as well as international market is in the form of close association between
the entrepreneur and the customers of the business. Relationship marketing is considered an
effective and important tool not only in large firms but also in small entrepreneurial businesses.
Theability to adapt according to the changing environment and make creative decisions are the
features that make small businesses flexible (Fillis & McAuley, 2000). These small businesses
can flexibly use their core competencies more effectively as compared to large firms which have
to rely on the traditional marketing framework (Hill, 1992). The type of marketing tools and
processes adopted by small firms depends on the stage of lifecycle of development of the firms
(Carson & Gilmore, 2000). It is also dependent on four categoriesof classifying firms developed
by Miles, Snow, Meyer & Coleman (1978): prospector, analyzer, defender or reactor. Smart
&Conant (2011) indicated that prospector firms are externallyoriented firmsthat consider the
environment in which they operate‘uncertain’, welcome change, promote freedom and flexibility
as opposed to strict set of rules and regulations, meet marketing needs and demands by applying
innovation, and maximize new opportunities by scanning the environment. As compared to the
analyzer, defender or reactor firms, the marketing competencies of prospector firms are superior
on a number of dimensions of marketing competence and outperform their competitors.
Atuahene-Gima, Slater & Olson, (2005)conducted a study on large manufacturing and service
sector firms in North America. The results of the study indicated that even in large firms, the
86 | P a g e
highest levels of customer orientation and innovation orientation are possessed by prospector
MO. Furthermore, these firms possessed the lowest levels of cost orientation as compared to the
strategic groups in the other regions. O’Regan et al. (2006) also indicated that prospector
characteristics were possessed by growth-oriented firms. These firms are continuously looking
for new opportunities of growth in the market.
Small firms have rarely been distinguished on the basis of entrepreneurial marketing (Stokes,
2000). Small firms are considered to be homogenous. They do not consider themselves to be
emerging or mature enterprises which makes them similar. However, studies also indicated that
the marketing strategy employed by micro-firms that employfive or fewer people is entirely
different from the firms that employee about 20 people, but both of these firms are placed in the
category of small firms. It is also noteworthy the entrepreneurial characters are found in the
marketing capabilities of the small firms (Chaston, 1998).
In order to conduct basic marketing activities, it is necessary to develop an organized set of
marketing capabilities. It may be based on a combination of selection of target markets, market
segmentation, gathering information and analyzing it to interpret market demands,
communication of services being offered to the target markets, pricing strategy, and planning to
develop new services necessary to serve the new target markets (Day, 1994). Personal selling
and advertising promotion can be used to achieve these activities (Vorhies et al., 1999).
Six different marketing processes were identified by Vorhies et al. (1999) which are similar in
characteristics to those identified by Smart &Conant (2011). These processes add value to the

87 | P a g e
products and services of a company when reaches the target customers of company. Marketing
principles are the basis of these processes and they include marketing management, promotion,
distribution channels, pricing, product development and marketing research. A network of
information supports and provides a platform for the interaction of consumers, customers and the
public with the business. Several other processes of marketing research include understanding
the process of marketing and improving it, monitoring marketing performance, evaluating
marketing actions, and defining marketing threats and opportunities (Shaw &Darroch 2004).
Product/service development is the important area of concern of marketing capabilities, which
deals with designing the products and services according to the needs and wants of the customers
while keeping in mind to outperform the competitors and achieve the internal goals and
objectives of the organization (Vorhies& Harker, 2000).
The third major area of concern is pricing of products/services. Pricing is defined as allocating
the appropriate prices to products/services of the company while analyzing the prices of same or
similar products/services in the market. Distribution channels and their management is the fourth
major area of concern which emphasizes establishing long-term working relationships with
distributors and effectively managing those relationships. The fifth capability, promotion, is
considered to be among the key capabilities and consists of a number of activities including
selling products and services of companies, communicating with the markets through personal
selling activities, sales promotion and advertising. Marketing management is the final marketing
capability which is a major area of concern. Effective marketing management is about managing
marketing programs and customer acquisition. It also involves coordination of activities which

88 | P a g e
are considered to be the basic requirement of implementing such programs (Vorhies& Harker,
2000).
2.6 Knowledge Management
Many researchers have discussed the dimensions of KM in different perspectives. They gave the
basic concept ofKM, described successful and unsuccessful initiatives and the causes of failure
of unsuccessful initiatives. All these things will be explained in this section and how successful
initiatives of KM can be delivered. The issues of the culture, rewards, leadership and change
management will also be discussed here.
The struggle for knowledge is as old as human thought (Spiegler, 2000). Many philosophers like
Plato, Kant and Descartes tried to define and understand the nature of knowledge and to expose
the forces that are responsible for the various phenomena happening in the life of humans. The
methodologies they used to find the nature and the origin of knowledge serve as basic concepts
in today’s research.
KM is a multifaceted term, whose purpose is to create a flourishing work and learning
environment (Kikawada & Holtshouse, 2001). According to Quintas et al. (1997), KMis the
process of managing knowledge continually to meet needs and to develop new opportunities. For
successful KM, the integration of key management issues and the achievement of clarity is very
important (Webb et al., 1998). KM is the development of methods, tools, techniques and
procedures through which organizations can acquire, measure or distribute, toprovide a return on
investments (Snowden, 1999).Bhatt (2000) states that KM is the interaction between types of

89 | P a g e
knowledge that creates continuous knowledge development. According to Egbu et al., (2001)KM
is the process of creating, generating, storing and implementing knowledge according to the
needs of the organization. All the processes ofKM are continuous and have different
requirements (Laudon& Laudon, 2000).
2.6.1 Evolution of Knowledge Management
The quest of obtaining knowledge and using it effectively is not new. Many management
theories described the creation, existence and the construction of knowledge.In the twentieth
century, industrial revolution has proved that knowledge is very necessary for the up-gradation
of the industry operations. It was very helpful in finding the business goals in the realistic way.
There from the mid-1980s, knowledge has been emerged has the more powerful factor for the
individuals and the companies for their competitive environment (Wiig et al., 1997).
Tiwana (2002) stated thatKM started from the various philosophies of the 1950s. KMwas
modified with the passage of time.Current philosophies of KMstarted in the 1980s and the early
1990s with the names of knowledge engineering, artificial intelligence and expert systems.
Business communities did not welcome these initiatives because of the poor and complex
behavior of these technologies that made them ineffective (Griffith, Zeybek & O’Brien 2001).
The knowledge economy has its origin in the knowledge revolution. In the today’s world it is
becoming more and more necessary for organizations to have knowledge about customers and
their needs. So for companies, having knowledge and CA is more important than gathering data
and information. The knowledge economy is beneficial in providing value for the customer; it
improves the progress of a company by improving the quality of its products, processes and
90 | P a g e
relationships. If companies focus on the feedback and the interest of customers with their
interactions, they will develop more interest in customer relationship management and this
relationship is based on customer knowledge (Berry, 1983; Gronroos, 1994; Kavali et al., 1999)
Hamel and Prahalad (1994) argued that companies can create business sustainability in their
business and can compete in the future by giving true value to customers and the broader
community. They further said that companies can achieve this by reinventing and recycling their
unique products and services, to anticipate and align themselves according to their
customers’desires and needs. They state that by adopting this procedure, companies will be able
to radically transform themselves.
Another important term is intellectual capital; people are the critical assets that can develop new
ways of unleashing ideas, intelligence and creativity energy (Boudreau & Ramstad, 2005).
Knowledge is not only helpful in business performance but it is also important in transforming
opportunities into reality by making useful innovations. In this way the knowledge revolution has
raised the value of knowledge workers. The last quarter of the twentieth century was a period of
phenomenal growth, for knowledge influences and communication technologies.Now is a period
ofKM; ways are being developed to build relationships between human and social resources, and
to harness them.
Stewart, Baskerville, Storey, Senn, Raven & Long (2000) stated that in the example of theair
travel industry,knowledge of money, finance and the other tangible resources is more important
91 | P a g e
than tangible objects:“The air travel industry has become two different industries: the flying
industry, which is marginally profitable at best and the information-about-flying industry, which
makes money hand over fist (Stewart et al.,2000).If one takes this example from the large
company perspective, then it can be seen that businesses have to change from supplying products
to giving information and details about products (Szymczak & Walker, 2003). So, companies are
involved in a race for the future, where culture is changing about knowledge from tangible
objects to providing tangible services. For instance,Microsoft has moved from operating
software supplier strategy to ecommerce applications coordinators (Szymczak & Walker, 2003).
It isnot enough todayto have technological skills, it is necessary to have knowledge about the
skills to drive technology to make new products.
2.6.2 Knowledge Management:ATrend
According to Spiegler (2000), “Reading recent KM articles, one cannot escape the impression of
a recycled concept.”Spiegler (2000)further states “K is the essence of KM without which this
new Endeavour is a mere recycling of management topics. Without articulating the K word, the
whole area may turn out to be yet another fad that will fade away with time.” Spiegler is actually
trying to compare KMwithbusiness process re-engineering, executive information systems,
management information systems and decision support systems. All these elements are very
important to improve the performance of a system but they change their behavior when data and
information are collected to compare them with KM. Kanter (1999) suggests that if implicit
knowledge is just limited to a person’s mind and not implemented in the company database, then
it suggests something of a new direction.
Organizations are facing the basic problems of restricting its successful applications in their
business process phenomena from the last decade because the personnel of organization are

92 | P a g e
reluctant to change and knowledge acquisition (Vanhoenacker et al., 1999). It shows that KM is
far from a fad but it is different in its objectives, having many dimensions and manages many
aspects of organizational activities (Hilmer & Donaldson, 1996; Wiig, 1997; Kidd, Richter & Li
Kidd, 2003)
2.6.3 Understanding Knowledge
2.6.3.1 What is Knowledge?
Knowledge can be described in only one word, understanding;understanding of the reality that is
constructed in the human’s mind with his or her experiences and consequences. Davenport and
Lesser & Prusak (2000) state the concept of knowledge is:“A fluid mix of framed experience,
values, contextual information, and expert inside that provides a framework for evaluating and
incorporating the new experiences and information. It originates in and is applied in the mind of
knower. In organizations, it often becomes embedded not only in documents or repositories but
also in the organizational routines, practices and norms.”
Penrose and Pitalis (2002) states that the knowledge of employees is dependent on their skills,
experiences, and the new knowledge, and how they deal with it. So knowledge can be taken as a
resource, and the ability to utilize knowledge affects the quality of services provided by
organizations.In this way KM plays a vital role for organizations (Shaw & Darroch, 2004).
Data are raw material, a set of discrete objects, events or observations having one or more
entries, when these data are processed this is called information. Information is used in decision
making; when it is further processed it becomes fact, an understanding of reality, and this thing is
called knowledge. The person with knowledge automatically has the ability to act or to make the
93 | P a g e
valuable producing decision and has the ability to drive people for the specific actions
(Davenport & Volpel, 2001; Polanyi, 1962; Kanter, 1999; Bourdreau & Couillard, 1999).
2.6.3.2 Types of Knowledge
Cognitive psychology and management literature categorizesknowledge into two parts: explicit
knowledge and tacit knowledge (Nonaka & Takeuchi, 1995). Best (1989) categorized knowledge
into declarative knowledge and procedural knowledge.
Declarative knowledge or explicit knowledge as a formal knowledge has many characteristics. It
is knowledge that is flexible to suit our purposes, it can be recorded, used in texts, is available in
books, taught in class, used in organizations as code of practice and product requirements, for
communication and sharing ideas and in machines as programmer codes (Robinson et al., 2005;
Best, 1989).
Tacit knowledge can be taken as procedural knowledge. We generally do not know the use of
procedural knowledge in organizations because the dictionary meaning of tacit is silence so it is
knowledge applied silently, not expressed at all (Maqsood, Walker & Finegan, 2007). This is
knowledgethat is highly personal and confidential. This knowledge is easier to show than to tell,
such as explaining how to ride a bicycle. Polanyi (1962) explains this thing in a different way:it
is like face reorganization as we can recognize the face of anybody whom we have seen in the
past, in the faces of thousands and millions of people.

94 | P a g e
Collins (2003) further describes three types of tacit knowledge:embodied knowledge,which
describes the functions of the physical environment; embrained knowledge, related to the
individual brains; enculturedknowledge, that is taken in the specific social context.
2.6.3.3 Dimensions of Knowledge
Davenport and Volpel (2001) described seven dimensions of knowledge: as tacit to explicit,
teachable to non-teachable, articulated to non-articulated, observable to non-observable,
schematic to non-schematic, simple to complex and at the end simple to complex. These
dimensions are very important to know regarding the effective transfer of knowledge.
If knowledge is explained explicitly then an organization will be able to transfer and deliver
knowledge. Someknowledge can be gained through experiences. This knowledge is called non-
teachable knowledge. An example of such knowledge is faith or religious knowledge. One other
example of this knowledge can be the balancing in bike riding, in which rules can be thought but
balance is attained through experiments and experiences that give strength to the rules and help
to develop knowledge of balancing. Someknowledge cannot be gained through books but the
physical senses work more appropriately for this type of knowledge; it is called articulated
knowledge, like the taste of anything can be judged only by taste buds.
Schematic rules can be easily transferred to rules and regulations. Schematic knowledge can be
put into tables, or other forms of the clear representation. Some knowledge has the dimension of
simplicity or complexity based on predictions, like weather prediction.If knowledge is in a
written or documented form then it is called documented knowledge, like the knowledge of the
Ancient Romans.
95 | P a g e
Another example given for knowledge is an iceberg: the layer above water serves as explicit
knowledge, and below the water serves as embodied tacit knowledge (Scharmer, 2001).
Scharmer (2001) described four types of action knowledge: performing knowledge in the form of
delivering results, strategizing in the form of improving the performance, mental modeling in the
form of reshaping the performance, and sculpting in the form of reconvening the identity of
performance.
2.6.4 Strategic Implication of Knowledge
Zack (1999)analyzed the development of knowledge strategy by giving the process strategy. By
this process strategy, the author has demonstrated that the core knowledge must be required in
organizations that willconsider the minimal knowledge to stay in the business. Advanced
knowledge is helpful for the organizations to compete with its competitors. Although it has the
same knowledge and scope for the competitors, it enables the firm to have specific differentiated
knowledge to stay in the niche market environment.
Innovative knowledge is very helpful in producing different things and in making organizations
different from their competitors. According to Zack (1999), if knowledgeis dynamic advance
knowledge, then it will be helpful tomorrow;Zack states that organizations should use advance
knowledge in order to stay ahead and competitive. Dixon (2000) stated that knowledge should be
ever changing and dynamic like the flow of water.
2.6.5 Knowledge Stickiness

96 | P a g e
The quality of knowledge that makes it difficult to move from one mode to another or from
person to person is called stickiness; it acts as a barrier in the transformation of knowledge. For
example, Burton-Jones (1999)stated that in the case of tacit knowledge it sticks to a person and it
becomes difficult to pass it on; it requires a fair bit of consideration and effort to transfer sticky
knowledge. It is difficult for organizations to transformtacit knowledge into explicit knowledge
because of its stickiness quality.Kulkki and Kosonen (2001) stated that the conversion of explicit
knowledge totacit knowledge is not an easy process. Szulanski& Capetta (2003) proposed that
the stickiness quality of knowledge is due to three major factors: absorptive capacity, causal
ambiguity and the quality of relationship between the source and the receiver of knowledge.
Companies like training and guiding procedures for their employees. This shows the importance
of the absorptive property of knowledge to transform knowledge from one mode to other, like
fromtacit to explicit. The receiver understandsknowledge that is shared through its context or
content. Causal ambiguity is related to making the causes or the links within knowledge because
if there were no causes then mistakes will be repeated. For organizations, it is very important to
replicate best practice otherwise knowledge sharing will become difficult. Another quality is the
relationship between the user and knowledge, which will include factors like culture and
communication method. Knowledge sharing is also dependent on organizational culture.
2.6.6 Knowledge Transfer for Overcoming Knowledge Stickiness
According to Dixon (2000, p. 169), there are four types of knowledge transfer: strategic, expert,
serial and near.Strategic and expert types have a great impact on organizations and serial and
near give knowledge transfer by giving rewards to get the high performance from the employees.
97 | P a g e
The above shows that knowledge is sticky and costly and it is difficult to pass on because it is
not just facts and information but also about history, context, hidden information, and
complicated things.
2.6.7 The Hidden Side of Tacit Knowledge
The main purpose is to seek a way to transfer tacit knowledge into explicit knowledge in the
employees’ head. The conversion of tacit knowledge into explicit knowledge is very helpful for
making innovations in the form of new technologies or new processes. Tacit knowledge is the
main factor behind the decision-making process and employees’ gut feelings.
2.6.8 Human Information Processes: Factors affecting Knowledge Construction
It is important to see that human information processing acts as sensing information and is used
as the main element for further knowledge construction.
2.6.8.1 Perception and Recognition
Perception occurs through the stimuli of the sensory organs that are used to make the human
information process that further lead to knowledge construction.The system recognizes
knowledge and compares it with previous knowledge in this way, reconstruct theknowledge.
Perception is made through the selection of knowledge and it is affected by various things like
values, motives, stress and the person’s background.
2.6.8.2 Cognitive Styles
Gigch van (1991) defines cognitive style as the individual property of performing perceptional
and logical activities. It depends upon many things like experiences. Managers and thinkers can
take the cognitive style as the preceptor or the receptors. Different people have different
98 | P a g e
cognitive styles based on their experiences and education. It could also be the high or the low
analytical process.
2.6.8.3 Heuristics and Biases in Judgment
A heuristic is a general guideline to solve problems (Best, 1989). Organizations use heuristics
during deal making but heuristics could lead employeesinto high rates of biases or errors. As a
decision task becomes more complex, the rate of bias increases. Heuristicsinclude search and
compare strategies (Baron, 1998).
2.6.8.4 Functional Fixedness and Mental Set
Baron (1998) has described the functional fixedness, as it is the term that is used to describe the
things, without using creativity. Mental set is the force of the past experiences on the present. It
is also the capacity of retaining past experience into successful options regardless of present
experiences. It is common for the business that repetition in problems can be occurred even in
the present of other solutions.
2.6.8.5 Mental Models
Best (1989) described the mental model as the internal representation of problems from past
experiences or experience that develops through the passage of time. Organizations not only
react to their environment but they learn from it. The active nature is that which has the ability to
emerge in the nature and change by the change in behavior or the environment.Mental models
tell how environmental stimuli will be interpreted. They also makeknowledge more efficient.
2.6.9 Variation in Learning Styles and Knowledge Acquisition
The learning styles of different people are different because they depend on the acquisition of
knowledge and its proper use in the decision-making process. Decision making depends on

99 | P a g e
timely, accurate and precise information that involves the cognitive styles of individuals (Pelham
&Wilson, 1995). Learning is related to the communication of stimuli and the mind of learner to
create the learner mental model. Alwright (1976) observed that individualswith different learning
behaviors in different ways during problem solving and decision making
2.7 AFirm’s Search for Decision-making Information
In this section, it is easy to discuss the process of SME’s that is used in knowledge acquisition
related to the external device that fit into the most frequent accountant and the advisor. The
demand of the accountant and the services of accounting refer to the system which is associated
with the business advice.It is said by the Benson that the external accountants and the lower
managed firms are used to only attest the performance of the financial information. It can also
use to provide the installing report and design as well as the control system. The management
system is used to provide information to an accountant. The management and the staff have to
deal with the accountant’s services system and SME used to measure the day to day
activities.Accountant services are essential for the production of consistent and reliable
information for the financial external and internal users.
2.7.2 The Nature of Business Advice
The external advisor and the external accountant provide services and offer advice about the
business. They can provide servicessuch as management consulting services, business advisory
services and management advisory services. The environment of SMEs requires business related
knowledge that can be utilized in developing new processes and procedures that prove
instrumental in bridging the gap between the expertise management and internal staff, the
external business expertise and the apparent accountant in the advertising promotions of the
current system, the alternative leading strategies of management skills that is achieved by the
companies that are integrated with accounting expertise (Kurunmaki, 2004).

100 | P a g e
2.7.3 Theory Explaining the Market for Business Advice
Management theory has developed for the specialized and broad services that deal with the
source of demand for services related to business. In this section the theoretical explanations
related to the market for advice to business and business advice in the SME environment
tarediscussed. In SME environment and accounting profession, the reference point helps in
explaining the external advice theory to the clients.
The decision-making procedures are based on the external accountant system which is used to
provide different services to enhance the performance of the SME (Lu & Beamish, 2001).The
range has been developed by the services of the accountant and that is used in the information
changing that is needed by both internal and external stakeholders.SME facilitates the
management and the staff in managing daily accountant services. The accountant services are
crucial in producing consistent and reliable information of financial external and internal users.
2.7.4 Business Advice and the Strategic Management Literature
Business market advice has been designed to assist strategic management and the SME
management literature. An important question in any firm is how to achieve competitive
sustainability advantage.The strategic management system and its major paradigms are
addressed well by competitive forces. The conflict strategy, based on game theory, helps develop
the strategy and model with special focus on the efficiency of specific resources (Teece et al.,
1996).
2.7.5 Transaction Cost Economics
The transaction cost economics(TCE) framework has been developed for understanding the
performance of the firm and it helps to identify the roles of the external advisor to the business.
TCE is used to explore all the activities of the organization which is effective for efficient
governance. The transaction costs are associated with the cost of economic change that deal with

101 | P a g e
the independent services and goods are exchanged (Williamson, 1979). The economic activities
are associated with the cost of transition which can be used in the economic activities and in
production costs.Information about the clients, when demonstrated,tends to change the nature of
the clients. The proactive control of financial professional improves the client audit satisfaction.
2.8 Knowledge Management Capabilities
Knowledge plays a vital role in every business structure; firms should have competent
knowledge of business to compete effectively. Creativity and innovation enable organizations to
take a favorable position in the marketplace to gain higher profitability and productivity. To
accomplish goals and objectives, organizations need absorptive capacity to develop their ability
to use prior knowledge so that they recognize the value of assimilation and new information as
well. However, many scholars and researchers have neglected the concept of creativity.
Organization-based knowledge, which had been studied in the business intelligence technologies
of the early twentieth century, ignored the concept of creativity; meanwhile, proponents of
creativity promoted the concept of creativity and creative thinking without testing their thoughts
or producing explanations and theories based on their perceptive thoughts.
Organizations often pursue work, but what they really need to push is innovation. Theodore
Levitt (1960) put it best: "What is often missing is the creativity of knowledge of the idea-
meaning, but innovation in the act of producing meaning, that is, to put the ideas to work."
The business intelligence technologies provided significant information about business
organizations and their success factors. The three major parts of KM are divided into technology,
structure, culture, and capabilities of companies.Nine technologies and capabilities along with
conclusion and index are included in KM.The first part of KM provides information about the

102 | P a g e
importance of execution. The part of KM related to the technology discusses the gap that is still
unknown whereas the part dealing with capabilities of companies argues about executive
differences.
2.8.1 Technology
In the business technology of the gap that nobody knows, KM discusses information about the
professionals who are unable to meet board expectations. Technology provides practical
knowledge to the companies that enable them to become prosperous. Managers who lag behind
in knowledge of technology are often incapable of meeting the organizational needs and
expectations. The KM discusses the capabilities regarding challenges and knowledge about
effective management for business environments that face many issues.
To increase the turnover of inventory, technology plays a vital role in build-to-order. Knowledge
of technology has provided the most common plan that business has developed for minus
receivable accounts, inventories provide business productivity velocity at a higher level and
market share, and revenues are improved through margins improvement.The technology based
observation provides examples of different companies that use knowledge effectively in running
successful business whose inventory turnover is twenty times better than companies with
negative working capacity. The promise between gaps has provided widespread knowledge
about effective KM approaches and their strategies regarding achievable organizational
objectives.
The information provided by technology about structure dimensions reveal reasons of failure of
organizational strategies the chief among those being poor execution of innovative KM. The

103 | P a g e
technology based knowledge highlights the approaches used by experts for making of executive
on the basis of real information. KMprovides significant information about innovative KM skills
and their capabilities that help to improve organizational success and removes failure from the
strategies. Innovative knowledge and business intelligence are the lifeblood oforganizations, and
they lead knowledge-based organization and teams toward higher success and prosperity.
2.8.2 Structure
The organizational R&Ddepartment has some specialists that provide plans for structure
planning and technological architecture system. Structural and general challenges can be
overcome through the techniques and approaches provided by structure-based knowledge. There
are four phases to the structure-based model.Firstly, the planning curriculum of the organization
considers establishment steps and the process of decision making. The assessment and collection
of community related steps provided the schools with strategy for assessing the data collection
regarding objectives and goals in shaping decision about the choice of content material
In the second phase, the organization developed the establishment of curriculum content that
included developing community strategy and objectives of the goals and development of
decision-making process that is provided by the content deliverable source. Moreover,
identification of materials is the third phase of in implementing curriculum. In this phase, the
instructions are developed and selected by the effective strategies to improve the performance of
the strategy delivery (Duguay & Korbut, 2002).
The fourth phase is about assessing and refining the curriculum, in this phase the organization
has developed the assessment of strategies and the process evaluation is provided in this
104 | P a g e
assessment.The solution provided by the strategies of the improvement programs resulted in
easing out the phase to increase success factor and improve identification of strategies.
2.8.3 Culture
There have been a lot of studies that evaluate and measure the impact of strategic planning on
organizational performance. However, there is no study that determines the factors of
organizational success and the impact and role of strategic planning on organizational success.
There are factors other than strategic planning that play a direct role in the success of any firm,
like the macro-environment of a firm that includes political, social, cultural, and technological
factors, and the micro-environment of the firm and the structure of the firm. In the past, little to
no attention was paid towards these variables and their impact on the dependent variable. In this
study the independent variable is strategic planning while the dependent variable is
organizational success. The linkage between the formal designing and planning of practices of
the organization and their impact on success is determined. The performance variable is treated
as a subset or dimension of the dependent variable in the study. The study will result in providing
a future direction to new researchers as well as thought-provoking industrial implications to
small, medium, and large businesses. The results of the study will not only help in effectively
managing the current businesses but it will also help in improving them in a future context.
The different balancing departments have provided both slides and structure to increase
technological architecture system to provide ensure satisfaction as the problems regarding
leveraging technological structure are increasing. Employees have another opportunity to
develop their effective and efficient skills and capabilities. In addition to that, the general

105 | P a g e
structure has some specific challenges that are highly effective and influencing factors on the
culture.
The organization should utilize different approaches that are well planned and oriented for the
technological architecture programs. An efficient development process should be used to
improve the capabilities and skills of employees. Oriented general planning has some job
specifications that generally focus on the mission, goal, structure organization, and function
department.
2.8.4 Process Capability
Process capability and architecture programs are a different type of technological knowledge that
can be used to motivate employees and improve their profitability and productivity. Their
productivity depends on job satisfaction that will enhance the performance of the leveraging
technological architecture and employees as well. Most companies use different approaches to
enhance the performance of the leveraging technological architecture.
To satisfy the above provided challenges, organizations have developed some effective and
efficient approaches that provide higher services for the strength of the leveraging technological
architecture and improve the working style of their employees. Strategic change provides
effective information about the developed organizational skills that can be improved through
providing higher and more effective terms and conditions of improvement.
2.8.5 Acquisition Process

106 | P a g e
The knowledge and business intelligence trend has provided information about those
organizational policies that maximize share and improve productivity.Therefore, it is the
responsibility of the organizational development manager that he imparts better policies,
procedures, tactics and tools to the managers.The intelligent business hip has also provided
enough information about effective strategies that may help managers take care of
responsibilities, duties and acts of organization.According to the organization, effective KM shall
be liable to repentant stake holders of the organization.The effective KM is responsible to
analyze attributes that may help bad managers deal with routine business procedures in a
satisfied manner.
Knowledge and business intelligence provides that the manger is responsible to account for the
presentation of the policies, accounts, to see the organizational strategic procedures and to carry
out the effective implantation action plans in this regard.
The organization development manager has the responsibility to carry out the efficient plans of
actionthat shall maintain their market share and improves the effective performance of the
organization. In addition, the survival of the organization is feasible through the betterments of
ratios that shall carry out the effective decisions and action plans for the organization. The
policies of the organization shall maintain the procedures and carry out the reflective action plans
in the respective departmental efforts in the organization.
2.8.6 Conversion Process
Furthermore, part two provides knowledge and information that may help in execution of
building blocks. The knowledge and business intelligence discusses innovative core that is
107 | P a g e
considered a significant factor to make business successful. Innovative knowledge and business
intelligence should know about business and people, as this would improve knowledge of the
effectiveKMabout people and their tastes and demands for whomacknowledge-based
organization is running its business. Innovative knowledge and business intelligence should
create understanding with the business of organization as well as the customers because
customers are the core success factor of organizations.
Knowledge and business intelligence considers insistence on realism as an essential behavior of
KM. Knowledge and business intelligence provides information about organizational weaknesses
and strengths. The identification of weaknesses is an essential process that explores the issues
and the reason of crises in an organization. Innovative knowledge and business intelligence
should be realistic and practice running their organizations systematically.
2.8.7 Protection Process
In the third essential behavior, knowledge and business intelligence discussed information about
the priorities and set clear goals, this point illustrates the major success factor that the innovative
knowledge and business intelligence should know about the organization. An effective KM
should set objectives and goals to get success because the innovative knowledge and business
intelligence has to manage their teams according to their mission and they set their mission to
achieve their goals in a specific time and under specific conditions. This point makes the
innovative knowledge and business intelligence more string against the achievement of their
success and goals objectives. Knowledge and business intelligence provides effective
information about the business prioritiesbecause effective KM must know priorities regarding
the business and knowledge-based organization as well.

108 | P a g e
Therefore, knowledge skills and informative ideas for innovative business intelligence should
improve their performance and gain higher success in their professional career. Moreover, the
employees are the most effective and significant part of any organization, because the
organization directly depends on their employees’ performance to gain success and prosperity.
The better the employees’ performance, the better the profitability and productivity.
2.8.8 Knowledge Management Elements
Knowledge and business intelligence element has provided information about the effectiveness
of priorities that an effective KM should know about its work, priorities generally give direction
to the effective KM to promote their skills and achieve their objectives as well. Innovative
knowledge and business intelligence are the most significant part of any organization because
they give direction and then lead an organization towards the accomplishment of its objectives
and goals. Moreover, the effective KM must set its priorities to improve the business structure
and organizational strength.
In addition to that, knowledge and business intelligence provide information about “follow
through”: innovative knowledge and business intelligence should follow through strategies and
they should focus on their projects to manage them in a productive form.
2.9 Transaction Cost Economics
TCE is a theory that helps entities to improve their strategy and make it more effective.
Transaction cost theory is primarily concerned with the understanding of the firm as to why it
exists, how firms define their boundaries, and how they operate. The theory also covers the

109 | P a g e
potential role for an external advisor in adding value to the business or firm performance. TCE
helps in identifying and monitoring an organization’s operating activities. TCE also highlights
the effective and efficient role of government to ensure that the organization is operating
according to its rules and regulations (Williamson, 1979).
In economics, a transaction cost is a cost incurred when economic exchange occurs. For
example, when a person takes out a loan, they must pay a commission to their broker. This cost
is categorized as a transaction cost. This cost is not fixed and varies according to market
conditions. According to transaction cost theory, an organization’s economic activities should be
based on the production cost as well as the associated transaction costs. But often, organizations
consider only the production cost in economic analysis. They must consider the minimization of
transaction costs. For an organization to be successful it must minimize its transaction costs.
Some organizations also take external services to manage their costs whether external (payroll,
financial statement compilation, compliance issues) or internal (design, control system, complex
internal issues such as management reporting). In both cases, the external advisor might help the
business to improve firm performance by minimizing the cost to an acceptable level.
2.10 Contribution of Professional Services
Organizations mostly buy professional services for the solution of complex matters; however,
they often get confused when they first use these services as they are unaware of their benefits.
Professional services include a range of activities that have a complex nature and are intangible
(Quintas et al.,1997). As the business advice is intangible and complex it makes it difficult to
accurately access the performance of the external advisor. So buyers of such services are often

110 | P a g e
confused and uncertain about the correct measurement of such services. External advisor
services are often complex and consist of a wide series of activities (Robson&Bennet, 2000).
External professional accountants follow some rules and regulations which are established by
professional bodies such as IFAC and IASB. They provide quality services to their clients. They
behave ethically when providing their services to their clients and enhance their reputation. The
accounting profession of accountants enhances its performance and reputation by considering
public perception. Professional bodies also include public members as advisors in their team to
make the profession more transparent and efficient. Fogarty et al. (2006) suggest when a
professional accountant undertakes traditional compliance and monitoring services, it is assumed
to translate into business advice and a high standard of professionalism is required. Accountants
work under strict rules and regulations, which builds confidence in SMEs. If accountants do
wrong, then they have to answer to their professional bodies. Professional bodies not only make
rules and policies, but are also responsible for the implementation and monitoring of these
policies. Some important ethics rules are compulsory for accountants, such as competence,
ethics, integrity, due care and professional behavior. This increases the transparency in their
work and provides confidence to the general public and their clients. All accountants must work
independently and without any influence of others. For a professional accountant it is
compulsory that he/she has expertise in his or her field. Accountants provide multiple services
and statutory and non-statutory work. Many organizations and entities depend on an accountant’s
services rather than advisory services.

111 | P a g e
There are a wide variety of services that professional accountants are offer. Due to the
complexity of the services many other advisory and consulting bodies have developed their own
professionalcertification. For example, Certified Management Consultants (Canada) “promote
the ethical standards and professional competency, and advocacy for the profession in public and
government settings through education and certification of consultants” (Carroll, 2009).
There is a one factor that enhances the credibility of external accountants: theirreputation. This
key factor can mitigate client uncertainty concerning the benefits of business advice.Podolny
(1994) said that many organizations are reluctant to hire new external professional accountants
due to uncertainty. Therefore they prefer to trade with firms that they have dealt with in the past,
suggesting a level of transparency and assurance in quality of services. Incumbency gives the
competitive edge to external accountants in the market. Many SMEs are more likely to use
advisory services from an external accountant than from any other bodies as external accountants
build their reputation through their work.
There is one more CA that the incumbent external accountant received: the economic efficiency
flowing from the joint production of services, when these services are provided to an existing
client. As above, TCEhighlighted the importance of external accountant services and how these
services may help their client to minimize transaction costs and thus enhance performance in its
framework. TCE can also be used in the description of economic efficiency when the external
accountant provides services in addition to compliance or monitoring services,such as accounting
taxation, management decision making services or assurance. Often when an organization
112 | P a g e
appoints an unknown provider, the transaction costs associated with search, information and
bargaining become higher (Hodgson, 1993).
2.11 SMEEnvironment and the Advisory Service Market
In this part of the literature review a review is undertaken that clearly indicates voluntary
demand for business advice in the SME environment.
The analysis shows that managers of small businesses appoint external accountants mostly for
statutory services, but rarely for other services (Holmes & Nicholls, 1989). In a questionnaire-
based surveyof 928 respondents,75% were micro-businesses (<5 employees) and 25%were small
businesses (6 to 20 employees). Mostly the businesses appointed external services for the
preparation of tax returns and the balance sheet and profit statements (69.3%);less than 5% of
respondents purchased “non-statutory” services. Other than budgeted information: profit and loss
services and cash flow statements services purchased were 26.6% and 16.3% respectively.
Various environmental factors affected the decision and the analysis showed that younger clients
and larger clients were more willing to purchase a combination of “statutory/budgetary and
additional information.” It needs to be notified here that no separate analysis was carried out on
the decision to purchase non-statutory services that included the impact of environmental factors.
Cameron (1995) investigated the different views and perspectives of the value earned from the
external accountant’s fee in small businesses employing <20 staff in New Zealand. While
traditional compliance services were considered cost beneficial (value for money), small
business owners were neutral in their perception. In that area business advisory services were
considered as less cost beneficial. Compliance services were considered more cost beneficial.
There are a number of studies that highlight business advice in the SME environment in the UK.
It was noted that there were a number of SMEs that appointed external accountants as a source of
business advice (Robson &Bennett, 2000; Kirby & King, 1997): Bennet and Robson (1999)
113 | P a g e
reported that 95% of 2474 SMEs used external services. There a number of advisors that were
banks, accountants, customers, solicitor, suppliers, consultants and professional associates and
had percentages of 62%, 83%, 47%, 56%, 36%, 32%, 31% respectively.The figure 83% indicates
that SMEs are more likely to use the external accountant as an advisor instead of the some types
of services from an external accountant. There is unfortunately one limitation of this research, it
does not highlight the difference between traditional services (taxation, audit and compilation)
and the purchase of business advice designed to assist management.
It is noteworthy that Robson & Bennett (2000) state thataccountants and lawyers are taken as
“high trust” providers. According to them, accountants and lawyers work in a proper and
efficient framework established by the government and regulatory bodies. In this way, the
institutions gain a high level of trust which differentiates them from other sources of advice.
In a survey in 1998, Marriott and Marriot (2000) interviewedtheowner managers of 15 different
companies in the UK. They found that small firms have little use of management accounting
information. The use of additional services by small businesses was limited, which indicated the
perception of the likely high cost of such services.
There are a number of factors that affects the performance of small firms. An analyst studied the
relationship betweena small firm and an external accountant as a business advisor (Gooderham et
al., 2004). The report indicated that most firms have great dependence on an external accountant
as a business advisor for their growth.
2.11.1 SME Performance andConsultancy
According to the findings of Robson& Bennett (2000), the SME environment is greatly affected
by external services and these services are associated with employment growth. The SMEs
growth was categorized into three categories: stable growth, medium growth, fast growth. In the
fast growth category, the proportion of SMEs that use an accountant was high (89.9%). The

114 | P a g e
smallest proportion was in the stable growth category of SMEs that use an accountant (77.3%).
So, in conclusion,SMEs’ growth is highly associated with external services. Robson& Bennett
(2000)suggested that there were three measures of SME performance: % change in firm
turnover, change in number of people employed by client, change in profitability per employee.
This study did not include the relationship between business advice and SMEs’ performance.
Berry et al. (2006) found a huge difference between the growth of SMEs that used “financial
management support” and non-users of financial management support. For the service
category,no difference was found (7.56%).The growth rate of SMEs that used statutory advice
(6.49%) was significantly higher than the average growth of the non-users (3.29%). Berry et
al.(2006) concluded: “there is a positive relationship between the external advisory services and
the rate of growth of SMEs.” The association between advice and SME performance becomes
weak when other business advisors are considered, such as solicitor, government, suppliers,
consultants, banks and so on.According toRobson& Bennet (2000), the performance of SMEs
was not associated with consultants, banks, government departments and accountants. They
found that only the advice of a solicitor has an impact on an SME’s growth or performance.
Wren and Storey (2002) explained the relationship between SME performance and business
support in the marketing area. They found that marketing advice failed to add value for small
firms. As compared to small firms, marketing support had an impact on medium-sized firms. In
conclusion, medium-sized firms generated higher benefits from external advice as compared to
small firms.
The McDonald model of KM cannot be fully applicableto the advertisement sector of SMEs in
Pakistan. That is why only part of this model is tested in theSouth Asian country of Pakistan on
the basis of model grounded theory. In Pakistan the advertisement sector has become an

115 | P a g e
important sector of the economy;KM can play a dominant role in the rapid growth of this sector.
The KM part of McDonald model has been adopted and in this model constructs scale has been
revised in order to make it understandable in the context of Pakistan. This model has been tested
in Canada where the knowledge paradigm has already emerged, but this model needed to be
tested in theSouth Asian economy where the knowledge paradigm has started and gradually
become part of human resource management policies and procedures. The derived model which
has been extracted is as follows.
2.12 Theoretical Framework
Figure 2: Theoretical Framework
Market Orientation Customer Orientation
Competitor Orientation
Interfunctional Coordination
Learning Orientation Learning Commitment
Shared Vision
Creativity
Open-mindedness
Entrepreneurial Orientation Innovative
Proactive
Competitive
Knowledge Management Knowledge Acquisition
Knowledge Dissemination
Responsiveness to Knowledge

116 | P a g e
Chapter 3
Research Methodology
In this chapter, the approach towards the research and discussion of the method that will be used
in the research are discussed. I adopted a quantitative approach to examine the influence of the
factors that lead to KM in organizations in the advertising sector of Lahore, Pakistan. For this
purpose, a questionnaire was designed using a Likert scale to register respondents’ attitudes and
experience.
3.1 Research Objectives
To examine the impact of market orientation on knowledge management in the
advertising sector of SMEs in Pakistan
To examine the impact oflearning orientation on knowledge management in the
advertising sector of SMEs in Pakistan
To examine the impact of entrepreneurial orientation on knowledge management in the
advertising sector of SMEs in Pakistan
3.2 Research Approach
One of the main purposes of this study is to examine the influence of factors that lead to KM
within organizations in the advertising sector of Pakistan. It is difficult to achieve this goal with a
qualitative approach within a short period of time. A self-completion survey is very convenient
for respondents (Bryman& Bell, 2011). Saunders et al. (2009) pointed out that first the
researcher should select between two main research approaches: deductive, the idea of which is
to create theory on the basis of the available literature, as well as existing findings and test it
through observation; and inductive, where first you make the observation, then devise theory as a
result of the data analysis.
117 | P a g e
The methodological approach usedto answer my research question and achieve the purpose of
this research is deductive research method.A motive for my choice is that the deductive process
is organized in a more consistent way, as each new step follows the previous in a logical
sequence and the conclusions are drawn through logical reasoning (Bryman & Bell, 2007).The
limited time is another reason to apply a deductive approach, because an inductive study would
be more exploratory and is connected with a long process of collecting and analyzing data in
order to develop a theory from it, while the deductive approach investigates specific theory or a
hypothesis (Bryman& Bell, 2007).
Another purpose of this research is to find relationship and significance of different factors
affectingKM in this sector. According to Bryman and Bell (2011), the study of attitudes through
a survey is an appropriate method. In the case of a survey,a respondent might be more
comfortable and confident with answering questions related to his or her manager in a survey
format than in aninterview format. More importantly, respondents were ensured that the data
collected would remain confidential and anonymous.
If I conduct interviews, it will be difficult to determine which factor/s is/are more influential
than the others while this can be accomplished by using a questionnaire with a Likert scale.
Furthermore, interviews would have to be conducted with managers and subordinates. As a
consequence, some employees would be reluctant to discuss these issues in person, even though
the entire process of an interview would be guaranteed to be confidential and anonymous. There
118 | P a g e
is a possibility that the interviewee would neutralize their attitude during the interview, hiding
their true feelings. Thus, I chosea quantitative approach for the methodology of this research.
3.3 Research Strategy
Saunders and Thornhill (2003) define research strategy as: “A general plan of how the
researcher will go about answering the research questions” (Saunders & Thornhill, 2003,p. 90).
For conclusive research, the following elements are required: large sample size, clearly stated
information, structured process and quantitative analysis (Bryman, 2015). For this research,
quantitative research method was used. A questionnaire consisting of short, clear and direct
questions was developed. The sample size is large, and statistical analyses on the data will be
run.
This study is to see the influence of the factors that lead to KM. In order to answer this
empirical question, the nature of the research design will beexplanatory. A model is created by
reviewing the existing literature and hypotheses are built on its basis (deductive approach),
therefore the quantitative approach will enable me to test my hypotheses through reliable,
accurate and statistically analyzed data. Furthermore, the data will be collected through a
survey. The data so collected will be analyzed with statistical methods, which characterizes an
explanatory research design (Bryman, 2010).
A survey design was selected for this purpose. The questionnaire was distributed in the
advertising sector. The questionnaire was self-administered and the survey was conducted in-
person. The questionnaire was in hard form (i.e. printed on paper); in other words, it can be said
that it was a paper and pencil survey. A self-administered questionnaire is good in the sense that

119 | P a g e
it reduces the inter-rater reliability error and it is cost effective. Also it is more efficient as I
administered the survey myself so I was able to respond to the queries of respondents.
Furthermore, all the data were collected at a specific point in time that indicates that the
research is of cross-sectional design (Bryman& Bell, 2011). The reason for choosing cross-
sectional research design is that the research can be completed in a short span of time. Also I
was able to collect information regarding many different variables at the same time with little or
no additional cost; no follow-up with the respondents was necessary.
3.4 Data Collection Method
According to Ghauri and Gronhaug(2005), Bryman and Bell(2007) and Saunders et al.(2011),
data collection can be divided in two types: primary and secondary. The objective of thisresearch
was achieved by using primary data collection.
It is essential to choose the most appropriate research method because the reliability and validity
of the empirical findings may differ depending on the methodology applied. Bryman and Bell
(2007) state that a standardized questionnaire is a reliable tool that can be utilized for
quantitative method projects. Therefore, for this research, I developed a questionnaire that was
filled in by the respondents in my presence.
3.5 Design of Questionnaire
A questionnaire was designed to collect information from a wide range of employees working
mainly in the advertising sector of Lahore, Pakistan.All of the questions were designed to be
simple and declarative statements in order to lower the degree of confusion (Bryman, 2015).The
questionnaire was developed in the English language and based on the relevant literature.This
quantitative approach of a survey will offer the possibility to collect a large pool of data from

120 | P a g e
respondents with diverse backgrounds and experience within organizations in the advertising
sector (Bryman, 2015). A questionnaire is a good approach because a large amount of data can
be collected in an efficient and standardized way (Sudman & Bradburn, 1982) and people are
more likely to respond if it does not engage a lot of time and effort. It is easy to design, monitor
and customize a survey (Easter by-Smith et al., 2012).Moreover, multiple choices in the
questionnaire are in interval form;hence, the respondents’ attitudes can be easily translated into
numeric values. Subsequently, appropriate statistical data analysis can be applied.
3.5.1 Devising Questionnaire
While devising questionnaire, the following steps were considered as suggested by Burns et
al.(2008).
3.5.1.1 Item Generation
All potential items (ideas, concepts) generated through the literature review were included in
the questionnaire with the goal of tapping into important domains (categories or themes)
suggested by the research question. Samples for new questions had already been done until no
new items were generated (redundancy). Items were grouped with similar themes into domains
or categories and finally a table of specifications was generated.
3.5.1.2 Item Reduction
At least 25 items were devised to answer the research question (Burns, Duffett, Kho, & al.,
2008). The questionnaire was checked by content experts, supervisor, and external experts. In
order to reduce the items, statistical analyses (factor analysis) were used followed by pilot
testing.
3.5.2 Questionnaire Formatting
121 | P a g e
3.5.2.1 Stem Format
Clear, succinct, unbiased, appropriate and nonjudgmental language was used to formulate the
questions. Special care and attention was paid so that no leading or guiding statements were
used and that no question was double barreled.
3.5.2.2 Response Format
The response format was interval. In order to acknowledge uncertainty or indecisiveness of
respondents, an indeterminate response option like “neutral” was added in the seven-point
Likert scale. The values assigned to the seven Likert items ranged from strongly agree to
strongly disagree. The number of positive and negative options will be balanced, and a mid-
point wasprovided. I also considered “other” response options or open-ended questions for
respondents to allow for unanticipated responses, identification of new issues or factors, or to
elaborate on responses to closed questions.
3.5.3 Questionnaire Composition
A cover letter was provided with the questionnaire which highlighted the rationale for the study
and how the respondents were selected. Thisdeveloped a sense of confidence in the respondents
because they know the purpose of the research.
The data was obtained through questionnaires. These questionnaires were distributed among
different employees of SME relating to advertising. It is possible that a manager might not be
aware of his or her KM practices. I hope that responses from a subordinate’s perspective will
identify the factors of KM. So, the questionnaire was devised to cater for and incorporate the
responses of such managers.
3.5.4 Likert Scale
122 | P a g e
A Likert scale was used, which is “commonly used to measure attitude providing a range of
responses to a given question or statement” (Jamieson, 2004, p. 1217). A Likert scale is used in
fixed-choice response format to measure attitudes or opinions (Maurer & Pierce, 1998). The
reason for using a Likert scale is to analyze the degree to which each independent variable
influences or has a significant relationship with the dependent variable. Hence, the Likert scale is
the proper method for measuring such perspectives and opinions. Moreover, a Likert scale
translates intangible attitudes into visible figures, which are helpful for a researcher to draw
conclusions. In this case,the respondentswere also asked open questions so they could express
their experience, attitudes or emotions freely. The reason for using a seven-point Likert scale is
to help respondentseasily distinguish categories.
3.5.5 Testing theQuestionnaire
A pre-test and pilot studywas conducted before sending out the questionnaire to the
respondents, to examine the quality and to find out any potential shortcomings. It was also used
to check if the developed questions brought the required information. The instrument was
checked by my supervisor. In addition to sending it to my supervisor, it was shared with
linguistic experts and experts at the Statistics department ofSuperior University, Lahore for
consultation. Changes were incorporated accordingly. The validity of the questionnaire was
established with the help of the opinions of experts (at least face and content validity).
3.5.5.1 Pre-testing
The quality of questionnaire data depends on how well respondents understand the items. Their
comprehension may be affected by language skills, education and culture(Passmore, Dobbie,
Parchman, & Tysinger, 2002). Pre-testing initiates the process of reviewing and revising

123 | P a g e
questions. Its purpose is to evaluate whether respondents interpret questions in a consistent
manner, as intended by the investigator (Collins, 2003), and to judge the appropriateness of each
included question. I asked colleagues who are similar to prospective respondents to evaluate each
question through interviews or give me written feedback. I also asked them to determine a course
of action:accept the original question and meaning, change the question but keep the meaning,
eliminate the question or write a new question.
3.5.5.2 Pilot Study
During the pilot study I presented questions as they appeared in the penultimate draft of the
questionnaire to test respondents who were similar to the sampling frame.The respondents were
asked to examine the questionnaire with regard to its flow, salience, acceptability and
administrative ease (Collins, 2003), and to identify unusual, redundant, irrelevant or poorly
worded questions. They were asked to record the time required to complete the questionnaire.
The questionnaire was sent to at least 25 respondents.
Pre-testing and pilot study minimizes the chance that respondents misinterpret questions, fail to
recall what is requested or misrepresent their true responses. The information obtained through
pre-testing and pilot testing is used to improve the questionnaire.
Following pilot testing, I wasable to reduce items further through factor analysis by examining
mathematical relations among items and seeing how items clustered into specific domains
(Juniper, Guyatt, & Streiner, 1997). Factor analysis can highlight items that require revision or
removal from a domain (Norman & Streiner, 2000).

124 | P a g e
3.6 Sample
A sample is a proportion or subset of a larger group called a population. A good sample is a
miniature version of the population of which it is a part (Fink, 2003).
3.6.1 Sample Unit
The sample unit was the individual employee in the advertising companies.
3.6.2 Sample Technique
Survey samples are broadly divided into two types: probability samples and non-probability
samples. Probability sampling will be used for this research, which is a standard procedure in
academic survey research (Bryman& Bell, 2011). Probability sample means each member of the
target population has a known and non-zero probability of inclusion in the sample (Kish, 1965).
Simple random sampling was used because it is simple to accomplish and is a fair way to select a
sample, it is reasonable to generalize the results from the sample back to the population. Also
each individual employee has an equal chance of being selected.
3.6.3 Reaching out to Respondents
I contacted concerned employees (my personal contacts) in the firm through phone and email,
describing the purpose of this research and asking for their assistance. After their approval, I
visited the firm and then gave them the questionnaire to be distributed among their peers,
subordinates and managers. A high volume of questionnaires was distributed to take into account
a low return rate or incomplete questionnaires. In this case, since most respondents received a
survey request from their colleagues, the response rate was expected to be high. The respondents
were assured of confidentiality and I assured the participants that all their answers would be kept
confidential and only be used for the purpose of the survey.

125 | P a g e
There might be some undesirable but unavoidable bias in this probability sample, including non-
response bias, coverage bias and selection bias. First of all, I used a paper and pencil survey, I
cannot acquire the exact non-response rate. Some respondents might give up completing the
questionnaire mid-survey;the number of these respondents was not recorded. Second, I intended
to include diverse employees and firms in the sample. Some companies I contacted could reject
or simply not reply to my survey request, which would lead to coverage bias. Third, because the
survey was mostly distributed by my contacts in the firms, employees who are close to these
contact people are more likely to complete the survey properly. A result of this selection bias
would be that some employees with different opinions might be excluded from the sample.
3.6.4 Sample Size
Sample size has an effect on how the sample findings accurately represent the population (Burns
& Bush, 2013). The larger the sample is, the more likely that the generalizations are an accurate
reflection of the population (Saunders, Lewis,& Thornhill, 2003). Tabachnick and Fidell (2001)
established that a sample size of 300 is adequate for factor analysis, and for regression analysis a
sample size of N ≥50 + 8×M is adequate where M is the number of independent variables. But
on the other hand, administrative scientist James March and his colleagues observed that a
sample size of one (1) is sufficient if it is the right one (Bryman& Bell, 2003; p. 199). Bryman
and Bell (2003) suggested a statistician can help in determining the proper size for the sample.
For the time being, a sample size of 300 meets all the above arguments of having a proper
sample size for factor analysis and regression analysis. Respondents will include both
supervisors/managers and their subordinates.

126 | P a g e
The selected employees worked in an Operations department, Maintenance department, Design
and R&D department, IT/CS, and Management. The reason for choosing these departments was
that I have acquaintances in these departments and hence it is easier to get the questionnaire
filled in by the respondents. Also, the employees have to face to more supervision in these
departments as compared to other departments.
3.7 Data Analysis
It is very important that the data are presented in a well-structured and easy to understand way
(Crawley, 2002).
I carried out quantitative research so quantitative techniques and statistical tools for the
collected data analysis wereapplied. The data so collected was analyzed using statistical
software programs, such as IBM SPSS.Two statistical tools for the study were applied:
correlation and regression analysis.Arithmetic mean, mode and percent distributions in the
general overview of the data were used.
A correlation shows a mutual relationship between two variables. This means that when one
variable goes up, the other will respond by increasing (known as a positive correlation) or
decreasing (known as a negative correlation). But in the social sciences, there is rarely a perfect
correlation. A perfect correlation means simultaneous and equivalent changes are seen when a
variable is altered (Cronk, 2004).A correlation will show if any relationship exists between a
dependent variable and independent variables.

127 | P a g e
A correlation was not enough for my study because I wanted to know which independent
variables have a significant relationship with the dependent variable. For this purpose, a
regression test will also be used.
A regression analysis helps us to analyze a relationship between one independent and one
dependent variable. The key benefits of using regression analysis are that: i) it indicates if
independent variables have a significant relationship with a dependent variable, and ii) it
indicates the relative strength of different independent variables’ effects on a dependent
variable. According to Chatterjee and Hadi (2006), regression is one of the most effective tools
to analyze data obtained through quantitative methods. In this research, it is used because there
are four independent variables whose relationship with the dependent variable has to be seen.
3.7.1 Reliability and Validity
According to Bryman and Bell (2011),a study is perceived as reliable if the results are
repeatable. It means that if the same study is performed at a different point in time then it will
yield the same results (Easterby-Smith et al., 2012). Especially in the case of quantitative
research, the factor of reliability must be taken into account(Bryman& Bell, 2011). In this
survey, I tried to provide respondents with a confidential and reliable mode to express andshare
their true attitudes with confidence.
Validity is generally categorized into two parts: internal validity and external validity. According
to Joshi et al., (2010), internal validity focuses on the cause and effect relationship between
dependent and independent variables, whereas external validity refers to the extent to which the
findings of the research can be applied to the population from which the sample was drawn or

128 | P a g e
other population and research settings. The factors leading to KMwere established in the
literature review. This study is set in the context of Pakistani organizations in the advertising
sector. The results of the study showed internal validity.

129 | P a g e
Chapter 4
Analysis and Results
In this chapter, data is analyzed and upon analysis the results are derived as well as discussed. In
the Section 4.1, the descriptive profile of the data is discussed including mean, standard
deviation, reliability and validity of the constructs. The demographics of the respondents are also
discussed in Section 4.1 and the respondents’ internal consistency reliability is also measured in
this section. In Section 4.2 the results are analyzed. In this section, regression and correlation
analyses areperformed in which I examined the impact of the independent variable on dependent
variables.
4.1 Descriptive Statistics
4.1.1. Demographic Profile of Respondents
A total of 500 self-administered questionnaires were distributed in different advertising agencies
of different cities in Pakistan and 404 valid questionnaires were received at a response rate of
80.8%. Questionnaires were only considered valid if they were complete. Incomplete and invalid
questionnaires were discarded and not included in the analysis.The descriptive characteristics of
the respondents are given in Table 4.1. This table contains the gender, age and marital status of
the respondents.
Table4.1: Descriptive Statistics
Respondent demographics Frequency %
Gender (N = 404)
Male
Female
314
90
77
23
Age (N = 404)
21–30
58

130 | P a g e
>31–40
>41–50
233
155
16
38
4
Marital status (N = 404)
Married
Single
256
148
64
36
Table 4.1 shows that of the 404 respondents, 314 (77%) were male and 90 (23%) were female.
The majority of the respondents were in the age bracket of 21 to 30 (58%). The reason why most
of the respondents were 21- to 30-years old could bethat theycame from the advertising agencies
of Pakistan.In such agencies the majority of employees are young and energetic because
creativity and innovation are prerequisites of thejob. Only 4% of the respondents were in the age
range 41 to 50 years which could indicate that advertising agencies need more young
professional staff thanexperienced personnel. They channelize their energy towards the goals and
objectives of the organization that help them to achieve their task with efficiency and effectively.
The team work or coalition of fresh, young and professional staff is very necessary for the
organization to become innovative force for the market. Lastly, this descriptive statistics table
shows that the majority of the respondents were married 256 (64%) as compared to single,
148(36%).
4.1.2 Descriptive Summary
Table 4.2 shows the descriptive summary of items in which the mean, range and standard
deviation of items are given. In this study the survey was based upon 61 items using a seven-
point Likert scale ranging from 1 to 7. The mean score ranges from 4.08 to 5.55and the standard
deviation ranges from 1.84 to 2.35.

131 | P a g e
Table 4.2: Descriptive Statistics of Survey Items
Descriptive Statistics of Survey Items N Min. Max. Mean Std. D.
Organization values employees’attitudes 404 1.00 7.00 4.0891 2.1809
Organization values employees’ opinions 404 1.00 7.00 4.5668 2.0509
Organization has well-developed financial reporting systems 404 1.00 7.00 4.5421 2.2741
Organization is sensitive to information about changes in marketplace 404 1.00 7.00 4.9777 2.0867
Organization has developed science & technology human capital profile 404 1.00 7.00 4.3713 2.0732
Organization works in partnership with international customers 404 1.00 7.00 4.3861 2.3458
Organization gets information from market surveys 404 1.00 7.00 4.8218 2.2920
Market information is freely disseminated throughout the organization 404 1.00 7.00 4.6535 2.1584
Knowledge is disseminated on-the-job in the organization 404 1.00 7.00 4.6634 2.1622
Organization uses specific techniques to disseminate knowledge 404 1.00 7.00 4.4084 2.2208
Organization uses technology to disseminate knowledge 404 1.00 7.00 4.5025 2.1912
Organization prefers written communication 404 1.00 7.00 4.9777 2.2024
Organization responds to customers 404 1.00 7.00 5.0248 2.2847
Organization responds to technology 404 1.00 7.00 5.2500 2.1132
Organization has well-developed marketing function 404 1.00 7.00 5.0520 2.1781
Organization responds to competitors 404 1.00 7.00 5.0767 2.0336
Organization is flexible and opportunistic 404 1.00 7.00 5.0723 2.0802
Organization shows commitment to customers 404 1.00 7.00 4.7574 2.1622
Organization creates services that offer value for customers 404 1.00 7.00 5.3639 1.8978
Organization understand customer needs 404 1.00 7.00 5.5594 1.8821
Customer satisfaction is a major objective in my organization 404 1.00 7.00 5.5470 1.8478
Organization measures customer satisfaction 404 1.00 7.00 5.0990 2.0695
Organization provides follow-up services 404 1.00 7.00 5.3292 1.9908
People in charge of various services discuss competitor information 404 1.00 7.00 4.4554 2.2632
People in charge of various service units respond rapidly to competitors'
actions in my organization
404 1.00 7.00 4.5099 2.1419
Top managers discuss competitors' strategies in my organization 404 1.00 7.00 4.8416 2.1837
Top managers target opportunities for competitive advantage 404 1.00 7.00 4.7896 2.2527
Various service units work close together to meet customer needs 404 1.00 7.00 4.9678 2.2079
Various service units share business information with each other 404 1.00 7.00 4.6980 2.1605
Business strategies are integrated between different service units 404 1.00 7.00 4.6411 2.2526
All service units work together in offering value to the customer 404 1.00 7.00 4.7500 2.2108

132 | P a g e
Different service units share resources with each other 404 1.00 7.00 4.7723 2.3391
Managers basically agree that our organization’s ability to learn is the
key to our competitive advantage
404 1.00 7.00 4.5792 2.2830
The basic values of organization include learning as key to improvement 404 1.00 7.00 5.1114 2.0598
Employee learning is an investment, not an expense 404 1.00 7.00 4.4356 2.3424
Learning in my organization is seen as a key commodity necessary to
guarantee organizational survival
404 1.00 7.00 5.0025 2.1045
There is a commonality of purpose in my organization 404 1.00 7.00 4.7649 2.2634
There is total agreement on our organizational vision across all levels,
functions, and divisions
404 1.00 7.00 4.6906 2.1462
All employees are committed to the goals of this organization 404 1.00 7.00 4.8861 2.2270
Employees view themselves as partners in charting the direction of the
organization
404 1.00 7.00 4.7047 2.2068
We are not afraid to reflect critically on the shared assumptions we have
made about our customers
404 1.00 7.00 4.8614 2.1554
Personnel in this organization realize that the very way they perceive the
marketplace must be continually questioned
404 1.00 7.00 4.9604 2.0989
We rarely collectively question our own business about the way we
interpret customer information
404 1.00 7.00 4.6287 2.2379
We continually judge the quality of our decisions and activities taken
over time
404 1.00 7.00 4.7030 2.2445
Organization suggests new ways to achieve goals or objectives 404 1.00 7.00 4.8045 2.3521
Organization comes up with new and practical ideas to improve
performance
404 1.00 7.00 4.9455 2.1763
Organization searches out new technologies, processes, techniques,
and/or product ideas
404 1.00 7.00 5.0000 2.1051
Organization suggests new ways to increase quality 404 1.00 7.00 4.7129 2.3112
Organization promotes and champions ideas to others 404 1.00 7.00 5.1238 2.1074
Organization exhibits creativity on the job when opportunity is provided 404 1.00 7.00 4.8209 2.1462
Organization develops adequate plans and schedules for the
implementation of new ideas
404 1.00 7.00 4.7946 2.1996
In general, the top managers of our organization put a strong emphasis on
Research & Development, technological leadership, and innovations
404 1.00 7.00 4.7129 2.2601
In the past five years, our organization has marketed a large variety of
new lines of products or services
404 1.00 7.00 4.3936 2.2666
In the past five years, changes in our products or service lines have been
mostly of a minor nature
404 1.00 7.00 4.0817 2.3056
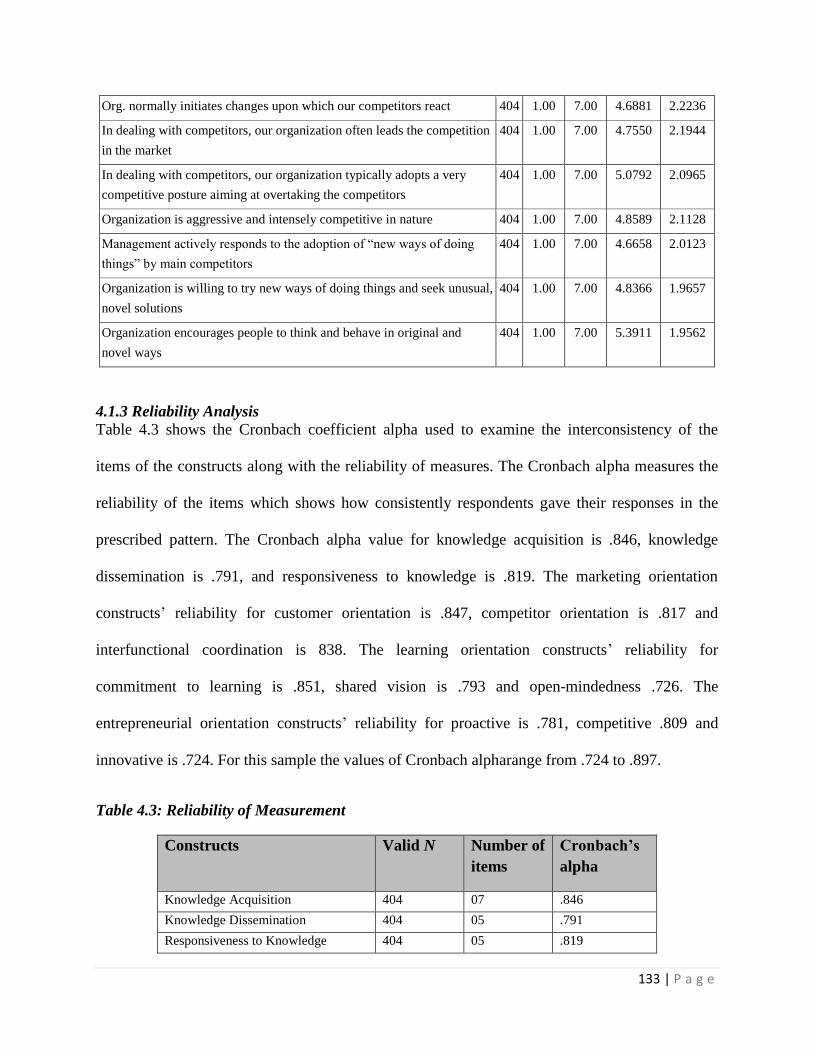
133 | P a g e
Org. normally initiates changes upon which our competitors react 404 1.00 7.00 4.6881 2.2236
In dealing with competitors, our organization often leads the competition
in the market
404 1.00 7.00 4.7550 2.1944
In dealing with competitors, our organization typically adopts a very
competitive posture aiming at overtaking the competitors
404 1.00 7.00 5.0792 2.0965
Organization is aggressive and intensely competitive in nature 404 1.00 7.00 4.8589 2.1128
Management actively responds to the adoption of “new ways of doing
things” by main competitors
404 1.00 7.00 4.6658 2.0123
Organization is willing to try new ways of doing things and seek unusual,
novel solutions
404 1.00 7.00 4.8366 1.9657
Organization encourages people to think and behave in original and
novel ways
404 1.00 7.00 5.3911 1.9562
4.1.3 Reliability Analysis
Table 4.3 shows the Cronbach coefficient alpha used to examine the interconsistency of the
items of the constructs along with the reliability of measures. The Cronbach alpha measures the
reliability of the items which shows how consistently respondents gave their responses in the
prescribed pattern. The Cronbach alpha value for knowledge acquisition is .846, knowledge
dissemination is .791, and responsiveness to knowledge is .819. The marketing orientation
constructs’ reliability for customer orientation is .847, competitor orientation is .817 and
interfunctional coordination is 838. The learning orientation constructs’ reliability for
commitment to learning is .851, shared vision is .793 and open-mindedness .726. The
entrepreneurial orientation constructs’ reliability for proactive is .781, competitive .809 and
innovative is .724. For this sample the values of Cronbach alpharange from .724 to .897.
Table 4.3: Reliability of Measurement
Constructs Valid N Number of
items
Cronbach’s
alpha
Knowledge Acquisition 404 07 .846
Knowledge Dissemination 404 05 .791
Responsiveness to Knowledge 404 05 .819

134 | P a g e
Customer Orientation 404 06 .847
Competitor Orientation 404 04 .817
Interfunctional Coordination 404 05 .838
Commitment to Learning 404 04 .851
Shared Vision 404 04 .793
Open-mindedness 404 04 .726
Creativity 404 07 .897
Proactive 404 04 .781
Competitive 404 03 .809
Innovative 404 03 .724
4.1.4 Correlation
Correlation tells us the association between two or more variables. Table 4.4 shows that the
value of marketing orientation is r = .757 which means that a positive moderate relationship
exists between marketing orientation and KM and the relation is highly significant because the p
value =.000 which is <0.05. Table 4.4 also shows that the value of entrepreneurial orientationr =
.327 which means that a positive weak relationship exists between entrepreneurial orientation
and KM and the relation is significant because the p value = .000 which is <0.05. Table 4.4 also
shows that the value of learning orientationr = .732 which means that a positive moderate
relationship exists between learning orientation and KM and it is significant because the p value
= .000.
Table 4.4:Correlation Among Different Constructs
Variable Names Test and Significance Values
Marketing Orientation
Pearson Correlation .757**
Sig. (2-tailed) .000
N 404
Entrepreneurial Orientation
Pearson Correlation .327**
Sig. (2-tailed) .000
N 404
Learning Orientation
Pearson Correlation .732**
Sig. (2-tailed) .000
N 404
135 | P a g e
4.1.5 Factor Analysis
It is imperativeto measure the reliability and validity of an instrument.The constructs’ validity
(i.e. convergent and discriminant validity) is confirmed through principal component analysis
technique with varimax rotation method. I also applied the Kaiser-Meyer-Olkin (KMO) measure
of sampling adequacy test and Bartlett’s test of sphericity because it is a prerequisite of principal
component analysis and it tells us that whether we can apply factor analysis or not. The strength
of connection between the variables is shown by the sample adequacy, and the orthogonality of
the components of a construct is shown by sphericity.These two tests provide confirmation about
the adequacy of factor analysis. Factor analysis also helps us to reduce the data from a large
number of items to a small number on the basis of uncorrelated factors. These uncorrelated
factors include information of the main constructs; that is why it is necessary to reduce the data.
Factor level analysis also helps to reduce the model from a complex one to a simpler one.
4.1.5.1 KMO Measure of Sampling Adequacy Test and Bartlett`s Test of Sphericity
The KMO measure of sampling adequacy tells us the appropriateness of the sample (i.e. whether
factor analysis on this data can be applied or not). The value of KMO ranges from 0 to 1. The
value of KMO also tells us the pattern of co-relational factors. The value 0 means that there is
large dispersion between the pattern of correlation, which shows that factor analysis is not
applicable for the reduction of the dimensions. Value 1 means that the correlation pattern is
compact. If the KMO is more towards 1 then factor analysis is appropriate. Goldberg et al.
(2004) stateda rule of thumb for KMO: a KMO value of 0.5 is relatively poor, whereas 0.6 is
relatively acceptable, and a value close to 1 is desirable. Hutcheson and Sofroniou (1999) also
prescribed a range of KMO values:a value between 0.5 and 0.7 is average,a value between 0.7

136 | P a g e
and 0.8 is good, and a value greater than 0.8 is great. The results of Table 4.5 show that KMO
value of KM is 0.894, marketing orientation is 0.891, learning orientation is 0.908 and
entrepreneurial orientation is 0.827.
Bartlett`s test of sphericity is used to examine the significance of the constructs. It is also a
prerequisite of factor analysis; if this test shows no relationship, then there is no need to apply
factor analysis, but if it showsa relationship between the items of the construct, then we can
apply factor analysis for the reduction of the dimensions. The rule of thumb of this test normally
is that the pvalue should be less than 0.05;we can clearly see in Table 4.5 that all the valuesare
less than 0.05 so it means we can apply factor analysis.
Table 4.5: KMO and Bartlett`s Test
4.1.5.2 Eigenvalues
Eigenvalues help us to identify the principal component.Normally,anEigenvalues which is
greater than 1 is considered a principal component and is used in the analysis. Table 4.6 shows
all the Eigenvalues of the constructs and it also shows the total variance explained by the
constructs. Only the principal component in the factor analysis and four constructs are extracted
by using principal component analysis method. KM consists of 17 items explaining 37.74% of
variance, marketing orientation consists of 15 items explaining 46.22% of variance, learning
Constructs No. of
Items
KMO
Measure of
Sample
Adequacy
Bartlett's Test
of Sphericity
Chi-square
Bartlett's Test
of Sphericity
Sig.
Knowledge Management 17 .894 2907.50 .000
Marketing Orientation 15 .891 3088.65 .000
Learning Orientation 19 .908 4543.97 .000
Entrepreneurial Orientation 10 .827 1830.95 .000

137 | P a g e
orientation consists of 19 items explaining 46.66% of variance, and entrepreneurial orientation
consists of 10 items explaining 45.67% of variance.
Table 4.6: Eigen Values and Total Variance Explained
Construct Components
Initial Eigenvalues
Total % of variance
explained
Cumulative %
of variance
explained
Knowledge Management Comp 1 6.416 37.743 37.743
Marketing Orientation Comp 1 6.933 46.223 46.223
Learning Orientation Comp 1 8.865 46.659 46.659
Entrepreneurial Orientation Comp 1 4.569 45.671 45.671
4.1.6 Factor Loading
Gefen & Straub (2005) stated that the minimum loading of all the items in a questionnaire in
principal component analysis should be greater than 0.40. All construct loadings with their
respective components are given in Table 4.7 of the component matrix in which each item’s
loading is also given with its respective constructs. Knowledge acquisition loading ranged from
.663 to .753, knowledge dissemination tools for responsive knowledge loading ranged from .471
to .821, and knowledge dissemination loading ranged from .536 to.584. The marketing
orientation constructs were split into customer orientation, competitor orientation and
interfunctional coordination. The customer orientation loading ranged from .771 to .516,
competitor orientation loadings ranged from .690 to .809, and interfunctional coordination
loadings ranged from .875 to .713. The learning orientation was split into three constructs:
commitment to learning, collective intelligence and creativity. The commitment to learning
loadings ranged from .782 to .637, collective intelligence loadings ranged from .769 to .498 and
creativity loadings ranged from .771 to .597. The entrepreneurial orientation was also split into
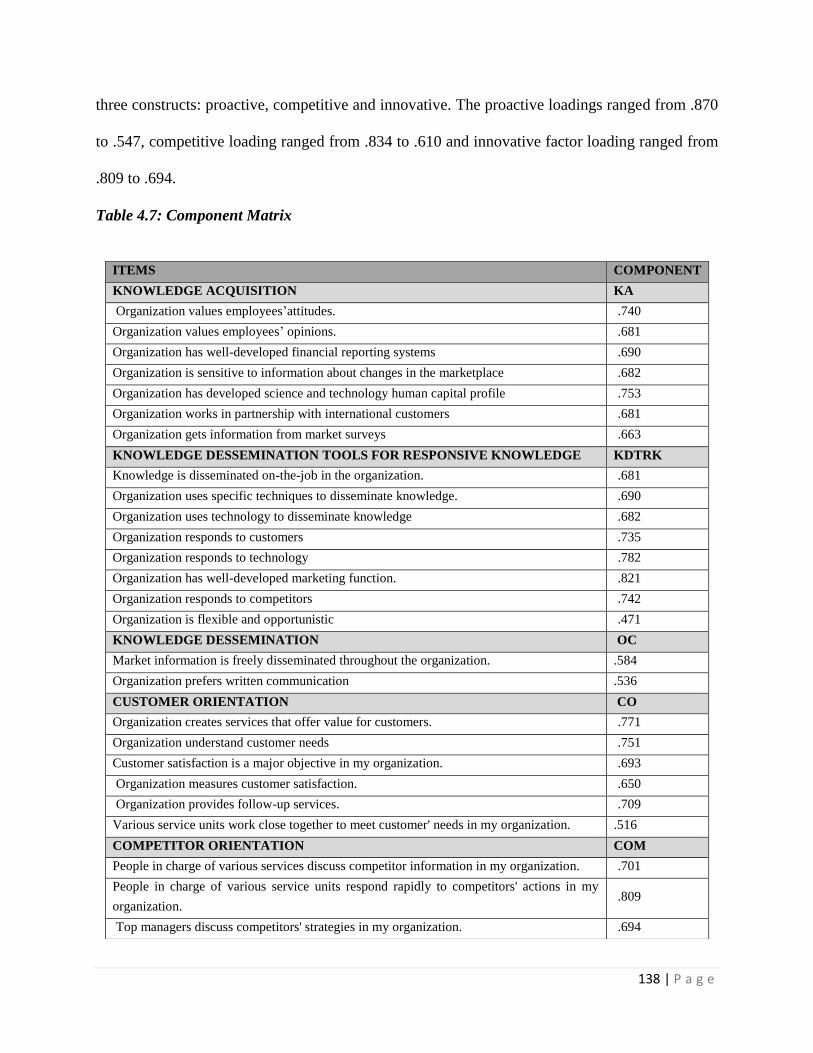
138 | P a g e
three constructs: proactive, competitive and innovative. The proactive loadings ranged from .870
to .547, competitive loading ranged from .834 to .610 and innovative factor loading ranged from
.809 to .694.
Table 4.7: Component Matrix
ITEMS COMPONENT
KNOWLEDGE ACQUISITION KA
Organization values employees’attitudes. .740
Organization values employees’ opinions. .681
Organization has well-developed financial reporting systems .690
Organization is sensitive to information about changes in the marketplace .682
Organization has developed science and technology human capital profile .753
Organization works in partnership with international customers .681
Organization gets information from market surveys .663
KNOWLEDGE DESSEMINATION TOOLS FOR RESPONSIVE KNOWLEDGE KDTRK
Knowledge is disseminated on-the-job in the organization. .681
Organization uses specific techniques to disseminate knowledge. .690
Organization uses technology to disseminate knowledge .682
Organization responds to customers .735
Organization responds to technology .782
Organization has well-developed marketing function. .821
Organization responds to competitors .742
Organization is flexible and opportunistic .471
KNOWLEDGE DESSEMINATION OC
Market information is freely disseminated throughout the organization. .584
Organization prefers written communication .536
CUSTOMER ORIENTATION CO
Organization creates services that offer value for customers. .771
Organization understand customer needs .751
Customer satisfaction is a major objective in my organization. .693
Organization measures customer satisfaction. .650
Organization provides follow-up services. .709
Various service units work close together to meet customer' needs in my organization. .516
COMPETITOR ORIENTATION COM
People in charge of various services discuss competitor information in my organization. .701
People in charge of various service units respond rapidly to competitors' actions in my
organization. .809
Top managers discuss competitors' strategies in my organization. .694
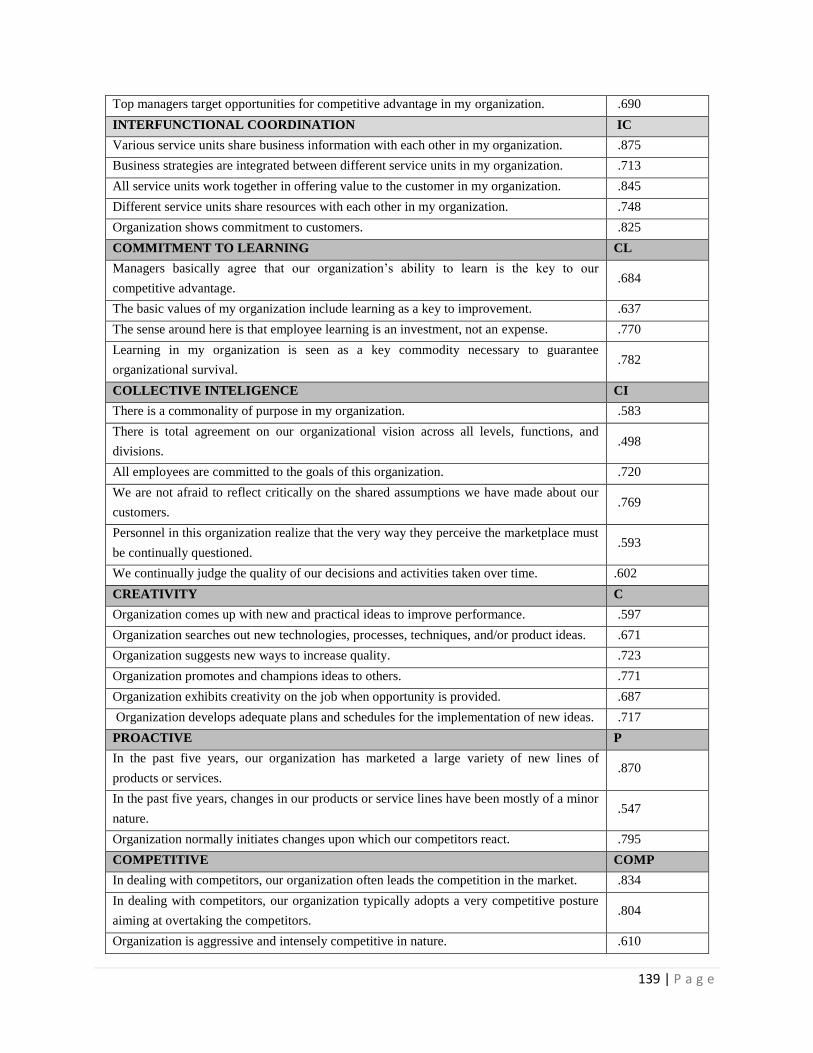
139 | P a g e
Top managers target opportunities for competitive advantage in my organization. .690
INTERFUNCTIONAL COORDINATION IC
Various service units share business information with each other in my organization. .875
Business strategies are integrated between different service units in my organization. .713
All service units work together in offering value to the customer in my organization. .845
Different service units share resources with each other in my organization. .748
Organization shows commitment to customers. .825
COMMITMENT TO LEARNING CL
Managers basically agree that our organization’s ability to learn is the key to our
competitive advantage. .684
The basic values of my organization include learning as a key to improvement. .637
The sense around here is that employee learning is an investment, not an expense. .770
Learning in my organization is seen as a key commodity necessary to guarantee
organizational survival. .782
COLLECTIVE INTELIGENCE CI
There is a commonality of purpose in my organization. .583
There is total agreement on our organizational vision across all levels, functions, and
divisions. .498
All employees are committed to the goals of this organization. .720
We are not afraid to reflect critically on the shared assumptions we have made about our
customers. .769
Personnel in this organization realize that the very way they perceive the marketplace must
be continually questioned. .593
We continually judge the quality of our decisions and activities taken over time. .602
CREATIVITY C
Organization comes up with new and practical ideas to improve performance. .597
Organization searches out new technologies, processes, techniques, and/or product ideas. .671
Organization suggests new ways to increase quality. .723
Organization promotes and champions ideas to others. .771
Organization exhibits creativity on the job when opportunity is provided. .687
Organization develops adequate plans and schedules for the implementation of new ideas. .717
PROACTIVE P
In the past five years, our organization has marketed a large variety of new lines of
products or services. .870
In the past five years, changes in our products or service lines have been mostly of a minor
nature. .547
Organization normally initiates changes upon which our competitors react. .795
COMPETITIVE COMP
In dealing with competitors, our organization often leads the competition in the market. .834
In dealing with competitors, our organization typically adopts a very competitive posture
aiming at overtaking the competitors. .804
Organization is aggressive and intensely competitive in nature. .610

140 | P a g e
4.2. Analyses
4.2.1 Regression Analysis
Regression analysis has been used to determine the effect of marketing orientation, learning
orientation, and entrepreneurial orientation upon KM and its different components like
knowledge acquisition, knowledge dissemination, and responsiveness to knowledge. The
regression analysis is shownbelow.
4.2.1.1 Regression of Marketing Orientation Dimension (Independent Variable) and Knowledge
Dimensions’ Tools Responsiveness to Knowledge (Dependent Variable)
Table 4.8: Regression of Marketing Orientation and Responsiveness to Knowledge
Independent Variables
Marketing Orientation
Dependent Variable
Responsiveness to Knowledge
CO .547*
(15.518)
.000**
COM .322*
(9.144)
.000**
IC .319*
(9.048)
.000**
Adjusted R2 0.503
F-Statistics 135.678
Legend * = represents significance at less than 0.01
INNOVATIVE I
Management actively responds to the adoption of “new ways of doing things” by main
competitors. .809
Organization is willing to try new ways of doing things and seek unusual, novel solutions. .742
Organization encourages people to think and behave in original and novel ways. .694
Extraction Method: Principal Component Analysis. Rotation Method: Varimax with Kaiser Normalization

141 | P a g e
** = sig. values in analysis
Value in parenthesis represents t-ratios
CO = Customer Orientation
COM = Competitor Orientation
IC = Interfunctional Coordination
Regression analysis is used to determine the strength of the relationship between independent
variables and one dependent variable. Regression analysis was used to study the effect of the
independent variable (Marketing Orientation) on the dependent variable (Knowledge
Responsiveness). However, marketing orientation is composed of three different constructs in
the model which are competitor’s orientation, customer’s orientation and interfunctional
coordination. R squared explains the variation in the dependent variable due to the change in
independent variables. It is also known as coefficient of determination because it shows to what
extent data are near to the fitted regression line. However, the value of R also shows the
goodness of the model, which in this case is .712 which is more than enough in social sciences.
Table 4.8 shows independent variable (Marketing Orientation) is causing a change in dependent
variable (Knowledge responsiveness) by 50.6% at the significance level of p=.000 which is
below the required level of the social sciences significance level of .05. Adjusted R squared is
usually less than the R square and the reason is that it removes the irrelevant independent value
from the model thus giving more realistic values of the regression. Table 4.8 shows that adjusted
R square is .503 which is acceptable in social sciences.
The value of F shows the significance level of the model and its fitness to the regression line,
which in this case is 135.678 as shown in Table 4.8. As the significance level of the model is
.000, which is below .05 (p<.05),it shows that the model is statistically significant and there is
also a good fitness in the model.

142 | P a g e
Table 4.8 explains the beta value of the independent variable in relation to the dependent
variable. Results in Table 4.8 show that there is positive effect on dependent variable
(Knowledge responsiveness) by all the constructs of the independent variable. β value for
customer orientation is .547 at a significance level of p=.000 <.05 which shows that they have a
statistically significant relation to each other. It generates the following regression
line:Knowledge Responsiveness = .001 + .546 (Customers orientation). This equation shows that
one unit of change in customer’s orientation will generate a change in knowledge responsiveness
by .546 units.
The Β value for competitor’s orientation is .322 at a significance level of .000 (p) which is below
the required level ofsignificance value of .05; therefore,they have a significant relation to each
other. In this case regression line is as follows: Knowledge Responsiveness = .001 + .322
(Competitor’s orientation). One unit of change in competitor’s orientation will produce a change
in knowledge responsiveness of .322 units.
However, theinterfunctional coordination B valueof .318 is the lowest. It provides a regression
line as follows:if there is a one unit change in interfunctional coordination, there will be a change
in knowledge responsiveness by .318 units. The significance level is (p) = .000<.05,which shows
that both are significantly related to each other.Knowledge Responsiveness = .001 + .318
(Interfunctional Coordination).
As shown in Table 4.8, the Unstandardized coefficient or Beta is .547 for Customer’s orientation,
which has the maximum influence on the dependent variable (Knowledge responsiveness), and

143 | P a g e
the least effect was caused by interfunctional coordination, that is .318. The significance level for
all the constructs of marketing orientation is .000 which is below .05.
4.2.1.2 Regression of Marketing Orientation Dimension (Independent Variable) and Knowledge
Acquisition
Table 4.9: Regression of Marketing Orientation Dimension and Knowledge Acquisition
Independent Variables
Marketing Orientation
Dependent Variable
Knowledge Acquisition
CO .044*
(.954)
.341**
COM .271*
(5.835)
.000**
IC .258*
(5.556)
.000**
Adjusted R2 0.136
F-Statistics 21.937
Legend * = represents significance at less than 0.01
** = sig. values in analysis
Value in parenthesis represents t-ratios
CO = Customer Orientation
COM = Competitor Orientation
IC = Interfunctional Coordination
Regression analysis was used study the effect of the independent variable (Marketing
Orientation) on the dependent variable (Knowledge acquisition). However, marketing orientation
is composed of three different constructs in the model, which are competitor’s orientation,
customer’s orientation and interfunctional coordination. R squared explains the variation in the
dependent variable due to the change in independent variables. It is also known as coefficient of

144 | P a g e
determination because it shows to what extent data are near to the fitted regression line.
However, value of R also shows the goodness of the model, which in this case is .377 which is
more than enough in social sciences. R squared value shows the change in dependent variable
caused by independent variable. Table 4.9 shows independent variable (Marketing Orientation)
is causing a change in dependent variable (Knowledge acquisition) at the significance level of
p=.000, which is below the required level of the social sciences significance level of .05.
Adjusted R squared is usually less than the R square and the reason is that it removes the
irrelevant independent value from the model thus giving a more realistic value of the regression.
Table 4.9 shows that adjusted R square is .136 which is acceptable in social sciences.
Value of F shows the significance level of the model and its fitness to the regression line which
in this case is 21.937 as shown in Table 4.9. As the significance level of the model is .000 which
is below .05 (p<.05),it shows that the model is statistically significant as well ashaving a good
fitness.
Table 4.9 explains the beta value of the independent variable in relation to the dependent
variable. Results in Table 4.9 shows that there is positive effect on dependent variable
(Knowledge acquisition) by all the constructs of the independent variable. β value for customer
orientation is .044 at the significance level of p=.341 >.05 thus they are insignificantly related to
each other. It generates following regression line.Knowledge Acquisition = –.001 + .044
(Customers orientation). This equation shows that one unit of change in customer’s orientation
will generate a change in knowledge acquisition by .044 units.
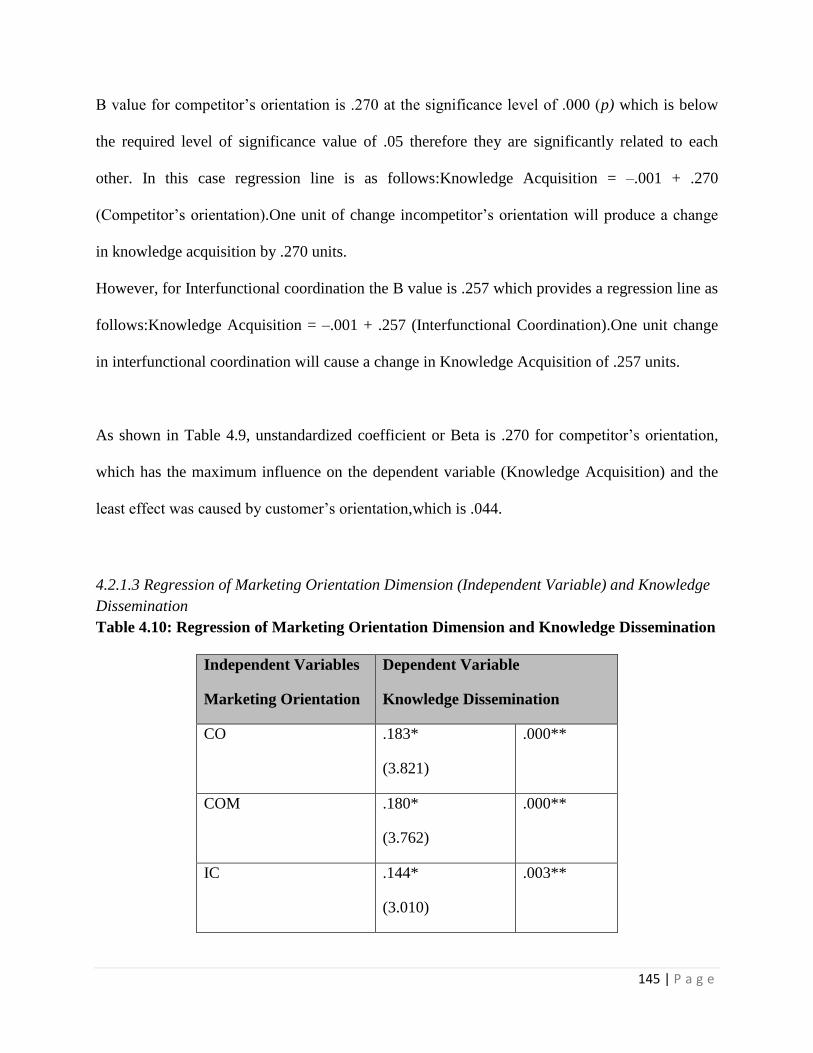
145 | P a g e
Β value for competitor’s orientation is .270 at the significance level of .000 (p) which is below
the required level of significance value of .05 therefore they are significantly related to each
other. In this case regression line is as follows:Knowledge Acquisition = –.001 + .270
(Competitor’s orientation).One unit of change incompetitor’s orientation will produce a change
in knowledge acquisition by .270 units.
However, for Interfunctional coordination the B value is .257 which provides a regression line as
follows:Knowledge Acquisition = –.001 + .257 (Interfunctional Coordination).One unit change
in interfunctional coordination will cause a change in Knowledge Acquisition of .257 units.
As shown in Table 4.9, unstandardized coefficient or Beta is .270 for competitor’s orientation,
which has the maximum influence on the dependent variable (Knowledge Acquisition) and the
least effect was caused by customer’s orientation,which is .044.
4.2.1.3 Regression of Marketing Orientation Dimension (Independent Variable) and Knowledge
Dissemination
Table 4.10: Regression of Marketing Orientation Dimension and Knowledge Dissemination
Independent Variables
Marketing Orientation
Dependent Variable
Knowledge Dissemination
CO .183*
(3.821)
.000**
COM .180*
(3.762)
.000**
IC .144*
(3.010)
.003**

146 | P a g e
Adjusted R2 0.080
F-Statistics 12.625
Legend * = represents significance at less than 0.01
** = sig. values in analysis
Value in parenthesis represents t-ratios
CO = Customer Orientation
COM = Competitor Orientation
IC = Interfunctional Coordination
Regression analysis was used to study the effect of the independent variable (Marketing
Orientation) on the dependent variable (Knowledge dissemination). However, marketing
orientation is composed of three different constructs in the model which are competitor’s
orientation, customer’s orientation and interfunctional coordination. R squared explains the
variation in the dependent variable due to the change in independent variables. It is also known
as coefficient of determination because it shows to what extent data are near to the fitted
regression line. However, value of R also shows the goodness of the model, which in this case is
.295 which is more than enough in social sciences. R squared value shows the change in
dependent variable caused by independent variables. Table 4.10 shows that the independent
variable (Marketing Orientation) is causing a change in dependent variable (Knowledge
dissemination) by 8.7% at a significance level of p=.000 which is below the required level of the
social sciences significance level of .05. Adjusted R squared is usually less than the R square and
the reason is that it removes the irrelevant independent value from the model thus giving more
realistic values of the regression. Table 4.10 shows that adjusted R square is .08 which is
acceptable in social sciences but is somewhat low.
Value of F shows the significance level of the model and its fitness to the regression line which
in this case is 12.625 as shown in Table 4.10. As the significance level of the model is .000

147 | P a g e
which is below .05 (p<.05) it shows that the model is statistically significant and there is also a
good fitness in the model.
Table 4.10 explains the beta value of the independent variable in relation to the dependent
variable. Results in Table 4.10 show that there is positive effect on dependent variable
(Knowledge dissemination) by all the constructs of the independent variable (marketing
orientation). β value for customer orientation is .183 at a significance level of p=.000 <.05 thus
they are significantly related to each other. It generates the following regression line:Knowledge
dissemination = –9.756 + .183 (Customer orientation). This equation shows that one unit of
change in customer’s orientation will generate a change in Knowledge dissemination by .183
units.
The Β value for competitor’s orientation is .180 at a significance level of .000 (p) which is below
the required level of significance value of .05; therefore, they are significantly related to each
other. In this case the regression line is as follows: Knowledge dissemination = –9.756 + .180
(Competitor’s orientation). One unit of change in competitor’s orientationwill produce a change
in Knowledge dissemination by .180 units.
However, the interfunctional coordination B value is the lowest as it generates a value of .144
which provides a regression line as follows:Knowledge dissemination = –9.756 + .257
(Interfunctional Coordination). One unit change in interfunctional coordination will lead to a
change in Knowledge dissemination by .144 units.

148 | P a g e
As shown in Table 4.10, unstandardized coefficient or Beta is .183 for customers orientation
which has maximum influence on the dependent variable (Knowledge dissemination) and the
least effect was caused by interfunctional coordination,which is .144.
4.2.1.4 Regression of Learning Orientation Dimension (Independent Variable) and Knowledge
Dimensions’ Tools Responsiveness to Knowledge (Dependent Variable)
Table 4.11: Regression of Learning Orientation Dimension and Responsiveness to
Knowledge
Independent Variables
Learning Orientation
Dependent Variable
Responsiveness to Knowledge
C .471*
(12.452)
.000**
CL .375*
(9.927)
.000**
CI .289*
(7.634)
.000**
Adjusted R2 0.433
F-Statistics 101.985
Legend * = represents significance at less than 0.01
** = sig. values in analysis
Value in parenthesis represents t-ratios
C = Creativity
CL = Learning Commitment
CI = Collective Intelligence
Regression analysis is used to determine the strength of the relationship between independent
variables and one dependent variable. Regression analysis was used to study the effect of the
independent variable (Learning Orientation) on the dependent variable (Knowledge

149 | P a g e
Responsiveness). However, learning orientation is composed of three different constructs in the
model which are collective intelligence, commitment to learning and creativity. R squared
explains the variation in the dependent variable due to change in independent variables. It is also
known as coefficient of determination because it shows to what extent data is near to the fitted
regression line. However, value of R also shows the goodness of the model, which in this case is
.661 which is more than enough in social sciences. R squared value shows the change in
dependent variable caused by independent variables. Table 10 shows independent variable
(Learning Orientation) is causing a change in dependent variable (Knowledge responsiveness) by
43.3% at the significance level of p=.000 which is below the required level of the social sciences
significance level of .05. Adjusted R squared is usually less than the R square and the reason is
that it removes the irrelevant independent value from the model thus giving more realistic values
of the regression. Table 4.11 shows that adjusted R squared is .433 which is acceptable in social
sciences.
Value of F shows the significance level of the model and its fitness to the regression line which
in this case is 101.985 as shown in Table 4.11. As the significance level of the model is .000
which is below .05 (p<.05) it shows that the model is statistically significant and there is also a
good fitness in the model.
Table 4.11 explains the beta value of the independent variable in relation to the dependent
variable. Results in Table 4.11 show that there is positive effect on dependent variable
(Knowledge responsiveness) by all the constructs of the independent variable (Learning
Orientation). β value for the commitment to learning is .479 at a significance level of p=.000
150 | P a g e
<.05 which shows that they are statistically significantly related to each other. It generates the
following regression line:Knowledge Responsiveness = –.015 + .479 (Creativity).This equation
shows that one unit of change in commitment to learning will generate a change in knowledge
responsiveness by .479 units.
Β value for the learning orientation is .377 at a significance level of .000 (p) which is below the
required level of significance value of .05 that shows that they are significantly related to each
other. In this case the regression line is as follows: Knowledge Responsiveness = --.015 + .377
(Commitment to Learning). One unit of change in learning orientationwill produce a change in
knowledge responsiveness of .377 units.
However, the collective intelligenceB value is lowest as it generates a value of .289 which
provides a regression line as follows:Knowledge Responsiveness = .001 + .288 (Collective
Intelligence).One unit change in collective intelligence will lead to a change in knowledge
responsiveness by .288 units. The significance level is p= .000<.05 which shows that both are
significantly related to each other.
As shown in Table 4.11, unstandardized coefficient or Beta is .471 for creativity which has
maximum influence on the dependent variable (Knowledge responsiveness) and the least effect
was caused by collective intelligence, which is .289. However, significance level for all the
constructs of learning orientation is .000 which is below .05.

151 | P a g e
4.2.1.5 Regression of Learning Orientation Dimension (Independent Variable) and Knowledge
Acquisition (Dependent Variable)
Table 4.12: Regression of Learning Orientation Dimension and Knowledge Acquisition
Independent Variables
Learning Orientation
Dependent Variable
Knowledge Acquisition
C .156*
(3.243)
.001**
CL .153*
(3.168)
.002**
CI .202*
(4.204)
.000**
Adjusted R2 0.080
F-Statistics 12.550
Legend * = represents significance at less than 0.01
** = sig. values in analysis
Value in parenthesis represents t-ratios
C = Creativity
CL = Learning Commitment
CI = Collective Intelligence
Regression analysis is used to determine the strength of the relationship between independent
variables and one dependent variable. Regression analysis was used to study the effect of the
independent variable (Learning Orientation) on the dependent variable (Knowledge acquisition).
However, learning orientation is composed of three different constructs in the model which are
collective intelligence, commitment to learning and creativity. R squared explains the variation
in the dependent variable due to the change in independent variables. It is also known as
coefficient of determination because it shows to what extent data are near to the fitted regression
line. However, value of R also shows the goodness of the model, which in this case is .295 which
152 | P a g e
is more than enough in social sciences. R squared value shows the change in dependent variable
caused by independent variable. Table 4.12 shows independent variable (Learning Orientation) is
causing a change in dependent variable (Knowledge acquisition) by 8.0% at the significance
level of p=.000 which is below the required level of the social sciences significance level of .05.
Adjusted R squared is usually less than the R square and the reason is that it removes the
irrelevant independent value from the model thus giving a more realistic value of the regression.
Table 4.12 shows that adjusted R squared is .08 which is acceptable in social sciences.
Value of F shows the significance level of the model and its fitness to the regression line which
in this case is 12.550 as shown in Table 4.12. As the significance level of the model is .000
which is below .05 (p<.05) it shows that the model is statistically significant and there is also a
good fitness in the model.
Table 4.12 explains the beta value of the independent variable in relation to the dependent
variable. Results in Table 4.12 show that there is positive effect on dependent variable
(Knowledge acquisition) by all the constructs of the independent variable (Learning Orientation).
β value for creativity is .156 at the significance level of p=.001 <.05 which shows that they are
statistically significantly related to each other. It generates following regression line: Knowledge
Acquisition = –.013 + .158 (creativity). This equation shows that one unit of change in creativity
will generate a change in knowledge acquisition by .158 units.
The Β value for commitment to learning is .153 at a significance level of .002 (p) which is below
the required level of significance value of .05 that shows that they are significantly related to

153 | P a g e
each other. In this case the regression line is as follows: Knowledge Acquisition = –.013 + .153
(commitment to learning). One unit change in commitment to learning will produce a change in
knowledge responsiveness by .153 units.
However, for collective intelligence the B value is highest as it generates a value of .202 which
provides a regression line as follows:Knowledge Acquisition = .001 + .202 (collective
intelligence).This shows that one unit change in collective intelligence will lead to a change in
knowledge acquisition of .202 units. As the significance level is p= .000 <.05 that shows that
both are significantly related to each other.
As shown in Table 4.12, unstandardized coefficient or Beta is .202 for collective intelligence
which has the maximum influence on the dependent variable (Knowledge responsiveness) and
the least effect was caused by commitment to learning,which is .153. However, the significance
level for all the constructs of learning orientation is .000 which is below .05.
4.2.1.6 Regression of Learning Orientation Dimension (Independent Variable) and Knowledge
Dissemination (Dependent Variable)
Table 4.13: Regression of Learning Orientation Dimension and Knowledge Dissemination
Independent Variables
Learning Orientation
Dependent Variable
Knowledge Dissemination
C .033*
(0.718)
.473**
CL .185* .000**
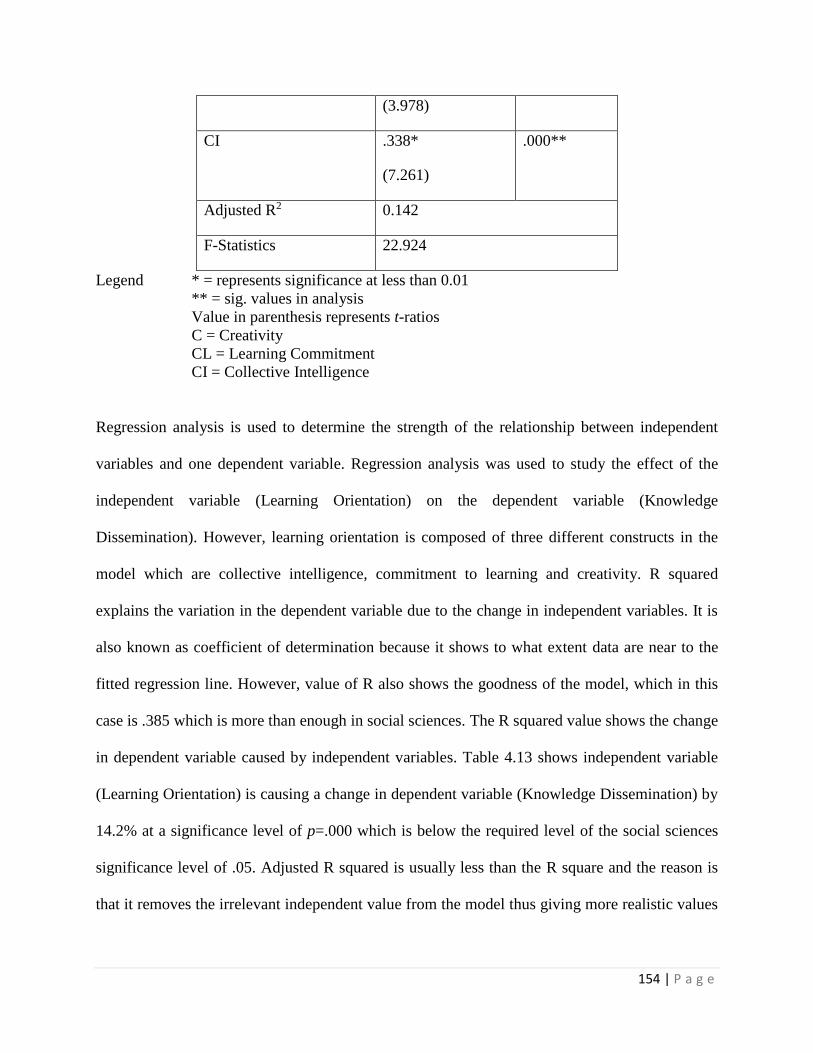
154 | P a g e
(3.978)
CI .338*
(7.261)
.000**
Adjusted R2 0.142
F-Statistics 22.924
Legend * = represents significance at less than 0.01
** = sig. values in analysis
Value in parenthesis represents t-ratios
C = Creativity
CL = Learning Commitment
CI = Collective Intelligence
Regression analysis is used to determine the strength of the relationship between independent
variables and one dependent variable. Regression analysis was used to study the effect of the
independent variable (Learning Orientation) on the dependent variable (Knowledge
Dissemination). However, learning orientation is composed of three different constructs in the
model which are collective intelligence, commitment to learning and creativity. R squared
explains the variation in the dependent variable due to the change in independent variables. It is
also known as coefficient of determination because it shows to what extent data are near to the
fitted regression line. However, value of R also shows the goodness of the model, which in this
case is .385 which is more than enough in social sciences. The R squared value shows the change
in dependent variable caused by independent variables. Table 4.13 shows independent variable
(Learning Orientation) is causing a change in dependent variable (Knowledge Dissemination) by
14.2% at a significance level of p=.000 which is below the required level of the social sciences
significance level of .05. Adjusted R squared is usually less than the R square and the reason is
that it removes the irrelevant independent value from the model thus giving more realistic values
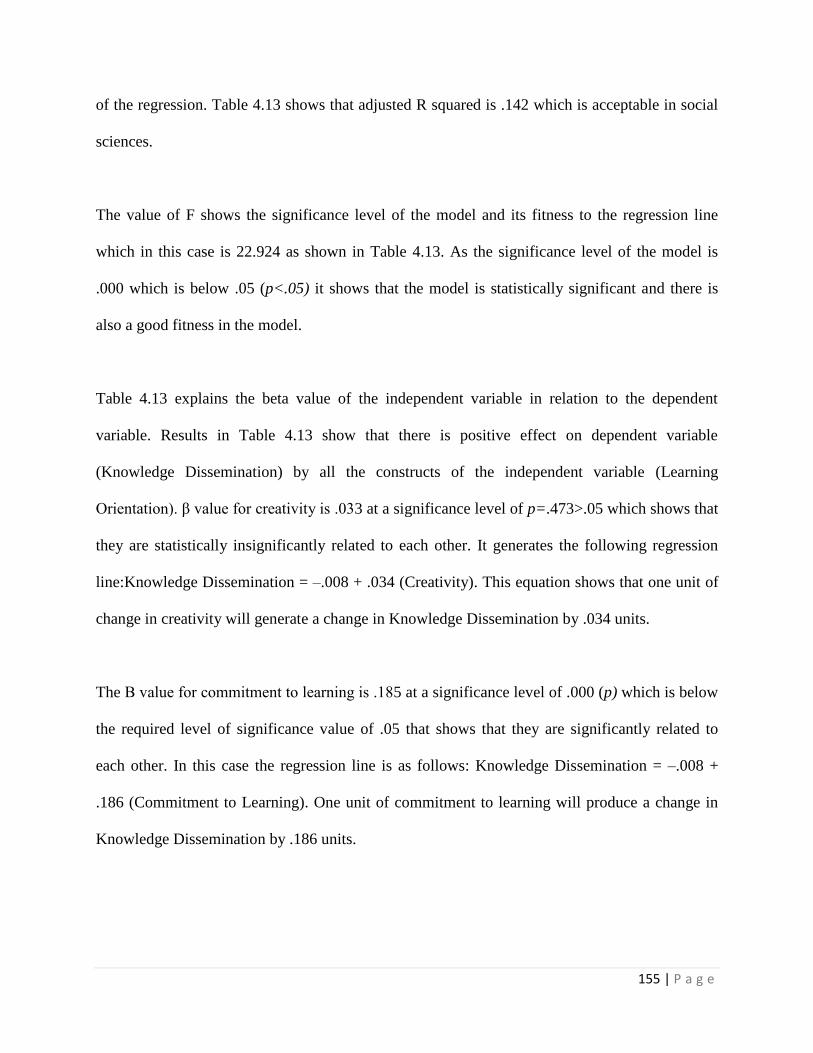
155 | P a g e
of the regression. Table 4.13 shows that adjusted R squared is .142 which is acceptable in social
sciences.
The value of F shows the significance level of the model and its fitness to the regression line
which in this case is 22.924 as shown in Table 4.13. As the significance level of the model is
.000 which is below .05 (p<.05) it shows that the model is statistically significant and there is
also a good fitness in the model.
Table 4.13 explains the beta value of the independent variable in relation to the dependent
variable. Results in Table 4.13 show that there is positive effect on dependent variable
(Knowledge Dissemination) by all the constructs of the independent variable (Learning
Orientation). β value for creativity is .033 at a significance level of p=.473>.05 which shows that
they are statistically insignificantly related to each other. It generates the following regression
line:Knowledge Dissemination = –.008 + .034 (Creativity). This equation shows that one unit of
change in creativity will generate a change in Knowledge Dissemination by .034 units.
The Β value for commitment to learning is .185 at a significance level of .000 (p) which is below
the required level of significance value of .05 that shows that they are significantly related to
each other. In this case the regression line is as follows: Knowledge Dissemination = –.008 +
.186 (Commitment to Learning). One unit of commitment to learning will produce a change in
Knowledge Dissemination by .186 units.
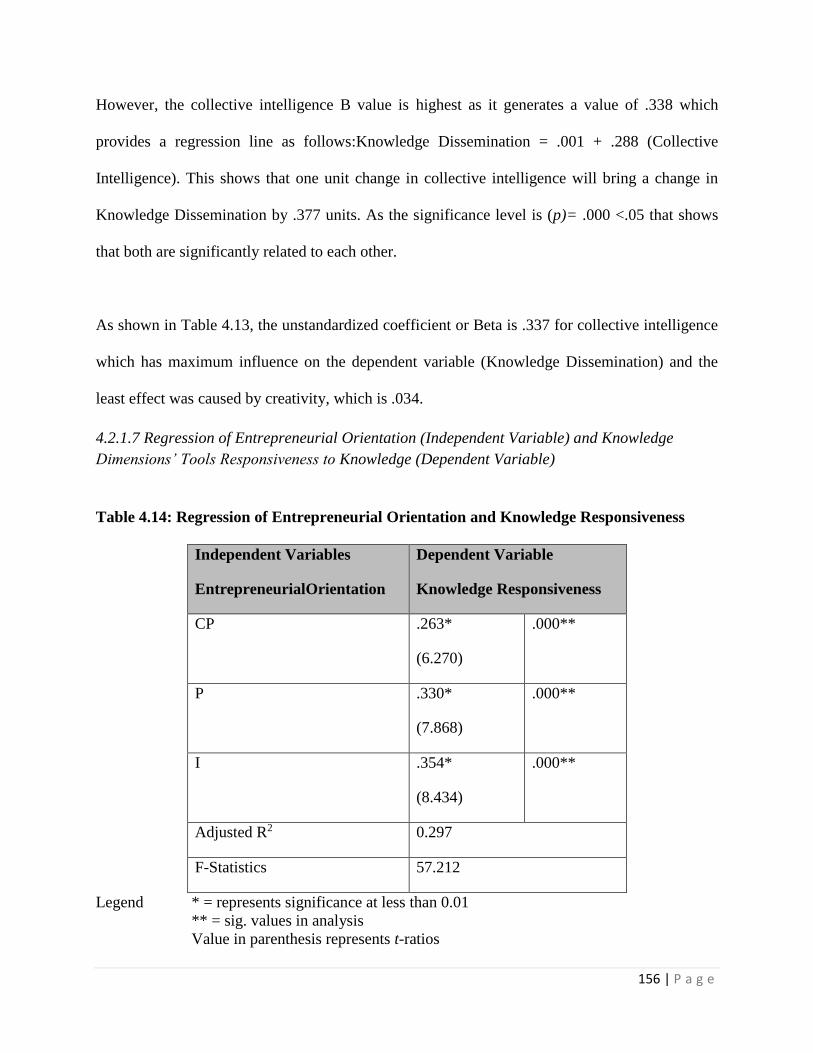
156 | P a g e
However, the collective intelligence B value is highest as it generates a value of .338 which
provides a regression line as follows:Knowledge Dissemination = .001 + .288 (Collective
Intelligence). This shows that one unit change in collective intelligence will bring a change in
Knowledge Dissemination by .377 units. As the significance level is (p)= .000 <.05 that shows
that both are significantly related to each other.
As shown in Table 4.13, the unstandardized coefficient or Beta is .337 for collective intelligence
which has maximum influence on the dependent variable (Knowledge Dissemination) and the
least effect was caused by creativity, which is .034.
4.2.1.7 Regression of Entrepreneurial Orientation (Independent Variable) and Knowledge
Dimensions’ Tools Responsiveness to Knowledge (Dependent Variable)
Table 4.14: Regression of Entrepreneurial Orientation and Knowledge Responsiveness
Independent Variables
EntrepreneurialOrientation
Dependent Variable
Knowledge Responsiveness
CP .263*
(6.270)
.000**
P .330*
(7.868)
.000**
I .354*
(8.434)
.000**
Adjusted R2 0.297
F-Statistics 57.212
Legend * = represents significance at less than 0.01
** = sig. values in analysis
Value in parenthesis represents t-ratios

157 | P a g e
CP = Competitive
P = Proactive
I = Innovative
Regression analysis is used to determine the strength of the relationship between independent
variables and one dependent variable. Regression analysis was used to study the effect of the
independent variable (Entrepreneurial Orientation) on the dependent variable (Knowledge
Responsiveness). However, entrepreneurial orientation is composed of three different constructs
in the model which are innovative, competitive and proactive. R squared explains the variation in
the dependent variable due to change in independent variables. It is also known as coefficient of
determination because it shows to what extent data are near to the fitted regression line.
However, value of R also shows the goodness of the model, which in this case is .549 which is
more than enough in social sciences. R squared value shows the change in dependent variable
caused by independent variable. Table 4.14 shows independent variable (Entrepreneurial
Orientation) is causing a change in dependent variable (Knowledge Responsiveness) by 29.7% at
a significance level of p=.000 which is below the required level of the social sciences
significance level of .05. Adjusted R squared is usually less than the R squared and the reason is
that it removes the irrelevant independent value from the model thus giving more realistic values
of the regression. Table 4.14 shows that adjusted R squared is .297 which is acceptable in social
sciences.
The value of F shows the significance level of the model and its fitness to the regression line
which in this case is 57.212 as shown in Table 4.14. As the significance level of the model is
.000 which is below .05 (p<.05) it shows that the model is statistically significant and there is
also a good fitness in the model.

158 | P a g e
Table 4.14 explains the beta value of the independent variable in relation to the dependent
variable. Results in Table 4.14 show that there is positive effect on dependent variable
(Knowledge Responsiveness) by all the constructs of the independent variable (Entrepreneurial
Orientation). β value for competitive is .263 at the significance level of p=.000 <.05 which
shows that they are statistically significantly related to each other. It generates the following
regression line:Knowledge Responsiveness = –.004 + .262 (Competitive). This equation shows
that one unit of change in competitive will generate a change in Knowledge Responsiveness by
.262 units.
The Β value for proactive is .330 at a significance level of .000 (p) which is below the required
level of significance value of .05 that shows that they are significantly related to each other. In
this case the regression line is as follows: Knowledge Responsiveness = –.004 + .330
(Proactive).One unit change in proactivity will produce a change in Knowledge Responsiveness
by .330 units.
The innovative B value is highest as it generates a value of .354 which provides a regression line
as follows:Knowledge Responsiveness = –.004 + .352 (Innovative). This shows that one unit
change in innovativewill lead to a change in Knowledge Responsiveness of .352 units. The
significance level is (p)= .000 <.05 which shows that both are significantly related to each other.

159 | P a g e
As shown in Table 4.14, the Unstandardized coefficient or Beta is .352 for innovative which has
maximum influence on the dependent variable (Knowledge Responsiveness) and the least effect
was caused by competitive that is .262.
4.2.1.8 Regression of Entrepreneurial Orientation (Independent Variable) and Knowledge
Dissemination (Dependent Variable)
Table 4.15: Regression of Entrepreneurial Orientation and Knowledge Dissemination
Independent Variables
EntrepreneurialOrientation
Dependent Variable
Knowledge Dissemination
CP .162*
(3.365)
.001**
P .097*
(2.021)
.044**
I .222*
(4.628)
.000**
Adjusted R2 0.078
F-Statistics 12.242
Legend * = represents significance at less than 0.01
** = sig. values in analysis
Value in parenthesis represents t-ratios
CP = Competitive
P = Proactive
I = Innovative
Regression analysis is used to determine the strength of the relationship between independent
variables and one dependent variable. Regression analysis was used to study the effect of the
independent variable (Entrepreneurial Orientation) on the dependent variable (Knowledge
Dissemination. However, entrepreneurial orientation is composed of three different constructs in

160 | P a g e
the model which are innovative, competitive and proactive. R squared explains the variation in
the dependent variable due to the change in independent variables. It is also known as coefficient
of determination because it shows to what extent data are near to the fitted regression line.
However, value of R also shows the goodness of the model, which in this case is .291 which is
more than enough in social sciences. R squared value shows the change in dependent variable
caused by independent variable. Table 4.15 shows independent variable (Entrepreneurial
Orientation) is causing a change in dependent variable (Knowledge Dissemination) by 7.8% at a
significance level of p=.000 which is below the required level of the social sciences significance
level of .05. Adjusted R squared is usually less than the R squared and the reason is that it
removes the irrelevant independent value from the model thus giving more realistic values of the
regression. Table 4.15 shows that adjusted R squared is .078 which is acceptable in social
sciences.
The value of F shows the significance level of the model and its fitness to the regression line
which in this case is 12.242 as shown in Table 4.15. As the significance level of the model is
.000 which is below .05 (p<.05) it shows that the model is statistically significant and there is
also a good fitness in the model.
Table 4.15 explains the beta value of the independent variable in relation to the dependent
variable. Results in Table 4.15 show that there is positive effect on dependent variable
(Knowledge Dissemination) by all the constructs of the independent variable (Entrepreneurial
Orientation). The β value for competitive is .162 at a significance level of p=.001 <.05 which
shows that they are statistically significantly related to each other. It generates following

161 | P a g e
regression line: Knowledge dissemination = –.002 + .161 (Competitive). This equation shows
that one unit of change in competitive will generate a change in Knowledge Responsiveness by
.161 units.
The Β value for proactive is .097 at a significance level of .044 (p) which is below the required
level of significance value of .05 that shows that they are significantly related to each other. In
this case the regression line is as follows: Knowledge Responsiveness = –.002 + .097
(Proactive). One unit change in proactivity will produce a change in Knowledge Responsiveness
by .097 units.
The innovative B value is highest as it generates a value of .222 which provides a regression line
as follows:Knowledge Dissemination = –.004 + .222 (Innovative).This shows that one unit
change in innovative will lead to a change in Knowledge Dissemination by .221 units. As the
significance level is (p)= .000 <.05 that shows that both are significantly related to each other.
As shown in Table 4.15, the unstandardized coefficient or Beta is .221 for innovative which has
maximum influence on the dependent variable (Knowledge dissemination) and the least effect
was caused by proactive, which is .097.
4.2.1.9 Regression of Entrepreneurial Orientation (Independent Variable) and Knowledge
Acquisition (Dependent Variable)

162 | P a g e
Table 4.16: Regression of Entrepreneurial Orientation and Knowledge Acquisition
Independent Variables
EntrepreneurialOrientation
Dependent Variable
Knowledge Acquisition
CP .144*
(3.009)
.003**
P .115*
(2.406)
.017**
I .227*
(4.721)
.000**
Adjusted R2 0.078
F-Statistics 12.336
Legend * = represents significance at less than 0.01
** = sig. values in analysis
Value in parenthesis represents t-ratios
CP = Competitive
P = Proactive
I = Innovative
Regression analysis is used to determine the strength of the relationship between independent
variables and one dependent variable. Regression analysis was used to study the effect of the
independent variable (Entrepreneurial Orientation) on the dependent variable (Knowledge
Acquisition). However, entrepreneurial orientation is composed of three different constructs in
the model which are innovative, competitive and proactive. R squared explains the variation in
the dependent variable due to the change in independent variables. It is also known as coefficient
of determination because it shows to what extent data are near to the fitted regression line.
However, value of R also shows the goodness of the model, which is more than enough in social
sciences. R squared value shows the change in dependent variable caused by independent

163 | P a g e
variable. Table 4.16 shows independent variable (Entrepreneurial Orientation) is causing a
change in dependent variable (Knowledge Acquisition) by 7.8% at a significance level of p=.000
which is below the required level of the social sciences significance level of .05. Adjusted R
squared is usually less than the R squared and the reason is that it removes the irrelevant
independent value from the model thus giving more realistic values of the regression. Table 4.16
shows that adjusted R squared is .078 which is acceptable in social sciences.
The value of F shows the significance level of the model and its fitness to the regression line
which in this case is 12.336 as shown in Table 4.16. As the significance level of the model is
.000 which is below .05 (p<.05) it shows that the model is statistically significant and there is
also a good fitness in the model.
Table 4.16 explains the beta value of the independent variable in relation to the dependent
variable. Results in Table 4.16 show that there is positive effect on dependent variable
(Knowledge Acquisition) by all the constructs of the independent variable (Entrepreneurial
Orientation). β value for competitive is .144 at a significance level of p=.003<.05 which shows
that they are statistically significantly related to each other. It generates following regression
line: Knowledge Acquisition = –.002 + .144 (Competitive). This equation shows that one unit of
change in competitive will generate a change in Knowledge Acquisition by .144 units.
The Β value for proactive is .115 at a significance level of .017 (p) which is below the required
level of significance value of .05 that shows that they are significantly related to each other. In

164 | P a g e
this case regression line is as follows: Knowledge Acquisition = -.002 + .116 (Proactive). One
unit change in proactivitywill produce a change in Knowledge Acquisition by .116 units.
The innovative B value is highest as it generates a value of .227 which provides a regression line
as follows:Knowledge Acquisition = –.002 + .227 (Innovative). This shows that one unit change
in innovative will lead to a change in Knowledge Acquisition by .227 units. The significance
level is (p)= .000 <.05 which shows that both are significantly related to each other.
As shown in Table 4.16, the Unstandardized coefficient or Beta is .227 for innovative which has
maximum influence on the dependent variable (Knowledge Acquisition) and the least effect was
caused by proactive, which is .116. However, the significance level for all the constructs of
learning orientation is .000 which is below .05.
4.2.1.10 Regression of Marketing Orientation (Independent Variable) and Knowledge
Management (Dependent Variable)
Table 4.17: Regression of Marketing Orientation and Knowledge Management
Independent Variables
Marketing Orientation
Dependent Variable
Knowledge Management
MO .757*
(23.175)
.000**
Adjusted R2 0.573
F-Statistics 537.087
Legend * = represents significance at less than 0.01
** = sig. values in analysis
Value in parenthesis represents t-ratios
MO = Marketing Orientation

165 | P a g e
Regression analysis is used to determine the strength of the relationship between independent
variables and one dependent variable. Regression analysis was used to study the effect of the
independent variable (Marketing Orientation) on the dependent variable (Knowledge
Management). However, marketing orientation is composed of three different constructs in the
model which are competitor’s orientation, customer’s orientation and interfunctional
coordination while Knowledge Management is considered here to be a single dependent variable
which also consists of three dimensions that are Knowledge Responsiveness, Knowledge
Dissemination and Knowledge Acquisition. R squared explains the variation in the dependent
variables due to the change in independent variables. It is also known as coefficient of
determination because it shows to what extent data are near to the fitted regression line.
However, value of R also shows the goodness of the model, which in this case is .757 which is
more than enough in social sciences. R squared value shows the change in dependent variable
caused by independent variable. Table 4.17 shows independent variable (Marketing Orientation)
is causing a change in dependent variable (Knowledge Management) by 57.3% at the
significance level of p=.000 which is below the required level of the social sciences significance
level of .05. Adjusted R squared is usually less than the R squared and the reason is that it
removes the irrelevant independent value from the model thus giving more realistic values of the
regression. Table 4.17 shows that adjusted R squared is .573 which is acceptable in social
sciences.
The value of F shows the significance level of the model and its fitness to the regression line
which in this case is 537.087 as shown in Table 4.17. As the significance level of the model is

166 | P a g e
.000 which is below .05 (p<.05) it shows that the model is statistically significant and there is
also a good fitness in the model.
Table 4.17 explains the beta value of the independent variable in relation to the dependent
variable. Results in Table 4.17 show that there is positive effect on dependent variable
(Knowledge Management) by the independent variable (Marketing Orientation). The β value for
Marketing Orientation is .757 at a significance level of p=.000 <.05 which shows that they are
statistically significantly related to each other. It generates the following regression line:
Knowledge Management =.000 + .757 (Marketing Orientation). This equation shows that one
unit of change in marketing orientation will generate a change in Knowledge Management by
.757 units.
4.2.1.11 Regression of Learning Orientation (Independent Variable) and Knowledge
Management (Dependent Variable)
Table 4.18: Regression of Learning Orientation and Knowledge Management
Independent Variables
Learning Orientation
Dependent Variable
Knowledge Management
LO .732*
(21.365)
.000**
Adjusted R2 0.534
F-Statistics 456.456
Legend * = represents significance at less than 0.01
** = sig. values in analysis
Value in parenthesis represents t-ratios
LO = Learning Orientation

167 | P a g e
Regression analysis is used to determine the strength of the relationship between independent
variables and one dependent variable. Regression analysis was used to study the effect of the
independent variable (Learning Orientation) on the dependent variable (Knowledge
Management). However, learning orientation is composed of three different constructs in the
model which are creativity, collective intelligence and commitment to learning while Knowledge
Management is considered here to be a single dependent variable which also consists of three
dimensions that are Knowledge Responsiveness, Knowledge Dissemination and Knowledge
Acquisition. R squared explains the variation in the dependent variables due to the change in
independent variables. It is also known as coefficient of determination because it shows to what
extent data are near to the fitted regression line. However, value of R also shows the goodness of
fit of the model, which in this case is .732 which is more than enough in social sciences. R
squared value shows the change in dependent variable caused by independent variable. Table
4.18 shows independent variable (Learning Orientation) is causing a change in dependent
variable (Knowledge Management) by 53.4% at the significance level of p=.000 which is below
the required level of the social sciences significance level of .05. Adjusted R squared is usually
less than R squared and the reason is that it removes the irrelevant independent value from the
model thus giving more realistic values of the regression. Table 4.18 shows that adjusted R
squared is .534 which is acceptable in social sciences.
The value of F shows the significance level of the model and its fitness to the regression line
which in this case is 456.456 as shown in Table 4.18. As the significance level of the model is
.000 which is below .05 (p<.05) it shows that the model is statistically significant and there is
also a good fitness in the model.

168 | P a g e
Table 4.18 explains the beta value of the independent variable in relation to the dependent
variable. Results in Table 4.18 show that there is positive effect on dependent variable
(Knowledge Management) by the independent variable (Learning Orientation). The β value for
learning orientation is .732 at a significance level of p=.000 <.05 which shows that they are
statistically significantly related to each other. It generates the following regression line:
Knowledge Management = –.012 + .739 (Learning Orientation). This equation shows that one
unit of change in learning orientation will generate a change in Knowledge Management by .739
units.
4.2.1.12 Regression of Entrepreneurial Orientation (Independent Variable) and Knowledge
Management (Dependent Variable)
Table 4.19: Regression of Entrepreneurial Orientation and Knowledge Management
Independent Variables
Entrepreneurial Orientation
Dependent Variable
Knowledge Management
EO .637*
(16.504)
.000**
Adjusted R2 0.404
F-Statistics 272.392
Legend * = represents significance at less than 0.01
** = sig. values in analysis
Value in parenthesis represents t-ratios
EO = Entrepreneurial Orientation
Regression analysis is used to determine the strength of the relationship between independent
variables and one dependent variable. Regression analysis was used to study the effect of the
independent variable (Entrepreneurial Orientation) on the dependent variable (Knowledge

169 | P a g e
Management). However, entrepreneurial orientation is composed of three different constructs in
the model which are competitive, proactive and innovative while Knowledge Management is
considered here to be a single dependent variable which also consists of three dimensions that
are Knowledge Responsiveness, Knowledge Dissemination and Knowledge Acquisition. R
squared explains the variation in the dependent variables due to a change in independent
variables. It is also known as coefficient of determination because it shows to what extent data
are near to the fitted regression line. However, value of R also shows the goodness of the model,
which in this case is .637 which is more than enough in social sciences. The R squared value
shows the change in dependent variable caused by independent variable. Table 4.19 shows
independent variable (Entrepreneurial Orientation) is causing a change in dependent variable
(Knowledge Management) by 40.4% at a significance level of p=.000 which is below the
required level of the social sciences significance level of .05. Adjusted R squared is usually less
than the R squared and the reason is that it removes the irrelevant independent value from the
model thus giving more realistic values of the regression. Table 4.19 shows that adjusted R
squared is .404 which is acceptable in social sciences.
The value of F shows the significance level of the model and its fitness to the regression line
which in this case is 272.392 as shown in Table 4.19. As the significance level of the model is
.000 which is below .05 (p<.05) it shows that the model is statistically significant and there is
also a good fitness in the model.
Table 4.19 explains the beta value of the independent variable in relation to the dependent
variable. Results in Table 4.19 show that there is positive effect on dependent variable

170 | P a g e
(Knowledge Management) by the independent variable (Entrepreneurial Orientation). The β
value for entrepreneurial orientation is .637 at a significance level of p=.000 <.05 which shows
that they are statistically significantly related to each other. It generates the following regression
line: Knowledge Management = –.003 + .637 (Entrepreneurial Orientation). This equation shows
that one unit of change in entrepreneurial orientation will generate a change in Knowledge
Management of .637 units.

171 | P a g e
Chapter 5
Discussion
The SME sector is considered one of the major drivers of economic growth in any economy, but
the success of SMEs is considered a complex phenomenon. The failure rate of SMEs is quite
high around the globe, butthis rate is even higher in developing economies like Pakistan. There
have been many efforts to identify and assess the underlying factors of SME success and growth.
One such factor is knowledge management, which is considered a key competency in the
dynamic competitive era of today. So, having a knowledge management system in place could
help SMEs to succeed in the marketplace. Thus, development of such a system is considered
essential for the success of SMEs. This study is conducted in this context so as to understand the
role of different strategic orientations on knowledge management in the advertising segment of
SMEs. Media and the advertising segment of SMEs in Pakistan have witnessed a steady growth
in the past decade and this segment is considered important because it is responsible for
marketing products and services and provokes people into making consumption decisions.Thus,
businesses are motivated to produce new products and services, and consumers are helped to
make a consumption decision. This helps to create new business opportunities in the economy
and money circulation in the economy is improved. By and large, media and advertisement
sector help the producers and consumers and micro-level and economy at macro-level. Thus,
people in an economy are able to actualize their goals and economic growth is sustained.
Strategic orientations considered in this study are MO, LO and EO, and their impact on KM in
the advertising segment of SMEs is considered;KM is measured using the dimensions of
knowledge acquisition, knowledge dissemination and responsiveness to knowledge. This chapter
172 | P a g e
is divided into three sections in which the three strategic orientations and their impact on KM are
discussed.The first section of the discussion discusses the results on the impact of MO on KM,
the second section of this chapter provides discussion on the impact of LO on KM and the third
section of the chapter discusses the impact of EO on KM.
5.1 Market Orientation and Knowledge Management
This part of the discussion provides discussion on the impact of MO as represented by the
behavioral categories of customer orientation, competitor orientation and interfunctional
coordination on KM as represented by knowledge acquisition, knowledge dissemination and
responsiveness to knowledge. Four different regressions were run in this regard, whereby the
first regression provides the impact of overall MO on overall KM. The second regression
assesses the impact of all three dimensions of MO(i.e. customer orientation, competitor
orientation and interfunctional coordination) on first dimension of KM(i.e. knowledge
acquisition). The third regression estimates the impact of all three dimensions of MO on second
dimension of KM(i.e. knowledge dissemination) and last regression estimates the impact of all
three dimensions of MO on third dimension of KM(i.e. responsiveness to knowledge).
Overall, in relation to Table 4.17 in the analysis chapter,MO was found to have a significant
relationship with KM and this relationship was quite strong as it explained more than 50%
variation in KM. MO relates to the external environment of the organization, whereby
knowledge relating to customers and competitor could be an important consideration in the
context of creating value for customers and building a CA in the marketplace. The modern
marketing era is characterized by increasing customer demands and competition with the

173 | P a g e
competitors in the market. This requires understanding of the market mechanism as to how a
firm can create value for its customers. The satisfaction and delight of the customer depends
heavily on market intelligence and knowledge related to a customer’s preferences, tastes, habits
and perceptions. So, as interpreted by Kohli and Jaworski (1990), MO is about acquisition,
dissemination and responsiveness of intelligence related to the market participants like customers
and competitors. Hunt and Morgan (1995) also deemed information collection as a fundamental
aspect ofMO, whereby information is related to the customers and competitors of the
organization and such information is then considered fundamental to strategy formulation and
strategy implementation. Thus, having MO could be considered synonymous to being “market
driven”(Slater and Narver,1994a), and being market driven necessitates having systemic flow of
information relating to customers and competitors. These notions are consistent with the findings
of the study, whereby a positive impact of MO is witnessed on KM. Subsequent analysis was
made, whereby all three dimensions ofMO(i.e. customer orientation, competitor orientation and
interfunctional coordination) were related to all three dimensions of KM(i.e. knowledge
acquisition, knowledge dissemination and responsiveness to knowledge).
5.1.1 Market Orientation and Knowledge Acquisition
All three dimensions ofMO were related to the first dimension of KM(i.e. knowledge
acquisition). According to Table 4.9 of the analysis chapter, the results indicated that customer
orientation had a positive but insignificant association with knowledge acquisition, competitor
orientation had a positive and significant association with knowledge acquisition and
interfunctional coordination also had a positive and significant association with knowledge
acquisition. The insignificant impact of customer orientation on knowledge acquisition is not that
surprising as, according to Connor (1999), MO is not just customer orientation. Slater and

174 | P a g e
Narver (1999) elaborated that customer-led strategies focus on meeting the expressed needs and
demands of the customers, while being market oriented is beyond that in the sense that market-
led strategies focus on identification and understanding the latent needs of customers, and then
the products or services that meet these latent needs and wants of the customers are developed.
Day (1999) also explained that actual MO considers customer inputs as superficial or short
sighted, and relying too much on customer input could lead an organization towards being
traditionalist and non-innovative. Ulwick (2002) further supported the view by explaining that
customers can express their needs in terms of what they have already experienced. This leads
them to be ignorant of innovations and related technological developments and improvements.
So, organizations relying solely on customer input might not survive in the long run because
ultimately modern organizations have to think not in terms of what a customer wants but what he
or she needs. So, customer input is deemed secondary in the context of the overall KM strategy
of the organization and thus, customer-related knowledge is not acquired fervently in strategic
context. Previous studies also found that MO does not explain a firm’s profitability (Dawes,
2000; Noble et al., 2002; Langerak, 2003). These findings are even more applicable to the SME
sector; Harris (2001) argued that MO has nothing to do with the SME sector.
Other dimensions of MO (i.e. competitor orientation and interfunctional coordination) were
found to have a significant and positive impact on knowledge acquisition indicating that
information related to both dimensions of MO are acquired as part of KM process of the SMEs
in the advertising segment of Pakistan. As the dynamics of the modern era are characterized by
intense competition, it is of imperative importance that intelligence related to competitors is
collected to buildCA and to remain differentiated from competitors. Slater and Narver (1993)

175 | P a g e
explained that firms with MO adopt a proactive approach and seek ways to differentiate
themselves from their competitors. Such proactivity and anticipatory behavior is considered one
of the core capabilities of market-oriented firms (Morgan &Strong, 1998). Considering the
opinion of Gounaris, Avlonitis and Papastathopoulou(2004), MO is deemed vital for success in
modern markets, which are characterized by constant change and competition. Day (1994) stated
that market-oriented firms are able to anticipate significant tends prior to their competitors and
respond accordingly. So, in this context, it is necessary to acquireinformation relating to market
trends and competitors for the overall KM system of the firms. Such information adds value to
strategy formulation and brings strategic context into the decision-making process of modern
organizations.
Lastly, interfunctional coordination enables the organization to work in a coherent manner,
whereby capabilities of different functional aspects of the organization are known and
communicated within the whole organization. According to Narver and Salter (1990), every
individual in an organization is part of the value chain of the organization and, thus, adds value
to the organization. As stated earlier, organizations function in an integrated manner, so it is the
shared responsibility of all individuals related to the organization that they contribute towards the
value-creating mechanism of the organization. So, there is a need to establish open
communication and interfunctional coordination among all the departments and related
individuals of the organization. Thus, information related to the capacity and capability of each
department is communicated and understood by the whole organization and an effective market
strategy is built relying on the strengths of the organization. Thus, interfunctional coordination is
deemed important for effective strategy formulation (Wind & Robertson, 1983), and information
176 | P a g e
relating to different functional aspects of the organization is acquired and included in theKM
system developed by the organization. Thus, Anderson (1982) stressed that marketing and
advocacy department should be sensitive to requirements of interfunctional coordination, so that
the organization may function in an integrated fashion. Thus, information relating to the
requirements of interfunctional coordination is actively acquired by the organization in the
contemporary context.
Overall, information relating to the competitors and interfunctional coordination are deemed
important to be acquired forthe KM process of SMEs in the advertising sector of Pakistan;
whereas information relating to customer orientation is deemed a secondary consideration in the
knowledge acquisition aspect of the KM process. By and large, firms that lead the market are
prone to development of market knowledge absorption capacity (Berghman et al., 2006), so
having MO necessitates knowledge absorption and utilization.
5.1.2 Market Orientation and Knowledge Dissemination
All three dimensions of MO were related to the second dimension of KM (i.e. knowledge
dissemination). According to Table 4.10 of the analysis chapter, it was found that all three
dimensions of MO(i.e. customer orientation, competitor orientation and interfunctional
coordination) were positively and significantly associated with knowledge dissemination aspect
of KM. Slater and Narver (1994b) argued that every individual working in an organization is
responsible for the creation of value, so it is imperative that all the information relating to the
MO, whether relating to customer, competitor or other external force must be disseminated in the
whole of the organization. Kohli and Jaworski (1990) also indicated that information
dissemination is part and parcel of being market oriented, thus knowledge related to customers
177 | P a g e
and competitors is disseminated across the organization in a systematic manner under the
paradigm of MO.
With regard to the positive impact of customer orientation on knowledge dissemination, it could
be argued that knowing the preferences, demands and needs of the customers and disseminating
this information to the whole of the organization is extremely important. Information on
customers and their preferences is not only important for strategy formulation at a strategic level,
but also for the provision of customer services at the functional and marketing level.For instance,
Vorhies et al. (1999) demonstrated that market-oriented firms are better at segmenting their
market, targeting the right customers, building relationships with customers and distributors and
promotional activities. All of these activities could not be performed without the right
information being disseminated to the right individuals. Baker and Sinkula (2002) indicated that
market orientation forces the organization to follow customer and innovate accordingly. Thus,
dissemination of information from marketing to product development is very important in this
regard. So, being customer oriented would lead to dissemination of the right information to the
right people in the organization and, thus, MO supports KM.
Subsequently, a positive impact of competitor orientation was also witnessed by the study on
knowledge dissemination. Competitors are considered a major market force and all the
innovations of the organization are compared in relation to its competitors. The ability of the
organization to succeed in the market heavily relies on its ability to differentiate itself from its
competitors, which is only possible if the organization keeps tracks of its competitors. So, having
competitor orientation leads towards knowledge dissemination in the organization as explained

178 | P a g e
by Gounaris et al. (2004): companies with MO formally collect and disseminate market-related
intelligence in a systematic manner and this information is then used for the purpose of strategic
planning and control. One of the major benefits of competitor-related information dissemination
is related to product and service development or innovation as stated by Vorhies and Harker
(2000): competitors are impeded by means of product development and innovation and different
market segments are targeted more effectively in this manner. Impeding a competitor’s moves is
only possible with the effective collection and dissemination of relevant information in the whole
of the organization. So, adoption of competitor orientation strengthens information-
dissemination mechanism within the organization, which is consistent with the findings of this
study.
Lastly, a positive impact of interfunctional coordination on knowledge dissemination was also
yielded by the results of the study. This relationship arose out of the natural requirements of
knowledge dissemination;if effective dissemination of knowledge is to happen, interfunctional
coordination is key. As stated earlier,a competitor’s move could be impeded or responded to by
means of better product development(Vorhies& Harker, 2000), whereby information on the
requirements of the customer and perspective moves of the competitors are to be possessed and
maintained by marketing department and products are to be developed by R&D department.
Thus, interfunctional or interdepartmental coordination is necessary to make a product launch
successful in relation to the competitor. Slater and Narver (2000) in this regard explained that
integration of different resources possessed by the organization along with the inter-coordination
of personnel of the organization is necessary to create value. Production and engineering staff in
any manufacturing organization must meet regularly to discuss ideas, their capabilities and

179 | P a g e
limitations. This enables the staff of different departments to understand limitations and leverage
strengths of each other (Slater & Narver, 1994b). Thus, interfunctional or interdepartmental
coordination is the key to knowledge dissemination within the organization and this is consistent
with the findings of this study.
Overall, MO including customer orientation, competitor orientation and interfunctional
coordination has a positive influence on knowledge dissemination and this is also true for the
SME segment of the advertising industry in Pakistan.
5.1.3 Market Orientation and Responsiveness to Knowledge
All three dimensions of MO (i.e. customer orientation, competitor orientation and interfunctional
coordination) showed a positive and significant impact on the responsiveness to knowledge
aspect of KM referred to in Table 4.8 of the analysis chapter. Hunt and Morgan (1995) in this
regard elaborated that MO is about using the collective knowledge in strategy formulation,
implementation and related control. Being more market orientated leads towards effective
exploitation and responsivenessto knowledge acquired from different sources and disseminated
across the organization. Kohli and Jaworski(1990) explained that a market-oriented firm should
be able to use acquired and disseminated information in an effective manner. Thus, MO makes
an organization more responsive to knowledge.
Firstly, customer orientation of the MO yielded a positive impact on responsiveness to
knowledge. This is a quite obvious relationship because customer satisfaction is considered key
to long-term survival and in this regard creating value for the customer is the main thing. In order
to create this value, marketing staff is encouraged to spend time with their customers, thus
180 | P a g e
knowledge is gained from the customers and this knowledge is then used to deliver better
customer value (Slater & Narver, 1994b). Thus, responsiveness to knowledge is essentialas it
represents knowledge in action and through this process value is created (Deshpande et al.,
1993). According to Day (1994), modern organizations have to respond to the market and, thus,
in order to become more market oriented, they have to use knowledge stock and build
differentiated capabilities. So, better responsiveness to knowledge is enabled by focusing on
customer orientation, which basically is uncovering and shaping the latent needs of the
customers and serving the customers in a way that is beyond their expectation (Jaworski et al.,
2000). So, innovative products and services are developed using knowledge acquired and
disseminated by the organization and, thus, the latent needs of the customers are fulfilled. Barker
and Sinkula (2002) also suggested that MO paves the way to incremental innovation, which
basically is knowledge in action. Overall, customer orientation not only provokes knowledge
acquisition and dissemination, but also forces the organization to be knowledge responsive.
Secondly, competitor orientation was also found to exert a positive and significant impact on
responsiveness to knowledge. Competition in the industry has transformed the position of
competitor to an important information source. In contemporary context, a firm has to get
familiar with the nature of competition, to have intelligence on the main competitors of the
organization, as, according to Porter (1979), competitors are a main source of ideas, which
enable the firm to have a better understanding of the market.Thus, this intelligence could help an
organization to differentiate itself from its competitors (Slater & Narver, 1993). The same
notions are provided by Day (1994), who suggested that the ability of an organization to lead
actions in the marketplace is provoked by the competitor’s orientation and this ability is
181 | P a g e
developed out of exploitation of the market and competitor’s knowledge. So, having
competitor’s orientation provokes knowledge responsiveness of the organization. Day (1994)
further elaborated that timely acquisition and sharing of information is essential in this regard, so
that the information can be exploited and responded to in an effective manner. This ability of
exploitation of information relating to the competitors of the organization also enhances
profitability of the organization (Dawes, 2000). Thus, competitor orientation forces the
organization to respond to knowledge in an efficient and effective manner.
Lastly, interfunctional coordination also had a positive impact on the responsiveness to
knowledge. Interfunctional coordination enablesan organization to work in an integrated manner
and the organization is better able to respond to change in the external environment in an
effective manner. Thus, interfunctional coordination enhances the knowledge responsiveness of
an organization and value is created for the customer (Slater & Narver, 2000). Narver and Slater
(1990) also explained that integrated and coordinated efforts enable the organization to create
superior value for the customers of the organization. All of these coordinated and integrated
activities enable the organization to exploit knowledge in a systematic manner and thus
advantages of marketing synergy, product improvements, service quality and team efforts are
realized (Vorhies& Harker, 2000). So, interfunctional coordination within the organization
improves the organizational responsiveness to knowledge, which is consistent with the findings
of this study.

182 | P a g e
Overall, the dimensions of MO (i.e. customer orientation, competitor’s orientation and
interfunctional coordination) have a positive impact on the responsiveness to knowledge aspect
of KM.
5.2 Learning Orientation and Knowledge Management
This part of the discussion provides the results on the impact of LO as represented by
commitment to learning, shared vision, open-mindedness and creativity on different dimensions
of KM (i.e.knowledge acquisition, knowledge dissemination and responsiveness to knowledge).
Four different regressions were run in this regard.The first regression assessed the overall impact
of LO on overall KM. The subsequent three regressions relate dimensions of LO with the three
dimensions of KM. The second regression relates all four dimensions of LO (i.e. commitment to
learning, shared vision, open-mindedness creativity) with knowledge acquisition. The third
regression relates all four dimensions of LO with knowledge dissemination and the last
regression assesses the impact of all four dimensions of LO on responsiveness to knowledge.
Overall, according to Table 4.18 of analysis chapterLO had a positive and strong impact on KM.
This orientation was found to predict more than 53.5% of variation in KM. This explanatory
power is quite high, indicating that LO explains KM in quite a strong manner. Sinkula et al.
(1997) supported this by stating that LO provokes a learning culture and other specific values
that enable an organization to build and utilize knowledge in an effective manner. Atuahene-
Gima et al. (2005) defined LOas a concept that incorporates the preferences of the top
management of an organization for the creation of a challenging work environment, finding out
new ways to improve things, curiosity, learning enjoyment and new skill development.
Calantone et al. (2002) on the other hand, explained that a learning-oriented organization has
control over the type of information acquired, analyzed and disseminated. Senge (1990) in this

183 | P a g e
regard stated that LO embeds learning into the culture of an organization, where people in the
organization: consider cause and effect relationships; criticize and question old routines, beliefs
and assumptions; and relate everything to the same purpose. This could further stimulate learning
in the organization and knowledge is developed, disseminated and utilized in a proactive manner.
Thus, LO in an organization provides much of the needed environment for the evolution and
establishment of KM.
The following discussion provides assessments of the impacts of all four dimensions of LO on
all three dimensions of KM.
5.2.1 Learning Orientation and Knowledge Acquisition
Knowledge acquisition is the core process from where learning takes its roots. No learning could
be sustained without knowledge. Thus, organizations having LO are sensitive to the collection of
knowledge from multiple sources, both from inside and outside the organization.
Firstly, according to Table 4.18 of analysis chapter, commitment to learning showed a positive
and significant impact on knowledge acquisition in the SMEs of the advertising segment of
Pakistan. This relationship could be expected as learning takes place with the help of
accumulated knowledge and an organization having LO would collect and acquire relevant
information and, thus, commitment to learning as a dimension of LO yielded a positive and
significant impact on knowledge acquisition. Commitment to learning is considered an important
consideration in the paradigm of LO. According to Slater and Narver (1995), commitment to
learning is a precondition of organizational learning and it creates a necessary environment to
foster learning within an organization. They further stated that the support of managers is
necessary to foster learning, and information acquisition is the first step towards employee
184 | P a g e
learning. Thus, managers should support employees in their pursuit of knowledge during
company time (Slater & Narver, 1995). Thus, a learning organization is an organization where
people systematically acquire, create and transfer knowledge and modify their behavior in
accordance with the new knowledge acquired or created (Garvin, 1993). So, commitment to
learning is deemed necessary in the context of knowledge acquisition, commitment would
provoke knowledge acquisition and thus learning would happen.
Secondly, shared vision as a dimension of LO also yielded a positive and significant impact on
knowledge acquisition. Shared vision relates to the whole of the organization, where the whole
of the organization considers learning important and strives for it (Sinkula et al., 1997). Shared
vision is very important for knowledge acquisition initiatives whereby the whole of the
organization systematically takes part in knowledge acquisition in an integrated manner. This
knowledge is then channelized within the whole organization and relevant decisions are made.
According to Sinkula et al. (1997), without a shared vision of learning, members of an
organization take a haphazard approach to knowledge acquisition and, thus, no systemic KM
could be sustained in the organization. Thus, integration of a knowledge acquisition initiative is
supported by shared vision. So, by and large, shared vision is necessary to support knowledge
acquisition initiatives in an organization, without which KM could not be sustained.
Thirdly, open-mindedness also yielded a positive relationship with knowledge acquisition. Open-
mindedness represents the capacity of individuals to accept new information, knowledge and
ideas, and discard old ones. So, open-mindedness could be related to the unlearning aspect of
LO. Brown (1991) deemed unlearning important in the changing environment, he quoted a chief

185 | P a g e
scientist of Xerox, who explained that our understanding of the phenomenon depends upon
certain assumptions that are rooted into past experiences and knowledge. As the phenomenon
changes, the hard earned knowledge becomes obsolete, so do the assumptions. Thus, open-
mindedness is about unlearning old knowledge and acquiring new knowledge. Day (1994)
supported the notion; Day (1994) stated that inside-out mindset could be problematicbecause
individuals in an organization think they have superior knowledge and ignore new information
outside the organization. This would make such organizations stagnant and such organizations
are unable to acquire new knowledge and assess new trends in the marketplace (Yilmaz et al.,
2005); all of this is due to closed mindedness. So, open-mindedness enables an organization to
take new knowledge input and accept new ideas (Sinkula et al., 1997). Wilson (1995) also
deemed cognitive capacity important for the acquisition of new information and to process it. So,
open-mindedness is deemed important for the acquisition of knowledge which is consistent with
the findings of this study.
Lastly, creativity was found to have an insignificant impact on knowledge acquisition. This
entails that mostknowledge acquisition is done with traditional ways. Being more creative does
not guarantee more acquisition of knowledge. Creativity might be important atlater stages of KM
when knowledge is disseminated and analyzed. Thus, better knowledge acquisition might
provoke better learning and more learning might lead to creativity and, ultimately, towards
improved performance (Hult et al., 2004). Weerawardena et al. (2006) also elaborated that better
organizational learning leads towards a higher degree of innovation. Thus, innovation does not
lead towards better knowledge acquisition, but learning could provoke innovation and creativity.

186 | P a g e
Overall, LO dimensions of commitment to learning, shared vision and open-mindedness were
found to have a positive and significant link with information acquisition, while the LO
dimension of creativity did not yield any significant impact on knowledge acquisition.
5.2.2 Learning Orientation and Knowledge Dissemination
It was found that only the dimensions of shared vision and open-mindedness had a significant
impact on knowledge dissemination aspect of KM and this impact was positive. The dimensions
of commitment to learning and creativity on the other hand yielded an insignificant relationship
with knowledge dissemination.
Firstly, according to Table 4.13 of the analysis chapter, commitment to learning yielded an
insignificant relationship with knowledge dissemination in the advertising segment of SME in
Pakistan. This might be due to the reluctance of people to share knowledge with each other.
Knowledge dissemination is related to knowledge sharing and people in the professional
environment are reluctant to share knowledge with colleagues. This might lead towards a
hindered knowledge dissemination function. Learning in such a scenario is considered an
individual phenomenon and people even if committed to learn are not interested in knowledge
sharing and knowledge dissemination. So, that might be the reason for insignificant impact of
commitment to learning on knowledge dissemination.
Secondly, shared vision yielded a positive and significant impact on knowledge dissemination of
the advertising segment of the SME sector in Pakistan. This is an obvious relationship as shared
vision provides a collaborative view of the employee of the organization to learning (Sinkula et
al., 1997). So, organizations with LO have considerable influence over information collection,
information sharing and analysis of the information (Calantone et al., 2002). Senge (1990)

187 | P a g e
elaborated that employees of organizations who have a shared vision also share a sense of
purpose and direction, thus information dissemination is influenced by the shared vision. Shared
vision instills trust among individuals and this trust enables the members of an organization to
share information in an open manner. According to Kim (1998), LO provides a channel of
learning to individuals within the organization and members of the organization learn to share
and utilize knowledge. Celucha et al. (2002) evinced that organizationthat scored high in
LOestablisha better information system, which helps to disseminate information among
individuals. So, organizations high in LO and having a shared vision of it, have considerable
influence on the knowledge sharing or knowledge dissemination function of KM system.
Thirdly, open-mindedness also yielded a significant and positive beta for knowledge
dissemination. Again being open-minded is important for better information dissemination. As
Sinkula et al. (1997) related, being open-minded means that individuals welcome new ideas and
float such ideas with each other. So, open-mindedness directly relates to knowledge
dissemination. Further, Sinkula (2002) opined that unlearning is a critical aspect of being open-
minded, whereby unlearning is a process of replacing obsolete knowledge with new knowledge,
which is only possible if new knowledge is floated among individuals. So, unlearning as a part of
being open-mindedencourages effective knowledge dissemination within the organization.
Yilmaz et al. (2005) in this regard stated that sometimes firms with higher LO assume a self-
centered view of the market and other external forces, because such firms are busy in the
creation of knowledge inside the organization. Such organizations do not deem external
knowledge relating to customer needs and market trends to be very important and this
undermines the importance of long-term sustainability and trends. These organizations fail to

188 | P a g e
accept new ideas in an open manner and, thus, lack of open-mindedness hinders their ability to
float information to the core of organization and their knowledge dissemination ability remains
stressed. So, there is a need to remain open-minded in order to float and disseminate all the
relevant information and knowledge in the organization in an effective manner. Such are also the
propositions of this study for the SME segment of the advertising industry in Pakistan.
Lastly, creativity failed to establish any significant link with knowledge dissemination in the
adverting segment of SME industry in Pakistan. This indicates that knowledge dissemination is a
simple process, which is not influenced by the creativity of the organization and creativity might
only be required while analyzing new knowledge and making decisions pertaining to this
knowledge. Thus, knowledge flow should be established in the organization in a systematic but
standardized manner through which knowledge must be acquired from various sources and
disseminated to concerned individuals or processes within an organization. This view is
consistent with Sinkula et al. (1997), who reported that, with time, organizations are able to
make sense of the dynamics of their market. So, with time,standardized rules pertaining to the
processing of information are developed.Further, creativity might not be the antecedent of
knowledge dissemination, but rather be dependent on it. Weerawardena et al. (2006) found that
organizations which have relational learning capabilities predict innovation and this ultimately
leads towards improved organizational performance. So, creativity does not influence the
knowledge dissemination ability of an organization, as creativity normally is required to perform
non-routine and complex tasks. Such are the propositions of the study.

189 | P a g e
Overall, it was found that shared vision and open-mindedness as dimension ofLO have a positive
and significant influence onthe knowledge dissemination dimension of KM, while this influence
was insignificant for LO dimensions of commitment to learning and creativity.
5.2.3 Learning Orientation and Responsiveness to Knowledge
According to Table 4.11 of the analysis chapter, all four dimensions of LO were analyzed in
relation to the third dimension of KM (i.e. responsiveness to knowledge). It was found that all
four dimensions ofLO (i.e. commitment to learning, shared vision, open-mindedness and
creativity) had a positive and significant impact on the responsiveness to knowledge dimension
of KM, whereby LO is considered antecedent to knowledge creation and learning process in an
organization. This orientation also determines channels of organization’s learning and
knowledge sharing and ultimately sets the mode of knowledge conversion (Kim, 1998). This
enables the organization to use and respond to knowledge in hand in an effective manner. So, LO
harnesses the ability of the organization to analyze, utilize and respond to knowledge that might
be developed, processed or processed by the organization.
Firstly, a positive and significant impact of first dimension of LO (i.e. commitment to learning)
was witnessed on the third dimension of KM (i.e. responsiveness to knowledge). According to
Salter and Narver (1995), commitment to learning is a prerequisite of organizational learning and
such learning has the ability to create value for the customers of the organization (Santos-
Vijande et al., 2005). Organizational learning also has the ability to create new knowledge and
bring a positive change to the behavior of the members of the organization. Such learning further
provokes the ability of the organization to make innovations (Slater & Narver, 1995), and
enables the organization to respond to the changing nature of external environment. By and large
LO has the ability to sustain profitability of the organization (Farrell & Oczkowski, 2002; Baker

190 | P a g e
& Sinkula, 1999b, 2002) and other positive employee behaviors like organizational commitment
(Farrell, 1999), innovation ability (Farrell, 1999; Hult et al., 2004; Weerawardena et al.), market-
related behaviors and capabilities (Santos-Vijande et al., 2005; Celucha et al., 2002). Putting it
all together, organization learning is provoked by commitment to learning, which in turn
enhances the responsiveness of the organization to knowledge produced within the organization
or from external environment (Day, 1994). So, commitment to learning provokes responsiveness
of the organization to knowledge, which is also the finding of the study.
Secondly, shared vision as a dimension of organization learning also yielded a positive
relationship with responsiveness to knowledge. Slater and Narver (1995) in this regard
elaborated that shared vision lays the foundations of a learning organization and such
organizations use their learning to create customer value in an effective manner. The conception
of shared vision is the vision of knowledge, which gives necessary meaning to the routine
activities and tasks of the organization. It also defines the nature of knowledge that an
organization should seek or attempt to create (Day, 1994). Thus, shared vision defines the set of
knowledge skills that an organization seeks and exploits to create value. Knowledge exploitation
provides the organization with the necessary ability to respond to changes in the external
environment and fosters sustainability. The notions of shared vision set a company’s directions,
create a common conception of value and educate employees as to how their role is chipped up
with the broader objectives of the organization (Nicholls-Nixxon, 2005). Thus, shared vision
gives life to the objectives of the organization and channelizes knowledge resources of the
organization in the right direction. According to Senge (1990), shared values are embedded into
the culture or the organization and these values justify the purpose of the organization and

191 | P a g e
motivate the employees to work towards a common goal and create value. So, shared vision
integrates the efforts of the distant units of the organization, knowledge in this way is exploited
in an integrated manner, and the knowledge responsiveness of the organization not only
increases but also becomes more effective.
Thirdly, open-mindedness was also found to have a positive impact on the responsiveness to
knowledge. Day (1994) in this regard related that organizations that are characterized by open-
mindedness, mutually informed interpretations and synergistic knowledge dissemination are
better able to anticipate significant trends in the market and have the ability to respond to such
events in a timely manner. This enables such organizations to supersede their competitors in
retaining and attracting and exploit the opportunities in the external environment. Thus, such
organizations are more responsive and are able to learn, unlearn and relearn in accordance with
the demands of the environment. Open-mindedness breeds new ideas (Sinkula et al., 1997),
which again provoke responsiveness of the organization in relation to the acquired, disseminated
and processed knowledge. Open-mindedness is also considered a core aspect ofLO, which
coupled with customer and technology orientation helps to develop innovative products and
services (Salavou, 2005). This open-mindedness also enables the firm to continuously learn and
anticipate changes in the market (Day, 1994). Day (1994) also argued that open-mindedness
prevents the organization from falling into the trap ofinside-out orientation, as individuals assess
the information flow from external environment in an open manner and do not rely on their own
projections of outside environment. Thus, open-mindedness not only provokes the idea
generation capacity of the organization, but also makes the responsiveness to knowledge of the
organization more rational and effective.

192 | P a g e
Lastly, creativity was also found to have a positive impact on responsiveness to knowledge.
Creativity is about thinking out of the box and devising unique solutions to problems or needs
and these solutions might be in the shape of new products, services, processes or technologies
(Lumpkin & Dess, 2001). Creativity is about building a unique CA.Rationalism in this context
stresses the need to make informed decisions that are based on solid information or on
knowledge possessed and processed by the organization. According to Robinson and
Pearce(1994) and Matthews(2002), small firms represent the creative chunk of industry as they
can afford to be more flexible, adaptive and responsive in relation to the external environment.
Thus, creativity enables such organization to exploit their knowledge in a unique manner and
build a CA. Creativity also represents the core of learning; Pisano (1994) in this regard iterated
that despite having stock of knowledge, it would be difficult to build competencies and CA
without learning and creativity. Creativity provokes innovation (Lucked, 2003), which in turn
ensures survival of the business organization in a competitive and hostile environment.
Creatively realized by utilizing knowledge processesof the organization takes the form of
innovation and innovation has to be marketable, if the company is to sustain performance in the
long run (Hult et al., 2004). Thus, creativity enables the organization to respond to the acquired
and disseminated knowledge in a better way and develop innovative products, services,
technologies and processes in order to create value for the customers of the organization.
Thus, overall all four dimensions of LO exerted a positive and significant impact on responsive
to knowledge. So, in order to better utilize the knowledge resources of an organization,

193 | P a g e
organizations have to rely on LO which is represented by commitment to learning, shared vision,
open-mindedness and creativity.
5.3 Entrepreneurial Orientation and Knowledge Management
The third part of discussion provides the discussion on the results of the impact of EO, as
represented by proactive, competitive and innovative dimensions, on KM, as represented by
dimensions of knowledge acquisition, knowledge dissemination and responsiveness to
knowledge. A total of four regressions were run in this regard whereby the first one analyzes the
impact of overall EO on overall management. The second regression relates all three dimensions
ofEO with the first dimension of KM (i.e. knowledge acquisition). The third regression considers
the impact of all three dimensions of EO on second dimension of KM (i.e. knowledge
dissemination) and lastly, the fourth regression provides analysis of the impact of all three
dimensions of EO on responsiveness to knowledge.
According to Table 4.19 of the analysis chapter,EO was also found to have a significant and
positive impact on KM in the advertisement segment of SME sector of Pakistan. According to
Morris and Paul (1987), EO is characterized by behaviors like taking calculated risk, being
proactive and being innovative, and all of these behaviors could only be sustained by means of
gathering and utilizing information and KM in the long run. Covin and Slevin (1989) in this
regard stated that an entrepreneur has to work with various stakeholders in the external
environment like customers, distributors or competitors and in the internal environment like
employees. Management of these stakeholders is a primary concern of the entrepreneur; while
interacting with these stakeholders, an entrepreneur encountersa flow of information related to
the market, customers and trends. An entrepreneur has to absorb and process this information in
order to remain competitive in the marketplace.Van de Ven, Hudson and Schroeder (1984) also

194 | P a g e
found evidence in this regard and stated that successful entrepreneurs have high external
orientation and they seek information from the external environment pertaining to competitors,
market niches, potential customers and their involvement in order to develop successful business
plans.Thus, EO also provokes knowledge capabilities of the firm, whereby the focus is to obtain,
disseminate and process information, which could be exploited for the sustenance of the CA of
the organization in the long run.
5.3.1 Entrepreneurial Orientation and Knowledge Acquisition
All three dimensions of EO (i.e. proactive, competitive and innovative) were analyzed for their
impact on knowledge acquisition. According to Table 4.16 of the analysis chapter,a positive
impact of all three dimensions ofEO on knowledge acquisition was witnessed for the advertising
segment of SME sector of Pakistan. Knowledge acquisition has always been at the forefront of
entrepreneurship. An entrepreneur has to take risks and make informed decisions in this regard.
Narver and Salter (1990) indicated that an entrepreneur learns through experimentation and thus
most of the knowledge acquired by an entrepreneur is generated in an arbitrary manner.
The first dimension of EO is proactivity, which yielded a positive impact on the acquisition of
knowledge. According to Narver, Slater and MacLachlan (2004), proactive MO focuses on
identification of latent needs of the customers and taking initiatives to satisfy these needs. Thus,
information acquisition in this context remains a dynamic process, which is complex and
arbitrary in nature. Being proactive is about leading the customer and telling the customers as to
what they might need. Hunt and Lumbe (2000) stated that in order to acquire relevant
information, entrepreneurs who have a proactive MO should observe customer behavior in a
close manner to make assessments on the problems of their customers. They further explained
that such orientation requires superior processes and skills, and these skills and processes are
195 | P a g e
subtle in nature and cannot be imitated by competitors and, thus, remain a sustainable CA for the
organization. Proactive orientation focuses on the outside-in process, whereby information
acquisition is deemed very important as all of the idea generation and product or service
development must remain within the context of customer needs. Thus, being proactive is related
to being future oriented and in this regard knowledge is the only resourcethat could help the
organization to steer through the uncertainties of the future. So, proactive EO builds and
develops knowledge base and uses that knowledge to create value for its customers.
Secondly, competitive EO also yielded a positive impact on knowledge acquisition in the
advertisement segment of SME sector. Under this kind of orientation, an organization has to
differentiate itself from its competitors. Slater and Narver (1993) in this regard elaborated that in
the modern era of competition, it is of imperative importance that an organization creates a
differentiation edge over its competitors and all this could be done by acquisition of competitor
intelligence. Over time, the need for differentiation has increased as modern markets are
characterized by constant change and intense competition (Gounaris et al., 2004). Day (1994)
also elaborated that firms that have a better competitive position seek and create a knowledge
base, which enables them to anticipate future trends prior to their competitors. So, knowledge
acquisition relating to competitors is very important to anticipate and respond to the competitor’s
move. Thus, competitive EO builds knowledge acquisition dimension of KM.
Lastly, innovative EO also yielded a positive impact on knowledge acquisition. Innovative
orientation is heavily dependent on the ability of an organization to generate and implement new
ideas. Such idea generation heavily relies on knowledge stock and intellectual capabilities of the
196 | P a g e
organization. According to Slater and Narver(1995) and Farrell (1999), learning is essential to
innovativeness and, thus, it is of imperative importance that organizations create a knowledge
base to provoke learning.Hult et al. (2004) named innovation as the missing link between
learning and organizational performance. Lumpkin and Dess(2001) stated that innovative EO
seeks to find novel and unusual solutions to problems and this innovation ability is harnessed by
organization learning. So, innovative entrepreneurial provokes knowledge accumulation in an
organization to sustain innovation ability in the long run.
Overall, all three aspects ofEO (i.e. proactive, competitive and innovative) have a positive
impact on knowledge acquisition aspect of KM. Thus, EO seeks to build knowledge through
knowledge acquisition process.
5.3.2 Entrepreneurial Orientation and Knowledge Dissemination
This part of the discussion provides an overview of the analysis conducted to establish
relationships between all three dimensions of EO and knowledge dissemination. According to
Table 4.15 of the analysis chapter, all three dimensions of EO (i.e. proactive, competitive and
innovative) had a positive and significant impact on knowledge dissemination. Nonaka and
Takeuchi (1995) explained that real KM starts with knowledge sharing among different members
or units of an organization. In order to succeed in the marketplace, an entrepreneur has to build
an effective mechanism of flow of knowledge within the organization. This makes effective
dissemination of knowledgea very important aspect of the overall KM system and
entrepreneurial success.

197 | P a g e
The first aspect ofEO is proactivity, which yielded a positive impact on knowledge
dissemination. Proactive orientation enables an organization to anticipate future trends and
customer needs and enables the firm to harvest first mover’s advantage. Lumpkin and Dess
(2001) stated that proactive firms are pioneers, as they know how to capitalize on new
opportunities and trends. All this happens if the firm possesses a substantial amount of
intellectual capital and a good flow of knowledge among all of its functional units. This enables
the organization to respond to new market trends in an integrated manner (Narver & Slater,
1990). Thus, organizations that have a proactive orientation tend to establish an effective
knowledge dissemination mechanism.
The second aspect of EO is competitive EO, which also yielded a positive impact on knowledge
dissemination. Lumpkin and Dess (2001) stated that being competitive is related to making an
effort to outperform competitors in the industry. An organization needs to aggressively respond
to the external environment or to the move of a competitor in order to remain in the competition.
Improvement of the competitive position of the company is sought by means of various
strategies like KM. It is quite important that market-related information and intelligence is shared
in the whole organization in a systemic manner, so that this information could then be utilized
for strategic planning and control purposes (Gounaris et al., 2004). Vorhies and Harker (2000)
explained that knowledge dissemination among all the functional areas of the organization
enables the organization to take product development initiatives more quickly than their
competitors and this hinders the ability of the competitor to supersede product development
initiatives by the organization.

198 | P a g e
Lastly, entrepreneurial innovative orientation also had a positive impact on knowledge
dissemination. Entrepreneurial innovative orientation is deemed necessary for SMEs to provide
unique and novel solutions to the problems under consideration (Lumpkin & Dess, 1996). Slater
and Narver(1995) explained that innovativeness is provoked by means of organization learning,
which is affected by the knowledge-sharing capabilities of the organization. Thus, organizations
that have an innovative orientation build a knowledge-sharing culture within the organization.
This is also consistent with the findings of this study.
Overall, all three dimensions ofEO yielded a positive impact on the knowledge dissemination
orientation of KM. This indicates that EO helps to build knowledge dissemination mechanism in
the advertising segment of Pakistani industry.
5.3.3 Entrepreneurial Orientation and Responsiveness to Knowledge
All three dimensions of EO were related to responsiveness to knowledge. According to Table
4.14 of the analysis chapter, all of the three dimensions of EO (i.e. proactive, competitive and
innovative) were found to have a positive impact on the responsiveness to knowledge aspect of
KM. This positive impact on the responsiveness to knowledge enables the organization to
develop breakthrough products and services or locate niches, whose needs were previously
unmet (Hamel& Prahalad, 1994). Entrepreneurial initiatives, such as exploiting knowledge in an
effective manner, could introduce innovative products and services, tap into fresh markets,
innovate production process or initiate industrial reorganization(Schumpeter, 1934). Thus, EO is
about exploitation of knowledge and enhancing responsiveness of knowledge.

199 | P a g e
The first dimension ofEO is proactivity. Being proactive is all about exploitation of knowledge at
the appropriate time prior to anyone else (Lumpkin & Dess, 2001).So, proactivity enables the
organization to exploit knowledge resources in a manner that makes the organization more
responsive to a slight change in the external environment. This enables the organization to take a
strategic position well before time and all future threats are neutralized prior to their emergence
(Lumpkin & Dess, 2001). So, by and large, proactive EO has considerable influence over the
responsiveness and exploitation of knowledge possessed by an organization.
The second aspect of EO is being competitive, which also was found to have an association with
knowledge responsiveness. This aspect is about beating the competition and strengthening the
competitive position of the firm in the market (Lumpkin & Dess, 2001). Porter (1979) explained
that knowledge should be assessed in relation to competitors and competitors are sometimes
sources of innovative ideas. Better knowledge responsiveness could help an organization to
differentiate itself from competitors (Slater &Narver, 1993). The same notions were provided by
Day (1994), who suggested that the ability of an organization to lead actions in the marketplace
is provoked by the competitor’s orientation and this ability is developed out of exploitation of the
market and competitor’s knowledge. So, having entrepreneurial competitor orientation provokes
knowledge responsiveness of the organization. It was further suggested that timely acquisition
and sharing of information is essential in this regard, so that the information could be exploited
and responded to in an effective manner. Thus, competitive EO provokes knowledge
responsiveness in an organization.
200 | P a g e
Lastly, innovative EO also had a positive relationship with responsiveness to knowledge.
According to Lumpkin and Dess (2001), innovativeness in an organization is represented by
seeking out new or novel solutions, making breakthrough improvements and advancing new
processes or technologies. Innovation is all about learning exploitation. Learning, on the other
hand, is provided by and supported by knowledge sharing and knowledge conversion (Kim,
1988). Exploitation of knowledge thus supports innovations in the organization, which in turn
enable the organization to attend to market needs, ensure competitiveness, pursue new projects
and take more risk (Tzokas et al., 2001). Thus, if an organization is to adopt innovative EO, it
needs to exploit knowledge resources. This leads towards a positive impact of innovative EO on
responsiveness to knowledge.
Overall, all three dimensions of EO (i.e. proactivity, competitiveness and innovativeness) had a
positive impact on responsiveness to knowledge. Thus, EO provokes responsiveness to
knowledge.
201 | P a g e
Chapter 6
Conclusion and Recommendations
This chapter of the thesis concludes the research and provides implications and recommendations
of the study. Lastly, the limitations of the research and directions for future research
aredescribed.
6.1 Conclusion
There has been a lot of debate on the value of the SME sector in the economic context of any
country. This value is further increased in the context of developing economies like Pakistan,
where the economy remains sluggish and most annual economic targets cannot be achieved. The
sector is said to have the ability to provoke economic growth, create employment opportunities,
increase exports and raise living standards of the people living in the country. The problem with
the SME sector is that it has quite high failure rates and people living in small economies are
reluctant to take entrepreneurial initiatives in this context. However, small businesses are
witnessing growth in many segments. One such segment is advertising.
There has been a shift from production-based firms to service-based firms and due to an increase
in competition it is difficult to increase or even retain market share without significant
advertisements and promotion. Thus, over the last decade,the advertisingindustry has witnessed a
steady growth in Pakistan. The growth was further provoked by the development of new media,
growth of private media channels, internet boom and a consumption-based economy. Further,
advertising is considered one of the main segments of the corporate world, as the success of
many businesses is dependent on the utilization of effective marketing services and taking other
marketing initiatives. There still is a need to develop advertising and ensure the sustainability of
this sector in any way possible.

202 | P a g e
The success of any organization in the modern era has become dependent on the creation, storage
and utilization of knowledge, which is considered an invisible weapon in the modern quest of
development of sustainable CA. The development of a KM system is considered one of the main
ways to organizational success. Adoption of some business orientation is also necessary for
strategic alignment of the business. Business orientation clarifies the strategic route of the
organization as to how it would compete and build its CA. Different business orientations might
have different outcomes on the development and exploitation of the organization’s knowledge.
This study assesses the impact of different business orientations on KM. The business
orientations considered in this study are MO, LO and EO and their impact is assessed on the
development and management of knowledge within advertising segment of SMEs in Pakistan,
whereby KM is measured using three dimensions: knowledge acquisition, knowledge
dissemination and responsiveness to knowledge.
The study found a significant and positive impact of all three business orientations on KM,
whereby LO explained the highest variance in KM, followed by MO and EO. All three
orientations were further subdivided into their subdimensions and the impact of these
subdimensions was also sought on each component of KM.
The first business orientation of MOhas subdimensions of customer orientation, competitor
orientation and interfunctional coordination. Two of three dimensions (i.e. competitor orientation
and interfunctional coordination) were found to have a significant impact on knowledge

203 | P a g e
acquisition aspect of KM, while customer orientation was found to have an insignificant impact
on knowledge acquisition aspect of KM. This indicates that competitor orientation provokes
knowledge acquisition relating to market and competitors and interfunctional coordination also
provoked knowledge acquisition, while customer orientation did not have an impact
onknowledge acquisition. This is due to the inability of the customer to translate their need in an
appropriate manner. Success in the modern era of business is dependent upon innovation and
assessment of needs customers are unable to express. Thus, customer orientation does not
provoke knowledge acquisition. Further, all three subdimensions ofMO yielded a significant
impact on both knowledge dissemination and responsiveness to knowledge. This indicates that
MO provokes KM within an organization, but customer orientation could hinder an
organization’s ability to acquire new knowledge from the market.
The second business orientation considered was LO, which has subdimensions of commitment to
learning, shared vision, open-mindedness and creativity. It was found that only subdimensions of
commitment to learning, shared vision and open-mindedness explained knowledge acquisition in
firms, while the subdimension of creativity had no impact on knowledge acquisition. This
indicates that knowledge acquisition requires commitment to KM, shared vision and open-
mindedness, whereas creativity is not required to acquire new knowledge from the market. This
indicates that the procedure to acquire knowledge is straightforward and no complexity is
involved, that is why creativity is not part ofknowledge acquisition. Further, only the
subdimensions of shared vision and open-mindedness were found to have a significant
relationship with knowledge dissemination, while subdimensions of commitment to learning and
creativity were not related to knowledge dissemination. This again indicates that knowledge

204 | P a g e
dissemination is a simple process and no complexity is involved and commitment might not be
able to play a role in it. However, shared vision and open-mindedness were found to have
considerable influence on dissemination of knowledge in the advertising firms. Lastly, all four
subdimensions of LO were found to have a significant impact on responsiveness to knowledge
which is a knowledge exploitation dimension. This seems a more complex process, which
requires top-down commitment and integrated efforts.
Lastly, EO hassubdimensions of proactivity, competitiveness and innovativeness, which were
related to all three aspects of KM (i.e. knowledge acquisition, knowledge dissemination and
responsiveness to knowledge). It was found that all three subdimensions of EO had a significant
relationship with all three aspects of KM. This indicates that EO on the whole explains KM in a
complete manner.
This study provides evidence of the differing requirements of KM considering different business
orientations. It doesnot mean that the importance of any of the business orientations or KM
process is undermined.It merely indicates the manner through which each business orientation
helps to build and exploit knowledge in an effective manner, which might be instrumental to
organizational success. SMEs have to build different competencies and different business
orientations might be required in different scenarios. The evidence shows that all of the business
orientations support KM in one way or another. KM is deemed instrumental to the success of
SMEs in the advertisement segment. Following are recommendations of the study.

205 | P a g e
6.2 Recommendations
The study proves that all contemporary business orientations support development of KM system
in advertisement segment of SMEs. The following are specific recommendations forKM and the
adoption of appropriate business orientations for the advertising segment of SMEs in Pakistan:
- KM is an important consideration in the context of SME strategic planning and
operations. SMEs in advertising segment should bring KM to the core of their strategy.
This would enable these firms to create knowledge resources, innovate and remain
competitive even in a hostile business environment.
- The strategic context is very important for SME business; SMEs need to create
differentiation in their products, services and business processes. Thus, SMEs in the
advertising segment should devise long-term objectives and decide on the strategies to be
used for the achievement of these objectives.
- An effective performance management and measurement system should be implemented
in SMEs, in which quantified goals should be decided upon and performance of the SME
must be tracked on that quantifiable and objective system.
- EO should be adopted while starting an SME and ideas relating to an innovative product,
service, process or technology should be decided upon and implemented. MO should be
considered in market with intense competition and LO would be more suitable for
complex businesses that have high requirements of innovation and change.
- KM should be adopted as an organization-wide philosophy and a knowledge supportive
culture should be built for successful implementation of KM system and related practices.
There should be an environment of trust so that knowledge can be shared, conventions
questioned and feedback provided in an open manner.

206 | P a g e
- Organizations should not focus too much on the current needs and demands of the
customers, and focus on what could be the future need of the customer and make
innovations in this regard.
- A simple and open process of knowledge acquisition and knowledge dissemination
should be devised and implemented in the organization. Knowledge sources, knowledge
communication channels and knowledge storage repository should be outlined and
improvements in these regards must be supported.
- The strategic orientation of the business should be clear and the organization should not
pursue all the business orientation strategies at the same time.
- The KM system should have technological support. Information and communication
technology support in this regard would be very important.
- Employees demonstrating support for KM system and innovations should be recognized
and employees who are better at management of knowledge and related decisionmaking
should be distinguished, rewarded and promoted.
- The KM philosophy should be implemented from the top; two-way bottom-up and top-
down communication shouldbe initiated and prompted. Further, there should be
continuous support for the philosophy from the top positions of the organization.
6.3 Directions for Future Research
This research was considered a first step in the exploration of the interrelationships among
strategic business orientations and KM. The purpose of this research was neither to undermine
any aspect of KM, nor to undermine any of the strategic business orientations. Following are
directions for future research under this domain of knowledge:

207 | P a g e
- The study considered the impact of business orientations on KM process; a subsequent
study could include the performance of SMEs and assess the role of both strategic
business orientations and KM in this regard.
- Much of the attention of the world has focused on the development of a KM framework
for SMEs, but no such study has yet been conducted in any developing country.
Subsequent research could focus on the development of KM and an evaluation
framework.
- AKM system development process could also be assessed in a typical SME of a
developing country because such SMEs are under resource constraints and do not possess
many technological capabilities.
- Research could also be directed into understanding the strategic context of SMEs.In
particular, how SMEs in developing nations select different strategic business
orientations and what might be the most suitable strategic business orientation for newly
formed SMEs in various business sectors.

208 | P a g e
References
Aaker, D. A. (1988). Strategic Market Management. New York, NY: John-Wiley and Sons, Inc.
Adams, G. L., & Lamont, B. T. (2003). Knowledge management systems and developing
sustainable competitive advantage. Journal of Knowledge Management, 7(2), 142-154.
Akgün, A. E., Keskin, H., Byrne, J. C., & Aren, S. (2007). Emotional and learning capability and
their impact on product innovativeness and firm performance. Technovation, 501-513.
Alavi, M., & Leidner, D. E. (2001). Review: Knowledge management and knowledge
management systems: Conceptual foundations and research issues. MIS Quarterly, 107-
136.
Ayyagari, M., Beck, T., & Demirguc-Kunt, A. (2007). Small and medium enterprises across the
globe. Small Business Economics, 29(4), 415-434.
Alegre, J., &Chiva, R. (2008). Assessing the impact of organizational learning capability on
product innovation performance: An empirical test. Technovation, 28(6), 315-326.
Allwright, R. (1976). Language Learning through Communication Practice. ELT Documents
(76/3).
Amabile, T. M. (1988). A model of creativity and innovation in organizations.Research in
organizational behavior, 10(1), 123-167.
Amabile, T. M. (1996). Creativity in context: Update to" the social psychology of creativity.".
Westview press.
Anderson, P. F. (1982). Marketing, strategic planning and the theory of the firm. Journal of
Marketing, 15-26.
Arenius, P., & De Clercq, D. (2005). A network-based approach on opportunity recognition.
Small Business Economics, 24(3), 249-265.

209 | P a g e
Atuahene-Gima, K., Slater, S. F., & Olson, E. M. (2005). The Contingent Value of Responsive
and proactive market orientation for new product program performance. Journal of
Product Innovation Management, 464-482.
Autio, E. (2007). GEM 2007 report on high-growth entrepreneurship. London: GERA.
Baker, W. E., & Sinkula, J. M. (1999). The Synergistic Effect of Market Orientation and
Learning Orientation on Organizational Performance. Journal of the Academy of
Marketing Science, 411-427.
Bapuji, H., & Crossan, M. (2004). From questions to answers: reviewing organizational learning
research. Management Learning, 397–417.
Baron, R. M., & Kenny, D. A. (1986). The moderator–mediator variable distinction in social
psychological research: Conceptual, strategic, and statistical considerations. Journal of
personality and social psychology,51(6), 1173.
Baron, R. A. (1998). Cognitive mechanisms in entrepreneurship: Why and when enterpreneurs
think differently than other people. Journal of Business venturing, 13(4), 275-294.
Bassi, L. J. (1997). Harnessing the power of intellectual capital. Training &
Development, 51(12), 25-31.
Becerra-Fernandez, I., & Sabherwal, R. (2014). Knowledge management: Systems and
processes: Routledge.
Begley, T. M., & Boyd, D. P. (1987). Psychological characteristics associated with performance
in entrepreneurial firms and smaller businesses. Journal of Business Venturing, 79-93.
Best, J. (Ed.). (1989). Images of issues: Typifying contemporary social problems. Transaction
Publishers.
Berry, L. L. (1983). Relationship marketing. American Marketing Association.
Berry, A. J., Sweeting, R., &Goto, J. (2006). The effect of business advisers on the performance
of SMEs. Journal of small business and enterprise development, 13(1), 33-47.
Bhatt, G. D. (2000). Organizing knowledge in the knowledge development cycle. Journal of
knowledge management, 4(1), 15-26.

210 | P a g e
Bird, B. J. (1989). Entrepreneurial Behavior. New York, NY: Macmillan Publishing Company.
Blaxter, L. (2010). How to research. McGraw-Hill Education (UK).
Bourdreau, A., &Couillard, G. (1999). Systems integration and knowledge
management. Information Systems Management, 16, 24-32.
Boudreau, J. W., & Ramstad, P. M. (2005). Talentship, talent segmentation, and sustainability: A
new HR decision science paradigm for a new strategy definition. Human Resource
Management, 44(2), 129-136.
Brooksbank, R., Kirby, D., Tompson, G., & Taylor, D. (2003). Marketing as a determinant of
long-run competitive success in medium-sized UK manufacturing firms. Small business
economics, 20(3), 259-272.
Brown, S. L., &Eisenhardt, K. M. (1995). Product development: Past research, present findings,
and future directions. Academy of Management Review, 20(2), 343-378.
Brown, D. & Lockett, N. (2004) Potential of critical e-applications for engaging SMEs in e-
business: a provider perspective, European Journal of Information Systems13: 21
Burns, R. P., & Burns, R. (2008). Business research methods and statistics using SPSS. Sage.
Burns, K. E., Duffett, M., Kho, M. E., Meade, M. O., Adhikari, N. K., Sinuff, T., ...&
ACCADEMY Group. (2008). A guide for the design and conduct of self-administered surveys of
clinicians. Canadian Medical Association Journal, 179(3), 245-252.
Burns, A. C., & Bush, R. F. (2013). Marketing research. Pearson Higher Ed.
Burns, A. C., & Bush, R. F. (2013). Marketing research. Pearson Higher Ed.
Burton-Jones, A. (1999). Knowledge Capitalism: Business. Work, and Learning.
Bryman, A. Bell, e.(2011). Business research methods, 3.
Bryman, A. B. E.(2007) Business research methods.
Bryman, A. (2015). Social research methods. Oxford university press.

211 | P a g e
Çakar, N. D., & Ertürk, A. (2010). Comparing innovation capability of small and medium‐sized
enterprises: examining the effects of organizational culture and empowerment. Journal of
Small Business Management, 48(3), 325-359.
Calabrese, V., Lodi, R., Tonon, C., D'Agata, V., Sapienza, M., Scapagnini, G., . . . Butterfield, D.
A. (2005). Oxidative stress, mitochondrial dysfunction and cellular stress response in
Friedreich's ataxia. Journal of the Neurological Sciences, 233(1), 145-162.
Calantone, R. J., Cavusgil, S. T., & Zhao, Y. (2002). Learning orientation, firm innovation
capability, and firm performance. Industrial Marketing Management, 515–524.
Cameron, A. (1995). Callimachus and his Critics (Vol. 264). Princeton: Princeton University
Press.
Carland, J. W., Hoy, F., & Carland, J. C. (1984). Who is Entrepreneur? Is a question worth
asking. American Journal of Small Business, 33-39.
Carroll, A. B., & Shabana, K. M. (2010). The business case for corporate social responsibility: A
review of concepts, research and practice. International Journal of Management Reviews,
12(1), 85-105.
Carlton, D. W., &Perloff, J. M. (2015). Modern industrial organization. Pearson Higher Ed.
Carson, D., & Gilmore, A. (2000). Marketing at the interface: not ‘what’but ‘how’. Journal of
marketing theory and practice, 8(2), 1-7.
Carrillo, J. E., &Gaimon, C. (2004). Managing knowledge-based resource capabilities under
uncertainty. Management Science, 50(11), 1504-1518.
Carroll, R. (2009). Risk management handbook for health care organizations(Vol. 30). John
Wiley & Sons
Caruana, R. (1998). Multitask learning. In Learning to learn (pp. 95-133). Springer US.
Cegarra-Navarro, J. G., &Cepeda-Carrión, G. (2008). Why open-mindedness needs time to
explore and exploit knowledge. Time & Society, 17(2-3), 195-213.

212 | P a g e
Chaston, I. (2008). Small creative industry firms: a development dilemma?.Management
Decision, 46(6), 819-831.
Chatterjee, S., &Hadi, A. S. (2006). Simple linear regression. Regression Analysis by Example,
Fourth Edition, 21-51.
Child, J. (1972). Organizational structure, environment and performance: The role of strategic
choice. Sociology, 6(1), 1-22.
Chiva, R., & Alegre, J. (2009). Organizational learning capability bility and job satisfaction: an
empirical assessment in the ceramic tile industry. British Journal of Management, 323–
340.
Choi, B., & Lee, H. (2002). Knowledge management strategy and its link to knowledge creation
process. Expert Systems with applications, 23(3), 173-187.
Choy, C. S., Yew, W. K., & Lin, B. (2006). Criteria for measuring KM performance outcomes in
organisations. Industrial Management & Data Systems, 106(7), 917-936.
Clark, K. B., & Fujimoto, T. (1989). The power of product integrity. Harvard Business Review,
68(6), 107-118.
Cohen, W. M., & Levinthal, D. A. (1990). Absorptive capacity: a new perspective on learning
and innovation. Administrative Science Quarterly, 128–152.
Collins, D. (2003). Pretesting survey instruments: an overview of cognitive methods. Quality of
life research, 12(3), 229-238.
Cooper, A. C., & Dunkelberg, W. C. (1986). Entrepreneurship and paths to business ownership.
Strategic Management Journal, 53-68.
Covin, J. G., & Slevin, D. P. (1989). Strategic management of small firms in hostile and benign
environments. Strategic Management Journal, 75-87.
Cunningham, J. B., & Lischeron, J. (1991). Defining Entrepreneurship. Journal of Small
Business Management, 45-61.
213 | P a g e
Crawley, M. J. (2002). Statistical computing: An introduction to data analysis using.
Cronk, B. C. (2004). How to use SPSS: A step-by-step guide to analysis and interpretation.
Pyrczak Pub.
Davenport, T. H., & Völpel, S. C. (2001). The rise of knowledge towards attention management.
Journal of Knowledge Management, 5(3), 212-222.
David, D., & Morris, M. A. (1991). Perceived environmental turbulence and its effect on
selected entrepreneurship, marketing and organizational characteristics in industrial
firms. Journal of the Academy of Marketing Science, 43-51.
Davidsson, P., &Wiklund, J. (2001). Levels of analysis in entrepreneurship research: Current
research practice and suggestions for the future.Entrepreneurship theory and Practice, 25(4), 81-
100.
Davis, D., Morris, M., & Allen, J. (1991). Perceived environmental turbulence and its effect on
selected entrepreneurship, marketing, and organizational characteristics in industrial
firms. Journal of the Academy of Marketing Science, 19(1), 43-51.
Dawes, J. (1999). The relationship between subjective and objective company performance
measures in market orientation research: further empirical evidence. Marketing Bulletin-
Department of Marketing Massey University, 10, 65-75.
Day, G. S. (1994). Continuous Learning About Markets. California Management Review, 9-31.
Day, G. S., &Nedungadi, P. (1994). Managerial representations of competitive advantage. The
Journal of Marketing, 31-44.
Day, G. S. (1994). The capabilities of market-driven organizations. the Journal of Marketing, 37-
52.
Demarest, M. (1997). Understanding knowledge management. Long range planning, 30(3), 321-
384.
Dencker, J. C., Gruber, M., & Shah, S. K. (2009). Pre-entry knowledge, learning, and the
survival of new firms. Organization Science, 20(3), 516-537.
Deshpande, R., Farley, J. U., & Webster Jr, F. E. (1993). Corporate culture, customer orientation,
and innovativeness in Japanese firms: a quadrad analysis. The journal of Marketing, 23-37.

214 | P a g e
Dess, G. G., & Robinson, R. G. (1984). Measuring organizational performance in the absence of
objective measures: The case of the privately-held firm and conglomerate business unit.
Strategic Management Journal, 265-73.
Dess, G. G., & Lumpkin, G. T. (2005). The role of entrepreneurial orientation in stimulating
effective corporate entrepreneurship. The Academy of Management Executive, 19(1), 147-156.
DiBella, A. J., Nevis, E. C., & Gould, J. M. (1996). Understanding standing organizational
learning capability. Journal of Management Studies, 361–379.
Dixon, M. (2000). Project management body of knowledge. Retrieved October, 19, 2005.
Dörnyei, Z. (2003). Attitudes, orientations, and motivations in language learning: Advances in
theory, research, and applications. Language learning,53(S1), 3-32.
Dougherty, D. (1989). Interpretive barriers to successful product innovation
Dougherty, D. (1992). Interpretive barriers to successful product innovation in large
firms. Organization science, 3(2), 179-202.
Drucker, P. F., & Drucker, P. F. (1994). Post-capitalist society. Routledge.\
Drucker, P. F. (1999). Knowledge-worker productivity: The biggest challenge.California
management review, 41(2), 79-94.
Duffy, N. (1999). Benchmarking knowledge strategy. 1999), Leveraging Knowledge for
Business Performance, WITS Business School: Johannesburg.
Duguay, S. M., & Korbut, K. A. (2002). Designing a training program which delivers results
quickly! Industrial and Commercial Training, 34(6), 223-228.
Du Plessis, M. (2007). The role of knowledge management in innovation. Journal of Knowledge
Management, 11(4), 20-29.
Easterby-Smith, M., Thorpe, R., & Jackson, P. R. (2012). Management research. Sage.
Egbu, C., Botterill, K., & Bates, M. (2001, September). The influence of knowledge
management and intellectual capital on organisational innovations. In Proceedings of the 17th
215 | P a g e
Annual Conference of the Association of Researchers in Construction Management
(ARCOM) (pp. 5-7).
Egbu, C. O., Hari, S., &Renukappa, S. H. (2005). Knowledge management for sustainable
competitiveness in small and medium surveying practices.Structural survey, 23(1), 7-21.
Elliot, A. J., & McGregor, H. A. (2001). A 2× 2 achievement goal framework.Journal of
personality and social psychology, 80(3), 501.
Ellis, P., & Pecotich, A. (2001). Social factors influencing export initiation in small and medium-
sized enterprises. Journal of Marketing Research, 38(1), 119-130.
Elo, M., Harima, A., &Freiling, J. (2015). To Try or Not to Try? A story of diaspora
entrepreneurship. The Future of Global Organizing. Progress in International Business
Research, 10, 283-293.
Evans, M., Dalkir, K., & Bidian, C. (2015). A holistic view of the knowledge life cycle: the
knowledge management cycle (KMC) model. Leading Issues in Knowledge
Management, Volume Two, 2, 47.
Fahy, J., Hooley, G., Cox, T., Beracs, J., Fonfara, K., & Snoj, B. (2000). The development and
impact of marketing capabilities in Central Europe. Journal of International Business
Studies, 63-81.
Farrell, M. A. (2000). Developing a market‐oriented learning organisation. Australian Journal of
Management, 25(2), 201-222.
Farrell, M. A., &Oczkowski, E. (2002). Are market orientation and learning orientation
necessary for superior organizational performance? Journal of Market-focused Management,
5(3), 197-217.
Fillis, I., &McAuley, A. (2000). Modeling and measuring creativity at the interface. Journal of
Marketing Theory and Practice, 8(2), 8-17.
Fink, A. (2003). The survey handbook (Vol. 1). Sage.
216 | P a g e
Fitzsimons, P., & O’Gorman, C. (2005). The Global Entrepreneurship Monitor (GEM) 2005:
The Irish Report. Dublin: Enterprise Ireland, Forfás and InterTradeIreland.
Fogarty, J., Au, C., & Hudson, S. E. (2006, October). Sensing from the basement: a feasibility
study of unobtrusive and low-cost home activity recognition. In Proceedings of the 19th annual
ACM symposium on User interface software and technology (pp. 91-100). ACM.
Forbis, J. L., & Mehta, N. T. (1981). Value-based strategies for industrial products. Business
Horizons, 32-42.
Fornell, C. (1992). A national customer satisfaction barometer: The Swedish experience. the
Journal of Marketing, 6-21.
Galayini, A. M., Noble, J. S., & Crowe, T. C. (1997). An integrated dynamic performance
measurement system for improving manufacturing and competitiveness. International
Journal of Production Economics, 207-25.
Galer, G., & Van Der Heijden, K. (1992). The learning organization: How planners create
organizational learning. Marketing Intelligence & Planning, 10(6), 5-12.
García-Morales, V. J., Lloréns-Montes, F. J., & Verdú-Jover, A. J. (2007). Influence of personal
mastery on organizational performance through organizational learning and innovation in
large firms and SMEs. Technovation, 547-568.
Gartner, W. B. (1988). "Who is entrepreneur?" Is the wrong question. American Journal of Small
Business, 11-32.
Garvin, D. A. (1993). Building a learning organization. Harvard Business Review, 78-91.
217 | P a g e
Gassmann, O., &Keupp, M. M. (2007). The competitive advantage of early and rapidly
internationalising SMEs in the biotechnology industry: A knowledge-based view. Journal
of World Business, 42(3), 350-366.
Gatignon, H., &Xuereb, J. M. (1997). Strategic orientation of the firm and new product
performance. Journal of marketing research, 77-90.
Gefen, D., & Straub, D. (2005). A practical guide to factorial validity using PLS-Graph: Tutorial
and annotated example. Communications of the Association for Information systems, 16(1), 5.
George, G., & Zahra, S. A. (2002). Culture and its consequences for entrepreneurship.
Entrepreneurship Theory and Practice, 5-8.
Ghauri, P. N., &Grønhaug, K. (2005). Research methods in business studies: A practical guide.
Pearson Education.
Ghosh, B., & Kwan, W. (1996). An analysis of key success factors of SMEs: a comparative study
of Singapore/Malaysia and Australia/New Zealand. Paper presented at the The 41st ICSB
World Conference Proceedings I.
Gilmore, A., Carson, D., & Rocks, S. (2006). Networking in SMEs: Evaluating its contribution
to marketing activity. International Business Review, 15(3), 278-293.
Gloor, P. (2005). Swarm creativity, COIN.
Goldberger, J., Hinton, G. E., Roweis, S. T., &Salakhutdinov, R. (2004). Neighbourhood
components analysis. In Advances in neural information processing systems (pp. 513-520).
González-Benito, J., & González-Benito, Ó. (2005). Environmental proactivity and business
performance: an empirical analysis. Omega, 33(1), 1-15.
Gooderham, P. N., Tobiassen, A., Døving, E., &Nordhaug, O. (2004). Accountants as sources of
business advice for small firms. International small business journal, 22(1), 5-22.
Grant, R. M. (1996). Toward a knowledge‐based theory of the firm. Strategic management
journal, 17(S2), 109-122.
218 | P a g e
Grant, B., & McKinley, E. (2011). Colouring the pedagogy of doctoral supervision: considering
supervisor, student and knowledge through the lens of indigeneity. Innovations in Education and
Teaching International, 48(4), 377-386.
Gray, C., &Stanworth, J. (1991). Bolton 20 years on: the small firm in the 1990s. University of
Illinois at Urbana-Champaign's Academy for Entrepreneurial Leadership Historical Research
Reference in Entrepreneurship.
Griffith, D. A., Zeybek, A. Y., & O’Brien, M. (2001). Knowledge transfer as a means for
relationship development: A Kazakhstan-foreign international joint venture illustration. Journal
of International Marketing, 9(2), 1-18.
Gronroos, C. (1994). From marketing mix to relationship marketing: towards a paradigm shift in
marketing. Management decision, 32(2), 4-20.
Guenzi, P., &Troilo, G. (2006). Developing marketing capabilities for customer value creation
through Marketing–Sales integration. Industrial marketing management, 35(8), 974-988
Gumbus, A. (2005). Introducing the balance scorecard: Creating matrix to measure performance.
Journal of Management Education, 617-30.
Gumbus, A., & Lussier, R. N. (2006). Entrepreneurs use a balance scorecard to translate strategy
into performance measures. Journal of Small Business Management, 407-26.
Hage, J. (1980). Theories of organizations: Form, process, and transformation: John Wiley &
Sons.
Haldin-Herrgard, T. (2000). Difficulties in diffusion of tacit knowledge in organizations. Journal
of Intellectual capital, 1(4), 357-365.
Han, J. K., Kim, N., & Srivastava, R. K. (1998). Market Orientation and Performance: Is
innovation the missing link? Journal of Marketing, 30-45.
Hanan, M. (1985). Consultative Selling. New York, NY: American Management Association.
Hanson, W. E., Creswell, J. W., Clark, V. L. P., Petska, K. S., & Creswell, J. D. (2005). Mixed
methods research designs in counseling psychology.Journal of counseling psychology, 52(2),
224.
219 | P a g e
Harris, L. C., &Ogbonna, E. (2001). Leadership style and market orientation: an empirical
study. European journal of marketing, 35(5/6), 744-764.
Hean Lim, L. (2007). Illuminating the core of Singapore school leadership preparation: Two
decades of in-service experience. International journal of educational management, 21(5), 433-
439.
Hedlund, G. (1994). A model of knowledge management and the N‐form corporation. Strategic
management journal, 15(S2), 73-90.
Hemal, G., & Prahald, J. K. (1994). Competing for future. Cambridge: Harvard Business School
Press.
Hendriks, P. H., &Vriens, D. J. (1999). Knowledge-based systems and knowledge management:
friends or foes?. Information & Management, 35(2), 113-125.
Hillary, R. (2000). Small and medium-sized enterprises and the environment: business
imperatives: Greenleaf Publishing.
Hills, G. E., &LaForge, R. W. (1992). Research at marketing interface to advance
entrepreneurship theory. Entrepreneurship: Theory and Practice, 16(3), 33-60.
Hills, G. E., & LaForge, R. W. (1992). Marketing and Entrepreneurship: The state of the art. In
D. L. Sexton, & J. D. Kasarda, The State of the Art (pp. 164-90). Boston: PWS-Kent
Publishing.
Hilmer, F. G., & Donaldson, L. (1996). Management redeemsiness School Press, Boston, MA.
Hodgson, G. M. (1993). Economics and evolution: bringing life back into economics. University
of Michigan Press.
Holmes, S., & Nicholls, D. (1989). Modelling the accounting information requirements of small
businesses. Accounting and Business Research,19(74), 143-150.
Hult, G. T. M., &Ketchen, D. J. (2001). Does market orientation matter?: A test of the
relationship between positional advantage and performance.Strategic management
journal, 22(9), 899-906.
220 | P a g e
Hult, G. T., Hurley, R. F., & Knight, G. A. (2004). Innovativeness: Its antecendents and impact
on business performance. Industrial Marketing Management, 429-38.
Hunt, S. D., & Morgan, R. M. (1995). The comparative advantage theory of competition. The
Journal of Marketing, 1-15.
Hunt, S. D., & Morgan, R. M. (1995). The comparative advantage theory of competition. The
Journal of Marketing, 1-15.
Hurley, R. F., &Hult, G. T. M. (1998). Innovation, market orientation, and organizational
learning: an integration and empirical examination. The Journal of Marketing, 42-54.
Hutcheson, G. D., &Sofroniou, N. (1999). The multivariate social scientist: Introductory
statistics using generalized linear models. Sage.
Jackson, B. (1985). Winning and Keeping Industrial Customers. Lexington, MA: Lexington
Books.
Jamieson, S. (2004). Likert scales: how to (ab) use them. Medical education,38(12), 1217-1218.
Janssen, O., & Van Yperen, N. W. (2004). Employees' goal orientations, the quality of leader-
member exchange, and the outcomes of job performance and job satisfaction. Academy of
management journal, 47(3), 368-384.
Jarvis, R., Curran, J., Kitching, J., & Lightfoot, G. (2000). The use of quantitative and qualitative
criteria in the measurement of performance in small firms. Journal of small business and
enterprise development, 7(2), 123-134.
Jaworski, B. J., & Kohli, A. K. (1993). Market Orientation: Antecedents and Consequences.
Journal of Marketing, 53-70.
Jogaratnam, G., Tse, E. C., & Olsen, M. D. (1999). An empirical analysis of entrepreneurship
and performance in Restaurant industry. Journal of Hospitality and Tourism Research,
339-53.

221 | P a g e
Johanson, J., &Vahlne, J.-E. (2009). The Uppsala internationalization process model revisited:
From liability of foreignness to liability of outsidership. Journal of International Business
Studies, 40(9), 1411-1431.
Joshi, V. D., Malhotra, R., Lim, J. F., Ostbye, T., & Wong, M. (2010). Validity and reliability of
the expectations regarding aging (ERA-12) instrument among middle-aged Singaporeans. Ann
Acad Med Singapore, 39(2), 394-398.
Juniper, E. F., Guyatt, G. H., Streiner, D. L., & King, D. R. (1997). Clinical impact versus factor
analysis for quality of life questionnaire construction.Journal of clinical epidemiology, 50(3),
233-238.
Kanter, J. (1999). Knowledge management, practically speaking. Information Systems
Management, 16, 7-9.
Kaplan, R. S., & Norton, D. P. (1992). The balance scorecard - measures that drive performance.
Harvard Business Review, 71-9.
Kaplan, R. S., & Norton, D. P. (2000). Having trouble with your strategy? Then map it. Focusing
Your Organization on Strategy—with the Balanced Scorecard, 49.
Kaplan, R. S., & Norton, D. P. (2005). The balance scorecard: measures that drive performance.
Harvard Business Review, 172-80.
Karagozoglu, N., & Brown, W. B. (1988). Adaptive responses by conservative and
entrepreneurial firms. Journal of Product Innovation Management, 5(4), 269-281.
Karpin, D. (1995). Enterprising nation: renewing Australia's managers to meet the challenges of
the Asia-Pacific century [Karpin report]. Canberra: Australian Government.
Kavali, S. G., Tzokas, N. X., &Saren, M. J. (1999). Relationship marketing as an ethical
approach: philosophical and managerial considerations.Management Decision, 37(7), 573-581.
Kegan, R., &Lahey, L. L. (2001). How the way we talk can change the way we work: Seven
languages for transformation: John Wiley & Sons.

222 | P a g e
Keh, H. T., Nguyen, T. T. M., & Ng, H. P. (2007). The effects of entrepreneurial orientation and
marketing information on the performance of SMEs. Journal of business venturing, 22(4), 592-
611.
Keith, T. Z. (2014). Multiple regression and beyond: An introduction to multiple regression and
structural equation modeling. Routledge.
Kidd, J., Richter, F. J., & Li, X. (2003). Learning and trust in supply chain
management. Management Decision, 41(7), 603-612.
Kikawada, K., &Holtshouse, D. (2001). 14 The Knowledge Perspective in the Xerox
Group. Managing industrial knowledge: creation, transfer and utilization, 283.
Kim, L. (1998). Crisis construction and organizational learning: capability building in catching-
up at Hyundai Motor. Organization Science, 506–521.
Kim, W. C., & Mauborgne, R. (2005). Blue ocean strategy: from theory to practice. California
Management Review, 47(3), 105-121.
Kimberly, J. R., &Evanisko, M. J. (1981). Organizational innovation: The influence of
individual, organizational, and contextual factors on hospital adoption of technological and
administrative innovations. Academy of Management Journal, 24(4), 689-713.
Kirby, D. A., & King, S. H. (1997). Accountants and small firm development: filling the
expectation gap. Service Industries Journal, 17(2), 294-304.
Kish, L. (1965). Survey sampling.
Knight, G. (2000). Entrepreneurship and marketing strategy: The SME under globalization.
Journal of International Marketing, 8(2), 12-32.
Knight, G. A., &Cavusgil, S. T. (2004). Innovation, organizational capabilities, and the born-
global firm. Journal of International Business Studies, 35(2), 124-141.
Kohli, A. K., & Jaworski, B. J. (1990). Marketing orientation: The construct, research
proposition, and management implications. Journal of Marketing.

223 | P a g e
Kulkki, S., &Kosonen, M. (2001). 12 How Tacit Knowledge Explains Organizational Renewal
and Growth: the Case of Nokia. Managing industrial knowledge: creation, transfer and
utilization, 244.
Kurunmäki, L. (2004). A hybrid profession—the acquisition of management accounting
expertise by medical professionals. Accounting, organizations and society, 29(3), 327-347.
Laudon, K. C., & Laudon, J. P. (2000). Management information system: organization and
technology in the networked enterprise. Pearson Custom Publishing.
Laursen, K., & Salter, A. (2006). Open for innovation: the role of openness in explaining
innovation performance among UK manufacturing firms. Strategic management journal, 27(2),
131-150.
Leonard, D., &Sensiper, S. (1998). The role of tacit knowledge in group innovation. California
management review, 40(3), 112-132.
Liao, Y. S. (2011). The effect of human resource management control systems on the
relationship between knowledge management strategy and firm performance. International
Journal of Manpower, 32(5/6), 494-511.
Lee, Les Tien-Shang, & Sukoco, Badri Munir. (2007). The effects of entrepreneurial orientation
and knowledge management capability on organizational effectiveness in Taiwan: the
moderating role of social capital. International Journal of Management, 24(3), 549.
Lesser, E., &Prusak, L. (2000). Communities of practice, social capital, and organizational
knowledge (pp. 251-259). Elsevier: Amsterdam, The Netherlands.
Lafferty, B. A., & Tomas M. Hult, G. (2001). A synthesis of contemporary market orientation
perspectives. European journal of marketing, 35(1/2), 92-109.
Law, M. (2009). Managing consultants. Business Strategy Review, 20(1), 62-66.
Lear, J. (1998). Open minded: Working out the logic of the soul. Harvard University Press.
Leonard‐Barton, D. (1992). Core capabilities and core rigidities: A paradox in managing new
product development. Strategic Management Journal, 13(S1), 111-125.

224 | P a g e
Leonidou, L. C., Katsikeas, C. S., Palihawadana, D., &Spyropoulou, S. (2007). An analytical
review of the factors stimulating smaller firms to export: Implications for policy-makers.
International Marketing Review, 24(6), 735-770.
Levitt, T. (1960). Marketing Myopia. Harvard Business Review, 45-56.
Liao, Y. S. (2011). The effect of human resource management control systems on the
relationship between knowledge management strategy and firm performance. International
Journal of Manpower, 32(5/6), 494-511.
Long, W. (1983). The meaning of Entrepreneurship. American Journal of Small Business, 47-59.
Low, M. B., & MacMillan, I. C. (1988). Entrepreneurship: Past research and future challenges.
Journal of Management, 139-61.
Lu, J. W., & Beamish, P. W. (2001). The internationalization and performance of
SMEs. Strategic management journal, 22(6‐7), 565-586.
Lumpkin, G. T., & Dess, G. G. (1996). Clarifying the Entrepreneurial Orientation Construct and
linking it to Performance. Academy of Management Review, 135-72.
Malone, T. W. (1981). Toward a theory of intrinsically motivating instruction.Cognitive
science, 5(4), 333-369.
Marr, B., &Schiuma, G. (2003). Business performance measurement-past, present and
future. Management decision, 41(8), 680-687.
Markus, L. M. (2001). Toward a theory of knowledge reuse: Types of knowledge reuse
situations and factors in reuse success. Journal of management information systems, 18(1), 57-
93.
Mårtensson, M. (2000). A critical review of knowledge management as a management
tool. Journal of knowledge management, 4(3), 204-216.
Massingham, P. R., &Massingham, R. K. (2014). Does knowledge management produce
practical outcomes?. Journal of Knowledge Management, 18(2), 221-254.
McDonald, H. D. (2010). Knowledge Management Processes in Growth-oriented SMEs: An
Atlantic Canadian Perspective.
225 | P a g e
Maidique, M. A., & Patch, P. (1982). Corporate strategy and technological policy. Readings in
the Management of Innovation, 273, 285.
Main, J. (1990). A golden age for entrepreneurs. Fortune, 120-25.
Maqsood, T., Walker, D. H., &Finegan, A. D. (2007). Facilitating knowledge pull to deliver
innovation through knowledge management: A case study.Engineering, Construction and
Architectural Management, 14(1), 94-109.
Marr, B., & Shiuma, G. (2003). Business Performance Measurement - past, present, and future.
Management Decision, 680-87.
Marriott, N., & Marriott, P. (2000). Professional accountants and the development of a
management accounting service for the small firm: barriers and possibilities. Management
accounting research, 11(4), 475-492.
Maurer, T. J., & Pierce, H. R. (1998). A comparison of Likert scale and traditional measures of
self-efficacy. Journal of applied psychology, 83(2), 324.
McClelland, D. (1965). The Achieving Society. Princeton, NJ: D. Van Nostrand.
Mcgreevy, M. (2007). The knowledge management spending report. AMR Research.
Meso, P., & Smith, R. (2000). A resource-based view of organizational knowledge management
systems. Journal of knowledge management, 4(3), 224-234.
Meziou, F. (1991). Areas of strength and weakness in the adoption of the marketing concept by
small manufacturing firms. Journal of Small Business Management, 72-78.
Michna, A. (2009). The relationship between organizational learning and SME performance in
Poland. Journal of European Industrial Training, 356–370.
Miles, R. E., Snow, C. C., Meyer, A. D., & Coleman, H. J. (1978). Organizational strategy,
structure, and process. Academy of management review, 3(3), 546-562.

226 | P a g e
Miles, A. P., & Arnold, D. R. (1991). The relationship between marteting orientation and
entrepreneurial orientation. Entrepreneurship Theory and Prectice, 49-65.
Miles, M. P., &Darroch, J. (2008). A commentary on current research at the marketing and
entrepreneurship interface. Journal of Small Business Management, 46(1), 46-49.
Miles, M. P., Munilla, L. S., &Darroch, J. (2009). Sustainable corporate
entrepreneurship. International Entrepreneurship and Management Journal,5(1), 65-76.
Miller, D. (1983). The Correlates of Entrepreneurship in three types of Firms. Management
Science, 770-91.
Miller, D., & Friesen, P. H. (1982). Innovation in conservative and entrepreneurial firms: Two
models of strategic momentum. Strategic management journal, 3(1), 1-25.
Mirchandani, D., &Pakath, R. (1999). Four models for a decision support system. Information &
Management, 35(1), 31-42.
Moller, K., &Anttila, M. (1987). Marketing capability—A key success factor in small
business?. Journal of marketing management, 3(2), 185-203.
Monkhouse, E. (1995). The role of competitive benchmarking in small-to medium-sized
enterprises. Benchmarking for Quality Management & Technology, 2(4), 41-50.
Morris, M. H., & Lewis, P. S. (1995). The determinants of Entrepreneurial Activity: Implications
for Marketing. European Journal of Marketing, 31-48.
Morris, M. H., & Paul, G. W. (1987). The relationship between entrepreneurship and marketing
in established firms. Journal of Business Venturing, 247-259.
Morris, M., Schindehutte, M., & Allen, J. (2005). The entrepreneur's business model: toward a
unified perspective. Journal of business research, 58(6), 726-735.
Mulhern, A. (1995). The SME sector in Europe: A broad perspective. Journal of Small Business
Management, 33(3), 83.
Mulhern, Alan. (1995). The SME sector in Europe: A broad perspective. Journal of Small
Business Management, 33(3), 83.ee, Les Tien-Shang, & Sukoco, Badri Munir. (2007).

227 | P a g e
The effects of entrepreneurial orientation and knowledge management capability on
organizational effectiveness in Taiwan: the moderating role of social capital.
International Journal of Management, 24(3), 549.
Mumford, M. D. (2003). Where have we been, where are we going? Taking stock in creativity
research. Creativity research journal, 15(2-3), 107-120.
Murphy, G. B., Trailer, J. W., & Hill, R. C. (1996). Measuring performance in entrepreneurship
research. Journal of Business Research, 15-23.
Napier, N. K., & Nilsson, M. (2006). The development of creative capabilities in and out of
creative organizations: Three case studies. Creativity and Innovation Management, 15(3), 268-
278.
Narasimha, S. (2000). Organizational knowledge, human resource management, and sustained
competitive advantage: Toward a framework.Competitiveness Review: An International Business
Journal, 10(1), 123-135.
Narula, R. (2001). Choosing between internal and non-internal R&D activities: some
technological and economic factors. Technology Analysis & Strategic Management,
13(3), 365-387.
Narver, J. C., & Slater, S. F. (1990). The effect of a market orientation on business profitability.
The Journal of Marketing, 20-35.
Narver, J. C., Slater, S. F., &Tietje, B. (1998). Creating a market orientation.Journal of market-
focused management, 2(3), 241-255.

228 | P a g e
Nicholson, N. R. (1986). Managing Emerging Businesses. In M. B. Clifford, & R. M. Joseph,
Entrepreneurship and Venture Management (pp. 277-82). Englewood Cliffs, NJ:
Prentice-Hall.
Nonaka, I. (1991). Models of knowledge management in the West and Japan.
Nonaka, I., & Takeuchi, H. (1995). The knowledge-creating company: How Japanese companies
create the dynamics of innovation. Oxford university press.
Normann, R, (1985). The Poverty of Strategic Management in Dealing with Undefinable Ends
and its Alternatives. LedelseogErhvervsøkonomi, 50.
Nystrom, P. C., & Starbuck, W. H. (1984). Organizational Facades. Paper presented at the
Academy of Management Proceedings.
Ordonez, L., & Benson, L. (1997). Decisions under time pressure: How time constraint affects
risky decision making. Organizational Behavior and Human Decision Processes, 71(2), 121-
140.
O'Regan, N., Ghobadian, A., & Sims, M. (2006). Fast tracking innovation in manufacturing
SMEs. Technovation, 26(2), 251-261.
Otto Scharmer, C. (2001). Self-transcending knowledge: sensing and organizing around
emerging opportunities. Journal of Knowledge Management, 5(2), 137-151.
Pelham, A. M., & Wilson, D. T. (1995). A longitudinal study of the impact of market structure,
firm structure, strategy, and market orientation culture on dimensions of small-firm
performance. Journal of the academy of marketing science, 24(1), 27-43.
Papavassiliou, G., Mentzas, G., &Abecker, A. (2002). Integrating knowledge modelling in
business process management. ECIS 2002 Proceedings, 39.
Passmore, C., Dobbie, A. E., Parchman, M., &Tysinger, J. (2002). Guidelines for constructing a
survey. FAMILY MEDICINE-KANSAS CITY-,34(4), 281-286.
Pearce, J. A., & Robbins, D. K. (1994). Retrenchment remains the foundation of business
turnaround. Strategic Management Journal, 15(5), 407-417.
229 | P a g e
Peng Wong, W., & Yew Wong, K. (2011). Supply chain management, knowledge management
capability, and their linkages towards firm performance. Business Process Management
Journal, 17(6), 940-964.
Penrose, E. T., &Pitelis, C. (2002). The growth of the firm: the legacy of Edith Penrose. Oxford
University Press on Demand.
Pérez-Luño, A., Wiklund, J., & Cabrera, R. V. (2011). The dual nature of innovative activity:
How entrepreneurial orientation influences innovation generation and adoption. Journal of
business venturing, 26(5), 555-571.
Podolny, J. M. (1994). Market uncertainty and the social character of economic
exchange. Administrative science quarterly, 458-483.
Polanyi, M. (1962). Tacit knowing: Its bearing on some problems of philosophy. Reviews of
modern physics, 34(4), 601.
Porter, M. E. (1979). How competitive forces shape strategy.
Porter, M. E. (1985). Competitive Advantage. New York: The Free Press.
Potts, J., & Cunningham, S. (2008). Four models of the creative industries.International journal
of cultural policy, 14(3), 233-247.
Prahalad, C. K., & Hamel, G. (1994). Strategy as a field of study: Why search for a new
paradigm?. Strategic management journal, 15(S2), 5-16.
Pun, K. F., & White, A. S. (2005). A performance measurement paradigm for integrating
strategy formulation: A review of systems and frameworks.International journal of management
reviews, 7(1), 49-71.
Quintas, P., Lefrere, P., & Jones, G. (1997). Knowledge management: a strategic agenda. Long
range planning, 30(3), 385-391.
Rauch, A., Wiklund, J., Lumpkin, G. T., &Frese, M. (2009). Entrepreneurial orientation and
business performance: An assessment of past research and suggestions for the
future. Entrepreneurship theory and practice, 33(3), 761-787.

230 | P a g e
Robinson, R. B., & Pearce, J. A. (1984). Research thrusts in small firm strategic planning.
Academy of Management Review, 128-37.
Robinson, H. S., Carrillo, P. M., Anumba, C. J., & Al-Ghassani, A. M. (2005). Knowledge
management practices in large construction organisations. Engineering, Construction and
Architectural Management,12(5), 431-445.
Robson, P. J., & Bennett, R. J. (2000). SME growth: The relationship with business advice and
external collaboration. Small business economics,15(3), 193-208.
Ruekert, R. W., & Walker, O. C. (1987). Interactions between marketing and R&D departments
in implementing different business strategies. Strategic Management Journal, 233-48.
Ruggles, R. (1997). Knowledge tools: using technology to manage knowledge better. working
paper, Ernst & Young Center for Business Innovation.
Saleh, S. D., & Wang, C. K. (1993). The management of innovation: strategy, structure, and
organizational climate. IEEE Transactions on Engineering Management, 40(1), 14-21.
Santos-Vijande, M. L., Sanzo-Perez, M. J., Alvarez-Gonzalez, L. I., & Vazquez-Casielles, R.
(2005). Organizational learning and market orientation: interface and effects on
performance. Industrial marketing management,34(3), 187-202.
Saunders, M. N. (2011). Research methods for business students, 5/e. Pearson Education India.
Schein, E. H. (1993). SMR forum: How can organizations learn faster? The challenge of entering
the green room. Sloan Management Review, 34(2), 85.
Schindehutte, M., Morris, M. H., &Kocak, A. (2008). Understanding market‐driving behavior:
the role of entrepreneurship. Journal of Small Business Management, 46(1), 4-26.
Schumpeter, J. A. (1932). Entwicklung. (Development). Trans. Markus C. Becker and Thorbjørn
Knudsen. http://www. schumpeter. info/Edition-Evolution. htm. February, 11.

231 | P a g e
Schumpeter, J. A. (1934). The Theory of Economic Development. Cambridge: Harvard
University Press.
Selnes, F., Jaworski, B. J., &Kohli, A. K. (1996). Market orientation in United States and
Scandinavian companies. A cross-cultural study.Scandinavian journal of management, 12(2),
139-157.
Senge, P. M. (1990). The Fifth Discipline: The Art and Practice of the Learning Organization.
New York, NY: Doubleday/Currency.
Senge, P. M., &Sterman, J. D. (1992). Systems thinking and organizational learning: Acting
locally and thinking globally in the organization of the future. European journal of operational
research, 59(1), 137-150.
Shani, A. B., Sena, J. A., & Olin, T. (2003). Knowledge management and new product
development: a study of two companies. European Journal of Innovation Management, 6(3),
137-149.
Shapiro, B. P. (1988). What the hell is "Market Oriented"? Harvard Business Review, 119-25.
Shaw, V., &Darroch, J. (2004). Barriers to internationalisation: a study of entrepreneurial new
ventures in New Zealand. Journal of International Entrepreneurship, 2(4), 327-343.
Sinkula, J. M., Baker, W. E., &Noordewier, T. (1997). A framework for market-based
organizational learning: Linking values, knowledge, and behavior. Journal of the Academy of
Marketing Science, 25(4), 305-318.
Saunders, M. L. (2003). P. and Thornhill. Research Methods for business students.
Slater, S. F., &Narver, J. C. (1994). Does competitive environment moderate the market
orientation-performance relationship?. The Journal of Marketing, 46-55.

232 | P a g e
Slater, S. F., &Narver, J. C. (1995). Market orientation and the learning organization. The
Journal of Marketing, 63-74.
Slater, S. F., & Narver, J. C. (2000). The positive effect of market orientation on business
profitability: A balanced replication. Journal of Business Research, 69-73.
Smart, D. T., & Conant, J. S. (2011). Entrepreneurial orientation, distinctive marketing
competencies and organizational performance. Journal of Applied Business Research, 28-
38.
Smith, K. G., & Cao, Q. (2007). An entrepreneurial perspective on the firm‐environment
relationship. Strategic Entrepreneurship Journal, 1(3‐4), 329-344.
Snowden, D. (2002). Complex acts of knowing: paradox and descriptive self-awareness. Journal
of knowledge management, 6(2), 100-111.
Sørensen, L. T., & Vidal, R. V. V. (2006). Creativity and strategy development. Informatics and
Mathematical Modelling, Technical University of Denmark, DTU.
Spender, J. C. (1996). Making knowledge the basis of a dynamic theory of the firm. Strategic
management journal, 17(S2), 45-62.
Spiegler, I. (2000). Knowledge management: a new idea or a recycled
concept?. Communications of the AIS, 3(4es), 2.
Sternberg, R. J., &Lubart, T. I. (1999). The concept of creativity: Prospects and
paradigms. Handbook of creativity, 1, 3-15.
Sternberg, R. J. (2006). The nature of creativity. Creativity research journal,18(1), 87-98.
Stevenson, H. H., &Jarillo, J. C. (2007). A paradigm of entrepreneurship: Entrepreneurial
management. In Entrepreneurship (pp. 155-170). Springer Berlin Heidelberg
Stewart, T., &Ruckdeschel, C. (1998). Intellectual capital: The new wealth of organizations.
233 | P a g e
Stewart, K. A., Baskerville, R., Storey, V. C., Senn, J. A., Raven, A., & Long, C. (2000).
Confronting the assumptions underlying the management of knowledge: an agenda for
understanding and investigating knowledge management. ACM SIGMIS Database, 31(4), 41-53.
Stokes, D. (2000). Entrepreneurial marketing: a conceptualisation from qualitative
research. Qualitative market research: an international journal,3(1), 47-54.
Stone, C. L., & Banks, J. M. (1997). The use of customer- and employee-based measures in the
Times top 500 companies. The TQM Magazine, 152-58.
Storey, D. J. (1994). Understanding the small business sector. University of Illinois at Urbana-
Champaign's Academy for Entrepreneurial Leadership Historical Research Reference in
Entrepreneurship.
Stevenson, H. H., &Jarillo, J. C. (2007). A paradigm of entrepreneurship: Entrepreneurial
management. In Entrepreneurship (pp. 155-170). Springer Berlin Heidelberg.
Streiner, D. L., & Norman, G. R. (2000). Simple regression and correlation.Biostatistics: the
bare essentials. Norman GR, Streiner DL, editors. Hamilton/London, ON, Canada: BC Decker,
118-126.
Sudman, S., &Bradburn, N. M. (1982). Asking questions: a practical guide to questionnaire
design.
Szulanski, G., &Cappetta, R. (2003). Stickiness: Conceptualizing, measuring, and predicting
difficulties in the transfer of knowledge within organizations. The Blackwell Handbook of
Organizational Learning and Knowledge Management. Malden, MA & Oxford: Blackwell, 513-
534.
Szymczak, C. C., & Walker, D. H. (2003). Boeing-a case study example of enterprise project
management from a learning organisation perspective. The Learning Organization, 10(3), 125-
137.
Tabachnick, B. G., Fidell, L. S., &Osterlind, S. J. (2001). Using multivariate statistics.
Tamer Cavusgil, S, Calantone, Roger J, & Zhao, Yushan. (2003). Tacit knowledge transfer and
firm innovation capability. Journal of Business &Industrial Marketing, 18(1), 6-21.
Teece, D. J. (1996). Firm organization, industrial structure, and technological
innovation. Journal of Economic Behavior & Organization, 31(2), 193-224.
234 | P a g e
Teece, D. J., Pisano, G., &Shuen, A. (1997). Dynamic capabilities and strategic
management. Strategic management journal, 509-533.
Thomke, S., &Reinertsen, D. (1998). Agile product development: Managing development
flexibility in uncertain environments. California Management Review, 41(1), 8-30.
Tidd, J. (1997). Complexity, Networks & Learning: Integrative Themes for Research on
Innovation Management. International Journal of Innovation Management, 1-21.
Tirole, J. (1988). The theory of industrial organization. MIT press.
Tiwana, A. (2002). The knowledge management toolkit: orchestrating IT, strategy, and
knowledge platforms. Pearson Education India.
Tobin, D. R. (1993). Re-educating the corporation. Foundations for the learning organization.
Tzokas, N., Carter, S., &Kyriazopoulos, P. (2001). Marketing and entrepreneurial orientation in
small firms. Enterprise and Innovation Management Studies, 2(1), 19-33.
Uncles, M. (2000). Market orientation. Australian journal of management,25(2), I.
Unger, J. M., Rauch, A., Frese, M., &Rosenbusch, N. (2011). Human capital and entrepreneurial
success: A meta-analytical review. Journal of Business Venturing, 26(3), 341-358.
Van de Ven, A. H., Hudson, R., & Schroeder, D. M. (1984). Designing new business startups:
Entrepreneurial, organizational, and ecological considerations. Journal of Management,
87-107.
VandeWalle, D. (2001). Goal orientation:: Why wanting to look successful doesn’t always lead
to success. Organizational Dynamics, 30(2), 162-171.
vanGigch, J. P. (1991). Decision Making and the System Paradigm. InSystem Design Modeling
and Metamodeling (pp. 101-118). Springer US.
Vanhoenacker, J., Bryant, A., &Dedene, G. (1999, April). Creating a knowledge management
architecture for business process change. InProceedings of the 1999 ACM SIGCPR conference
on Computer personnel research (pp. 231-241). ACM.

235 | P a g e
Verona, G. (1999). A resource-based view of product development. Academy of Management
Review, 24(1), 132-142.
Vesper, K. H. (1980). New Venture Strategies. Englewood Cliffs, NJ: Prentice-Hall.
Vesper, K. H., & Gartner, W. B. (1997). Measuring progress in entrepreneurship
education. Journal of Business venturing, 12(5), 403-421.
Vorhies, D. W., Harker, M., & Rao, C. P. (1999). The capabilities and performance advantages
of market-driven firms. European journal of marketing, 33(11/12), 1171-1202.
Vorhies, D. W., & Harker, M. (2000). The Capabilities and PerforMance Advantages of
Market‐Driven Firms: An Empirical Investigation. Australian journal of management, 25(2),
145-171.
Vorhies, D. W., & Morgan, N. A. (2003). A configuration theory assessment of marketing
organization fit with business strategy and its relationship with marketing performance. Journal
of marketing, 67(1), 100-115.
Vorhies, D. W., & Morgan, N. A. (2005). Banchmarking Marketing Capabilities for sustainable
competitive advantage. Journal of Marketing, 80-94.
Wang, C. L. (2008). Entrepreneurial Orientation, Learning Orientation, and Firm Performance.
Entrepreneurship Theory and Practice, 635-657.
Wang, C., Walker, E., & Redmond, J. (2007). Explaining the lack of strategic planning in SMEs:
The importance of owner motivation.
Webb, N. M., Nemer, K. M., Chizhik, A. W., &Sugrue, B. (1998). Equity issues in collaborative
group assessment: Group composition and performance. American Educational Research
Journal, 35(4), 607-651.
Webster, F. E. (1988). Rediscovering the marketing concept. Business Horizons, 29-39.
Weerawardena, J. (2003). The role of marketing capability in innovation-based competitive
strategy. Journal of Strategic Marketing, 15-35.
Widén-Wulff, G., &Ginman, M. (2004). Explaining knowledge sharing in organizations through
the dimensions of social capital. Journal of information science, 30(5), 448-458.
236 | P a g e
Widén-Wulff, G., & Suomi, R. (2007). Utilization of information resources for business success:
The knowLiao ledge sharing model. Information Resources Management Journal (IRMJ), 20(1),
46-67.
Williamson, O. E. (1979). Transaction-cost economics: the governance of contractual
relations. The journal of law & economics, 22(2), 233-261.
Wiig, K. M. (1997). Knowledge management: where did it come from and where will it
go?. Expert systems with applications, 13(1), 1-14.
Wiig, K. M., de Hoog, R., & Van Der Spek, R. (1997). Supporting knowledge management: a
selection of methods and techniques. Expert systems with applications, 13(1), 15-27.
Wren, C., &Storey, D. J. (2002). Evaluating the effect of soft business support upon small firm
performance. Oxford Economic Papers, 54(2), 334-365.
Wind, Y., & Robertson, T. S. (1983). Marketing Strategy: New directions for theory and
research. Journal of Marketing, 12-25.
Wortman, M. S. (1987). Entrepreneurship: An integrating typology and evaluation of empirical
research in the field. Journal of Management, 259-79.
Zack, M. H. (1999). Developing a knowledge strategy. California management review, 41(3),
125-145.
Zack, M., McKeen, J., & Singh, S. (2009). Knowledge management and organizational
performance: an exploratory analysis. Journal of Knowledge Management, 13(6), 392-
409.
Zaharia, Rodica Milena, Stancu, Alin, Stoian, Carmen, & Diaconu, Mihaela. (2010). Commercial
Activity’s Contribution to Sustainable Development by Social Responsability Actions: a
Vision of SMEs. Amfiteatru Economic, 12(27), 155-167.
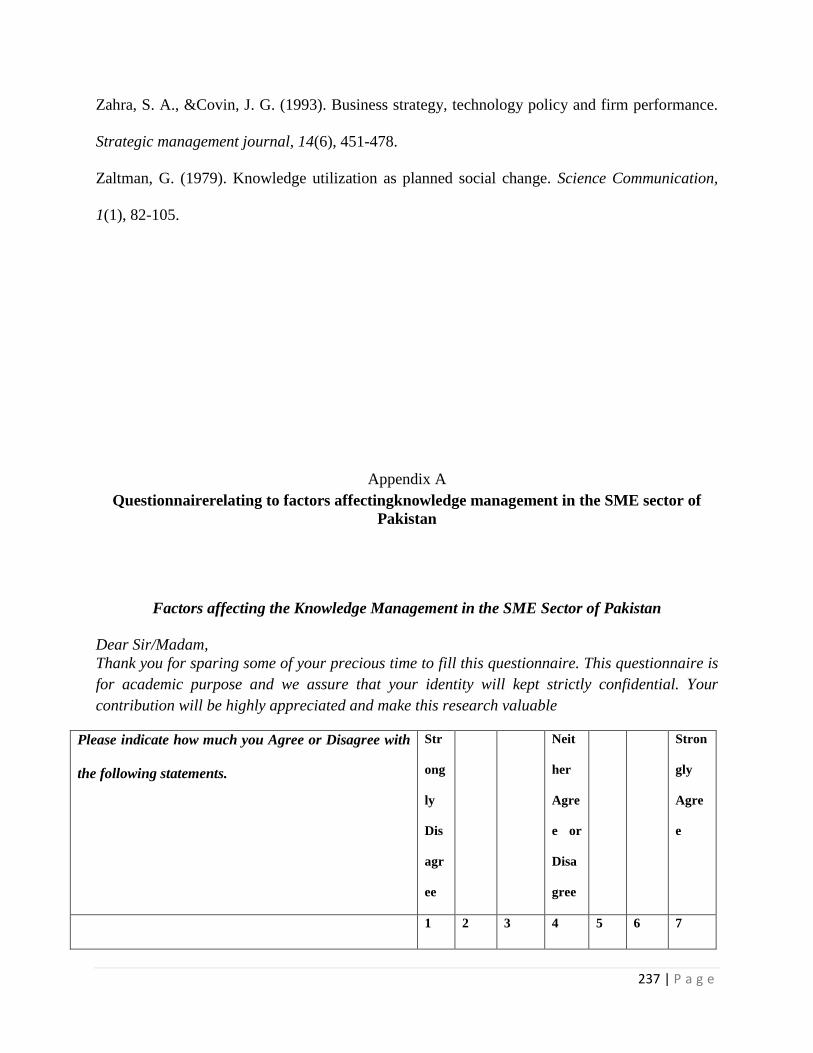
237 | P a g e
Zahra, S. A., &Covin, J. G. (1993). Business strategy, technology policy and firm performance.
Strategic management journal, 14(6), 451-478.
Zaltman, G. (1979). Knowledge utilization as planned social change. Science Communication,
1(1), 82-105.
Appendix A
Questionnairerelating to factors affectingknowledge management in the SME sector of
Pakistan
Factors affecting the Knowledge Management in the SME Sector of Pakistan
Dear Sir/Madam,
Thank you for sparing some of your precious time to fill this questionnaire. This questionnaire is
for academic purpose and we assure that your identity will kept strictly confidential. Your
contribution will be highly appreciated and make this research valuable
Please indicate how much you Agree or Disagree with
the following statements.
Str
ong
ly
Dis
agr
ee
Neit
her
Agre
e or
Disa
gree
Stron
gly
Agre
e
1 2 3 4 5 6 7
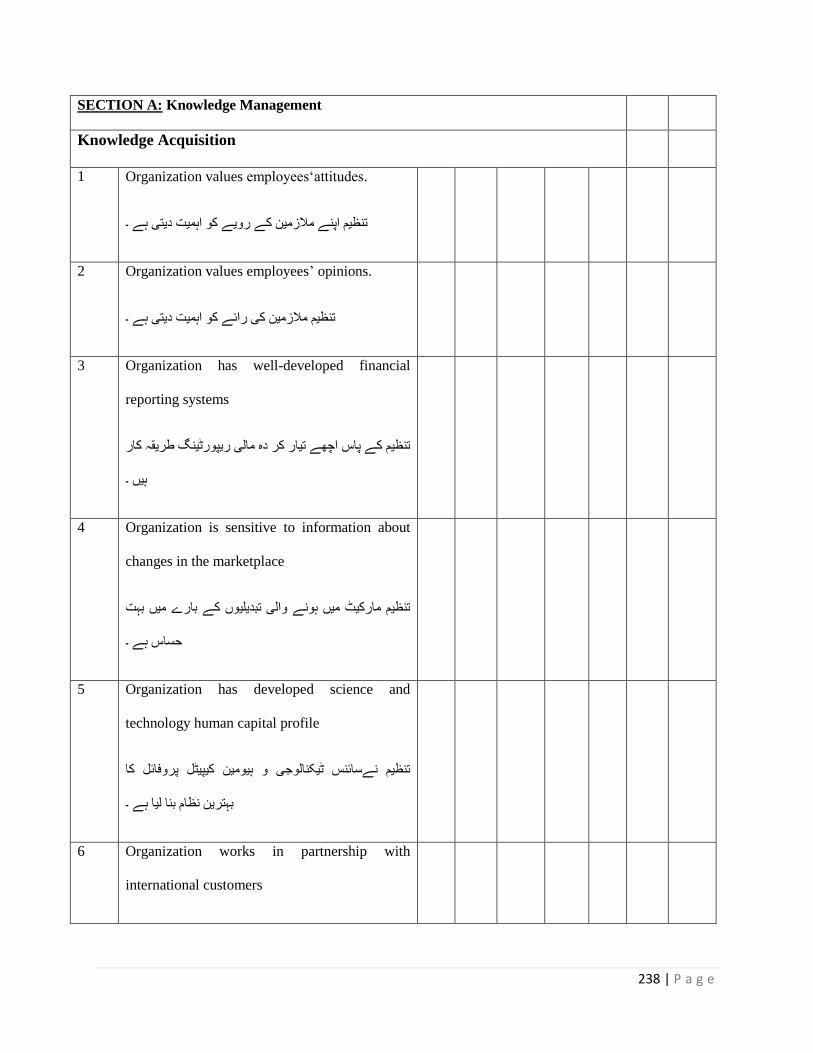
238 | P a g e
SECTION A: Knowledge Management
Knowledge Acquisition
1 Organization values employees‘attitudes.
دیتی ہے ۔تنظیم اپنے ملازمین کے رویے کو اہمیت
2 Organization values employees’ opinions.
تنظیم ملازمین کی رائے کو اہمیت دیتی ہے ۔
3 Organization has well-developed financial
reporting systems
ریقہ کار تنظیم کے پاس اچھے تیار کر دہ مالی ریپورٹینگ ط
ہیں ۔
4 Organization is sensitive to information about
changes in the marketplace
یں بہت تنظیم مارکیٹ میں ہونے والی تبدیلیوں کے بارے م
حساس ہے ۔
5 Organization has developed science and
technology human capital profile
وفائل کا کیپیٹل پرتنظیم نےسائنس ٹیکنالوجی و ہیومین
بہترین نظام بنا لیا ہے ۔
6 Organization works in partnership with
international customers
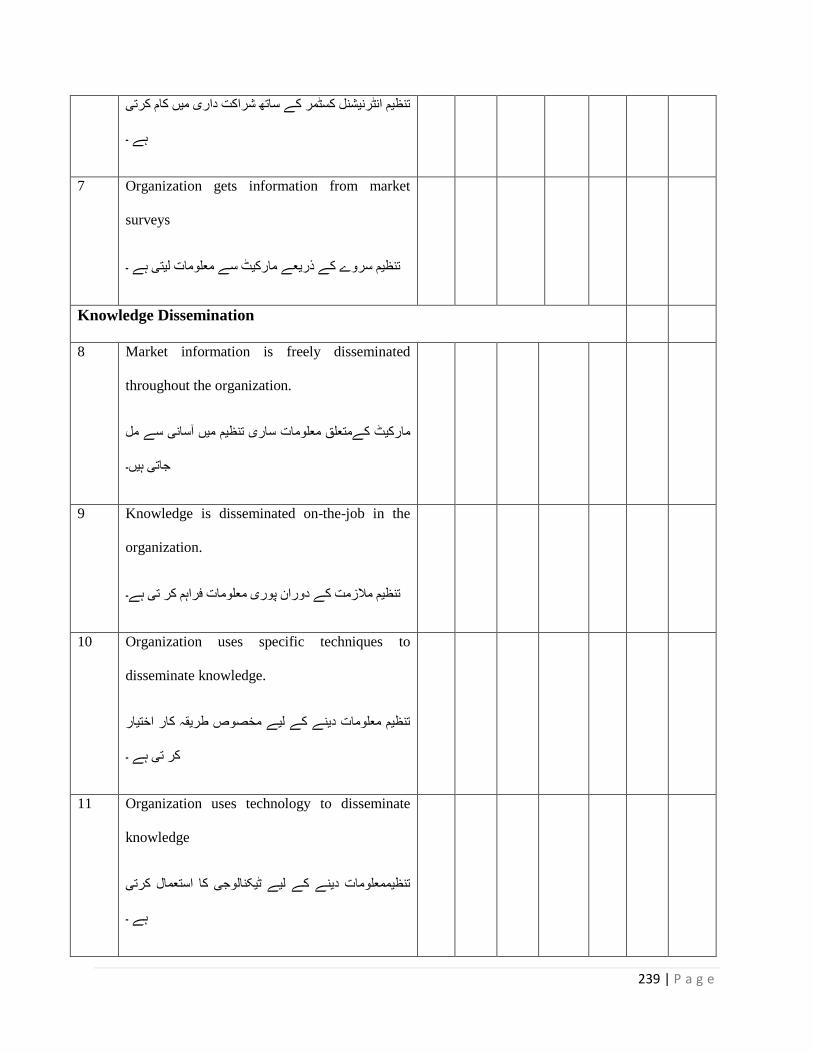
239 | P a g e
ں کام کرتی تنظیم انٹرنیشنل کسٹمر کے ساتھ شراکت داری می
ہے ۔
7 Organization gets information from market
surveys
ے ۔مارکیٹ سے معلومات لیتی ہتنظیم سروے کے ذریعے
Knowledge Dissemination
8 Market information is freely disseminated
throughout the organization.
ے مل مارکیٹ کےمتعلق معلومات ساری تنظیم میں اسٓانی س
جاتی ہیں۔
9 Knowledge is disseminated on-the-job in the
organization.
۔تنظیم ملازمت کے دوران پوری معلومات فراہم کر تی ہے
10 Organization uses specific techniques to
disseminate knowledge.
تیار تنظیم معلومات دینے کے لیے مخصوص طریقہ کار اخ
کر تی ہے ۔
11 Organization uses technology to disseminate
knowledge
ل کرتی تنظیممعلومات دینے کے لیے ٹیکنالوجی کا استعما
ہے ۔

240 | P a g e
12 Organization prefers written communication
۔ تنظیم بات چیت لکھ کر کرنے کو تر جیح دیتی ہے
Responsiveness to Knowledge
13 Organization responds to customers
کسٹمر کے سوالات کا جواب دیتی ہے ۔تنظیم اپنے
14 Organization responds to technology
تنظیم ٹیکنالوجی کو اہمیت دیتی ہے ۔
15 Organization has well-developed marketing
function.
ار ہیں ۔تنظیم کے پاس اچھے تیار کر دہ مارکیٹنگ طریقہ ک
16 Organization responds to competitors
تنظیم اپنے مد مقابل کے مطابق اقدامات کر تی ہے ۔
17 Organization is flexible and opportunistic
ھاتی ہے تنظیم لچکیلہ رویہ رکھتی ہے اور موقع سے فائدہاٹ
۔
SECTION B:Marketing Orientation
Customer Orientation
18 Organization shows commitment to customers.
تی ہے ۔تنظیم اپنے کسٹمر کے ساتھ واعدے کی پابندی کر
19 Organization creates services that offer value

241 | P a g e
for customers.
میت دیتے تنظیم کسٹمر کو ایسی سروسز دیتی ہے جنکو وہ اہ
ہیں ۔
20 Organization understands customer needs
تنظیم اپنے کسٹمر کی ضروریات کو سمجھتی ہے ۔
21 Customer satisfaction is a major objective in my
organization.
میری تنظیم کا بڑا مقصد کسٹمر کا اطمنان ہے ۔
22 Organization measures customer satisfaction.
کسٹمر کے اطمنان کو ناپتی ہے ۔تنظیم اپنے
23 Organization provides follow-up services.
تنظیم مسلسل خدمات مہیا کر تی ہے ۔
Competitor Orientation
24 People in charge of various services discuss
competitor information in my organization.
ل میں مختلف سروسز کے انچارج اپنے مقابمیری تنظیم
تنظیموں کی معلومات پر تبادلہ خیال کر تے ہیں ۔
25 People in charge of various service units
respond rapidly to competitors' actions in my
organization.

242 | P a g e
ل میری تنظیم میں مختلف سروسزکے انچارج اپنے مقاب
جواب دیتے ہیں ۔ تنظیم کی حکمت ََ عملی پر فوراَ
26 Top managers discuss competitors' strategies in
my organization.
لہ خیال کر ٹاپ مینیجر اپنے مقابل تنظیم کی ترکیب پر تباد
تےہیں ۔
27 Top managers target opportunities for
competitive advantage in my organization.
تنظیم ٹاپ مینیجر ان مواقع کی نشاندہی کرتے ہیں جو ہماری
کو مد مقابل پر برتریدلائے ۔
Interfunctional Coordination
28 Various service units work close together to
meet customer needs in my organization.
ے میری تنظیم میں مختلف سروسز یونٹ مل کر کام کرت
ہینتاکہ کسٹمر کی ضرورت کو پورا کیا جا سکے ۔
29 Various service units share business information
with each other in my organization.
مات کا کاروباری معلومیری تنظیم میں مختلف سروسز یونٹ
تبادلہ خیال کر تے ہیں ۔
30 Business strategies are integrated between
different service units in my organization.

243 | P a g e
ونٹ میں میری تنظیم میں کاروباری ترکیب مختلف سروسز ی
یکجا ہیں ۔
31 All service units work together in offering value
to the customer in my organization.
میری تنظیم میں تمام سروسز یونٹ ملکر کسٹمر کو
منفرادیتپیش کرتے ہیں ۔
32 Different service units share resources with each
other in my organization.
و میں مختلف سروسز یونٹ ایک دوسرے کمیری تنظیم
وسائل مہیا کرتے ہیں ۔
SECTION C:Learning Orientation
Commitment to Learning
33 Managers basically agree that our
organization’s ability to learn is the key to our
competitive advantage.
م اتفاق کرتے ہیں کہ ہماری تنظیمینیجر اس بات سے
ری دلا کیسیکھنے کی قابلیت ہمیں ہمارے مد مقابل پر برت
سکتی ہے ۔
34 The basic values of my organization include
learning as a key to improvement.
ی کنجی میری تنظیم کی بنیادی اہمیت میں سیکھنا بہتری ک
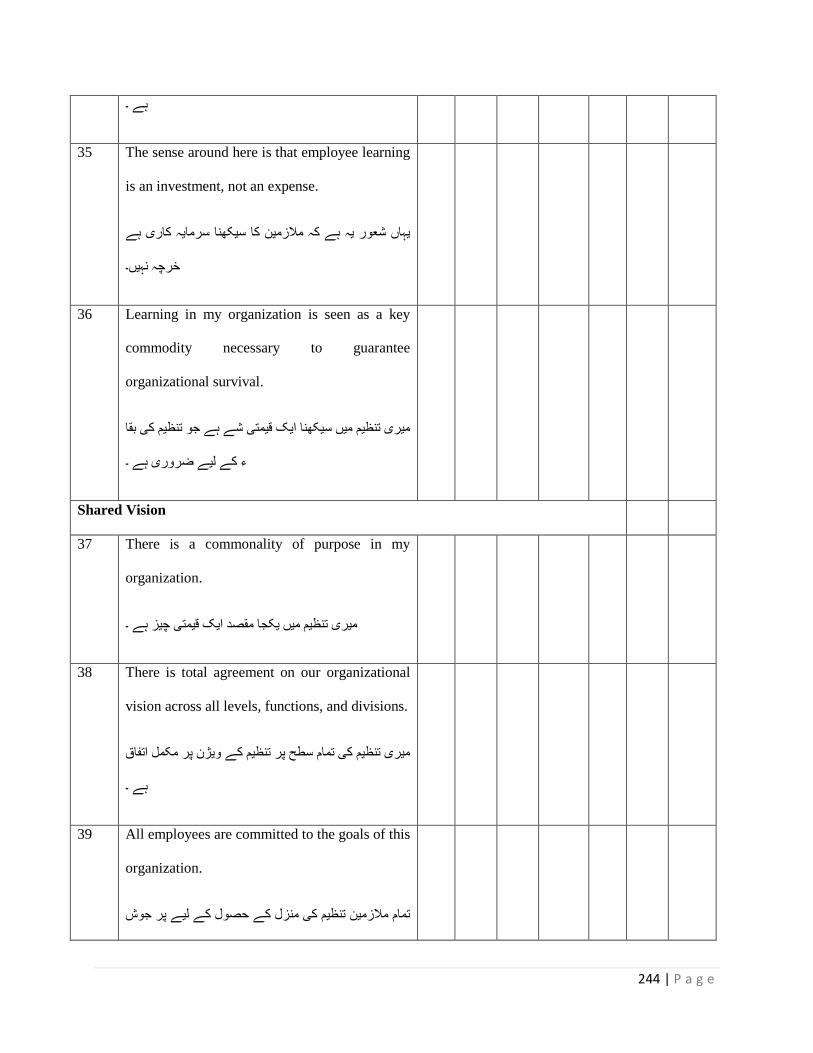
244 | P a g e
ہے ۔
35 The sense around here is that employee learning
is an investment, not an expense.
ہے یہاں شعور یہ ہے کہ ملازمین کا سیکھنا سرمایہ کاری
خرچہ نہیں۔
36 Learning in my organization is seen as a key
commodity necessary to guarantee
organizational survival.
یم کی بقا میری تنظیم میں سیکھنا ایک قیمتی شے ہے جو تنظ
ء کے لیے ضروری ہے ۔
Shared Vision
37 There is a commonality of purpose in my
organization.
میری تنظیم میں یکجا مقصد ایک قیمتی چیز ہے ۔
38 There is total agreement on our organizational
vision across all levels, functions, and divisions.
مل اتفاق میری تنظیم کی تمام سطح پر تنظیم کے ویژن پر مک
ہے ۔
39 All employees are committed to the goals of this
organization.
جوش تمام ملازمین تنظیم کی منزل کے حصول کے لیے پر
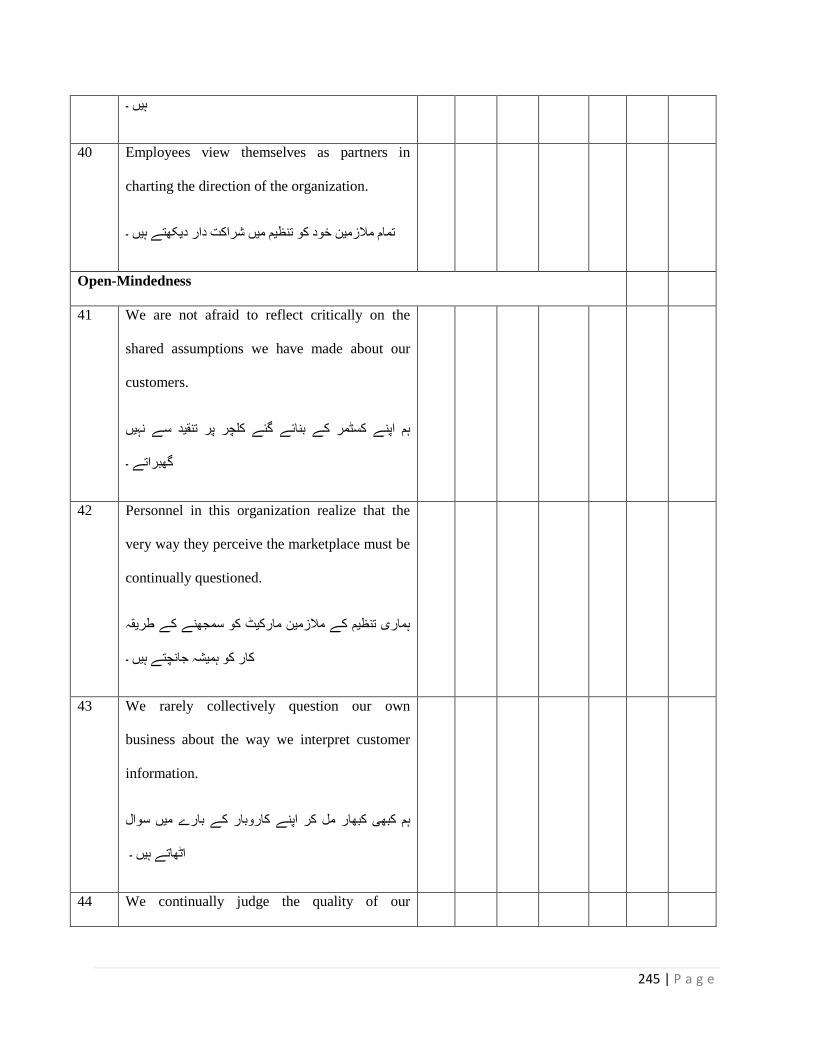
245 | P a g e
ہیں ۔
40 Employees view themselves as partners in
charting the direction of the organization.
یں ۔تمام ملازمین خود کو تنظیم میں شراکت دار دیکھتے ہ
Open-Mindedness
41 We are not afraid to reflect critically on the
shared assumptions we have made about our
customers.
ے نہیں ہم اپنے کسٹمر کے بنائے گئے کلچر پر تنقید س
گھبراتے ۔
42 Personnel in this organization realize that the
very way they perceive the marketplace must be
continually questioned.
یقہ طرہماری تنظیم کے ملازمین مارکیٹ کو سمجھنے کے
کار کو ہمیشہ جانچتے ہیں ۔
43 We rarely collectively question our own
business about the way we interpret customer
information.
وال ہم کبھی کبھار مل کر اپنے کاروبار کے بارے میں س
اٹھاتے ہیں ۔
44 We continually judge the quality of our

246 | P a g e
decisions and activities taken over time.
قت میں ہم اپنے فیصلوں کو مسلسل پرکھتے ہیں جو ایک و
کیے گئے ہیں ۔
Creativity
45 Organization suggests new ways to achieve
goals or objectives.
کرتی تنظیم منزل کے حصول کے لیے نئے طریقے تجویز
ہے ۔
46 Organization comes up with new and practical
ideas to improve performance.
تنظٰم نئے اور قابل عمل خیالات لاتی ہے تاکہ عمل میں
بہتری لائی جا سکے۔
47 Organization searches out new technologies,
processes, techniques, and/or product ideas.
ور طریقہ اپنی اشیاء/خدمات کے لیے نئی ٹیکنالوجی اتنظٰیم
کار ڈھونڈتی ہے ۔
48 Organization suggests new ways to increase
quality.
جویز کرتی تنظٰم میعار کو بہتر بنانے کے لیے نئے راستے ت
ہے ۔
49 Organization promotes and champions ideas to
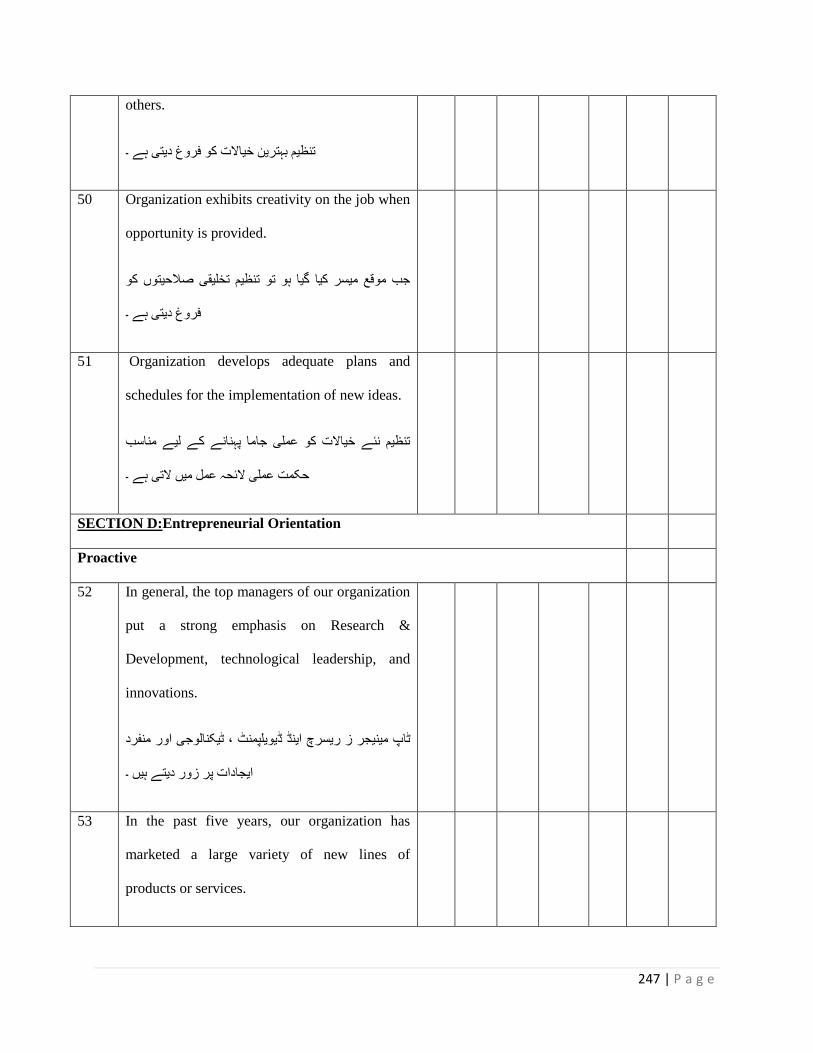
247 | P a g e
others.
بہترین خیالات کو فروغ دیتی ہے ۔ تنظیم
50 Organization exhibits creativity on the job when
opportunity is provided.
توں کو جب موقع میسر کیا گیا ہو تو تنظیم تخلیقی صلاحی
فروغ دیتی ہے ۔
51 Organization develops adequate plans and
schedules for the implementation of new ideas.
اسب تنظیم نئے خیالات کو عملی جاما پہنانے کے لیے من
حکمت عملی لائحہ عمل میں لاتی ہے ۔
SECTION D:Entrepreneurial Orientation
Proactive
52 In general, the top managers of our organization
put a strong emphasis on Research &
Development, technological leadership, and
innovations.
ور منفرد ٹاپ مینیجر ز ریسرچ اینڈ ڈیویلپمنٹ ، ٹیکنالوجی ا
ایجادات پر زور دیتے ہیں ۔
53 In the past five years, our organization has
marketed a large variety of new lines of
products or services.
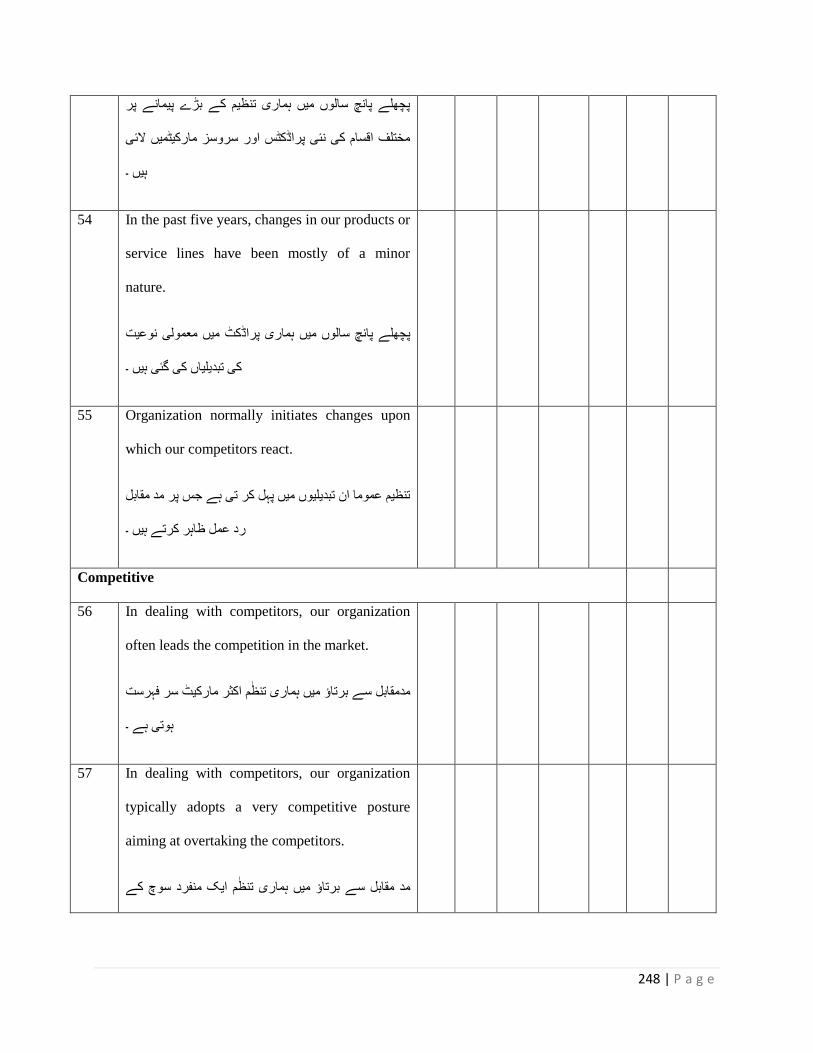
248 | P a g e
پر پچھلے پانچ سالوں میں ہماری تنظیم کے بڑے پیمانے
ں لائی مختلف اقسام کی نئی پراڈکٹس اور سروسز مارکیٹمی
ہیں ۔
54 In the past five years, changes in our products or
service lines have been mostly of a minor
nature.
یت ہماری پراڈکٹ میں معمولی نوعپچھلے پانچ سالوں میں
کی تبدیلیاں کی گئی ہیں ۔
55 Organization normally initiates changes upon
which our competitors react.
د مقابل تنظیم عموما ان تبدیلیوں میں پہل کر تی ہے جس پر م
رد عمل ظاہر کرتے ہیں ۔
Competitive
56 In dealing with competitors, our organization
often leads the competition in the market.
ہرست مدمقابل سے برتاؤ میں ہماری تنظٰم اکثر مارکیٹ سر ف
ہوتی ہے ۔
57 In dealing with competitors, our organization
typically adopts a very competitive posture
aiming at overtaking the competitors.
ے مد مقابل سے برتاؤ میں ہماری تنظٰم ایک منفرد سوچ ک

249 | P a g e
ساتھ أگے بڑھتی ہے ۔
58 Organization is aggressive and intensely
competitive in nature.
تنظیم جارحیت پسند اور شدید مقابلہ پسند ہے
Innovative
59 Management actively responds to the adoption
of “new ways of doing things” by main
competitors.
انتظامیہ مستعدی سے اپنے مدمقابل کے اقدامات کا حل
کرتی ہے ۔
60 Organization is willing to try new ways of doing
things and seek unusual, novel solutions.
ر کرنے کے نئے طریقوں کو اپنانے اور غیتنظیم کام
معمولی ڈرامائی حل تلاش کرنے کی چاہت رکھتی ہے ۔
61 Organization encourages people to think and
behave in original and novel ways.
رنے تنظیم ان لوگوں کی حوصلہ افزائیکرتی ہے جو کام ک
۔ میں جدت اور نئی تکنیک ازٓماتی ہے
Source: Developed from Wang (2008); Okpara (2009); Darroch (2005); andCalantone (2002).
SECTION II:
Personal Profile
1. Gender

250 | P a g e
(a) Male (b) Female
2. Age
(i)21–30 (ii) >30–40 (iii) >40–50 (iv) >50 and above
3. Marital Status
(a) Married (b) Single (c) Widowed (d) Divorced


