UCD GEARY INSTITUTE FOR PUBLIC POLICY DISCUSSION PAPER SERIES A Distributional Analysis of Upper Secondary School Performance John Cullinan National University of Ireland, Galway Kevin Denny University College Dublin Darragh Flannery University of Limerick Geary WP2018/08 April 12, 2018 UCD Geary Institute Discussion Papers often represent preliminary work and are circulated to encourage discussion. Citation of such a paper should account for its provisional character. A revised version may be available directly from the author. Any opinions expressed here are those of the author(s) and not those of UCD Geary Institute. Research published in this series may include views on policy, but the institute itself takes no institutional policy positions.
Transcript
UCD GEARY INSTITUTE FOR PUBLIC POLICY DISCUSSION PAPER SERIES
A Distributional Analysis of Upper Secondary School Performance
John Cullinan National University of Ireland, Galway
Kevin Denny
University College Dublin
Darragh Flannery University of Limerick
Geary WP2018/08 April 12, 2018
UCD Geary Institute Discussion Papers often represent preliminary work and are circulated to encourage discussion. Citation of such a paper should account for its provisional character. A revised version may be available directly from the author.
Any opinions expressed here are those of the author(s) and not those of UCD Geary Institute. Research published in this
series may include views on policy, but the institute itself takes no institutional policy positions.
A Distributional Analysis of Upper Secondary School Performance
John Cullinana, Kevin Dennyb and Darragh Flanneryc*
a JE Cairnes School of Business & Economics, National University of Ireland, Galway,
We examine the relationship between the distribution of upper secondary school
performance and a range of individual and school level characteristics using
unconditional quantile regression methods and data from Ireland. We find that
determinants such as social class, maternal unemployment, extra private tuition, and
working part-time have differential effects for low and high ability students and that
important insights are lost by focusing on the conditional mean. The implication is that
while certain factors can impact on whether or not a student is likely to proceed to higher
education, other factors may affect where students go and what they study.
KEY WORDS
Secondary school performance; Distribution; Unconditional quantile regression; Ireland.
JEL CLASSIFICATION
I20, I21, J00, J01
1
1. INTRODUCTION
The financial and non-pecuniary returns to higher levels of education are well
documented. Enhanced employment prospects and increased lifecycle earnings, as well
as improved levels of self-reported health, job satisfaction and general happiness, are all
associated with greater human capital accumulation (Flannery and O’Donoghue, 2017;
Dolton and Sandi, 2017; Dickson and Harmon, 2011; Oreopoulos and Salvanes, 2011).
These links help motivate studies that explore the determinants of participation and
performance in higher education, as well as at other levels of education. In this context,
this paper focuses on the performance of upper secondary students in Ireland in their
terminal examination, since this performance is likely to have a significant impact on
whether a young person transitions to third level education and may also influence where
and what they study (Cullinan et al., 2013; Flannery and Cullinan, 2014). More
specifically, we examine the relationship between the distribution of upper secondary
school performance and a range of individual, socioeconomic and school level
characteristics using unconditional quantile regression methods.
Numerous previous Irish and international studies have examined upper secondary
performance and progression to tertiary education. Denny and Flannery (2017) provide
a summary of this literature, showing the potential role that graduate earning premiums
and socioeconomic factors play in determining participation in third level education. For
example, studies specific to Ireland have highlighted persistent inequalities in the social
class or socioeconomic composition of those in higher education (O’Connell et al., 2006;
Smyth and Hannon, 2007; McCoy and Smyth, 2011; Flannery and O’Donoghue, 2009;
Denny, 2014). Importantly, however, Flannery and Cullinan (2014) and Denny (2014)
show that this socioeconomic gap tends to be strongly mediated by attainment in
secondary school, a finding that is consistent with research from the UK (Chowdry et al.,
2013). The implication is that one of the main, if not the main, reasons that young people
from lower socioeconomic backgrounds are less likely to progress to third level
education is because they tend to do worse in upper secondary education. This has strong
implications for policy, since it suggests a limited role for interventions at the point of
entry to higher education, such as financial supports 1 . It also suggests that a more
1 Heckman and Carneiro (2002) and Dearden et al. (2004) also argue, for the US and UK respectively, that credit
constraints have a quite small impact on progression to third level education.
2
complete understanding of the determinants of academic performance in upper
secondary education is required if we wish to address socioeconomic disparities in third
level outcomes.
In this context, one of the weaknesses in much of the literature to date has been a focus
on how potential determinants, such as socioeconomic status (SES), impact on the
‘conditional mean’ of secondary school performance. Using standard regression
techniques, such as ordinary least squares (OLS), most previous studies have tended to
ignore the possibility that some determinants of performance may have very different
effects at different points of the performance distribution. In fact, analysing the entire
distribution of academic performance, as opposed to just the conditional mean, is crucial.
This is because significant information is likely to be concealed by a mean analysis if some
factors have meaningfully different impacts at say low and high levels of achievement.
Moreover from a policy perspective, where progression to college is rationed, the effects
of a given variable on attainment at different quantiles can have very different
implications. This is because attainment at lower quantiles may determine whether an
individual progresses to college, while attainment at higher quantiles may determine
which higher education institution (HEI) they chose to study at, or which course of study
they pursue. Therefore, in this paper, we estimate whether a range of factors such as
gender, social class and school type have differential effects on upper secondary
attainment for lower and higher ability students. This analysis, which is unique in the
Irish context and rare in the international literature, has important implications for
policy.
The paper is structured as follows: Section 2 presents a review of the relevant literature,
while Section 3 sets out the institutional context. Section 4 presents our data and
methods and Section 5 the main empirical results. Finally, Section 6 summarises the
implications of our results and findings and concludes.
3
2. LITERATURE
There is a large international literature that examines the determinants of academic
performance in secondary school with a number of studies focussing on the role and
importance of SES. For example, Blundell et al. (2000) estimated that having a father in a
professional and/or managerial social class was associated with better A level attainment
in the UK. Guimarães and Sampaio (2013) find a similar result for Brazil, showing that
higher household income and parental education levels were associated with better
performance in a university entrance exam. Fuchs and Weissman (2007) used
Programme for International Student Assessment (PISA) data to show strong family
background influences performance in standardised reading, mathematical and science
exams for second level students across a range of countries. They also highlighted the
positive role that factors such as the existence of formal exit exams and greater school
autonomy may have on academic performance. Weissman (2016) focused on the
mathematics score in PISA data from 2003 to estimate the relative impact of family
background, school resources, and institutional level factors on performance. He found
that resource inputs such as expenditure per student appear to have limited effects on
student achievement but that socioeconomic factors, such as parental employment status
and social class, had significant effects. Furthermore, using the number of books present
in a home as a proxy for the educational, social, and economic background of the students’
families, it was found that this has a large and significant effect on student performance.
Other factors such as school and class size may also impact student performance but the
evidence is mixed as to the direction of this impact. For example, Krassel and Heinesen
(2014) find that larger class sizes are negatively associated with exam performance in
secondary level education, while Denny and Oppedisano (2011) suggest that bigger
classes lead to better results when analysing PISA data for the UK and USA. On school size,
Bradley and Taylor (1998) present evidence from the UK that students in larger schools
perform better, while Foreman-Peck and Foreman-Peck (2006) show the opposite using
Welsh data. Jepsen (2015) provides a useful overview of the class size literature, while
Leithwood and Jantzi (2009) and Humlum and Smith (2015) provide good summaries of
the prominent empirical work that has explored the issue of school size.
4
School type may also be an influential factor, with Dearden et al. (2002), Sullivan and
Heath (2003) and Sullivan et al. (2014) all showing that private (fee paying) schooling
raises academic achievement and subsequent labour market outcomes2. Other notable
studies have shown a positive impact of the conversion of disadvantaged schools to
academies on end of school pupil performance (Eyles et al., 2016), that students in
voucher based schools perform worse than those in municipal based schools (Hinnerich
and Vlachos, 2017), and that teacher abilities have a negligible impact on average student
achievement but the achievement of high-aptitude students improved when matched
with teachers with high cognitive abilities and suffered when matched with teachers with
high social abilities (Gronqvist and Vlachos, 2016).
In an Irish context, Denny (2010) and Denny and Flannery (2017) provide evidence that
being female, higher paternal SES, and higher parental education levels may all positively
influence a young person’s performance in upper secondary education. Other studies to
have specifically explored upper secondary exam performance in Ireland include Smyth
(1999), who used data from 1994 to show a similar social gradient while controlling for
a range of school level factors, such as school organisation and pupil involvement in
extracurricular activities e.g. sport. More recently, Smyth (2009) explored the impact of
extra paid tuition (outside of normal schooling) on student performance and found that
private tuition yields no advantages in terms of upper secondary examination
performance when other factors such as student aspirations and quantity of homework
hours are accounted for. Furthermore, Lunn et al. (2013) used the 2007 wave of the
School Leavers Survey to show evidence of the positive impact that participating in sport
can have on upper secondary exam performance, while Smyth and McCoy (2013) provide
a useful summary of studies that have focused on the potential influence that school and
teacher characteristics may have on broader upper secondary outcomes.
While insightful, all of the aforementioned studies focused on the impact of one or more
determinants on the conditional mean of an outcome variable, such as secondary school
performance. In other words, they all ignored the possibility of differential effects of
2 Since school type is to some extent a choice variable, controlling for endogeneity may be important. An analysis
of performance in PISA tests for Ireland found that once selection was controlled for, the apparent benefit of fee
paying schools disappeared (Pfefferman and Landesman, 2011)
5
determinants across the distribution of performance outcomes. As noted, this may be
problematic if certain factors (in)significantly influence performance depending on the
point of the achievement distribution that an individual lies. Studies such as Gorry
(2016), Lounkaew (2013), Haile and Nguyen (2008), and Eide and Showalter (1998) are
some of the few previous studies that have considered this issue using quantile
regression methods. For example, Gorry (2016) focused on the impact of sports
participation on the grade point average (GPA) of American high school students and
showed a greater impact for students in the lower end of the GPA distribution.
In other earlier studies, Lounkaew (2013) used PISA literacy test scores in Thailand to
show significant variation in the impact of socioeconomic and school level factors across
the achievement distribution, while Haile and Nguyen (2008) investigated determinants
of high school students’ academic attainment in mathematics, reading and science in the
US, finding that Blacks and Hispanics tend to fare worse in their attainment at higher
quantiles, particularly in science. They also showed that the effects of family background
factors such as parental education and father’s occupation varied across quantiles of the
test score distribution. Eide and Showalter (1998) explored the impact of school
characteristics on the change in math performance in US high school students from
sophomore to senior year and found significant differences in the impact of variables
such as school expenditures and school year length across the distribution in comparison
to the average effects. For instance, they found that increased per pupil expenditures
helped increase maths performance for those in the lower end of the achievement
distribution but had no impact on those at the upper end, while the average effect was
not found to be significant. Such findings illustrate the value of moving beyond the mean
when considering student academic performance, something that is done in this paper.
Overall, while a small number of papers have considered the distribution of academic
performance in secondary school, the vast majority of studies have employed a
conditional (as opposed to unconditional) quantile regression approach, a notable
exception being Lounkaew (2013). This is potentially problematic, since according to
Borah and Basu (2013), conditional quantile regression can generate results that are hard
to interpret in a policy or population context. Moreover, they may not be generalizable.
Unconditional quantile regression, on the other hand, provides results that are more
6
interpretable, since it marginalizes the effect over the distributions of the other
covariates in the model (Borah and Basu, 2013). A further drawback of a number of
previous studies is a focus on just one possible determinant of academic performance.
Our unique dataset provides a range of student, socioeconomic and school level
characteristics that can be considered.
3. INSTITUTIONAL CONTEXT
HEIs in Ireland include universities, institutes of technology (IoTs), colleges of education
(CoEs), as well as a small number of other public and private colleges, with a competitive
entry system based mainly on grades achieved in their terminal upper secondary
examination, otherwise known as the Leaving Certificate. These grades are converted
into a points score generally referred to as Central Applications Office (CAO) points, with
the number of points an individual receives helping to determine the type of course they
can pursue. HEIs allocate places to students with the highest CAO points who wish to take
that course, subject to constraints on course student numbers. As the number of students
applying for places generally exceeds the supply, the system is typified by excess demand.
Therefore, performing as well as possible in the terminal upper secondary examination
is significant in an Irish context.
In addition, the type of course pursued is also heavily influenced by this Leaving
Certificate performance, as there is considerable heterogeneity in the number of CAO
points necessary to pursue different pathways and programmes of study. Universities
and CoEs generally provide honours bachelor degree level courses with a focus on more
traditional academic fields of study such as health, social sciences and humanities. This
sector is generally seen as more ‘prestigious’ relative to the IoT sector, where both
ordinary and honours bachelor degrees and a focus on engineering, construction and care
courses are more common. These differences are reflected in the fact that entry to the
university sector generally requires a higher number of CAO points compared to a course
in an IoT – see McCoy and Smyth (2011), Denny (2014) and Flannery and Cullinan (2017)
for more in depth considerations of these differences. As McCoy and Smyth (2011) also
note, participants in the different sectors face different employment prospects, with a
higher probability of employment for those with a university education (Kelly et al.,
2010). Therefore, if upper secondary school performance is influenced by an individual’s
7
SES or other factors, the extent of that influence may not necessarily prevent
participation in higher education, but may affect the type of study and subsequent career
path of that individual in the Irish education system.
Young people in Ireland typically spend 5 or 6 years in upper secondary education before
taking their terminal exam. The length of time may vary depending on whether a student
completes a transition year programme; this is an optional extra year of study between
lower and upper secondary school and is free from formal examinations that may be
offered within a school. Secondary schools in Ireland are largely State funded and of the
763 secondary schools in Ireland in 2016, only 52 (7%) were fee paying (Department of
Education and Skills, 2017). All school types follow the same State prescribed curriculum
and take the same State public examinations, including the Leaving Certificate
examinations. From a policy perspective, second level schools that are deemed to be
underprivileged may access supplementary resources such as extra learning support for
teachers and a home-to-community liaison programme through the Delivery of Equality
of Opportunity In Schools (DEIS) system (Department of Education and Science, 2005).
4. DATA AND METHODS
4.1 Data
The data used is from the 2007 wave of the School Leavers’ Survey (SLS) from Ireland,
with school leavers who exited the second-level system in the 2004/05 academic year
providing the reference cohort for the survey. The SLS is based on a stratified random
sample of those leaving the second-level system, with a total sample size of 2,025
respondents 3 . It collects a wide range of individual, demographic, social, school,
education and labour market related information. The SLS dataset also contains the
Leaving Certificate examination grades of the student which is used to calculate the CAO
points they achieved. Furthermore, information on whether or not an individual has
undertaken any extra private tuition outside of regular school hours while in upper
secondary education is available, as are data on whether a student participated in a
3 See Byrne et al. (2008) for more details on this dataset.
8
transition year programme while in school and whether they worked in part-time
employment or participated in formal sporting activities while in their final year of study.
Information on whether individuals applied to enter higher education is also available in
the SLS, as are certain school-level variables such as whether the student attended a
school that is fee paying or not, or if a school is designated as having DEIS status, and
these are also included in our analysis. We also include a dummy variable for whether a
student attended a large school, defined as one above the median enrolment size of
schools within our sample (over 693 students). Our focus is on young people that
completed upper secondary education and their Leaving Certificate examination. Of the
2,025 young people surveyed, 1,221 did so. Using only those with reliable examination
result information from this group leaves us with an estimation sample of 1,032
individuals. Summary statistics for our sample and a more detailed description of these
variables are presented in Table 1.
[Insert Table 1 about here]
To better explore heterogeneity around the mean of our school performance variable, we
also present kernel density functions of CAO points across some of our key independent
variables, namely parental social class and gender. Figure 1 illustrates the social gradient
in performance with those from higher socioeconomic backgrounds (higher or lower
professional) more heavily concentrated towards the upper end of the performance
distribution relative to those from non-manual, skilled manual, semi-skilled or unskilled
manual backgrounds. For gender we see little difference between males and females at
the bottom of the performance distribution, while females outperform males at the upper
end of the distribution – see Figure 2.
[Insert Figure 1 and Figure 2 about here]
9
4.2 Methods
In order to model the relationship between upper secondary school performance and the
personal, socioeconomic, and school characteristics listed in Table 1, we use a number of
estimation approaches. To begin, we first estimate a standard linear regression model,
such that:
𝐶𝐴𝑂𝑖 = 𝛽0 + 𝛽1𝐗𝑖 + 𝜀𝑖 [1]
where 𝐶𝐴𝑂𝑖 represents the CAO points of student 𝑖 and 𝐗𝑖 is a vector of student- and
school-level characteristics such as gender, parental social class, parental employment
status and school size. 𝛽1 is a vector of parameters to be estimated and 𝜀𝑖 represents the
error term.
As mentioned previously, one of the main contributions of this study is to go beyond a
conditional mean analysis such as provided by an OLS estimation of Equation [1]. To this
end, we also estimate the unconditional quantile regression (UQR) model proposed by
Firpo et al. (2009)4. This technique is similar to that used in Lounkaew (2013) and has
been applied in other fields of economics such as labour (Galego and Pereira, 2014),
development (Agyire-Tettey et al., 2017), health (Borah and Basu, 2013) and hedonic
house price models (Fortin et al., 2011). The UQR technique is based on the use of the re-
centered influence function (RIF). To estimate the UQR model we initially calculate the
RIF of the dependent variable (CAO Points), where the RIF for the τth quantile is given as:
𝑅𝐼𝐹(𝑌; �̂�𝜏) = �̂�𝜏 +𝜏 − 𝐷(𝑌 ≤ �̂�𝜏)
𝑓𝐼(𝑞𝜏) [2]
where 𝑓𝐼(𝑞𝜏) is the marginal density of Y at point 𝑞𝜏 estimated by kernel density methods,
𝑞𝜏 is the sample quantile and 𝐷(𝑌 ≤ �̂�𝜏) is an indicator function determining whether the
outcome variable is less than the 𝜏 quantile or otherwise.
4 The quantile regressions of Koenker and Basset (1978) model conditional quantiles but the interpretation of
these is less straightforward than the approach here since individuals can be, for example, at a high unconditional
quantile but a low conditional one, or vice versa.
10
As noted by Agyire-Tetty et al. (2017), a key feature of the RIF approach as developed by
Firpo et al. (2009) is to replace the outcome variable with the estimated RIF and then
regress this against a set of explanatory variables. Furthermore, Firpo et al. (2009) show
that the RIF quantile regression model may be estimated using OLS with the expected
value of the influence function equal to zero. Thus, this approach allows the estimation of
partial effects for each covariate at various points across the distribution. For our study,
this will translate as the marginal impact of our covariates on CAO Points at a given CAO
percentile and for the purpose of our analysis we present results at the 20th, 40th, 60th and
80th percentiles.
5. EMPIRICAL RESULTS
In Table 2 we present a series of linear regression models with different covariates,
estimated using OLS. Common to all the models is a set of dummy variables indicating
age, gender, socioeconomic background, whether the person’s mother is a homemaker,
whether their father is disabled and whether each parent is unemployed. We then
consider the consequences of adding additional covariates including school
characteristics. What is clear from the first specification is that parental background and
labour market status have large effects. For example, a child from the lowest
socioeconomic category (social class 3) will achieve, on average, almost 70 points fewer
compared to one from the highest category. This is over one half of one standard
deviation and given the highly competitive nature of entry (the so-called ‘points race’)
this could translate to a significantly inferior outcome for a student. As an illustration of
the potential importance of an additional 70 points, the minimum entry points to study
Science in one Irish university in 2016 was 380, while the corresponding minimum to
study Arts was 330. Previous research has shown significantly higher average earnings
for Science graduates compared to Arts graduates in Ireland (Kelly et al., 2010). The
advantage associated with being female is much smaller, around 23 points. Either parent,
and particularly the mother, being unemployed has a much larger negative effect on
attainment as does the father being disabled, which carries a significant penalty of just
under 70 points5.
5 We have excluded the student’s own disability status and their mother’s since neither is statistically significant
at the 5% level. Interestingly, if we interact paternal disability with the student’s gender it is clear that it is
essentially daughters who are affected by this and not sons.
11
[Insert Table 2 about here]
In the second column we add three activities which might enhance or detract from
students’ studies: whether the student worked part-time, whether s/he availed of private
tuition, as well as whether the student was active in sport. Clearly these may be correlated
with unobservable characteristics and therefore the estimated parameters may not be
causal effects. We find all have a practically and statistically significant association with
performance in this model, with working part-time leading to a reduction of 31 points on
average and receiving extra private tuition resulting in 29 extra points. Intuitively, one
might expect that students who are involved in sport are both less academic by nature
and/or are spending less time studying. However our finding that ‘sporty’ students do
better is consistent with the bulk of the literature on the subject6. In terms of magnitude,
the coefficient is comparable to that of gender. In this model the advantage associated
with being female is about 50% larger than the first model.
In the third specification we add several variables associated with the school: whether
the student took a transition year (a less academic school year between junior and senior
cycles), if the school is fee paying, if it has DEIS status (a marker for being from a
disadvantaged area), and if it is a relatively large school. While transition year is a
characteristic of the student, in practice the variation in this is largely between schools.
DEIS status will be negatively correlated with SES which explains the negative coefficient
and also the smaller coefficients on social class compared to the previous models. By the
same logic, one expects fee paying schools to do better, however the effect is not
statistically significant. The simple difference in points between these types of schools in
our sample is 78 (=413-335). Anecdotally, many parents seem to believe there is a causal
effect on points from sending their children to fee paying schools. The results here
suggest the correlation is spurious in the sense that once the model has sufficient controls
the effect goes away7.
6 See Pfeifer and Corneliẞen (2010) for a recent application. Bradley et al. (2013) analyse a single school in
Ireland and find the same pattern as we do. 7 This shows that selection on observables is sufficient to explain the apparent premium to fee paying schools.
Pfefferman & Landesman (2011) compare fee paying status of schools using Irish PISA data. They find that
allowing for selection on unobservables is sufficient to drive the estimated benefit of fee-paying schools to zero
(or less).
12
The final specification adds a dummy variable for whether the individual applied to enter
higher education. This could be interpreted as a marker for student ambition or an
academic temperament. On the other hand, it could clearly be endogenous in that sense
that the decision to apply could reflect their expected results. Nonetheless it is interesting
to see that such students report significantly higher points levels here, by about 80 points.
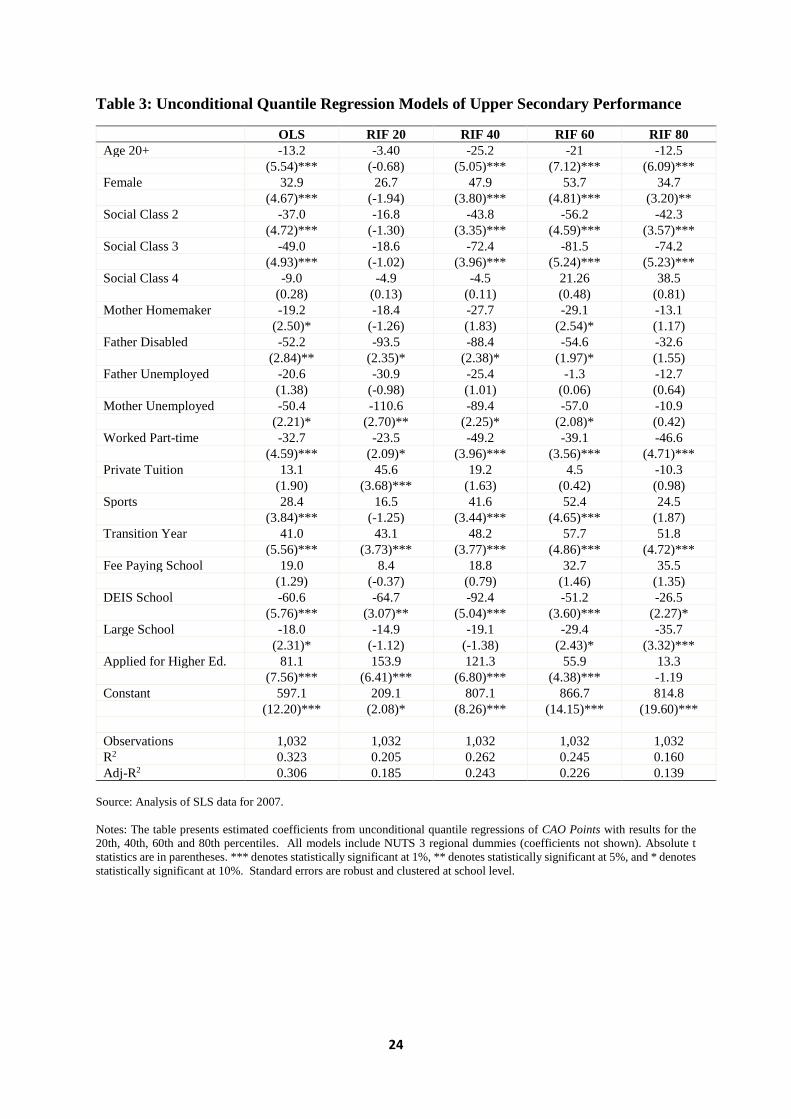
The unconditional quantile regressions are presented in Table 3 using the same
specification as the last model in Table 2, which is repeated in the first column to facilitate
comparison. We estimate four models corresponding to the 20th, 40th, 60th and 80th
percentiles of the dependent variable. If one considers the dummy variables for social
class 2 and 3, it is noticeable that they are larger in magnitude for the higher percentiles
and indeed are not statistically significant for the 20th percentile. So for weaker students,
they are generally not helped nor hindered by their socioeconomic background. By
contrast, at higher percentiles these effects very much come into play – see Figure 3(a).
This is important as who gets high points determines access to the more prestigious
university courses such as medicine, law and engineering. Policy discussions around
access tend to focus simply on what proportion of particular demographic groups
progress to university. These results suggest that attention should also be paid to which
course they progress to, since this is where at least some of the socioeconomic gradient
may be revealed. One could seriously underestimate the extent to which SES influences
educational attainment if one only considers quantity and not quality also. A similar
pattern holds with regard to the negative effect of students working part-time while
preparing for their exams, with a relatively small effect at the 20th percentile and the
effect doubling higher up the distribution – see Figure 3(b).
[Insert Table 3 and Figure 3 about here]
The opposite pattern exists with regard to the mother’s unemployment status where the
effect is much larger at the bottom of the distribution than elsewhere – see Figure 3(c).
This is also true for the coefficient on private tuition which is small and not statistically
significant other than for the 20th percentile (see Figure 3(d)). Interpreted causally, it
suggests that private tuition may help avoid achieving very low points but are of little
benefit otherwise. Variables such as this, where the effects are greatest in the left tail of
13
the distribution of the dependent variable, are likely to influence whether a student
progresses to third level (or not) and if they do it will most likely be to less prestigious
low-point degree courses. Overall what is clear from Table 3 and Figure 3 is that there is
a great deal to be learned from going beyond the analysis of the effect of a variable on the
mean as one does with OLS8.
6. CONCLUSION
With evidence that socioeconomic gaps in higher education participation may be strongly
mediated by attainment in secondary school, a more complete understanding of the
determinants of academic performance in upper secondary education is warranted.
However, the main focus of previous research has been on how potential determinants,
such as SES, impact on the conditional mean of secondary school performance.
Furthermore, most studies that have examined the distribution of academic performance
have tended to employ a conditional quantile approach.
In this paper we present an unconditional quantile regression model of upper secondary
academic performance to consider the importance of a range of factors such as gender,
social class and school type, something that is distinctive in the Irish context and rare in
the international literature. We find that variables such as social class, mother’s
employment status, working part-time and engaging in private tuition have differential
effects for low and high ability students. For example, we show that the negative effects
of lower social class are stronger at the higher percentiles of achievement and not
statistically significant for those at the 20th percentile. Therefore, for weaker students,
they are generally not helped nor hindered by their socioeconomic background but those
at higher percentiles are negatively impacted by lower social class. This is important as
who gets high points determines access to more prestigious university courses. From a
policy perspective, it suggests that attention should also be paid to potential
socioeconomic gradients in the type of programmes young people enter in higher
education, as well as the more general question of participation.
8 As an extension to this analysis we also used decomposition methods to further examine the gender gap in
attainment. In particular we applied the conventional Blinder-Oaxaca decomposition to the mean (i.e. using the
OLS models) as well as across the distribution. Overall this decomposition analysis did not reveal any particularly
interesting or informative results and therefore we do not present them here. They are however available from the
authors on request.
14
In considering the results of this analysis, a number of caveats should be borne in mind.
Firstly, the data utilised is relatively dated. However, as the SLS was discontinued after
the 2007 wave, it is the latest available dataset to contain information on students’
terminal upper secondary examination performance in Ireland. While more recent data
would be desirable, we have no evidence or reason to believe that the relationships
observed in our analysis should have deviated to any great extent in the past ten years.
Another caveat to highlight is the potential endogeneity of some of our explanatory
variables. While causal identification of the effects of these factors on upper secondary
exam performance would be preferred, limitations with our data mean this is not possible
here. This may provide fertile grounds for future enquiry.
ACKNOWLEDGEMENTS
We thank seminar participants at University College Dublin and University of Limerick
for helpful comments. The usual disclaimer applies.
15
REFERENCES
Agyire-Tettey, F., Ackah, C.G., and Asuman, D. (2017). An unconditional quantile
regression based decomposition of spatial welfare inequalities in Ghana. The Journal of
Development Studies, DOI: 10.1080/00220388.2017.1296571.
Blundell, R., Dearden, L., Goodman, A. and Reed, H. (2000). The returns to higher
education in Britain: Evidence from a British cohort. The Economic Journal, 110, 82-99.
Borah, B. and Basu, A. (2013). Highlighting difference between conditional and
unconditional quantile regression approaches through an application to assess
medication adherence. Health Economics, 22, 1052-1070.
Bradley, S. and Taylor, J. (1998). The effect of school size on exam performance in
secondary schools. Oxford Bulletin of Economics and Statistics, 60, 291-234.
Bradley, J, Keane, F and Crawford, S. (2013). School sport and academic achievement.
Journal of School Health, 83, 8-13.
Byrne, D., McCoy, S. and Watson, D. (2008). School Leavers’ Survey Report 2007. Dublin:
Economic and Social Research Institute and Department of Education and Science.
Chowdry, H., Crawford, C., Dearden, L., Goodman, A. and Vignoles, A. (2013). Widening
participation in higher education: Analysis using linked administrative data. Series A
(Statistics in Society), 176, 431-457.
Cullinan, J., Flannery D., Walsh, S. and Mc Coy, S. (2013). Distance effects, social class and
the decision to participate in higher education in Ireland. The Economic and Social Review,
44, 19-51.
16
Dearden, L., Ferri, J. and Meghir, C. (2002). The effect of school quality on educational
attainment and wages. Review of Economics and Statistics, 84, 1-20.
Dearden, L., McGranahan, L. and Sianesi, B. (2004). The Role of Credit Constraints in
Educational Choices: Evidence from the NCDS and BCS70. CEEDP 48: Centre for the
Economics of Education, London School of Economics.
Denny, K. (2014). The effect of abolishing university tuition costs: Evidence from Ireland.
Labour Economics, 26, 26-33.
Denny, K. (2010). What did abolishing university fees in Ireland do? UCD Geary Institute
Discussion paper series 2010/26.
Denny K., Flannery D. (2017). The economics of higher education participation. In:
Cullinan J., Flannery D. (Eds) Economic Insights on Higher Education Policy in Ireland.
Cham: Palgrave Macmillan.
Denny, K. and Oppedisano, V. (2013). The surprising effect of larger class sizes. Labour
Economics, 23, 57-65.
Department of Education and Science (2005). Delivering Equality of Opportunity in
Schools: An Action Plan for Educational Inclusion. Dublin: Department of Education and
Science.
Department of Education and Skills (2017). Data on Indivdual Schools: Post Primary
Schools List. Available at https://www.education.ie/en/Publications/Statistics/Data-on-
Individual-Schools/
Dickson, M. and Harmon, C. (2011). Economic returns to education: What we know, what
17
we don’t know, and where we are going—some brief pointers. Economics of Education
Review, 30, 1118-1122.
Dolton, P. and Sandi, M. (2017). Returning to returns: Revisiting the British education
evidence. Labour Economics, 48, 87-104.
Edie, E., and Showalter, M.H. (1998). The effect of school quality on student performance:
A quantile regression approach. Economics Letters, 58, 345-50.
Eyles, A., Hupkau, C., and Machin, S. (2016). School reforms and pupil performance.
Labour Economics, 41, 9-19.
Firpo, S., Fortin, N.M., and Lemieux, T. (2009). Unconditional quantile regressions.
Econometrica, 77, 953-973.
Flannery, D., and Cullinan, J. (2014). Where they go, what they do and why it matters: the
importance of geographic accessibility and social class for decisions relating to higher
education institution type, degree level and field of study. Applied Economics, 46, 2952-
2965.
Flannery D., and Cullinan J. (2017). Economics and higher education policy. In: Cullinan
J., Flannery D. (Eds) Economic Insights on Higher Education Policy in Ireland. Cham:
Palgrave Macmillan.
Flannery D., and O’Donoghue C. (2017). The returns to third level education. In: Cullinan
J., Flannery D. (Eds) Economic Insights on Higher Education Policy in Ireland. Cham:
Palgrave Macmillan.
Flannery D. and O’Donoghue C. (2009). The determinants of higher education
participation in Ireland: A micro analysis. The Economic and Social Review, 40, 73-107.
18
Foreman-Peck, J. and Foreman-Peck, L. (2006). Should schools be smaller? The size
performance relationship for Welsh schools. Economics of Education Review, 25, 157-171.
Fortin, N., Lemieux, T., and Firpo S. (2011). Decomposition methods in economics. In:
Card, D. and Ashenfelter, O. (Eds) Handbook of Labor Economics, Volume 4. North-
Holland, Amsterdam.
Fuchs, T. and Weissman, L. (2007). What accounts for international differences in student
performance? A re-examination using PISA data. Empirical Economics, 32, 433-64.
Galego, A. and Pereira, J. (2014). Decomposition of regional wage differences along the
wage distribution in Portugal: the importance of covariates. Environment and Planning A,
46, 2514-2532.
Gorry, D. (2016). Heterogenous effects of sports participation on education and labor