A Drop Hammer Penetrometer for Determining The Density of Soils and Granular Materials JOSEPH P. ROSTRON and ARNOLD E. SCHWARTZ, Clemson University; and THOMAS E. GIOIOSA, Corps of Engineers, U.S. Army ABRIDGMENT •THE principal objective of this research was to investigate the possible application of a drop hammer penetrometer as a rapid method for determining the density of soils and base materials used in highway construction. With the exception of nuclear tech- niques, methods for density determination have undergone little development since the introduction of the sand-cone and water-balloon procedures. The accuracy and pre- cision of these methods have been well established (1), The research was carried out in the Department of Civil Engineering at Clemson University as part of a project sponsored by the National Cooperative Highway Research Program. The South Carolina State Highway Department and the Bureau of Public Roads also sponsored a project (2) which led to the development of the penetrometer designed by Gioiosa (3). - Penetration resistance as a means of determining soil properties has been in use for many years. A widely used dynamic method for determining the engineering prop- erties of soil for foundation studies is the split spoon sampler, while the California Bearing Ratio (CBR) and the North Dakota cone methods are two commonly used pene- tration test methods which are applied to highway construction. Full-scale field tests dealing with soil compaction for highway construction were re- ported by Hampton, Selig and Truesdale (4, 5). This study revealed that the compac- tion growth curves for density correspondedto penetration resistance growth curves at a given moisture level as the number of roller coverages increased. The mean pen- etration resistance, however, decreased as the moisture level increased, It has also been noted by Steffens and Ring (6) that the penetration resistance of a compacted soil is a function of the moisture content of the molded sample and this re- lationship is the basis for the "one-point" Proctor method for determining the standard density of a soil. However, for a given moisture content, the penetration resistance of a particular soil is related to the compacted density, DESCRIPTION OF THE DROP HAMMER PENETROMETER To explore the relationship between density and penetration resistance, the drop hammer penetrometer was designed to use a measured number of blows for a certain depth of penetration, as in the split spoon sampler, along with the use of a surcharge, as in the CBR test. A 8/ie-in. diameter steel rod with a %-in. diameter hardened, bullet-shaped tip serves as the penetration needle and hammer weight guide, The needle is capable of breaking and penetrating crushed rock base material when driven with a 10-lb hammer dropped 18 in. The penetration is measured by means of a pointer-scale combination and up to four surcharge weights, each weighing 35.2 lb, were used with the penetrom- eter to confine the granular material near the surface. A foam rubber disk 7 in. in diameter was placed under the penetrometer base to distribute and transmit the sur- charge weight to the surface, A carriage assembly was added for mobility (Fig. 1). Paper sponsored by Committee on Compaction. 70
Transcript
A Drop Hammer Penetrometer for Determining The Density of Soils and Granular Materials JOSEPH P. ROSTRON and ARNOLD E. SCHWARTZ, Clemson University; and THOMAS E. GIOIOSA, Corps of Engineers, U.S. Army
ABRIDGMENT
•THE principal objective of this research was to investigate the possible application of a drop hammer penetrometer as a rapid method for determining the density of soils and base materials used in highway construction. With the exception of nuclear techniques, methods for density determination have undergone little development since the introduction of the sand-cone and water-balloon procedures. The accuracy and precision of these methods have been well established (1),
The research was carried out in the Department of Civil Engineering at Clemson University as part of a project sponsored by the National Cooperative Highway Research Program. The South Carolina State Highway Department and the Bureau of Public Roads also sponsored a project (2) which led to the development of the penetrometer designed by Gioiosa (3). -
Penetration resistance as a means of determining soil properties has been in use for many years. A widely used dynamic method for determining the engineering properties of soil for foundation studies is the split spoon sampler, while the California Bearing Ratio (CBR) and the North Dakota cone methods are two commonly used penetration test methods which are applied to highway construction.
Full-scale field tests dealing with soil compaction for highway construction were reported by Hampton, Selig and Truesdale (4, 5). This study revealed that the compaction growth curves for density correspondedto penetration resistance growth curves at a given moisture level as the number of roller coverages increased. The mean penetration resistance, however, decreased as the moisture level increased,
It has also been noted by Steffens and Ring (6) that the penetration resistance of a compacted soil is a function of the moisture content of the molded sample and this relationship is the basis for the "one-point" Proctor method for determining the standard density of a soil. However, for a given moisture content, the penetration resistance of a particular soil is related to the compacted density,
DESCRIPTION OF THE DROP HAMMER PENETROMETER
To explore the relationship between density and penetration resistance, the drop hammer penetrometer was designed to use a measured number of blows for a certain depth of penetration, as in the split spoon sampler, along with the use of a surcharge, as in the CBR test.
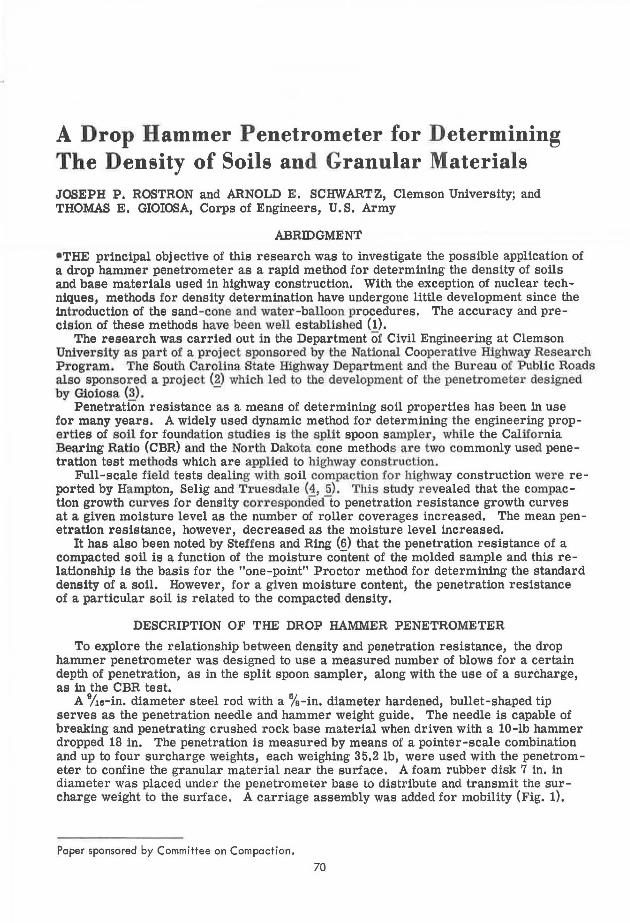
A 8/ie-in. diameter steel rod with a %-in. diameter hardened, bullet-shaped tip serves as the penetration needle and hammer weight guide, The needle is capable of breaking and penetrating crushed rock base material when driven with a 10-lb hammer dropped 18 in. The penetration is measured by means of a pointer-scale combination and up to four surcharge weights, each weighing 35.2 lb, were used with the penetrometer to confine the granular material near the surface. A foam rubber disk 7 in. in diameter was placed under the penetrometer base to distribute and transmit the surcharge weight to the surface, A carriage assembly was added for mobility (Fig. 1).
Paper sponsored by Committee on Compaction.
70
SAMPLE PREPARATION AND TEST PROCEDURE
Table 1 summarizes the compaction properties and AASHO classification of
71
the soils used in the• laboratory evaluation of the drop hammer penetrometer. All of these soils except the micaceous silty sand could be used in highway base or subbase construction. Type I crushed granite gneiss macadam base material meeting SCHD specifications (7) was also used to evaluate the penetrometer.
Each of the materials used in the laboratory tests was compacted at various densities in a 1-cu ft aluminum mold, approximately 8 in, deep. Moisture levels ranging from about O to 20 percent were used. Penetration teats on the soil samples utilized a 5-lb hammer dropped 12 in, and 321-psf surcharge pressure; whereas, tests on the crushed stone utilized a 10-lb hammer dropped 18 in. and 584-psf surcharge pressure.
Figure 1. Penetrometer in test position. To perform a penetration test, the ham-mer was dropped until the needle had penetrated approximately 2 in. Additional
standard blows were then delivered until the needle had penetrated to a total depth of about 6 in. The penetration resistance, N, in blows per inch, was then calculated for the final 4 in. of penetration. Each sample was penetrated twice and the moisture content and average of the two test results for each sample determined.
CALIBRATION PROCEDURE
Although the peneb:ation resistance of the soil sample was greatly influenced by molding water content, it was found that, for a given moisture content, a straight-line relationship existed between dry density and the log of the penetration resistance. This relationship is also applicable to the crushed granite gneiss and can be expressed in the following form:
y =A+ Blog N
TABLE 1
SUMMARY OF son.s USED TO EVALUATE THE DROP HAMMER PENETROMETER
AASHO T-99 Compaction Test Results
Soil Type Max. Dry Density (pcf)
Opt. Moisture (f )
Red sand clay 116.0 12.4
Clayey topsoil 116.3 15.8
Sandy topsoil 122.0 13.0
Sand clay mixtu re 120.5 12.0 {851 sand, 15i clay)
Micaceous silty sand 111.5 13.8
(1)
AASHO Class.
A-2-4
A-2-6
A-2-4
A-2-6
A-2-4
72
..... u
"" .: H H Cl)
z "' A
>< "' A
120
llO
..... g_ 100
.: H H Cl)
z "' A
>< 90 "' A
80
70
150
140 .
130
120
llO
100
0.5 l
\1, '} :,,. l>'~
2.0% Moisture
• 2.1 - 4.7% Moisture
• 5.2 - 7.6% Moisture
PENETRATION RESISTANCE, Blows per inch
Figure 2. Dry density vs penetration resistance for Type I crushed granite gneiss.
,,,,;.\o
/ ... 5.6% Moisture
• 9. 8% Moisture
• 14. 2% Moisture
0.5 10
PENETRATION RESISTANCE, Blows per inch.
Figure 3. Dry density vs penetration resistance for red sand clay.
10
\.1:1·~
where
y = dry density, pcf; N = penetration resistance, blows/inch; A = intercept (dry density at 1 blow/inch penetration resistance); B = slope (change in dry density for 10: 1 change in N).
73
Figure 2 is a semi-log plot of the dry density versus penetration resistance for crushed granite gneiss. Figure 3 illustrates the same plot for red sand clay and is typical of this relationship for the soil materials. The straight regression lines which best fit the data points at various moisture levels are also plotted.
Within the range of density tested, the slope of the regression lines for the crushed granite gneiss was equal to 27 .3 for all three levels of moisture. However the intercept of the regression equation decreases 0.9 pcf for each 1 percent increase in molding water content and thus, the calibration equation for crushed granite gneiss can be expressed as follows:
'Y = 116.7 - 0.90 w + 27.3 log N (2)
where w = molding water content, percent. Eq. 2 was used to calculate the dry density of the 34 crushed granite gneiss samples
and these results were subjected to statistical analysis. For all soils tested, the slope of the regression line increased with moisture con
tent. The intercept also varies with moisture content but the minimum value occurs at about 7 5 percent of optimum moisture and increases at lower and higher values of moisture. The slope and intercept of the regression lines versus molding water content, w, were plotted for each of the five test soils and smooth curves were connected between these points. In most instances, parabolic curves were fitted to these points; Figure 4 is a typical plot. Using the values of slope and intercept interpolated from the appropriate curve at the particular moisture content of a given sample, along with
120 50
110 40
.... u /l.
,_;- 100 30 P<
"' u "' ~
"" P<
H 0 z ...., H U)
90 _l{ 20
80 10 ~ Intercept
0 Slope
70 0
0 5 10 15 20
MOLDING WATER CONTENT, %
Figure 4. Intercept and slope vs molding water content for red sand clay.
Figure 5. Calibration chart-dry density vs penetration resistance for red sand clay.
the penetration resistance of the sample, the dry density of all 64 soil samples tested was calculated from Eq. 1.
Good correlation was obtained between observed dry density of the calibration sam -ples and predicted dry density calculated from the penetration resistance and molding moisture content using the calibration procedure outlined above. Table 2 gives the coefficient of correlation as well as the standard error obtained for all of the soil and granite gneiss samples utilized in the laboratory calibration of the penetrometer.
PRACTICAL APPLICATIONS OF THE DROP HAMMER PENETROMETER
For field application of the drop hammer penetrometer, each soil or material used in the construction must be calibrated for its moisture sensitivity and penetration resistance characteristics; this can be performed in conjunction with the Proctor type
test as part of the construction control procedure. A minimum of six
TABLE 2
COEFFICIENT OF CORRELATION AND STANDARD ERROR BETWEEN OBSERVED AND CALCULATED DRY DENSITY
Type of Material
Crushed granite gneiss
Red sand clay
Clayey topsoil
Sandy topsoil
Sand clay mixture
Micaceous silty sand
Coefficient of Correlation
0.945
0.995
0.980
0.957
0.977
0.958
Standard Error (pcf)
2.2
1.1
1.9
3.2
1.3
2.9
tests is required-one at low or moderate density and one at high density and repeating these for a total of three moisture levels. Moisture levels of approximately 50, 80, and 110 percent of optimum are recommended.
So that field density can be de -termined with the greatest speed and a minimum of calculations, the preparation of a master calibration chart (F'ig. 5) is recommended. This chart was developed from Figure 4
for red sand clay using values of slope and intercept at one percent moisture increments within the useful range.
75
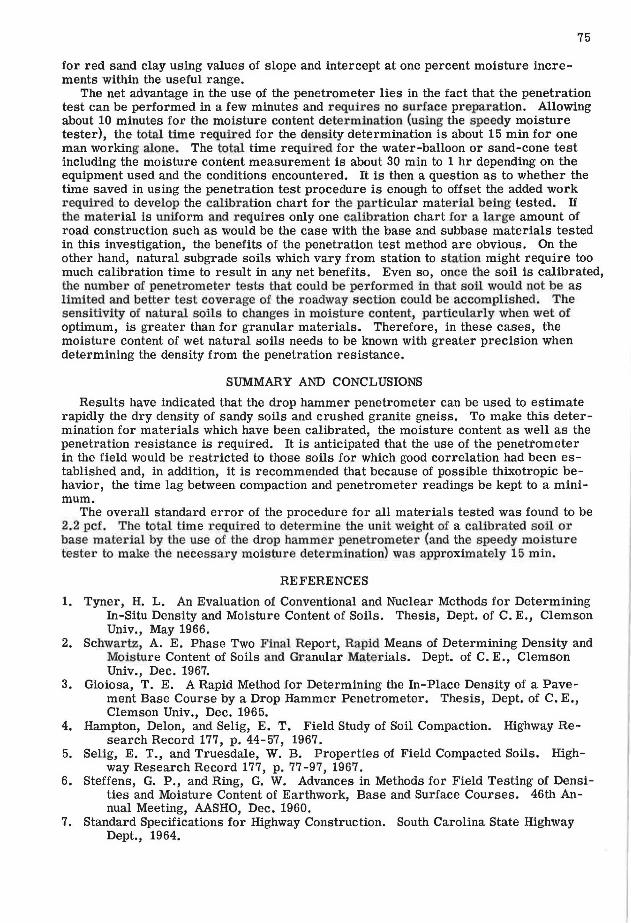
The net advantage in the use of the penetrometer lies in the fact that the penetration test can be performed in a few minutes and requires no surface preparation. Allowing about 10 minutes for the moisture content determination (using the speedy moisture tester), the total time required for the density determination is about 15 min for one man working alone. The total time required for the water-balloon or sand-cone test including the moisture content measurement is about 30 min to 1 hr depending on the equipment used and the conditions encountered. It is then a question as to whether the time saved in using the penetration test procedure is enough to offset the added work required to develop the calibration chart for the particular material being tested. If the material is uniform and requires only one calibration chart for a large amount of road construction such as would be the case with the base and subbase materials tested in this investigation, the benefits of the penetration test method are obvious. On the other hand, natural subgrade soils which vary from station to station might require too much calibration time to result in any net benefits. Even so, once the soil is calibrated, the number of penetrometer tests that could be performed in that soil would not be as limited and better test coverage of the roadway section could be accomplished. The sensitivity of natural soils to changes in moisture content, particularly when wet of optimum, is greater than for granular materials. Therefore, in these cases, the moisture content of wet natural soils needs to be known with greater precision when determining the density from the penetration resistance.
SUMMARY AND CONCLUSIONS
Results have indicated that the drop hammer penetrometer can be used to estimate rapidly the dry density of sandy soils and crushed granite gneiss. To make this determination for materials which have been calibrated, the moisture content as well as the penetration resistance is required. It is anticipated that the use of the penetrometer in the field would be restricted to those soils for which good correlation had been established and, in addition, it is recommended that because of possible thixotropic behavior, the time lag between compaction and penetrometer readings be kept to a minimum.
The overall standard error of the procedure for all materials tested was found to be 2.2 pcf. The total time required to determine the unit weight of a calibrated soil or base material by the use of the drop hammer penetrometer (and the speedy moisture tester to make the necessary moisture determination) was approximately 15 min.
REFERENCES
1. Tyner, H. L. An Evaluation of Conventional and Nuclear Methods for Determining In-Situ Density and Moisture Content of Soils. Thesis, Dept. of C. E., Clemson Univ., May 1966.
2. Schwartz, A. E. Phase Two Final Report, Rapid Means of Determining Density and Moisture Content of Soils and Granular Materials. Dept. of C. E., Clemson Univ., Dec. 1967.
3. Gioiosa, T. E. A Rapid Method for Determining the In-Place Density of a Pavement Base Course by a Drop Hammer Penetrometer. Thesis, Dept. of C. E., Clemson Univ., Dec. 1965.
4. Hampton, Delon, and Selig, E. T. Field Study of Soil Compaction. Highway Research Record 177, p. 44-57, 1967.
5. Selig, E. T., and Truesdale, W. B. Properties of Field Compacted Soils. Highway Research Record 177, p. 77 -97, 1967.
6. Steffens, G. P., and Ring, G. W. Advances in Methods for Field Testing of Densities and Moisture Content of Earthwork, Base and Surface Courses. 46th Annual Meeting, AASHO, Dec. 1960.
7. Standard Specifications for Highway Construction. South Carolina State Highway Dept., 1964.