To cite this article: Lee, MH., Lee, M., and Kim, J. (2017). A dynamic approach to the start-up business ecosystem: A cross-comparison of Korea, China, and Japan. Asian Academy of Management Journal, 22(2), 157–184. https://doi.org/10.21315/aamj2017.22.2.6
To link to this article: https://doi.org/10.21315/aamj2017.22.2.6
ABSTRACT
This study aims to explore in detail the business ecosystems for high-tech start-ups in Korea, China, and Japan using a dynamic approach. For this purpose, this study proposes the start-up life cycle (SLC) framework, which includes the stages of technology optimisation (R&D), fundraising, and exit, which is based on overcoming obstacles at each developmental stage, such as the Valley of Death and Darwinian Sea, the two major start-up business barriers. Thus, this study enables accounting for the macroscopic dynamic flow and quantitative comparison of the business ecosystem. Each country shows very different start-up business ecosystem characteristics: Korea has a supply-centric ecosystem, whereas Japan and China have a technology-centric and a market-centric ecosystem, respectively. The analysis performed in this study enables us to recognise the significant differences between the technology start-up ecosystems in the three countries. Furthermore, the SLC framework suggested in this study not only allows for an analysis of the critical path of the entrepreneur and the capital in the start-up business ecosystem but also permits an understanding of the characteristics of the start-up business ecosystem of each country through radial graphs. This study dynamically contributes to the understanding of the entire start-up business ecosystem in each country and enables an understanding of the direction of future start-up policies by comparing the three different ecosystems.
Keywords: start-up, business ecosystem, SLC framework, life cycle model
Myungho Lee et al.
158
INTRODUCTION
The business ecosystem theory, which refers to an economic environment supported by a foundation of interacting stakeholders such as organisations and individuals, is now widely adopted in the high-tech industry (Moore, 1996; Zahra & Nambisan, 2012). This ecosystem offers new business perspectives to companies that help transform their strategies to better assist in developing their own interests and support their business environment (Bharadwaj, El Sawy, Pavlou, & Venkatraman, 2013; Li, 2009). In addition, Moore (1993) emphasises that firms evolve innovative capabilities with other firms, make new products, and deliver services to customers in a business ecosystem to drive innovation.
Today, high-tech start-ups1, which power the national economies are emerging all over the world. Further, to develop the start-up environment, the business ecosystem plays an important role (Lee & Lee, 2010). Because the tremendous growth in technology-based start-ups is the core driving force of the new information economy, the high growth in start-up ecosystems has had a major impact on the global economy (Herrmann, Marmer, Dogrultan, & Holtschke, 2012; Kim, 2014). Therefore, understanding business ecosystems for start-ups is a crucial issue (Han, 2003; Kim, 2016). A start-up ecosystem is formed by many stakeholders such as founders (entrepreneurs), inventors, content providers, end users, angel investors, venture capitalists, planners, and marketers; these stakeholders interact as a system to establish new start-up firms (Lee, 2012). Although there exists no solid definition of a business ecosystem for start-ups, and though it may remain in the inception phase for an indefinite amount of time, such a concept encourages organisations, companies, foundations, entrepreneurs, and even governments to create value through the use of high-end technology and innovative thinking to promote governmental policies that concentrate on economic growth.
According to the existing research on start-ups, there are various start-up models and ecosystems, such as the flexible recycling (Bahrami & Evans, 2000), the lean start-up (Ries, 2011), the entrepreneurship ecosystem (Spilling, 1996), and the ecosystem perspective (Zacharakis, Shepherd, & Coombs, 2003). However, these models mainly describe the business ecosystem based on individual components using a static approach rather than explaining the entire ecosystem’s impact on start-ups using the dynamic approach, thus making it difficult to understand the macroscopic dynamic flow. In particular, the existing models are vulnerable to a life-cycle analysis of a start-up business ecosystem.
This study, therefore, has two major research purposes to contribute to the understanding of high-tech start-up business ecosystems and to help in instituting
The Start-up Ecosystem in Korea, China, and Japan
159
related national policies and corporate strategies. First, this study confirms the domains of the start-up business ecosystem using a dynamic approach, applying a general theory of change and development, and suggesting that the start-up life cycle (SLC) framework is based on the analysis of the correlation between the entrepreneur and the capital path. Second, this study analyses the high-tech start-up business ecosystem in Korea, China, and Japan through the suggested SLC framework. These three countries were selected as case analyses because they have similar cultures but very different types of start-up market characteristics; Japan has a traditional developed economy, Korea has a newly developed economy, and China has a developing economy (IMF, 2016). Further, each of the countries also has different entrepreneur characteristics; Chinese entrepreneurs are risk takers, Japanese entrepreneurs are risk averse, and the Koreans are moderate in the context of their tendency to take risks. Because the period of start-up related policy is relatively short and the development of the industry has been very rapid, the data may not represent an accurate picture of the situation unless the most recent studies and up-to-date data are employed. We combine both qualitative and quantitative investigations to study the start-up business ecosystem. Thus, we narrow and identify the necessary characteristics and critical paths for start-ups and the start-up business ecosystems thereby contributing to the academic literature on this topic.
LITERATURE REVIEW
The Business Ecosystem
Beer (1964) compared business systems to biological systems, emphasising that an industrial organisation appears to be an organism that responds to the business environment. The ecological perspective does not view the economy as a machine; on the contrary, it argues that the market economy is best understood as a living, evolving ecosystem (Rothschild, 2004). The notion of the ecosystem, emerging from a biological concept, began to be adopted in the business and social science fields in the 1980s (Kilduff & Tsai, 2003; Schwab, Porter, & Sala-i-Martin, 2007), and it has emerged as a key concept for start-ups and venture companies in particular. Moore (1993) first proposed the strategic concept of a “business ecosystem,” which is a notion that has recently been widely adopted especially in the ICT (information communication technology) industry. Moore defined a business ecosystem as “an economic community supported by a foundation of interacting organizations and individuals—the organisms of the business world” (Moore, 1996). This definition signifies that companies need to develop a mutual relationship with stakeholders such as suppliers, demanders, and even competitors; the key logic of the business ecosystem is the study of the reciprocal relationships between companies and the
Myungho Lee et al.
160
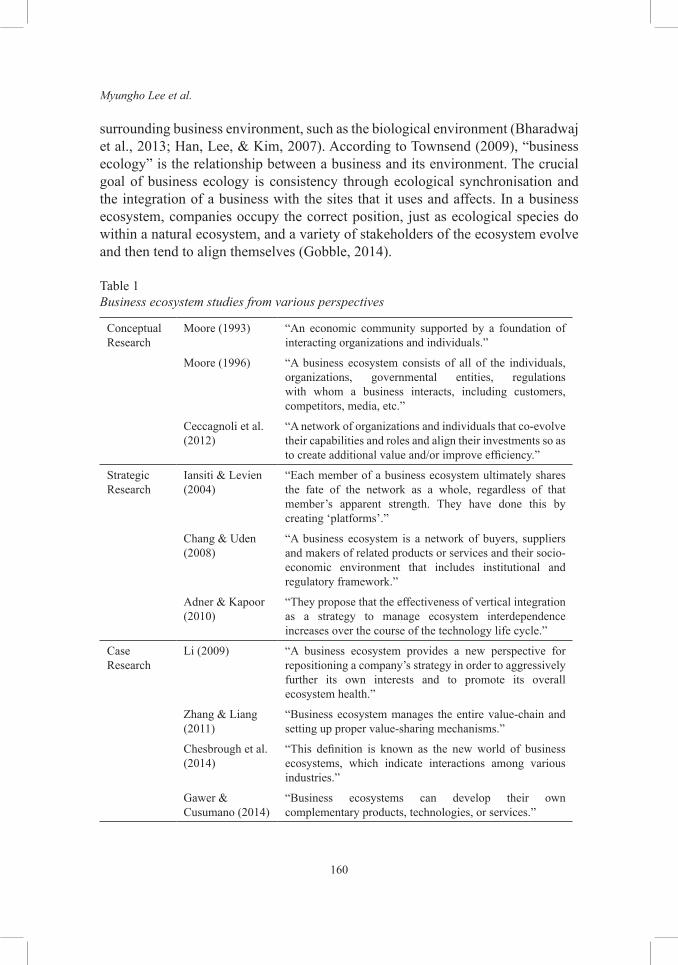
surrounding business environment, such as the biological environment (Bharadwaj et al., 2013; Han, Lee, & Kim, 2007). According to Townsend (2009), “business ecology” is the relationship between a business and its environment. The crucial goal of business ecology is consistency through ecological synchronisation and the integration of a business with the sites that it uses and affects. In a business ecosystem, companies occupy the correct position, just as ecological species do within a natural ecosystem, and a variety of stakeholders of the ecosystem evolve and then tend to align themselves (Gobble, 2014).
Table 1Business ecosystem studies from various perspectives
Conceptual Research
Moore (1993) “An economic community supported by a foundation of interacting organizations and individuals.”
Moore (1996) “A business ecosystem consists of all of the individuals, organizations, governmental entities, regulations with whom a business interacts, including customers, competitors, media, etc.”
Ceccagnoli et al. (2012)
“A network of organizations and individuals that co-evolve their capabilities and roles and align their investments so as to create additional value and/or improve efficiency.”
Strategic Research
Iansiti & Levien (2004)
“Each member of a business ecosystem ultimately shares the fate of the network as a whole, regardless of that member’s apparent strength. They have done this by creating ‘platforms’.”
Chang & Uden (2008)
“A business ecosystem is a network of buyers, suppliers and makers of related products or services and their socio-economic environment that includes institutional and regulatory framework.”
Adner & Kapoor (2010)
“They propose that the effectiveness of vertical integration as a strategy to manage ecosystem interdependence increases over the course of the technology life cycle.”
Case Research
Li (2009) “A business ecosystem provides a new perspective for repositioning a company’s strategy in order to aggressively further its own interests and to promote its overall ecosystem health.”
Zhang & Liang (2011)
“Business ecosystem manages the entire value-chain and setting up proper value-sharing mechanisms.”
Chesbrough et al. (2014)
“This definition is known as the new world of business ecosystems, which indicate interactions among various industries.”
Gawer & Cusumano (2014)
“Business ecosystems can develop their own complementary products, technologies, or services.”
The Start-up Ecosystem in Korea, China, and Japan
161
Business Ecosystems for Start-ups
Business ecosystems work as a strong sponsor for new ventures, that is, companies six years or younger (Zahra, 2007). Many of the new start-ups in the business ecosystem are created by well-established firms. These company-sponsored start-ups are launched to analyse or explore opportunities within the ecosystem (Zahra & Nambisan, 2012), particularly experimental and technological support (Campbell, Birkinshaw, Morrison, & van Basten Batenburg, 2003; Keil, McGrath, & Tukiainen, 2009). In particular, business ecosystems for entrepreneurs face a unique set of challenges to balance the goals and priorities for the new venture (Nambisan & Baron, 2013). Bahrami and Evans (2000) claim that the core dimensions of the Silicon Valley ecosystem are as follows: (1) venture capital, (2) a talent pool of knowledgeable professionals, (3) universities and research institutions, (4) professional service infrastructure, and (5) customers and lead users of innovation. The ecosystem proposed by Bahrami and Evans (2000) embraces all the key factors that Mathews (1997) regards as crucial with the addition of receptive customers. Studies on business ecosystems for start-ups have been carried out for several years. Because start-ups are linked to many stakeholders, owing to their very nature, research and analysis looking into each factor and relationship need to be undertaken. Because the existing business ecosystem for start-ups creates an environment that encourages mainly entrepreneurial endeavours, this may limit the pursuits of others.
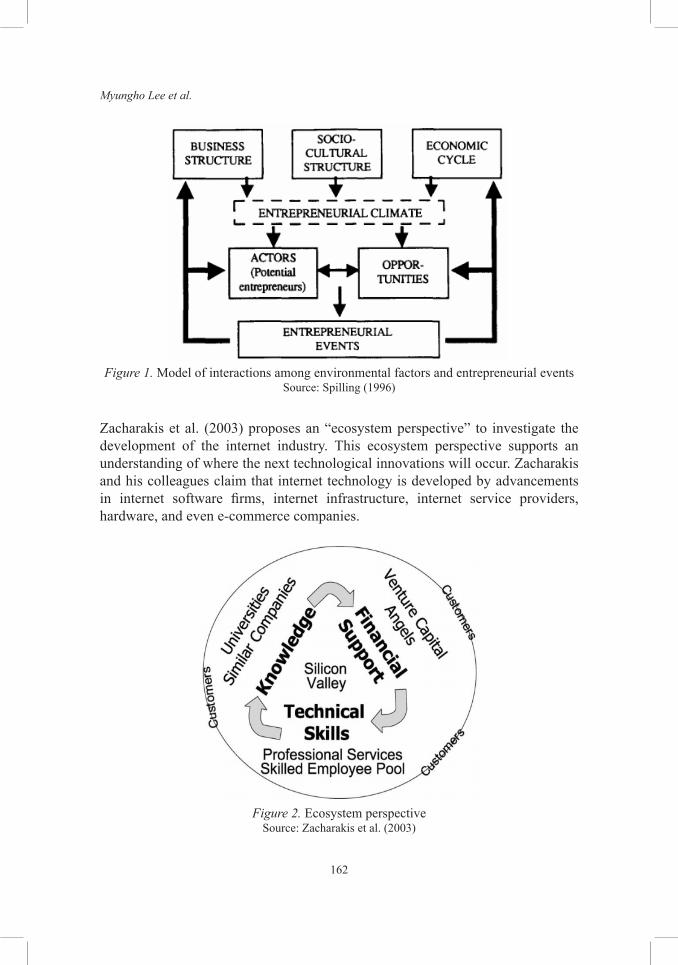
The model proposed by Spilling (1996) begins with an explanation of the conceptual framework to analyse the economic process, which clearly demonstrates the reciprocal relationship between environmental factors and entrepreneurial events (illustrated by the feedback in Figure 1). In his article, Spilling introduces the concept of the entrepreneurial system with its complex system of actors, roles, and environmental factors that interact to determine entrepreneurial performance. Entrepreneurial activity is based on knowledge, competence, and role models, which are embedded in these structures. In the short term, environmental elements are stable, while in the long run, these elements may change partially because of entrepreneurial events taking place in the area. The various factors, actors, roles, various organisations, and environmental elements make up the entrepreneurial system.
Myungho Lee et al.
162
Figure 1. Model of interactions among environmental factors and entrepreneurial events Source: Spilling (1996)
Zacharakis et al. (2003) proposes an “ecosystem perspective” to investigate the development of the internet industry. This ecosystem perspective supports an understanding of where the next technological innovations will occur. Zacharakis and his colleagues claim that internet technology is developed by advancements in internet software firms, internet infrastructure, internet service providers, hardware, and even e-commerce companies.
Figure 2. Ecosystem perspective Source: Zacharakis et al. (2003)
The Start-up Ecosystem in Korea, China, and Japan
163
Isenberg (2011) postulates six key domains of the entrepreneurship ecosystem: (1) policy reform and incentive planning, (2) venture capital funds and angel investment at the outset, (3) social norms becoming pro-entrepreneurship, (4) strong support mechanisms strengthening the infrastructure, (5) entrepreneurship education being accelerated, and (6) access to regional markets and multinationals. The Babson entrepreneurship ecosystem project addresses the development of advanced methods to utilise entrepreneurship as an effective methodology and result-oriented strategy towards economic development (Isenberg, 2011).
Figure 3. Domains of the entrepreneurship ecosystem Source: Isenberg (2011)
The Limitations of Existing Start-up Business Ecosystem Models
As discussed above, there are various definitions and models of the start-up business ecosystem that seek to explain the environment. However, although these existing models have provided explanations for the ecosystem based on distinct factors and domains, they are limited in terms of analysing the entire business ecosystem for start-ups. Most of the existing studies analyse the factors using a static approach and not a dynamic approach. Thus, the analysis of time-series data, which enables one to find a critical path, is difficult using the existing model, and a description of the SLC is insufficient, especially for the comparison of each country’s business ecosystems, where the analysis of the business life cycle is a crucial point. Without the perspective of the SLC using a dynamic approach, it is difficult to devise a future start-up business plan and policy (McGrath, 2010). In addition, there is no
Myungho Lee et al.
164
explanation for the risky periods, which is one of the most important parts of the information relevant to the survival of a start-up business. If firms, especially start-ups, do not manage these risks, they may go bankrupt, irrespective of other factors (Van Gelderen, Thurik, & Bosma, 2005). Therefore, this study aims to explore the start-up business ecosystem using a dynamic approach to better compare start-up ecosystems in each country. This study consequently builds the SLC framework, which includes the technology optimisation (R&D) stage, fundraising stage, and exit stage, which is based on overcoming tasks at each developmental stage, including the Valley of Death and Darwinian Sea, to account for the macroscopic dynamic flow and quantitative comparisons of the start-up business ecosystem.
Research Model: Domains of a Start-up Business Ecosystem
Using a Dynamic Approach
To an extent, it is not easy to start and develop a new business that grows consistently. A majority of new companies face failure before reaching the stage of consistent growth. According to Hammerstedt and Blach (2008), only one or two out of approximately 3,000 raw ideas will become a commercial success after undergoing a significant project testing stage (Figure 4).
Figure 4. The stages of product development Source: Hammerstedt and Blach (2008)
In this study, to analyse how the start-up business ecosystems in each country are different, we classify the stages of the SLC and confirm the necessary domains.
The Start-up Ecosystem in Korea, China, and Japan
165
Consequently, this study proposes a tri-level cycle business ecosystem, which combines the technology optimisation (R&D) stage, the fundraising stage, and the exit stage with six indicators (see Figure 5) based on two risks, the Valley of Death2 and Darwinian Sea3, which are terrible times of crisis that most start-ups confront (Auerswald & Branscomb, 2003). A technology start-up initially optimises its technology (Bruton & Rubanik, 2002) and overcomes the Valley of Death with fundraising via angel and venture capital (Manigart & Struyf, 1997; Murphy & Edwards, 2003). Surviving the Darwinian Sea is a hard struggle for existence in a market with competitors, which enables exit through mergers and acquisitions (M&A) or an initial public offerings (IPO) (Smith, Pedace, & Sathe, 2011). Indicators for each stage consist of “IP royalty and number of patents at the technology optimisation stage,” “angel capital and venture capital at the fundraising stage,” and “angel capital and venture capital at the exit stage,” which combine the paths and cycles of an entrepreneur and capital in a start-up business ecosystem. Thus far, several previous papers have compared intellectual property (IP) / patents, venture/angel capital, and M&A/IPO to understand the characteristics of start-up ecosystems; however, they have not analysed the relevance of each indicator and the characteristics in the context of the business ecosystem model. This study proposes a tri-level cycle business ecosystem model that makes start-ups develop and overcome risks, such as the Valley of Death and Darwinian Sea, enabling satisfactory confrontation. This study compares the characteristics of each country’s business ecosystem model for start-ups. In particular, the model is examined by experts through focus group interviews and panel discussions.
Figure 5. Indicators of a start-up business ecosystem using a dynamic approach – tri-level cycle business ecosystem
Myungho Lee et al.
166
There are reasons why these indicators are set at each of the stages. The first stage, the stage in which the initial idea moves to technology and IP, is called the technology optimisation (R&D) stage because technology transfer or technology commercialisation typically follows the generation of IP. The technology optimisation stage is a process of commercialisation from the idea, in which assets such as IP and patents are generated from creativity and ideas, via R&D; thus, the policy and programme at this stage focus on supporting technology commercialisation. We have chosen the number of IPs and IP royalty income as a representative indicator of technology optimisation. We specifically measure the number of IPs and IP royalty, which confirm the value firms create through IP; further, we divide the number of IPs by the total population to analyse the per capita number of IPs. With regard to IP royalty, we divide it by the gross domestic product (GDP) of the corresponding country to identify how much IP royalty affects the country’s economic performance. The second stage, the stage at which the start-up expands its services and products using investments to overcome the Valley of Death, is the fundraising stage, where angel/venture capital is invested in firms. Technology and investment support that enables commercialisation are vital to pass through the Valley of Death, where technology developed via R&D turns into products and services. As an indicator of the fundraising stage, the size of angel capital and venture capital is compared and analysed by dividing it by the GDP of the corresponding country. The third stage is the exit stage. At this stage, a successful start-up holds its IPO or merges with other corporations, becoming a part of their services, to secure their competitiveness and improve their market domination over the Darwinian Sea. Therefore, as a core indicator, we choose and analyse M&As and IPOs. Through the stepwise analysis framework, we investigate the SLC using a dynamic approach. Based on the indicators, this study uses the technology start-up ecosystem S-curve, called the SLC framework, to analyse the overall life cycle flow using a dynamic approach and to overcome challenges at each developmental stage, such as the Valley of Death and Darwinian Sea (see Figure 6). This model is devised to allow both dynamic and quantitative comparisons of the cycles. We then analyse and compare the characteristics of Korea, China, and Japan’s start-up business ecosystems via this tri-level cycle business ecosystem model.
The Start-up Ecosystem in Korea, China, and Japan
167
Figure 6. Riding the technology start-up ecosystem S-curve – the SLC framework
METHODOLOGY AND DATA COLLECTION
Methodology: Mixed Methods
This study uses a mixed methods approach, which aims to analyse start-up business ecosystems that feature a variety of factors. As the third and new research paradigm, mixed methods research enables researchers to bridge the gap between qualitative and quantitative research (Onwuegbuzie & Leech, 2004). Mixed methods research combines qualitative and quantitative methods within the same research and is, therefore, becoming a popular research approach in various disciplines including sociology, psychology, business studies, and education (Azorín & Cameron, 2010). Cameron (2011) states that most of the characteristics and contexts of business and management research contribute to the impetus and utilisation of mixed methods. Business and management studies, in particular, require the combined use of quantitative and qualitative research for management and organisational studies (Currall & Towler, 2003; Rossman & Wilson, 1985). Rossman and Wilson (1994) identified three different reasons for using a mixed methods approach that combines qualitative and quantitative aspects (Rossman & Wilson, 1985). First, a mixed methods approach helps researchers confirm and corroborate the two methods through triangulation. Second, a mixed methods approach enables a greater development of the analysis by providing richer data than that from a single research method. Finally, a mixed methods approach can be used to formulate new types of thinking by analysing paradoxes that emerge from the two data sources. Hurmerinta-Peltomäki and Nummela (2006) argue that a mixed methods approach
Myungho Lee et al.
168
may be able to add additional value to international business studies specifically because international business has the characteristic of being a multi-faceted research area with cultural aspects spanning national, organisational, and personal boundaries.
One of the best-known mixed methods approaches is Creswell’s triangulation design (Creswell, Plano Clark, Gutmann, & Hanson, 2003). The intent of this method design is to acquire different but complementary data on the same research topic to ascertain the research problem. In particular, Creswell’s convergence model (see Figure 7) describes the traditional model of a mixed method triangulation design (Creswell, 1999). This research reflects the power and social phenomena within business societies. We believe that a mixed methods approach will help us better understand the research situation. In addition, this research project has multiple phases; therefore, one data resource is not adequate, and the initial results need to be further explained. Therefore, this research adopts a mixed methods approach as a key research methodology to analyse the business ecosystem for start-ups and construct a new model. From the mixed methods, we choose the Creswell’s convergence model from among his triangulation designs. Using this approach, we expect to eliminate the weaknesses of both qualitative and quantitative methods.
Figure 7. Triangulation design – convergence model Source: Creswell (1999)
Data Collection
This study uses four different types of data approaches based on the triangulation design. First, we collect and analyse secondary data, such as existing data and data from the literature, reports, and documents. Furthermore, for the qualitative research, we obtain experts’ opinions through focus group interviews and panel discussions and field data through field investigations and interviews of start-up incubating centres. In the case of Korea, we ask experts to participate in focus
The Start-up Ecosystem in Korea, China, and Japan
169
group interviews and panel discussions. In the cases of China and Japan, we visit local start-up-related institutions, incubating organisations, and venture capital associations to carry out in-depth interviews (see Appendix A)4. Finally, for the quantitative research, we obtain a variety of survey data. With regard to the secondary data in particular, this study seeks to fully incorporate academic data, data from journals, news, recent reports, and online statistical data and analyse the panel survey data using the STATA statistical package (version 13, College Station, StataCorp).
DATA ANALYSIS
This study analyses each country – Korea, China, and Japan – based on the SLC framework. The SLC framework consists of three cycles; the technology optimisation stage, the fundraising stage, and the exit stage; we investigate the three countries’ start-up business ecosystems at each stage. The technology optimisation stage consists of value creation (entrepreneur activity) in which ideas are transformed to technology. Therefore, at this stage, IP is a crucial factor. We use the number of patents for the quantitative analysis and IP royalty for the qualitative analysis. The fundraising stage is when start-ups expand their business through financial assistance by angel investors and venture capitalists. After technology optimisation, the business is successfully deployed on a commercial scale to overcome the Valley of Death through support from angel and venture capital. The exit stage is the last and the most important stage of the SLC. After the start-up bests several competitors and secures the market beyond the Darwinian Sea, “exit” is needed to withdraw investment funds.
Technology Optimisation Stage: Patent Numbers and IP Royalty Income
As a key indicator of the technology optimisation stage, we compare and analyse the number of patents applied for from 2004 to 2012. Patent application numbers in China have seen a fivefold increase in a brief span of nine years. In Japan, conversely, the number of patent applications has decreased. Korea has seen a 1.3-fold increase over the nine-year period. In particular, China’s noticeable increase takes the form of an exponential type graph, as opposed to a linear graph. Because each country has a different population size, we also proportionately compare the number of patent applications to population size. China, in particular, records the lowest number of patent applications per capita, and the case of Japan is similar to that of China. For the qualitative analysis of the IPs, we examine the net income of IP royalty (see Figure 8). We find that Japan is the only country that makes a profit through IP royalty among the three countries. Korea and China were
Myungho Lee et al.
170
found to have more expenses than earnings; IP expenditure is growing in China, and Korea spends approximately 0.3% of its GDP on IP royalty.
Overall Number of Patents Relative to Population
Overall Net Income of IP Royalty Relative to Population
Figure 8. Comparison of the number of patents and IP royalty net income (see Appendix B)
Table 2Overall analysis of technology optimisation (R&D) stage
Korea China Japan
Patent application Lowest number of patent applications among the three countries but a high number of patent applications relative to population size.
Highest number of patent applications among three countries but a low number of patent applications relative to population size.
Only country in which the number of patent applications has decreased.
IP loyalty Deficit in Korea- Typical change
Deficit in China Surplus via IP in Japan- Growing trend
(continued on next page)
The Start-up Ecosystem in Korea, China, and Japan
171
Korea China Japan
Overall Highest number of patent applications relative to population size but a low rate of actual IP use.
Payment of patent royalty has increased. Total number of patent applications is much higher than that in the other two countries but is low relative to the population size. The speed of economic development seems faster than that in the other two countries.
Payment of patent royalty has increased, even though the number of patents has decreased. This signals that there are many competitive patents.
Fundraising Stage: Angel Capital and Venture Capital
After technology optimisation, the next business purpose of start-ups is to expand their business scale to overcome the Valley of Death with support from angel and venture capital. Further, businesses secure and expand to domestic and international customers and markets, using products and services that are successfully commercialised, to cross the Darwinian Sea. We, therefore, first compare the amount of angel capital invested in the three countries. Japan has the biggest angel capital size and technology5. In China, universities’ technology holding companies serve as angel capitalists. One of the biggest university technology holding companies, Tsinghua Holdings, has RMB50.6 billion in holdings, and this figure amounts to one-fifth of the budget of the total technology holdings in Chinese universities. A comparison of the size of venture capital in the three countries indicates that China has the largest size of investments. Korea and Japan have insufficient investment compared to China. Comparing the amount of venture capital to the population, we find that China and Korea record similar scores, except for year 2001, yet Japan does not come close to either country in terms of these scores. Unlike other countries, China demonstrates an irregular shape; thus, it is important to follow up on future fluctuations.
Table 2 (continued)
Myungho Lee et al.
172
Overall size of angel capital Per GDP
Overall size of venture capital Per GDP
Figure 9. Comparison of angel capital and comparison of venture capital (see Appendix C)
Table 3Analysis of funding stage
Korea China Japan
Angelcapital
Highest rate among the three countries, but short of 0.01% relative to GDP.
Small amount of angel capital, but universities’ technology holdings act as substitutes.
Records large amount of angel capital but holds the smallest amount of angel capital relative to GDP (short of 0.01% relative to GDP).
Venture capital
0.1% of GDP but highest among the three countries.
Highest rate among the three countries.
0.02% of GDP, the lowest rate.
(continued on next page)
The Start-up Ecosystem in Korea, China, and Japan
173
Korea China Japan
Overall Highest rate of both angel and venture capital. A certain percentage of venture capital investment seems to be the result of government interference.
Universities’ technology holdings function as angel capital. Higher venture capital rate than angel capital.
Venture capital is the weakest.
Exit Stage: M&A and IPO
After a start-up successfully secures the market, the “exit strategy” is the final stage of the SLC. Shown below is a graph comparing the total size of M&A deals in the selected countries as an indicator of the output from the exit6. Japan and China have a similar scale of M&A; however, Korea’s M&A market is less than half the size of the other two markets. In the case of China, IT giants such as Tencent, Alibaba, and Baidu lead the M&A market.
When comparing the size of IPOs, China records the largest number. Korea and Japan closely follow China. The decreasing trends are especially evident in the case of Korea and China. Because there are no start-up IPO statistical data for Korea, China, and Japan, we refer to the case of the US. In the US, 35% of the total IPOs are start-up IPOs, and this figure is going up. Therefore, we reasonably speculate that IPOs in Korea, China, and Japan have similar characteristics.
Table 4Overall exit stage
Korea China Japan
M&A Smallest scale Largest number of M&As and IPOs, increasing trends
Decreasing trends
IPO Small IPO rate Large IPO rate Smallest IPO scale
Overall A certain percentage of venture capital investment seems to be the result of government interference.
Due to the explosive economic growth, many IPOs recently have been generated and venture capital growth seems necessary
Because of the low level of venture capital investment, the number of IPOs of start-ups will also be low. This is attributed to the struggling economy.
Table 3 (continued)
Myungho Lee et al.
174
Comparison of M&A Per GDP
Overall size of IPO Per GDP
Figure 10. Comparison of the M&As and IPOs of each country (see Appendices D & E)
DISCUSSION AND CONCLUSION
The results of this study indicate that in each of the three countries, start-up ecosystems take very different forms. Korea’s start-up business ecosystem is supply-centric. While the availability of venture capital and patent applications are increasing in Korea, the scale of IPOs, M&As, and the amount of IP royalty are relatively low. In other words, there are many patents; however, they do not lead to high-quality start-ups or reach the stage of commercialisation. Therefore, we can make a judgement as to the need for strategies and policies to activate investment returns. It is necessary to consider a growth strategy that can work as a bridge between the markets of China (market-centric) and Japan (technology-centric). In China, the business ecosystem for start-ups is market-centric. The IP and IP royalty figures corresponding to the technology optimisation stage are especially vulnerable in China; however, the M&A and IPO markets in China have become
The Start-up Ecosystem in Korea, China, and Japan
175
the largest among the three countries. The Japanese start-up environment is a technology-centric business ecosystem. Unlike China, the technology optimisation stage is well-constructed; however, there are limitations at the fundraising and exit stages. This situation makes it difficult for start-ups to overcome the Valley of Death and Darwinian Sea.
At the technology optimisation stage, China has overtaken Japan and Korea with regard to the absolute number of IPs; however, Korea has the largest number of patent applications relative to population size. In terms of IP royalty, Japan has more income than expenses, while Korea and China record deficits in this context. At the fundraising stage, all the angel capital in Korea, China, and Japan account for less 0.01% of their respective GDPs. Korea and Japan have similar investment structures, although the universities’ technology holdings make up for the lack of angel capital in China. Furthermore, China has the largest amount of venture capital relative to GDP, followed by Korea and Japan. At the exit stage, with respect to the size of M&A deals, Japan and China each recorded approximately $120 billion in 2013; however, Korea recorded only half the amount compared to that of the other two countries. In the case of IPOs, similar to the case of M&As, China has outpaced the other two countries, showing a faster rate of market-led economic development. This study elaborates each country’s start-up business ecosystem models through a radial graph shown below to facilitate a quantitative comparison.
Figure 11. Radial graph comparison of the SLC framework
Myungho Lee et al.
176
Table 5 Radial graph of the SLC framework
Korea China Japan
Supply-centric Market-centric Technology-centric
• Strong patent applications• IP royalty deficit• 1/6th of China’s M&A
market• $1.2 billion scale of venture
capital• IPOs cannot catch up with
venture capital
• Patent application numbers increased
• Cannot keep up with economic growth
• Universities’ technology holding companies as angel capital
• $9 billion scale of venture capital
• Large IPO market
• 340,000 patent applications per year
• IP royalty surplus, competitive patents
• Low amount of angel capital
• Low M&A activity relative to the economy
• Smallest scale of venture capital among the three countries
In this study, we propose an SLC framework that consists of the technology optimisation, fundraising, and exit stages considering two risks, the Valley of Death and Darwinian Sea. Using this framework, we examine the start-up business ecosystems of Korea, China, and Japan with regard to start-ups and their stakeholders, and we analyse the critical path of the start-up business ecosystem. Further, this study shows the results of the analysis at a single glance by using radial graphs. Moreover, this study is expected to capture the start-up business dynamic flow and make the quantitative comparison of future start-up policy easier. The main purpose of this study is to analyse and compare the start-up ecosystems in three countries using a dynamic approach to contribute to the understanding of the high-tech start-up business ecosystem and help devise relevant national policies and corporate strategies. Through the SLC framework, this study contributes academically by analysing each country’s start-up ecosystem using a dynamic approach; however, there are some limitations to this research owing to the limited availability of data. In future studies, we aim to precede the extended study by
The Start-up Ecosystem in Korea, China, and Japan
177
collecting and analysing more research data and information, such as the analysis of time-series data including other countries.
The existing models focus on actors, supporters, and environments as components of the ecosystem. These models provide some useful aspects to understand the relationship among the components; however, they have limitations in explaining the ecosystem in terms of business growth. The model proposed in this study is based on the “number of IP applications and IP royalty figures,” “angel capital and venture capital,” and “M&As and IPOs,” which are indices that reflect the Valley of Death and Darwinian Sea. Further, the model shows that these data reflect risky intervals. The data comprise the aspects of investment and recovery that are chosen as factors that reflect the activities of the entrepreneur (value creation) and the activities of the investor (value acquisition and profit), which are the core of the business ecosystem. Therefore, this model can help us understand the business ecosystem dynamically.
In addition, the model has practical utility for entrepreneurs, investors, and policymakers in helping them to understand the business ecosystem in terms of investment and recovery and to prepare countermeasures. Entrepreneurs and investors can see what their business ecosystem comprises in terms of investment and recovery and the steps to focus on to overcome problems and limitations. Policymakers can note at a glance the parts of the business ecosystem that are working well and the ones that are faulty to balance the degree of emphasis in the policy. For example, if there are many IPs but the IP royalty is low, it is necessary to reduce unnecessary patent acquisitions and support the development and utilisation of patents with high reverse power. If angel capital is vulnerable, policies can be developed or refocused to strengthen it, and if M&A are weak, it will be possible to develop policies to open or support the M&A market. Further, this model can help allocate and support budgets and resources to maximise these policy effects.
The purpose of this study is to explore models that can characterise the ecosystems of countries. Although Korea, China, and Japan are neighbouring countries and their economic exchanges are active, research shows that these three countries have different start-up ecosystems. Owing to the limited number of country comparisons in this study, more country comparisons are required to generalise the model. In addition, more discussion is required to understand whether these differences in the ecosystems reflect the level of economic development. In future studies, we intend to elaborate our research model by comparing more countries, such as European countries.
Myungho Lee et al.
178
NOTES
1. In this study, the term start-up is limited to an entrepreneurial venture based on technology, which is the best-known technology in the market and academia.
2. Refers to the difficulty of covering negative cash flows in the early stages of a start-up before the new product or service brings in revenue from real customers.
3. Separates commercialisation (product development and marketing) and industrialisation (market expansion) (see Srinivasan, 2009).
4. We visited Tokyo from 22–25 June 2014 and Beijing from 5–8 November 2014.5. We could only secure 2012 data owing to limited availability.6. In this study, M&A data is not limited to start-up M&As but encompasses the entire
industry’s M&As because Korea, China, and Japan do not separately gather start-up M&A statistics.
APPENDICES
Appendix AInterviewee list
No. Organisation Position Date
KOREA
1 Korea Institute of S&T Evaluation and Planning (KISTEP)
President May 2014
2 Ministry of Science, ICT and Future Planning Director May 2014
3 Korea Advanced Institute of Science and Technology (KAIST)
Professor May 2014
4 Venture Leaders Club President May 2014
5 Kyung Hee University Professor May 2014
JAPAN
1 Venture Enterprise Centre (VEC) Manager June 2014
2 Tokyo Institute of Technology Director June 2014
3 The University of Tokyo Edge Capital (UTEC) Director June 2014
4 Japan Venture Capital Association (JVCA) Director June 2014
5 Small & Medium Enterprises and Regional Innovation (SMRJ)
Director June 2014
(continued on next page)
The Start-up Ecosystem in Korea, China, and Japan
179
No. Organisation Position Date
CHINA
1 International Technology Transfer Centre (ITTC), Tsinghua University
Manager November 2014
2 Tsinghua University Professor November 2014
3 Founder Magazine Operation Manager
November 2014
4 Individual Entrepreneur Entrepreneur November 2014
5 Individual Entrepreneur Entrepreneur November 2014
Appendix BTechnology optimisation (R&D) stage index
Appendix A (continued)
Myungho Lee et al.
180
Appendix CFundraising stage index
Appendix DTotal size and number of IPOs
Country ‘09 ‘10 ‘11 ‘12/(1~6) ‘13 (1~6) Rate of change (%)
Adner, R., & Kapoor, R. (2010). Value creation in innovation ecosystems: How the structure of technological interdependence affects firm performance in new technology generations. Strategic Management Journal, 31(3), 306–333. https://doi.org/10.1002/smj.821
Auerswald, P.E., & Branscomb, L.M. (2003). Valleys of Death and Darwinian seas: Financing the invention to innovation transition in the United States. The Journal of Technology Transfer, 28(3–4), 227–239. https://doi.org/10.1023/A:1024980525678
Azorín, J.M., & Cameron, R. (2010). The application of mixed methods in organisational research: A literature review. Electronic Journal of Business Research Methods, 8(2), 95–105.
Bahrami, H., & Evans, S. (2000). Flexible recycling and high-technology entrepreneurship. In K. Martin (Ed.), Understanding Silicon Valley: The anatomy of an entrepreneurial region (pp. 166–189). San Francisco, CA: Stanford University Press.
Beer, S. (1964). Cybernetics and management. New York: John Wiley & Sons, Inc.Bharadwaj, A., El Sawy, O.A., Pavlou, P.A., & Venkatraman, N. (2013). Digital business
strategy: Toward a next generation of insights. MIS Quarterly, 37(2), 471–482. https://doi.org/10.25300/MISQ/2013/37:2.3
Myungho Lee et al.
182
Bruton, G.D., & Rubanik, Y. (2002). Resources of the firm, Russian high-technology startups, and firm growth. Journal of Business Venturing, 17(6), 553–576. https://doi.org/10.1016/S0883-9026(01)00079-9
Cameron, R. (2011). Mixed methods research: The five Ps framework. The Electronic Journal of Business Research Methods, 9(2), 96–108.
Campbell, A., Birkinshaw, J., Morrison, A., & van Basten Batenburg, R. (2003). The future of corporate venturing. MIT Sloan Management Review, 45(1), 30–38.
Ceccagnoli, M., Forman, C., Huang, P., & Wu, D.J. (2012). Co-creation of value in a platform ecosystem: The case of enterprise software. MIS Quarterly, 36(1), 263–290.
Chang, V., & Uden, L. (2008, February). Governance for e-learning ecosystem. Paper presented at the Second IEEE International Conference on Digital Ecosystems and Technologies (DEST 2008), Phitsanulok, Thailand. https://doi.org/10.1109/DEST.2008.4635164
Chesbrough, H., Vanhaverbeke, W., & West, J. (2014). New frontiers in open innovation. Oxford, UK: Oxford University Press. https://doi.org/10.1093/acprof:oso/9780199682461.001.0001
Creswell, J.W. (1999). Mixed-method research: Introduction and application. In T. Cijek (Ed.), Handbook of educational policy (pp. 455–472). San Diego, CA: Academic Press. https://doi.org/10.1016/B978-012174698-8/50045-X
Creswell, J.W., Plano Clark, V.L., Gutmann, M.L., & Hanson, W.E. (2003). Advanced mixed methods research designs. In A. Tashakkori & C. Teddlie (Eds.), Handbook of mixed methods in social and behavioral research (pp. 209–240). Thousand Oaks, CA: Sage.
Currall, S., & Towler, A. (2003). Research methods in management and organizational research: Toward integration of qualitative and quantitative techniques. In A. Tashakkori & C. Teddlie (Eds.), Handbook of mixed methods in social and behavioral research (pp. 513–526). Thousand Oaks, CA: Sage.
Gawer, A., & Cusumano, M.A. (2014). Industry platforms and ecosystem innovation. Journal of Product Innovation Management, 31(3), 417–433. https://doi.org/10.1111/jpim.12105
Hammerstedt, R.H., & Blach, E.L. (2008). Commercialization of basic research from within the university and return of value to the public. Animal Reproduction Science, 105(1), 158–178. https://doi.org/10.1016/j.anireprosci.2007.11.014
Han, J. (2003). Venture business and business strategy. Seoul, Korea: Hongmoon Publishers, Inc.
Han, J., Lee, C., & Kim, Y. (2007). An exploratory study on new venture policies for research institute based entrepreneur in Korea. Asia Pacific Journal of Small Business, 29(3), 99–117.
Herrmann, B.L., Marmer, M., Dogrultan, E., & Holtschke, D. (2012). Startup ecosystem report 2012. Telefónica digital partnered with Startup Genome. Retrieved 5 July 2016 from http://multisiteblog.digital.telefonica.com.s3.amazonaws.com/wpcontent/uploads/2013/01/Startup-Eco_14012013.pdf
The Start-up Ecosystem in Korea, China, and Japan
183
Hurmerinta-Peltomäki, L., & Nummela, N. (2006). Mixed methods in international business research: A value-added perspective. Management International Review, 46(4), 439–459. https://doi.org/10.1007/s11575-006-0100-z
Iansiti, M., & Levien, R. (2004). The keystone advantage: What the new dynamics of business ecosystems mean for strategy, innovation, and sustainability. Boston, Massachusetts: Harvard Business School Press.
IMF (International Monetary Fund). (2016). Regional economic outlook: Asia and Pacific. Washington, DC: International Monetary Fund.
Isenberg, D. (2011). The entrepreneurship ecosystem strategy as a new paradigm for economic policy: Principles for cultivating entrepreneurship (Babson Entrepreneurship Ecosystem Project). Babson Park, MA: Babson College.
Keil, T., McGrath, R.G., & Tukiainen, T. (2009). Gems from the ashes: Capability creation and transformation in internal corporate venturing. Organization Science, 20(3), 601–620. https://doi.org/10.1287/orsc.1080.0373
Kilduff, M., & Tsai, W. (2003). Social networks and organizations: London: Sage Publications. https://doi.org/10.4135/9781849209915
Kim, J. (2014). Platform business and network strategy. STI Policy Review, 5(1), 57–74. Kim, J. (2016). The platform business model and business ecosystem: Quality management
and revenue structures. European Planning Studies, 24(12), 2113–2132. https://doi.org/10.1080/09654313.2016.1251882
Lee, M. (2012). Homo mobilians. Seoul, Korea: Bookconcert Publishers. https://doi.org/10.1080/00918369.2012.699830
Lee, M., & Lee, J. (2010). Super organic enterprise. Seoul, Korea: Gimm-Young Publishers, Inc.
Li, Y.-R. (2009). The technological roadmap of Cisco’s business ecosystem. Technovation, 29(5), 379–386. https://doi.org/10.1016/j.technovation.2009.01.007
Manigart, S., & Struyf, C. (1997). Financing high technology startups in Belgium: An explorative study. Small Business Economics, 9(2), 125–135. https://doi.org/10.1023/A:1007967722346
Mathews, J.A. (1997). A Silicon Valley of the East: Creating Taiwan’s semiconductor industry. California Management Review, 39, 26–54. https://doi.org/10.2307/41165909
McGrath, R.G. (2010). Business models: A discovery driven approach. Long Range Planning, 43(2), 247–261. https://doi.org/10.1016/j.lrp.2009.07.005
Moore, J.F. (1993). Predators and prey: A new ecology of competition. Harvard Business Review, 71(3), 75–86.
Moore, J.F. (1996). The death of competition: Leadership and strategy in the age of business ecosystems. New York: Harper Business.
Murphy, L.M., & Edwards, P.L. (2003). Bridging the valley of death: Transitioning from public to private sector financing. Golden, Colorado: National Renewable Energy Laboratory.
Nambisan, S., & Baron, R.A. (2013). Entrepreneurship in innovation ecosystems: Entrepreneurs’ self-regulatory processes and their implications for new venture success. Entrepreneurship Theory and Practice, 37(5), 1071–1097. https://doi.org/10.1111/j.1540-6520.2012.00519.x
Myungho Lee et al.
184
Onwuegbuzie, A.J., & Leech, N.L. (2004). Enhancing the interpretation of “significant” findings: The role of mixed methods research. The Qualitative Report, 9(4), 770–792.
Ries, E. (2011). The lean startup: How today’s entrepreneurs use continuous innovation to create radically successful businesses. Seoul, Korea: Random House LLC.
Rossman, G.B., & Wilson, B.L. (1985). Numbers and words combining quantitative and qualitative methods in a single large-scale evaluation study. Evaluation Review, 9(5), 627–643. https://doi.org/10.1177/0193841X8500900505
Rossman, G.B., & Wilson, B.L. (1994). Numbers and words revisited: Being “shamelessly eclectic.” Quality and Quantity, 28(3), 315–327. https://doi.org/10.1007/BF01098947
Rothschild, M. (2004). Bionomics: Economy as business ecosystem. New York, NY: Beard Books.
Schwab, K., Porter, M.E., & Sala-i-Martin, X. (2007). The global competitiveness report 2007–2008. Chineham, UK: Palgrave Macmillan Basingstoke.
Smith, R., Pedace, R., & Sathe, V. (2011). VC fund financial performance: The relative importance of IPO and M&A exits and exercise of abandonment options. Financial Management, 40(4), 1029–1065. https://doi.org/10.1111/j.1755-053X.2011.01170.x
Spilling, O.R. (1996). The entrepreneurial system: On entrepreneurship in the context of a mega-event. Journal of Business Research, 36(1), 91–103. https://doi.org/10.1016/0148-2963(95)00166-2
Srinivasan, K. (2009). Management of technology: From invention to innovation. ELICINA Electronics Outlook, 12(5), 27–28.
Townsend, A.K. (2009). Business ecology: Why most green business practices don’t work…and what to do about it. Atglen, PA: Schiffer Publishing Limited.
Van Gelderen, M., Thurik, R., & Bosma, N. (2005). Success and risk factors in the pre-startup phase. Small Business Economics, 24(4), 365–380. https://doi.org/10.1007/s11187-004-6994-6
Zacharakis, A.L., Shepherd, D.A., & Coombs, J.E. (2003). The development of venture-capital-backed internet companies: An ecosystem perspective. Journal of Business Venturing, 18(2), 217–231. https://doi.org/10.1016/S0883-9026(02)00084-8
Zahra, S.A. (2007). Contextualizing theory building in entrepreneurship research. Journal of Business Venturing, 22(3), 443–452. https://doi.org/10.1016/j.jbusvent.2006.04.007
Zahra, S.A., & Nambisan, S. (2012). Entrepreneurship and strategic thinking in business ecosystems. Business Horizons, 55(3), 219–229. https://doi.org/10.1016/j.bushor.2011.12.004
Zhang, J., & Liang, X.-J. (2011). Business ecosystem strategies of mobile network operators in the 3G era: The case of China Mobile. Telecommunication Policy, 35, 156–171. https://doi.org/10.1016/j.telpol.2010.12.009