The Rockefeller University Press $30.00J. Cell Biol. Vol. 210 No. 3 401–417www.jcb.org/cgi/doi/10.1083/jcb.201506110
Introduction
Actin is a key conserved cytoskeletal component in eukaryotic cells. In axons, actin is enriched at growth cones where it is involved in navigation, signaling, and stabilization upon target innervation (Dent et al., 2011; Gomez and Letourneau, 2014). Although the biology of actin at this locale has been intensely investigated, even basic details of actin structure and function along axon shafts are unclear. Early ultrastructural studies in squid axons found abundant actin filaments, not only in the sub-axolemmal region (Hirokawa, 1982; Schnapp and Reese, 1982) but also deep within the axon shaft (Fath and Lasek, 1988; Bearer and Reese, 1999). However, most aspects of axonal actin have remained obscure for decades, perhaps as a result of tech-nical issues related to imaging and preservation of these delicate cytoarchitectural elements. Recently, super-resolution imaging using stochastic optical reconstruction microscopy (STORM) revealed periodic scaffolds of actin circumferentially wrapping underneath the axolemma in a “ladderlike, quasi-1D lattice” pattern—termed “actin rings” (Xu et al., 2013). The actin rings described by STORM are highly stable and likely play import-ant scaffolding roles (Xu et al., 2013; Zhong et al., 2014); how-ever, the microanatomy, dynamics, and putative physiological roles of deep axonal actin remain a mystery to this day.
In most cells, dynamic pools of deep cytoplasmic actin are involved in maintaining intracellular form and function (Mich-elot and Drubin, 2011). Indeed, a few studies hint that axons have dynamic actin pools as well. An early FRAP study with fluorescent-tagged actin saw recovery of the bleached zone in axons within minutes, suggesting a dynamic network (Okabe and Hirokawa, 1990). Other experiments have noted correla-tions of intermittent axonal actin dynamics with morphological fluctuations. Microscopic actin accumulations in distal axons coincided with filopodial extensions in developing neurons—called “actin patches” (Loudon et al., 2006), and curious ac-tin-rich growth cone–like structures move very infrequently along axons (∼1–2 every hour)—best described in young cul-tured neurons—called “actin waves” (Ruthel and Banker, 1998; Flynn et al., 2009). Pulse–chase radiolabeling studies have shown that perikaryally synthesized actin is conveyed by slow axonal transport, also implying dynamism (Black and Lasek, 1979; Willard et al., 1979; Galbraith and Gallant, 2000). Actin is also highly enriched at presynapses, where it plays important structural and functional roles (Cingolani and Goda, 2008).
Though these studies suggest that axonal actin can be dynamic, it is unclear whether the intermittent and infrequent actin behaviors reported so far represent the steady-state situ-
Although actin at neuronal growth cones is well-studied, much less is known about actin organization and dynamics along axon shafts and presynaptic boutons. Using probes that selectively label filamentous-actin (F-actin), we found focal “actin hotspots” along axons—spaced ∼3–4 µm apart—where actin undergoes continuous assembly/disassembly. These foci are a nidus for vigorous actin polymerization, generating long filaments spurting bidirectionally along ax-ons—a phenomenon we call “actin trails.” Super-resolution microscopy reveals intra-axonal deep actin filaments in addition to the subplasmalemmal “actin rings” described recently. F-actin hotspots colocalize with stationary axonal endosomes, and blocking vesicle transport diminishes the actin trails, suggesting mechanistic links between vesicles and F-actin kinetics. Actin trails are formin—but not Arp2/3—dependent and help enrich actin at presynaptic boutons. Fi-nally, formin inhibition dramatically disrupts synaptic recycling. Collectively, available data suggest a two-tier F-actin organization in axons, with stable “actin rings” providing mechanical support to the plasma membrane and dynamic "actin trails" generating a flexible cytoskeletal network with putative physiological roles.
A dynamic formin-dependent deep F-actin network in axons
Archan Ganguly,1 Yong Tang,1 Lina Wang,1 Kelsey Ladt,1,2 Jonathan Loi,1 Bénédicte Dargent,3 Christophe Leterrier,3 and Subhojit Roy1,2
1Department of Pathology and 2Department of Neurosciences, University of California, San Diego, La Jolla, CA 920933Aix Marseille Université, Centre National de la Recherche Scientifique, Centre de Recherche en Neurobiologie et Neurophysiologie de Marseille (CRN2M) UMR7286, 13344 Marseille, France
Correspondence to Subhojit Roy: [email protected] used in this paper: BFA, Brefeldin-A; CH, calponin homology; DIV, day in vitro; NPYss, Neuropeptide-Y signal sequence; ROI, region of inter-est; STORM, stochastic optical reconstruction microscopy; Utr, utrophin.
TH
EJ
OU
RN
AL
OF
CE
LL
BIO
LO
GY
Dow
nloaded from http://rupress.org/jcb/article-pdf/210/3/401/1369488/jcb_201506110.pdf by guest on 12 M
ation in more mature axons. Moreover, the perceived anatomy of putative flexible actin networks is inconsistent with the sta-ble actin rings described by STORM. Finally, deep actin pools play numerous physiological roles in a variety of cell types, but physiological consequences of axonal deep actin pools—if any—are unclear. Here, we use F-actin–selective probes to vi-sualize axonal actin, using a multifaceted approach: low-light live imaging combined with quantitative biology tools and 3D STORM. Our experiments reveal a dynamic, previously un-characterized population of deep axonal actin filaments distinct from subplasmalemmal actin rings.
Results
“Actin trails”—an unrecognized dynamic pool of deep axonal actinHistorically, a challenge in the actin field has been the imaging bulk cytoplasmic F-actin (Field and Lénárt, 2011). Although the classic approach of labeling monomeric actin with GFP/RFP has been fruitful in thin, spread-out growth cones, they are un-satisfactory for visualizing actin within axonal shafts as back-ground fluorescence from free monomers typically overwhelms the signal. To selectively label F-actin, we used two established probes—EGFP tagged to the calponin homology (CH) domain of actin-binding protein utrophin (Utr), GFP:Utr-CH (Burkel et al., 2007), and LifeAct (Riedl et al., 2008). Data from both probes were comparable (see later), but the signal/noise ratio was much better with GFP:Utr-CH, probably because LifeAct also binds actin monomers (with an even higher affinity than filaments; Riedl et al., 2008). Our basic approach was to transfect cultured hippocampal neurons at 7–9 d in vitro (DIV; obtained from post-natal pups) with GFP:Utr-CH and image actin dynamics in axons (also cotransfected with soluble mRFP to visualize morphology). Protocols were optimized to minimize expression and maximize sensitivity of detection (Fig. S1; Materials and methods; and accompanying methods paper, Ladt et al., 2015). For these ex-periments, we focused on primary axons (not branches) with minimal anatomical variations that were away from cell bodies (35–150 µm away from soma, mean = 95 µm) and distal en pas-sant boutons, as in our other studies (Scott et al., 2011; Tang et al., 2012; Fig. 1 A, see RFP image of selected axon at bottom).
Surprisingly, we saw rapid, bidirectional fluorescent plumes representing dynamic actin polymers in axons (actin trails) as shown in the still frames from an exemplary time lapse (Fig. 1 A, tips of trails marked with arrowheads; also see Video 1). A kymograph representing these dynamics is shown in Fig. 1 B (corresponding events in still frames and kymograph are labeled by similar arrowheads in Fig. 1, A and B). Note that actin trail kinetics appear as “fluorescent plumes” in the kymo-graphs (Fig. 1 C, zoomed crops; and additional examples in Fig. S2 A). Other F-actin behaviors can be seen in these kymo-graphs. Note “hotspots” of F-actin, regularly interspersed along the axon (Fig. 1 D, interrupted vertical lines in our kymographs, marked by arrowheads), indicating microscopic zones where actin is continuously polymerizing and depolymerizing (note that depolymerization would cause a loss of GFP:Utr-CH signal as the molecules diffuse away; Burkel et al., 2007). Upon closer examination, many of the actin trails appeared to emanate from (and occasionally collapse into) the F-actin hotspots (Fig. 1 D, asterisks mark the location of the hotspots on kymographs, and numbered arrows point to some examples of actin trails).
Quantitative data from these experiments are shown in Fig. 2. F-actin hotspots were distributed at 3.6 ± 1.8–µm inter-vals along axons (see Materials and methods for details) and lasted for an mean of ∼30 s (Fig. 2 A). Note that the frequencies of actin trails (Fig. 2 B) are orders of magnitude greater than the “actin waves” previously described in younger neurons (Flynn et al., 2009). Moreover, actin trails are not accompanied by axo-nal morphological fluctuations (as determined by simultaneous imaging of GFP:Utr-CH and soluble mRFP; see additional data linked to this article on the JCB DataViewer), and unlike actin waves, are independent of microtubules (see next section). Thus, the actin trails are clearly distinct from the intermittent actin dy-namics described in previous studies (Ruthel and Banker, 1998; Loudon et al., 2006). The polymers comprising the actin trails extended for tens of micrometers (Fig. 2 C), and their rate of extension was striking, with a mean of ∼1 µm/s and a maximum rate of over 2 µm/s. Many actin trails qualitatively appeared to arise from the hotspots. As both of these events could be readily visualized in kymographs (examples in Fig. 1, E and F), we quantified the relationship of actin trails with hotspots. Indeed as shown in Fig. 2 E, ∼80% of the actin trails emerged from hotspots, whereas ∼60% collapsed into them. Actin trails were also seen with LifeAct (Fig. S2, B and C).
Recently, super-resolution microscopy in cultured hip-pocampal axons using labeled phalloidin highlighted striking circumferential rings wrapping underneath the axonal plas-malemma (Xu et al., 2013; Lukinavičius et al., 2014; D’Este et al., 2015). The long dynamic axonal filaments seen in our imaging experiments don’t seem compatible with actin rings, so we performed 3D STORM of neurons labeled with phalloi-din, focusing on axon segments similar to the ones we used for live imaging. Representative images from these experiments are shown in Fig. 3. Axon shafts emerging from the soma (Fig. 3, A–C) as well as thinner, more distal axons (Fig. 3, D–F) ex-hibited circumferential actin rings with a periodic spacing of 192 ± 6 nm, as previously described (Xu et al., 2013; D’Este et al., 2015). However, in addition to these periodic rings, axons also containedactin filaments that were longitudinally oriented along the axon shaft (Fig. 3, B, C, E, and F). XZ cross sec-tions showed these filaments were unequivocally located deep inside the axoplasm, distinct from the subplasmalemmal actin rings (Fig. 3, B′–C′ and E′).
Local actin polymerization in axons—a putative vesicle–actin networkNext, we asked whether the axonal F-actin dynamics were de-pendent on actin turnover. For these experiments, we treated axons with low levels of actin-modulating drugs, examining F-actin dynamics in the same axon before/after pharmacologic treatment. GFP:Utr-CH–transfected neurons were treated with nanomolar doses of latrunculin—a drug that sequesters actin monomers—or jasplakinolide, a drug that promotes actin po-lymerization by enhancing the rate of filament nucleation (Bubb et al., 1994; Morton et al., 2000). As shown in Fig. 4 A, latrun-culin treatment caused a gradual attenuation in the polymeriza-tion rate of actin trails (note changing slopes in kymographs over time, indicating attenuated assembly), which was revers-ible upon drug washout (Fig. S2 D, axons corresponding to the kymographs). The slowing of actin polymerization most likely reflects diminished availability of monomers to the growing polymer, following monomer sequestration by latrunculin. On the other hand, jasplakinolide treatment led to an inhibition of
Dow
nloaded from http://rupress.org/jcb/article-pdf/210/3/401/1369488/jcb_201506110.pdf by guest on 12 M
Figure 1. F-actin dynamics in axons. Neurons were transfected with GFP:Utr-CH to label F-actin (and soluble mRFP to visualize morphology), and F-actin dynamics in axons were imaged as described in methods. (A) Selected frames from a representative video showing anterograde (left) and retrograde (right) dynamics of actin polymers (dynamic tips marked by single/double arrowheads). Image far below shows soluble mRFP in the same axon. Elapsed time in seconds on left/right (see Video 1). (B and C) Kymograph of the video in A with first frame on top shown in B. Boxed ROIs are zoomed in C. Note unusual F-actin dynamics including diagonal, vectorial plumes of fluorescence (actin trails) and hotspots (vertical interrupted lines). Yellow and red arrowheads represent the same dynamic structures in A and B. Elapsed time is given in seconds on the left. (D) Cropped kymographs from other videos show focal F-actin hotspots (some marked by asterisks). Instances of actin trails emerging from—and collapsing into—hotspots can also be seen. Note trails marked by arrows 1, 2, 6, and 7 are emerging from hotspots. Antero, anterograde; Retro, retrograde.
Dow
nloaded from http://rupress.org/jcb/article-pdf/210/3/401/1369488/jcb_201506110.pdf by guest on 12 M
actin trails, along with stationary F-actin accumulations along former hotspots (Fig. 4 B), probably as a result of hyperstabi-lization of dynamic actin. Another actin disrupting agent cyto-chalasin-D also attenuated the actin trails (all data quantified in Fig. 4, D–G). Collectively, these data suggest that actin trails are generated by local polymerization at axonal hotspots.
Microtubules are the basis of almost all motility in axons, and an early ultrastructural study noted a physical approxima-tion of microtubules and actin filaments within the axon shaft (Bearer and Reese, 1999). However, our experiments indicate that actin trails are largely independent of microtubules. First, treatment of axons with the microtubule-depolymerizing agent nocodazole—under conditions that block vesicle transport—had minimal effects on actin trails (Fig. 4, C–F; and Fig. S3 A). Even treatment with vincristine—a drug that fragments micro-tubule polymers, leading to tubulin paracrystals—had no effects
on actin trails (Fig. S3 B). These data indicate that microtu-bules are not required for initiating or sustaining the actin trails. Moreover, actin trails do not seem to assist conventional vesicle transport in any way, as treatment with jasplakinolide—a drug that almost completely blocks the actin trails (Fig. 4 B)—did not impede vesicle transport (Fig. S3 C). Also note that incuba-tion with DMSO (used as controls in some experiments) had no effects on axonal F-actin dynamics (Fig. S3 D).
The actin hotspots appear critical for initiating the axonal F-actin network, but how is this local assembly regulated? Re-cent studies in mouse oocytes described a deep F-actin network where actin filaments nucleate and polymerize on the surface of scattered endosomes (Pfender et al., 2011; Schuh, 2011). The periodic spacing of axonal F-actin hotspots (∼3–4 µm) is also reminiscent of stationary endosomal vesicles in axons (Fig. S4 A; Prekeris et al., 1999). Thus, we reasoned that the
Figure 2. Quantitative analyses of F-actin hotspots and trails. (A) Mean lifetime of F-actin hotspots was 80.40 ± 3.95 s (n = 575 events from 28 axons). (B) Mean number of F-actin trails (every 10 min of imaging) was 20.35 ± 1.98 for anterograde events and 14.92 ± 1.35 for retrograde events (992 events from 28 axons). (C) Mean total lengths of F-actin polymers were 8.85 ± 0.18 µm (n = 573 events) and 8.87 ± 0.22 µm (n = 419 events) for anterograde and retrograde trails, respectively. (D) Mean elongation rates of F-actin trails were 0.99 ± 0.01 µm/s in both directions. (E) On average, 80.59 ± 2.23% F-actin trails emerged from hotspots (n = 36 axons). (F) On average, 63.00 ± 2.80% F-actin trails collapsed into hotspots (n = 36 axons). Arrowheads and asterisks in E and F represent initiation/termination of actin trails and position of hotspots, respectively. All values represent means ± SEM. Antero, anterograde; Retro, retrograde.
Dow
nloaded from http://rupress.org/jcb/article-pdf/210/3/401/1369488/jcb_201506110.pdf by guest on 12 M
F-actin hotspots in our experiments may also be initiated by actin monomers nucleating on stationary axonal endosomes. To test this idea, we labeled F-actin (using GFP:Utr-CH) and endo-somes in neurons and imaged axons by dual-color live imaging. As shown in Fig. 5 (A and B), F-actin hotspots were often colo-calized with (or adjacent to) stationary endosomes, with several actin trails initiating precisely from locales where endosomes were situated (Fig. 5 A′ shows an example). Next, we designed quantitative algorithms in MATLAB to determine the overlap between F-actin hotspots and stationary endosomes (see Mate-
rials and methods for details). Data from these analyses suggest that many F-actin hotspots colocalize with stationary axonal endosomes (Fig. 5 C, left). There is some innate variability in the frequencies of F-actin trails from axon to axon (Fig. 2 B; also seen with other cargoes, see Tang et al., 2013). We found that frequency of F-actin trails correlated with the number of stationary axonal endosomes (Fig. 5 C, right), further suggest-ing links between endosomes and actin dynamics. If actin trails were indeed dependent on vesicles, conditions attenuating ax-onal vesicles would also be expected to diminish actin trails.
Figure 3. 3D STORM imaging of actin reveals intra-axonal actin bundles. (A and A′) Widefield image of a hippocampal neuron labeled with phalloidin (F-actin) and Neurofascin-186 (NF-186; to label the axon initiation segment [AIS], brackets). Proximal axon marked with arrowheads. (A′) 3D-STORM image of the actin labeling corresponding to the boxed area in A. Color codes for Z depth from −300 nm (blue) to 300 nm (red). Note Y-shaped proximal axon, as well as distal axons from other neurons. (B and C) Zoomed XY projections (300–600 nm thick) of the boxed regions (B and C) in image A′. Note that several longitudinal actin filaments can be seen within the axon shaft (arrowheads), in addition to periodic actin rings (comb). (B′ and C′) XZ slices (800 nm thick) from axons shown in B and C (area within brackets) highlighting intra-axonal actin filaments (arrowheads, dashed ellipse localizes the axon boundary). (D) 3D STORM image of distal axons with a dendritic shaft on right. Color codes for Z depth from −300 nm (blue) to 300 nm (red). (E and E′) XY/XZ projections (300–400 nm thick) of the boxed regions E in image D. Note longitudinal actin filaments inside the distal axon (arrowheads), together with the periodic actin rings (comb). (F and F′) Same imaging parameters and scales as previous, showing an axon segment with actin rings. Bars: (A) 20 µm; (A′ and D) 5 µm; (B, C, and E–F′) 2 µm; (B′ and C′) 500 nm.
Dow
nloaded from http://rupress.org/jcb/article-pdf/210/3/401/1369488/jcb_201506110.pdf by guest on 12 M
arch 2022
JCB • VOLUME 210 • NUMBER 3 • 2015406
To test this, we incubated neurons with Brefeldin-A (BFA), a drug that blocks endoplasmic reticulum to Golgi transport and attenuates vesicle transport in axons (Fig. S4, B and C; Jareb and Banker, 1997; Tang et al., 2013). Indeed both frequency and dynamics of actin trails were dramatically attenuated upon BFA treatment and reappeared upon drug washout (Fig. 5, D and E). Some stationary accumulations of F-actin were still visible after BFA treatment—though the durations of these hotspots were
much prolonged—and might be a result of incomplete vesicle depletion by BFA treatment.
The extremely rapid rate of actin polymerization in our system (∼1 µm/s; Fig. 2 C) is striking, resembling rates previ-ously observed for formin-mediated actin elongation in vitro (Vidali et al., 2009) and in cells (Higashida et al., 2004). Formins are a group of highly conserved proteins that bind to the barbed (growing) ends of actin filaments, promoting rapid nucleation
Figure 4. Axonal F-actin dynamics are dependent on actin turnover. (A and B) Kymographs from an axon transfected with GFP:Utr-CH (to label F-actin) and imaged before/after treatment with 100 nM latrunculin or 100 nM jasplakinolide. (A) Note gradual change in the slopes of the F-actin trails over 15 min of incubation, indicating attenuated polymerization. Drug washout (W/O) restores F-actin dynamics (right). (B) Treatment with jasplakinolide for 10 min essentially eliminates the on/off kinetics, leading to stationary F-actin accumulations along axons. (C) Kymographs of F-actin dynamics before and after treatment with 10 µg/ml nocodazole (NOC; note minimal change; Fig. S3 A). (D–G) Quantification of all F-actin dynamics after pharmacological treatments. Note that in general, actin-modulating drugs (latrunculin [LAT], cytochalasin-D, and jasplakinolide [JASP]) attenuate actin dynamics, whereas the microtubule-disrupting agent nocodazole has no effect. Also note increase in hotspot duration upon cytochalasin-D treatment is likely caused by the actin-capping effect of this agent (Cooper, 1987). Increase in hotspot duration upon jasplakinolide treatment may reflect hyperstabilization of F-actin dy-namics. All experiments were performed before and after treating the same axon with the stated drug. For latrunculin treatment, n = 8 axons; cytochalasin-D treatment, n = 8 axons; jasplakinolide treatment, n = 6 axons; and nocodazole treatment, n = 8 axons were imaged. At least three independent repeats were performed for each condition. All values represent means ± SEM; (***, P < 0.001; **, P < 0.01, paired t test). For detailed statistics, see Table S1. Arrows between images represent passage of time in before/after experiments.
Dow
nloaded from http://rupress.org/jcb/article-pdf/210/3/401/1369488/jcb_201506110.pdf by guest on 12 M
and elongation (Chesarone et al., 2010). To determine whether formins were involved in generating axonal F-actin dynamics, we incubated neurons with the selective small-molecule formin
inhibitor SMIFH2 (Rizvi et al., 2009) and examined F-actin dy-namics in axons. Indeed, SMIFH2 attenuated the actin trails, whereas an inhibitor of another major actin nucleator Arp2/3
Figure 5. Correlation of axonal F-actin dynamics and stationary endosomes. (A) Kymographs from neurons transfected with GFP:Utr-CH (to label F-actin) and pHRodo (a pH-sensitive endosomal marker that largely labeled stationary endosomes in axons, see Materials and methods), simultaneously visualized by live imaging. Note colocalization of F-actin hotspots (green) with pHrodo (red, overlay on right). A′ shows a zoomed ROI from overlay highlighting two actin trails originating precisely from where two stationary endosomes are situated (marked by asterisks). (B) Kymographs from neurons transfected with GFP:Utr-CH (to label F-actin) and Rab5:mCherry (to label early endosomes). Note colocalization of F-actin hotspots with early endosomes. (C, left) Quantification of colocalization data. The mean frequency of F-actin hotspots that overlapped with stationary endosomes labeled with pHRodo, Rab5-mRFP, and Lamp1-mCherry was 46.81 ± 2.76% (n = 13 axons), 29.04 ± 3.75% (n = 10 axons), and 9.58 ± 3.61% (n = 6 axons), respectively. (right) F-actin dynamics also correlated with number of pHRodo-positive endosomes in axons (n = 16 axons). (D and E) Neurons weretransfected with GFP:Utr-CH (to label F-actin) and treated with Brefeldin-A (BFA) to deplete vesicles in axons (Fig. S4 B). Kymographs show that F-actin dynamics in axons were greatly attenuated upon BFA treatment and restored upon washout of the drug; quantified in E. All values represent means ± SEM. ***, P < 0.001, one way analysis of variance followed by Dunnett’s post hoc test. For detailed statistics, see Table S1.
Dow
nloaded from http://rupress.org/jcb/article-pdf/210/3/401/1369488/jcb_201506110.pdf by guest on 12 M
(CK666; Nolen et al., 2009) had no effect (Fig. 6, A and B). These data (quantified in Fig. 6, C–F) indicate that the elon-gation of actin trails is formin dependent. As formins are in-volved in both nucleation and elongation of actin (Chesarone et al., 2010), one might expect that SMIFH2 treatment would also inhibit the appearance of hotspots. Interestingly, however, not only were the hotspots present after SMIFH2 treatment, but in fact, there was an increase in their duration (Fig. 6 F). These data suggest that the nucleation of F-actin at the hotspots (pre-sumably on endosomes) is not formin dependent, and the slight increase in hotspot duration upon SMIFH2 treatment might be a compensatory consequence of decreased actin trails emanat-ing from the hotspots. Finally, SMIFH2 treatment had minimal effects on vesicle transport, as determined by live imaging of synaptophysin:mRFP, a marker for motile synaptic vesicles, or Neuropeptide-Y signal sequence (NPYss):mCherry, a marker for Golgi-derived vesicles (El Meskini et al., 2005; Kaech et al., 2012). These data strongly argue against nonspecific pertur-bation of axonal transport by SMIFH2 (Fig. S5, A and B). For detailed statistics, see Tables S1 and S2.
Presynaptic F-actin enrichment is formin dependentNext, we looked at F-actin at presynaptic specializations along axons. Actin is highly enriched at presynapses, and several studies have reported that actin filaments are circumferentially organized as a cage-like structure surrounding the synaptic ves-icle cluster (Landis et al., 1988; Hirokawa et al., 1989; Gotow et al., 1991; Saheki and De Camilli, 2012). These conclusions—based on imaging fixed boutons with phalloidin or examination of total actin pools tagged with GFP—have shaped a prevail-ing view that actin plays a scaffolding role at this locale (Bern-stein et al., 1998; Morales et al., 2000; Sankaranarayanan et al., 2003). However, studies also suggest that actin has other roles at synapses, including sequestration of synaptic vesicles and fa-cilitation of endocytosis (Cingolani and Goda, 2008; Chia et al., 2013; Christensen et al., 2013). To visualize organization of F-actin at live boutons, we transfected 9–12 DIV neurons with GFP:Utr-CH and synaptophysin:mRFP (to label F-actin and the synaptic vesicle cluster, respectively); located distal en passant boutons along the primary axon by synaptophysin:mRFP mor-phology (Fig. 7; Wang et al., 2014) and performed dual-color live imaging. As expected, steady-state F-actin accumulation at boutons was significantly greater than axons (mean diameters for GFP:Utr-CH–labeled puncta at boutons/axons were 18.5 ± 2.8/4.1 ± 0.2 µm, respectively; sampling of ∼20–50 Utr-CH:GFP puncta for each; P < 0.0001).
Interestingly, though the overall distribution of F-actin was somewhat circumferential around the synaptic vesicles, the localization was highly dynamic, with microscopic synaptic patches of Utr-CH:GFP spontaneously appearing and disap-pearing over time (Fig. 7 A and Video 2). Also, actin trails were invariably seen in axon segments flanking boutons, and these trails often seemed to terminate at boutons, suggesting F-ac-tin delivery, though the high levels of F-actin at boutons and overlapping tracks of actin trails at these locales made definitive conclusions difficult (Fig. 7 B, example kymograph). To evalu-ate actin delivery into boutons in a more systematic way, we de-signed a FRAP assay in which we photobleached GFP:Utr-CH in a single bouton within a string of en passant boutons and analyzed fluorescence recovery over time (see Materials and methods; Scott and Roy, 2012). Fluorescence recovery at bou-
tons occurred within minutes, suggesting rapid delivery of F-ac-tin into these specializations (Fig. 7 C, left, though we cannot exclude diffusion/local assembly of unbound GFP:Utr-CH in these experiments). If the GFP:Utr-CH recovery was mediated by formin-dependent actin trails as predicted by our model, one would expect that inhibition of formins would also attenuate actin delivery into boutons. Indeed fluorescence recovery was attenuated in neurons treated with the formin inhibitor SMIFH2 (Fig. 7 C, right; quantified in Fig. 7 D). Moreover, SMIFH2 also attenuated steady-state Utr-CH:GFP levels in the synaptic patches (Fig. 7, E and F). In aggregate, these data argue that the formin-dependent actin dynamics in axons helps presyn-aptic enrichment of F-actin.
Formin inhibition disrupts synaptic vesicle recyclingCollectively, the aforementioned experiments suggest that axons have an intricate, dynamic formin-dependent deep F-ac-tin network that help enrich F-actin at boutons. Enrichment of actin at synapses has been generally implicated in regulation of synaptic physiology (Cingolani and Goda, 2008; Waites et al., 2011) and more specifically in the myosin-dependent traffick-ing of synaptic vesicles to the plasma membrane (Ryan, 1999) and/or endocytosis (Shupliakov et al., 2002). Accordingly, we asked whether inhibition of formins—and consequent atten-uation of synaptic F-actin levels—would influence synaptic vesicle recycling. Toward this we directly visualized synaptic recycling using the pH-sensitive probe vGlut-pHluorin, asking whether the formin-inhibitor SMIFH2 had any effect on the exo/endocytic kinetics (Fig. 8 A, schematic). The principle of the vGlut-pHluorin assay is that pH changes during activity-in-duced recycling of synaptic vesicles result in fluorescence fluc-tuations that can be readily quantified and provide a readout of synaptic vesicle exo/endocytosis (Voglmaier et al., 2006; Ba-laji and Ryan, 2007; Wang et al., 2014). Representative images from one such experiment is shown in Fig. 8 B and quantitative data in Fig. 8 (C and D). Note that treatment with SMIFH2 re-sulted in a dramatic attenuation of the exo/endocytic cycle, but the Arp2/3 inhibitor CK-666 had essentially no effects.
Discussion
A dynamic F-actin network—a new model for axonal actinOur experiments reveal a two-tier organization of axonal F-ac-tin—with stable subplasmalemmal rings (originally described by Xu et al., 2013) that mechanically support the plasma mem-brane and dynamic intra-axonal filaments that helps enrich actin at synapses, sustaining physiology. Collectively, our data sug-gest a scenario in which actin monomers nucleate at discrete hotspots along axons, on the surface of stationary endosomes. Some of these hotspots lead to sustained formin-dependent actin assembly and elongation, resulting in dynamic deep actin polymers that can reach remarkable lengths of 30 µm or more (actin trails; Fig. 9 A). Over time, the polymer disassembles or occasionally shrinks. Though individual filaments are dynamic, we posit that at steady state, they generate a robust cytoskeletal network that that allows spatiotemporal control of actin levels throughout these long processes (Fig. 9 B).
In principle, the vesicle–actin network we postulate would allow rapid availability of actin to virtually any location within
Dow
nloaded from http://rupress.org/jcb/article-pdf/210/3/401/1369488/jcb_201506110.pdf by guest on 12 M
the axon, provided vesicles assisting actin nucleation events are present. Also, though dynamic, the axonal actin filaments are still likely able to support putative short-range myosin-driven axonal transport (Bridgman, 2009). Because these physiolog-ical events necessarily rely on dynamic actin pools and/or in-tra-axonal polymers oriented along the long axis, involvement
of rigid, circumferential cytoskeletal structures such as the subplasmalemmal actin rings seem unlikely. The vesicle–actin network that we describe may even be a common evolutionary strategy that equilibrates actin within large cells or elongated processes. Using GFP:Utr-CH in mouse oocytes, Pfender et al. (2011) and Schuh (2011) recently described a vesicle–actin net-
Figure 6. Axonal F-actin dynamics are Formin dependent. (A) Kymographs from an axon transfected with GFP:Utr-CH (to label F-actin) and imaged before (left) and after (right) treatment with the formin-inhibitor SMIFH2. Note dramatic attenuation of the F-actin trails with little effect on F-actin hotspots, suggesting that the nucleation of F-actin at hotspots is spontaneous, and not formin dependent. (B) Similar experiments as in A, except that neurons were treated with the Arp2/3 inhibitor CK-666. Note that addition of CK-666 essentially has no effects on axonal F-actin dynamics. (C–F) Quantification of F-actin dynamics from all experiments. Note that treatment with SMIFH2 attenuates various kinetic behaviors of the F-actin trails, whereas CK-666 has no effects. Also note that SMIFH2 treatment leads to an increase in the hotspot duration, perhaps a compensatory response to attenuated actin trails (also see Results). For SMIFH2 treatment, n = 9 axons and for CK-666 treatment, n = 6 axons were imaged. At least three independent repeats were performed for each condition. All values represent means ± SEM. *, P < 0.05; **, P < 0.01; ***, P < 0.001; paired t test. For detailed statistics, see Table S1. Arrows between images represent passage of time in before/after experiments.
Dow
nloaded from http://rupress.org/jcb/article-pdf/210/3/401/1369488/jcb_201506110.pdf by guest on 12 M
Figure 7. Presynaptic F-actin dynamics are Formin dependent. (A) Images (left) and kymographs (right) of boutons from neurons transfected with GFP:Utr-CH (to label F-actin) and synaptophysin:mRFP (SyPhy:mRFP to label synaptic vesicle clusters). Note that F-actin appears as dynamic patches, circumferentially organized around the synaptic vesicle cluster. (B) Same experiment as above, except GFP:Utr-CH kymographs are scaled to reveal actin trails terminating into boutons (small arrowheads). (C and D) Representative images from a FRAP assay to detect F-actin entry into boutons, quantified in D. Neurons were transfected with GFP:Utr-CH and F-actin–enriched boutons were identified; a single bouton (dashed circles) within a string of synapses was photobleached, and recovery of fluorescence was visualized over time (see Materials and methods for details). Note rapid recovery of F-actin that is attenuated upon formin inhibition by SMIFH2, indicating diminished entry of F-actin into boutons after formin inhibition. (E and F) Maximum intensity pro-jection images from a representative synaptic bouton demonstrate reduction in total F-actin fluorescence upon SMIFH2. Graph in F shows that fluorescence intensities decrease from 1,859 ± 351.7 to 999.1 ± 146.7 arbitrary fluorescence units (n = 9 boutons paired) upon SMIFH2 treatment for 30 min. All values represent means ± SEM. Paired t test **, P < 0.01.
Dow
nloaded from http://rupress.org/jcb/article-pdf/210/3/401/1369488/jcb_201506110.pdf by guest on 12 M
arch 2022
F-actin trails in axons • Ganguly et al. 411
Figure 8. The Formin inhibitor SMIFH2 suppresses synaptic recycling. (A) Schematic of vGlut1-pHluorin experiments. SV refers to synaptic vesicle. (B) Representative panels show the fluorescence intensity change of vGlut1-pHluorin upon 600 action potential (AP) stimulation and NH4Cl perfusion. Note that NH4Cl alkalinizes all vesicles, revealing the total (recycling + resting) pool in these neurons. (C) Ensemble mean of vGlut1-pHluorin traces from control, 50 µM CK-666, or 30 µM SMIFH2-treated neurons (n = number of boutons). Note that although SMIFH2 attenuates neurotransmitter release and decreases synaptic vesicle endocytosis compared with control, CK-666 has no effect, quantified in C (all data normalized to total pools). (D, left) Recycling: Total pool ratio for control = 49.55 ± 3.81%; CK-666 = 45.65 ± 3.72%; and SMIFH2 = 23.84 ± 2.82%. (middle) Exocytosis rate for control = 0.017 ± 0.002; CK-666 = 0.014 ± 0.002; and SMIFH2 = 0.007 ± 0.001. (right) Endocytosis rate for control = 0.007 ± 0.002; CK-666 = 0.007 ± 0.002; and SMIFH2 = 0.001 ± 0.001. All values represent means ± SEM. (∼100–200 boutons on 7–11 coverslips were analyzed for each group from three separate batches of cultures; ***, P < 0.001; **, P < 0.01 compared with control by one-way analysis of variance followed by Dunnett’s post hoc test.)
Figure 9. Model of axonal F-actin. (A) Interpretative illustration derived from data. Actin monomers nucleate and polymerize at discrete microscopic zones in axons (light gray vertical bar). The hotspots are likely sites where actin nucleates on stationary endosomes. (B) Working model showing both subplasmalemmal actin rings and intra-axonal actin filaments. Note that actin monomers nucleate and extend polymers along the long axis of the axon, generating a steady-state scenario where actin is equilibrated along the axon, allowing spatiotemporal control throughout the long processes, and facili-tating delivery into presynaptic boutons.
Dow
nloaded from http://rupress.org/jcb/article-pdf/210/3/401/1369488/jcb_201506110.pdf by guest on 12 M
arch 2022
JCB • VOLUME 210 • NUMBER 3 • 2015412
work where F-actin polymerizes on the surface of endosomes dispersed throughout the oocyte cytoplasm. Interestingly, this polymerization is also formin dependent (Schuh, 2011). Cy-toplasmic F-actin density in these oocytes vary with the stage of maturation, and the F-actin network density also correlated with endosomal abundance—suggesting that the vesicles were regulating the oocyte actin network (Pfender et al., 2011). These findings are strikingly reminiscent of our own data, in which endosomal abundance in axons correlates with F-actin dynamics (Fig. 5 C, right).
Another possibility is that the actin trails might be in-volved in assisting vesicle transport, analogous to “actin com-ets” in Listeria monocytogenes that are capable of transporting vesicles (Tilney and Portnoy, 1989). Though intriguing, this does not appear to be the case in axons. First, it is clear that axonal endosomal vesicles remain largely stationary, whereas actin trails elongate (Fig. 5, A and B), indicating that the actin trails have little effect on the motility of these organelles. Sec-ond, inhibition of the actin trails—either by jasplakinolide or the formin-inhibitor SMIFH2—does not have much effect on the axonal transport of Golgi-derived vesicles (Fig. S3 C and Fig. S5, A–C). Moreover disruption of microtubules—and mi-crotubule-based transport—has no effect on axonal F-actin dy-namics (Fig. 4, C–G; and Fig. S3 B).
The microanatomy of axonal F-actinPrecise knowledge of the organization, polarity, and dynamics of actin along axon shafts has been fuzzy for decades. Previ-ous studies using extruded squid axons showed an extensive network of intra-axonal actin filaments (Fath and Lasek, 1988; Bearer and Reese, 1999). However, procedures used in these studies invariably disrupted the cytoskeletal organization, pre-cluding definitive conclusions. For instance, myosin-S1 la-beling—used to determine actin polarity—could only label a subset of filaments; nevertheless, Bearer and Reese (1999) noted “actin filaments with both polarities” along axons. In our experiments, actin filaments elongate both anterogradely and retrogradely along axons, and this would expectedly appear as bipolar filaments in fixed axons. However, our live observations also reveal that the organization is far more sophisticated than a simple stacking of bipolar actin filaments along axons as pre-viously imagined, even though the exact polarity orientation of the elongating monomers remains unknown.
Though earlier EM experiments also showed a close ap-position of microtubules and F-actin, disruption—and even fragmentation—of axonal microtubules had no effect on F-ac-tin dynamics, suggesting that the F-actin axonal dynamics in our axons are largely independent of microtubules (Fig. 4, C–F; and Fig. S3, A and B). One possibility is that despite anatomical apposition, molecular mechanisms regulating F-actin dynam-ics are largely independent of microtubules. It is also possible that the relationship between microtubules and actin filaments is more intimate in the much thicker squid axons. Also, the lengths of axonal F-actin estimated by EM were small (∼0.5–1 µm on average; Bearer and Reese, 1999), leading to the view that actin filaments in axons are short (Letourneau, 2009). How-ever, only a subset of filaments could be confidently evaluated in these EM experiments because of technical limitations, and postfixation preservation of the dynamic filaments (that are seen in our live imaging experiments) might also be an issue. In view of our live F-actin imaging and STORM data (using optimal fix-ation protocols for F-actin, see Materials and methods), it now
seems likely that intra-axonal actin filaments can grow on to much longer lengths than previously believed.
Our experiments suggest that the elongating actin poly-mers are dependent on formins, and not Arp2/3 (Fig. 6). Formins mediate elongation of long, unbranched actin fila-ments, whereas Arp2/3 extends branched F-actin polymers on the side of preexisting actin filaments (Goode et al., 2001), thus it seems logical that formins would mediate the long, rapidly elongating polymers seen in our experiments. Interestingly, the F-actin hotspots are not disrupted by formin inhibition (Fig. 6, A and F), suggesting that actin assembly on the sur-face of endosomes is not formin dependent. The colocalization of F-actin hotspots and endosomes in axons is often quite pre-cise (Fig. 5, A and B); however, our data cannot exclude the possibility that both F-actin and endosomes bind to a common, yet unknown, structure/organelle in axons. Intriguingly, elon-gating actin trails often seem to “deposit” F-actin along axons during periods of elongation, perhaps by local depolymeriza-tion (Fig. 1 C, top kymograph and other figures)—though un-derlying mechanisms are unclear. Perhaps such local regulation reflects cell-biological strategies by which F-actin localizes and enriches along axons and synapses.
Organization and function of F-actin at presynaptic specializationsOur experiments also offer some insights into the organization and function of actin at presynapses. Previous studies examin-ing steady-state F-actin at synapses have noted a cage-like dis-tribution surrounding the synaptic vesicle cluster. Based largely on staining of fixed cells, this view has been held for some time, advocating a model in which F-actin acts as a scaffold at syn-apses (Wang et al., 1996; Bernstein et al., 1998; Morales et al., 2000; Sankaranarayanan et al., 2003). This actin scaffold has also been has been proposed to act as a “barrier” that restricts the trafficking of synaptic vesicles to the plasma membrane, suppressing vesicle recycling and exocytosis (Morales et al., 2000). However, other experiments suggest that actin–myosin networks are involved in transporting synaptic vesicles from the reserve pool to their fusion sites at the plasma membrane (Ryan, 1999) and/or play a role in endocytic trafficking of recycling synaptic vesicles (Shupliakov et al., 2002). Our live-imaging experiments of boutons along primary axons suggest dynamic F-actin patches around the synaptic vesicle cluster (Fig. 7 A and Video 2). Furthermore, our data suggest that F-actin synaptic patches are sustained by the actin trails. Specifically, attenu-ation of the actin trails by the formin-inhibitor SMIFH2: (a) decreased overall F-actin delivery to boutons as measured by FRAP (Fig. 7 D) and (b) decreased the intensity of the F-actin synaptic patches (Fig. 7 E).
The synaptic F-actin patches resemble transient F-actin localization along endocytic zones in the plasma membranes of other cell types (Michelot and Drubin, 2011). Along these lines, it is interesting to speculate that these “synaptic patches” might represent spontaneous endocytic events in resting neu-rons (Melom et al., 2013). Indeed, other studies have implicated actin in synaptic vesicle endocytosis. Detailed ultrastructural studies in the large lamprey reticulospinal synapse revealed long actin filaments connecting endocytic zones at the plasma membrane to single synaptic vesicles and vesicle clusters upon stimulation (Shupliakov et al., 2002). Recent studies also sup-port a role for actin in rapid, nonclathrin-mediated “ultrafast” endocytosis (Watanabe et al., 2014). However, available data in-
Dow
nloaded from http://rupress.org/jcb/article-pdf/210/3/401/1369488/jcb_201506110.pdf by guest on 12 M
arch 2022
F-actin trails in axons • Ganguly et al. 413
dicate that actin likely has multiple roles at boutons, especially in assembling and organizing presynaptic components (Waites et al., 2011; Chia et al., 2013, 2014; Nelson et al., 2013), and it is also possible that these patches dynamically assist in such organization. Our pHluorin experiments indicate that inhibition of formins has a dramatic effect on synaptic recycling (Fig. 8). Given that SMIFH2 diminishes F-actin enrichment at boutons (Fig. 7, E and F), we hypothesize that the effects on recycling are a result of synaptic F-actin attenuation. However, a caveat in these experiments is that we cannot exclude a local effect of SMIFH2 at the synapse, or putative effects of this drug on the postsynapse, and more detailed studies are needed to clarify the functional roles of actin and formin at these locales.
In summary, our experiments reveal molecular details of a previously unappreciated dynamic pool of deep actin fil-aments in axons and offer new insights into the emerging pic-ture of axonal actin. Collectively, the available data advocate a model in which stable subplasmalemmal actin rings mechan-ically support the axonal plasma membrane, and dynamic in-tra-axonal filaments support physiological processes critical for maintaining axonal and synaptic plasticity. Interestingly, this two-tier organization seems to result in a paradoxical cytoskel-etal network that not only tolerates the incredible mechanical strains that long axons must endure but also allows the flexi-bility needed in a structure that is continuously shaped by in-trinsic and extrinsic factors.
Materials and methods
DNA constructs, cell cultures, and transfectionsGFP:Utr-CH was a gift from W. Bement (University of Wisconsin, Madison, WI). NPYss:mCherry, Synaptophysin-dsRed, and pHluo-rin constructs were gifts from G. Banker (Oregon Health & Science University, Portland, OR), L. Lagnado (University of Sussex, Sussex, England, UK), and T. Ryan (Weill Cornell, New York, NY), respec-tively. DsRed-Mitochondria construct was obtained from Takara Bio Inc. Rab5:mRFP, Lamp1:mCherry, LifeAct:mTurquoise-2, and Life-Act:GFP were obtained from Addgene (from the laboratories of A. He-lenius [ETH Zurich, Zurich, Switzerland], A. Palmer [University of Colorado, Boulder, CO], D. Gadella [Swammerdam Institute for Life Sciences, Amsterdam, Netherlands], and M. Davidson [Florida State University, Tallahassee, FL], respectively). The rabbit anti–βIII-Tubu-lin antibody was a gift from P. Bass (Drexel University, Philadelphia, PA). Hippocampal cultures were obtained from brains of postnatal (P0–P1) CD-1 mice and plated on MatTek glass-bottom dishes as described previously in detailed published protocols (Roy et al., 2012; Ganguly and Roy, 2014), in accordance with University of California guidelines. In brief, MatTek dishes were coated with 100 µl of 1 mg/ml poly-d-ly-sine for 2 h at RT, washed thrice with ddH2O, and air dried before plat-ing. Hippocampi from P0–P1pups were dissected in ice-cold dissection buffer (HBSS, 4.44 mM d-glucose, and 6.98 mM Hepes) and incu-bated in 0.25% Trypsin–EDTA at 37°C for 15 min. After this, neurons were dissociated in plating media (10% FBS and 90% Neurobasal/B27; Life Technologies) by trituration. Neurons were plated at a density of 50,000 cells/100 µl (only for en passant bouton imaging) and at 25,000 cells/100 µl (for all other experiments) of plating media. Neurons were maintained in Neurobasal/B27 media (supplemented with 2% B27 and 1% GlutaMAX) in an incubator at 37°C and 5% CO2 for 7–9 d before transfection. Neurons were transfected with the indicated fluorescent constructs 7–9 DIV with Lipofectamine 2000 (Life Technologies), and all live imaging was performed ∼16–20 h after transfection. Trans-
fection parameters were strictly optimized for GFP:Utr-CH to avoid actin bundling (Fig. S1). Specifically, two criteria were followed. (1) Neurons were transfected with one third the amount of DNA routinely used in our laboratory (0.3 µg vs. 1.2 µg DNA in 5 ml Neurobasal/op-ti-MEM mixture used with Lipofectamine transfections; Ganguly and Roy, 2014), and (2) only neurons showing a fine speckled, discontin-uous pattern of GFP:Utr-CH distribution in dendrites were chosen for imaging (see examples in Fig. S1). Using these criteria (low expres-sion; imaging with high-sensitivity electron-multiplying charge-cou-pled device cameras), only about a third of transfected axons in a coverslip were suitable for imaging. Axonal F-actin dynamics were not seen in high overexpressers, and we found that it was critical to follow the aforementioned guidelines.
Single- and dual-color live imaging of axons and synapsesLive-imaging experiments with GFP:Utr-CH and LifeAct:mTur-quoise-2/GFP were performed using an inverted epifluorescence mi-croscope (Eclipse Ti-E; Nikon) equipped with CFI S Fluor VC 40× oil (NA 1.30; Nikon) and CFI Plan Apochromat VC 100× oil (NA 1.40; Nikon) objectives. An electron-multiplying charge-coupled device cam-era (QuantEM:512SC; Photometrics) and LED illuminator (SPECTRA X; Lumencor) were used for all image acquisition. The system was controlled by Elements software (NIS Elements AR 4.13.00 64 bit; Nikon). Immediately before live imaging, neurons were transferred to a Hibernate-E-Low Fluorescence media (Brainbits, LLC), supplemented with 2% B27, 2 mM GlutaMAX, 0.4% d-glucose, and 37.5 mM NaCl (live imaging media) and maintained between 35.5–37°C (on a heated stage chamber, model STEV; World Precision Instrument, Inc.) for the duration of the experiment. Transfected axons were identified based on morphology using soluble mRFP (which was cotransfected with GFP:Utr-CH), and only neurons with unambiguous morphology, where axons could be confidently identified, were selected for imaging (Roy et al., 2012; Ganguly and Roy, 2014). Utr-CH and LifeAct were typically imaged at 1 frame/s (400-ms exposure, 20% LED power) for 10 min. For dual-color imaging, exciting red/green LED lights were rapidly switched (within microseconds) using the SPECTRA X LED illuminator, achiev-ing near-simultaneous two-color imaging. A multi–band-pass filter (Chroma Technology Corp.) was inserted into the emission light path, and GFP/RFP images were obtained with precise subpixel registration. Exposures for both the green and red channels were set at 400 ms (20% LED power). For imaging en passant boutons, 9–12 DIV neurons were cotransfected with synaptophysin:dsRed and GFP:Utr-CH, and boutons were identified based on size of the synaptic vesicle cluster and mor-phology (Wang et al., 2014). Boutons along the primary axon, >150 µm from the soma were selected for imaging. Additionally, axons selected for imaging had at least two or more en passant boutons in proximity. Mi-tochondrial dynamics along the axons was imaged at 3-s intervals (500-ms exposure) for a duration of 5 min as described earlier (Tang et al., 2012, 2013). Synaptophysin and NPYss vesicle dynamics along axons were imaged at 5 frames/s for 1 min. All video files were converted to 16 bit TIFF files in NIS Elements software. Kymographs of these 16 bit TIFF files were generated using the Kymograph function in MetaMorph Image Analysis software (Version 7.7, Molecular Devices, LLC). The brightness/contrast of kymographs was adjusted in MetaMorph (Molec-ular Devices). No other adjustments were made to any images unless otherwise mentioned. EGFP, mCherry, mRFP, dsRed, and mTurquoise fluorochromes were used for all live-imaging experiments.
Pharmacologic experiments, pHRodo use, phalloidin staining, and immunohistochemistryAll chemicals were purchased from Sigma-Aldrich unless noted other-wise. Effects of all pharmacologic experiments (latrunculin, jasplakin-
Dow
nloaded from http://rupress.org/jcb/article-pdf/210/3/401/1369488/jcb_201506110.pdf by guest on 12 M
arch 2022
JCB • VOLUME 210 • NUMBER 3 • 2015414
olide, cytochalasin-D, nocodazole, vincristine, SMIFH2, CK666, and BFA) were evaluated before/after drug addition, in a paired manner. Latrunculin A (Life Technologies) was stored as a 5-mM stock solution in DMSO and diluted to a final concentration of 100 nM in live imag-ing media. For washout experiments, culture dishes were rinsed (3×) with fresh live imaging media before imaging. Jasplakinolide (Life Technologies) was stored as a 1-mM stock in DMSO and diluted to a final concentration of 100 nM in live imaging media. To measure the distance between F-actin hotspots, neurons were transfected with GF-P:Utr-CH and treated with 100 nM jasplakinolide for 15 min, leading to conversion of dynamic F-actin hotspots to static vertical lines in kymo-graphs (Fig. 4 B), allowing easy quantification. Cytochalasin-D (1 mM stock) was diluted to a final concentration of 100 nM in live imaging media. The formin inhibitor SMIFH2 (Tocris Bioscience) was stored at 30 mM in DMSO and diluted to a final concentration of 30 µM in imaging media. Arp2/3 inhibitor CK-666 (EMD Millipore) was stored at 100 mM in DMSO, diluted to a final concentration of 50 µM. Noco-dazole was stored as a 5-mg/ml stock solution in DMSO and diluted to a final concentration of 10 µg/ml. Vincristine sulfate was stored as a 5-mM stock in DMSO and diluted to 5 µM in imaging media. BFA was stored as a 5-mg/ml stock solution in ethanol at −20°C and diluted in imaging media to a final concentration of 1 µg/ml. Neurons were incubated for 12–16 h with BFA before imaging, and ethanol was used as controls in all BFA experiments.
Transferrin receptor–conjugated pHRodo (a pH-sensitive marker that is weakly fluorescent at neutral pH but increases fluorescence upon a drop in pH; P35376; Life Technologies) was used at a working con-centration of 25 µg/ml in imaging media. Neurons were incubated with pHRodo for ≥30 min before imaging. Strikingly, pHRodo largely la-beled the stationary endosomes in axons—with scant labeling of the motile population—and this feature was useful in our experiments. For phalloidin staining, neurons were fixed for 10 min with 4% paraformal-dehyde in cytoskeleton buffer (10 mM MES, pH 7.4, 150 mM NaCl, 5 mM EGTA, 5 mM glucose, and 5 mM MgCl2) at RT. Extraction was performed in PBS containing 0.2% Triton X-100 for 10 min at RT. After this, neurons were blocked in 1% bovine serum albumin and 5% FBS for 2 h at RT. Subsequently, neurons were incubated with 0.5 µm rhodamine-phalloidin (R415; Life Technologies) in PBS for 1 h at RT, rinsed 2–3 times in PBS, and imaged. For immunostaining with βIII-Tubulin, neurons were fixed in 4% paraformaldehyde/sucrose solu-tion in PBS for 10 min at RT, extracted in PBS containing 0.2% Triton X-100 for 10 min (at RT), blocked for 2 h at RT in 1% bovine serum albumin and 5% FBS, and incubated with 1:500 anti–βIII-Tubulin an-tibody (rabbit polyclonal) diluted in PBS for 2 h at RT. After removal of primary antibody, neurons were blocked for 30 min at RT, incubated with goat anti–rabbit secondary antibody (A-11037; Alexa Fluor 594) at 1:1,500 dilution for 1 h at RT and then mounted for imaging.
3D STORM imagingRat hippocampal neurons (14–16 DIV, from embryonic day 18 pups) were cultured on 18-mm coverslips at a density of 6,000/cm2, fol-lowing guidelines established by the European Animal Care and Use Committee (86/609/CEE) and approval of the local ethics committee (agreement D13-055-8). To identify axon initial segments, neurons were labeled live with an antibody against an extracellular epitope of neurofascin-186 (monoclonal mouse anti-NF186 clone A12/18; Neu-roMAB; Schafer et al., 2009). The antibody was added to the culture medium and incubated at 37°C and 5% CO2 for 7 min and rinsed twice with Neurobasal at RT. Neurons were then fixed with 0.3% glutaral-dehyde and 0.25% Triton X-100 in cytoskeleton buffer, as described previously (Xu et al., 2013). After rinses in 0.1 M phosphate buffer, neurons were blocked for 30 min at RT in immunocytochemistry buf-
fer (0.22% gelatin and 0.1% Triton X-100 in phosphate buffer). After this, neurons were incubated with phalloidin–Alexa Fluor 647 (0.5 µM; Life Technologies) and Alexa Fluor 488 donkey anti–mouse second-ary antibody overnight at 4°C. After two quick rinses in immunocyto-chemistry buffer, neurons mounted in a live-cell imaging chamber and subjected to STORM to imaging.
Coverslips were placed in STORM buffer (50 mM Tris, pH 8, 10 mM NaCl, 10% glucose, 100 mM mercaptoethylamine, 3.5 U/ml pyranose oxidase, 40 µg/ml catalase, and 2 mM cyclooctatriene) and imaged on a microscope (N-STORM; Nikon) equipped with a camera (Ixon DU-897; Andor Technology). For some experiments, 0.25 µM phalloidin was added in the STORM medium to mitigate progressive unbinding from actin filaments during imaging. After locating a suitable neuron using low-intensity illumination, epifluorescence images were acquired in both the green and far-red channels, following the axon up to ∼120 µm from the cell body. For single-color imaging, the sample was continuously illuminated at 647 nm (full power) and a series of 60,000–100,000 images (256 × 256 pixels, 15-ms exposure time) were acquired with an astigmatic lens into the optical path to determine the Z position of fluorophores (Huang et al., 2008). The N-STORM software was used for the localization of single fluorophore activations. After fil-tering localizations with more than 900 photons, the list of localizations was exported as a text file. Image reconstructions were performed using the ThunderSTORM ImageJ plugin (National Institutes of Health; Ovesný et al., 2014) in Fiji software (Schindelin et al., 2012). Cus-tom scripts and macros were used to translate localization files from N-STORM to ThunderSTORM formats, as well as automate images reconstruction for whole images, detailed zooms and XZ transverse projections. Measurement of the spacing periodicity was performed by fitting multiple 1-µm axon stretches (n = 111) with a sinusoid, its period corresponding to an individual spacing measurement. The distribution of all spacing values were in turn fitted with a Gaussian curve, and the mean and standard deviation of this Gaussian fit are reported as the spacing measurement in the text.
Image analysis and colocalization algorithmsTo analyze GFP:Utr-CH kinetics, lines were drawn using the Meta-Morph Image Analysis Software on the kymograph starting from the origin of appearance of the polymer (actin trail) and ending where the polymer stops elongating. Hotspots were identified by intensity peaks in kymographs from maximum-projection images. To quantify the overlap of F-actin hotspots with stationary endosomes, corresponding kymographs from each axon (GFP:Utr-CH or pHRodo/Rab5/Lamp1) were generated. Vertical lines were drawn manually in MetaMorph onto corresponding kymograph pairs to designate F-actin hotspots (GFP:Utr-CH kymograph) and stationary endosomes (pHRodo/Rab5/Lamp1 kymograph). Each stationary event had an x value and a range of y values corresponding to the spatial location and the duration of the events, respectively. The x and y values were used as inputs for a cus-tom MATLAB script, written to determine the percentage of overlap between F-actin hotspots and stationary endosomes. Each event in the control (GFP:Utr-CH kymograph) was compared with all events in the condition (pHRodo/Rab5/Lamp1 kymograph) by a double pass overlap test. The y values were first tested and only those events with 50% or more overlap between the control and condition groups were consid-ered for the x overlap analysis. During the x overlap test, x values from the condition which fell within x ± 4 µm of the control were counted as positive. Only events which passed both these criteria were considered as positive. Percentage of overlap was generated using the number of events that overlapped between the control and condition kymographs, over the total number of events in the control kymograph. Because each event in the control was compared with every event in the condition,
Dow
nloaded from http://rupress.org/jcb/article-pdf/210/3/401/1369488/jcb_201506110.pdf by guest on 12 M
arch 2022
F-actin trails in axons • Ganguly et al. 415
overcounting of events was avoided by only counting those events in the control which matched at least one event in the condition. All data were analyzed using Prism software (GraphPad Software), and data are presented as means ± SEM.
FRAP assayFRAP experiments were performed on the inverted confocal microscope (FV1000 IX81; Olympus) equipped with a structured Illumination mi-croscopy scanner. Hippocampal neurons (9–12 DIV) were cotransfected with GFP:Utr-CH and synaptophysin-dsRed (to mark presynaptic bou-tons), and en passant boutons were identified. Dishes were incubated with either DMSO (control) or 30 µM SMIFH2 in live imaging media for ≥35 min before imaging. All imaging was performed at 35°C and within 50 min of drug incubation. Time-lapse videos were acquired at 1 frame/5 s, for a total of 120 frames, at 7% laser power (488 nm) and 500-ms exposure. Photobleaching of boutons was performed by using 100% laser power (405 nm) for 500 ms on the fifth frame of each time lapse for all experiments. After acquisition, all videos were background corrected in MetaMorph, and the mean fluorescence intensity of each bouton, across all frames, was recorded by drawing a region of interest (ROI) around each bouton. The mean fluorescence intensity of each frame of the time lapse was normalized to the mean intensity of the first five frames (prebleach) and plotted as a percentage.
vGLUT-pHluorin assayThese experiments were essentially performed as described previously (Wang et al., 2014). In brief, hippocampal neurons were electropo-rated with 0.3 µg vGLUT1-pHluorin-mCherry cDNA before plating, using the P3 Primary Cell 4D-Nucleofector X kit S and the Amaxa 4D-Nucleofector System (Lonza). The volume of the cell suspension was 20 µl per reaction, and the cell density ranged from 107 to 1.5 × 10⁷ cells/ml. Neurons were plated at a density of 60,000 cells/cm2 on poly-d-lysine–coated coverslips after electroporation and cultured to maturity (DIV14–DIV21) before imaging. Coverslips were mounted on a magnetic chamber (Chamlide EC; Live Cell Instrument), at RT. As needed, neurons were incubated in Tyrode solution containing either 30 µM SMIFH2, 50 µM CK-666, or DMSO for 30 min before stimula-tion. Field stimulation was applied using an SD9-square-pulse stimu-lator (Grass Instruments) at 10 Hz for 60 s (10-V pulses). Images were acquired at 20% LED power, one frame every 3 s, with an exposure of 500 ms. For quantification, ROIs were placed on each bouton, and the mean intensity was obtained for each frame of the time lapse. Fluores-cence intensity of a bouton at a given time point (F) was normalized to F0 and Fmax and expressed as a ratio of (F − F0)/(Fmax − F0). Fmax was defined as the mean fluorescence of five frames with the highest fluorescence intensity after NH4Cl perfusion (frames 40–61). Baseline F0 was defined as the mean fluorescence of the 10 frames before stim-ulation. Frames 10–14 were used to calculate the rate of exocytosis, whereas frames 31–40 were used to calculate rate of endocytosis. All quantification was performed in in MetaMorph analysis software.
Statistical analysisAll graphs were plotted and all statistical analyses were performed in Prism software.
Online supplemental materialFig. S1 shows the characterization of GFP:Utr-CH expression in neu-rons. Fig. S2 shows the dynamics of F-actin in axons marked by two independent probes, GFP:Utr-CH and LifeAct-mTurquoise2. Fig. S3 demonstrates that the disruption of microtubules by nocodazole and vincristine does not alter the dynamics of F-actin in axons. Fig. S4 shows that the treatment of axons with the drug BFA causes a complete
depletion of Golgi-derived vesicles in axons. Fig. S5 demonstrates that the formin inhibitor SMIFH2 minimally alters synaptophysin and NPY vesicle dynamics in axons. Tables S1 and S2 show details of all pa-rameters analyzed (raw mean values ± SEM, statistics, and number of repeats) for all the data shown in this manuscript. Video 1 shows the dynamics of F-actin trails marked by GFP:Utr-CH in an axon. Video 2 shows the transient F-actin dynamics in the circumference of an en passant bouton marked by the synaptic marker synaptophysin. Online supplemental material is available at http://www.jcb.org/cgi/content/full/jcb.201506110/DC1. Additional data are available in the JCB DataViewer at http://dx.doi.org/10.1083/jcb.201506110.dv.
Acknowledgements
We thank Anthony Brown (Ohio State University) for suggesting the use of Utr-CH, William Bement (University of Wisconsin) for technical advice, and Ivonnie Shih (University of California, San Diego) for help with phalloidin staining experiments. We also acknowledge the Uni-versity of California, San Diego Neuroscience Microscopy Shared Facility Grant (P30 NS047101) for confocal FRAP imaging.
This work was supported by a grant from the National Institute of Neurological Disorders and Stroke/National Institutes of Health (R01NS075233) to S. Roy.
The authors declare no competing financial interests.
Author contributions: A. Ganguly, Y. Tang, L. Wang, and S. Roy con-ceived and planned the experiments. A. Ganguly and Y. Tang per-formed most of the experiments and analyses; L. Wang performed the pHluorin experiments and also helped with others. C. Leterrier and B. Dargent conceived and performed the STORM experiments. K. Ladt performed immunostaining, postacquisition image analyses, and some of the live-imaging experiments. A. Ganguly, C. Leterrier, and S. Roy wrote the paper. J. Loi wrote the MATLAB algorithm for colocal-ization analysis and helped with DNA purifications.
Submitted: 22 June 2015Accepted: 30 June 2015
ReferencesBalaji, J., and T.A. Ryan. 2007. Single-vesicle imaging reveals that synaptic ves-
icle exocytosis and endocytosis are coupled by a single stochastic mode. Proc. Natl. Acad. Sci. USA. 104:20576–20581. http://dx.doi.org/10.1073/pnas.0707574105
Bearer, E.L., and T.S. Reese. 1999. Association of actin filaments with ax-onal microtubule tracts. J. Neurocytol. 28:85–98. http://dx.doi.org/10.1023/A:1007025421849
Bernstein, B.W., M. DeWit, and J.R. Bamburg. 1998. Actin disassembles re-versibly during electrically induced recycling of synaptic vesicles in cultured neurons. Brain Res. Mol. Brain Res. 53:236–250. http://dx.doi.org/10.1016/S0169-328X(97)00319-7
Black, M.M., and R.J. Lasek. 1979. Axonal transport of actin: slow component b is the principal source of actin for the axon. Brain Res. 171:401–413. http://dx.doi.org/10.1016/0006-8993(79)91045-X
Bridgman, P.C. 2009. Myosin motor proteins in the cell biology of axons and other neuronal compartments. Results Probl. Cell Differ. 48:91–105.
Bubb, M.R., A.M. Senderowicz, E.A. Sausville, K.L. Duncan, and E.D. Korn. 1994. Jasplakinolide, a cytotoxic natural product, induces actin polym-erization and competitively inhibits the binding of phalloidin to F-actin. J. Biol. Chem. 269:14869–14871.
Burkel, B.M., G. von Dassow, and W.M. Bement. 2007. Versatile fluorescent probes for actin filaments based on the actin-binding domain of utro-phin. Cell Motil. Cytoskeleton. 64:822–832. http://dx.doi.org/10.1002/cm.20226
Dow
nloaded from http://rupress.org/jcb/article-pdf/210/3/401/1369488/jcb_201506110.pdf by guest on 12 M
Chesarone, M.A., A.G. DuPage, and B.L. Goode. 2010. Unleashing formins to remodel the actin and microtubule cytoskeletons. Nat. Rev. Mol. Cell Biol. 11:62–74. http://dx.doi.org/10.1038/nrm2816
Chia, P.H., P. Li, and K. Shen. 2013. Cell biology in neuroscience: cellular and molecular mechanisms underlying presynapse formation. J. Cell Biol. 203:11–22. http://dx.doi.org/10.1083/jcb.201307020
Chia, P.H., B. Chen, P. Li, M.K. Rosen, and K. Shen. 2014. Local F-actin net-work links synapse formation and axon branching. Cell. 156:208–220. http://dx.doi.org/10.1016/j.cell.2013.12.009
Christensen, R., Z. Shao, and D.A. Colón-Ramos. 2013. The cell biology of syn-aptic specificity during development. Curr. Opin. Neurobiol. 23:1018–1026. http://dx.doi.org/10.1016/j.conb.2013.07.004
Cingolani, L.A., and Y. Goda. 2008. Actin in action: the interplay between the actin cytoskeleton and synaptic efficacy. Nat. Rev. Neurosci. 9:344–356. http://dx.doi.org/10.1038/nrn2373
Cooper, J.A. 1987. Effects of cytochalasin and phalloidin on actin. J. Cell Biol. 105:1473–1478. http://dx.doi.org/10.1083/jcb.105.4.1473
D’Este, E., D. Kamin, F. Göttfert, A. El-Hady, and S.W. Hell. 2015. STED na-noscopy reveals the ubiquity of subcortical cytoskeleton periodicity in living neurons. Cell Reports. 10:1246–1251. http://dx.doi.org/10.1016/j.celrep.2015.02.007
Dent, E.W., S.L. Gupton, and F.B. Gertler. 2011. The growth cone cytoskele-ton in axon outgrowth and guidance. Cold Spring Harb. Perspect. Biol. 3:a001800. http://dx.doi.org/10.1101/cshperspect.a001800
El Meskini, R., L.B. Cline, B.A. Eipper, and G.V. Ronnett. 2005. The develop-mentally regulated expression of Menkes protein ATP7A suggests a role in axon extension and synaptogenesis. Dev. Neurosci. 27:333–348. http://dx.doi.org/10.1159/000086713
Fath, K.R., and R.J. Lasek. 1988. Two classes of actin microfilaments are asso-ciated with the inner cytoskeleton of axons. J. Cell Biol. 107:613–621. http://dx.doi.org/10.1083/jcb.107.2.613
Field, C.M., and P. Lénárt. 2011. Bulk cytoplasmic actin and its functions in mei-osis and mitosis. Curr. Biol. 21:R825–R830. http://dx.doi.org/10.1016/j.cub.2011.07.043
Flynn, K.C., C.W. Pak, A.E. Shaw, F. Bradke, and J.R. Bamburg. 2009. Growth cone-like waves transport actin and promote axonogenesis and neur-ite branching. Dev. Neurobiol. 69:761–779. http://dx.doi.org/10.1002/dneu.20734
Galbraith, J.A., and P.E. Gallant. 2000. Axonal transport of tubulin and actin. J. Neurocytol. 29:889–911. http://dx.doi.org/10.1023/A:1010903710160
Ganguly, A., and S. Roy. 2014. Using photoactivatable GFP to track axonal transport kinetics. Methods Mol. Biol. 1148:203–215. http://dx.doi.org/10.1007/978-1-4939-0470-9_13
Gomez, T.M., and P.C. Letourneau. 2014. Actin dynamics in growth cone motility and navigation. J. Neurochem. 129:221–234. http://dx.doi.org/10.1111/jnc.12506
Goode, B.L., A.A. Rodal, G. Barnes, and D.G. Drubin. 2001. Activation of the Arp2/3 complex by the actin filament binding protein Abp1p. J. Cell Biol. 153:627–634. http://dx.doi.org/10.1083/jcb.153.3.627
Gotow, T., K. Miyaguchi, and P.H. Hashimoto. 1991. Cytoplasmic archi-tecture of the axon terminal: filamentous strands specifically associ-ated with synaptic vesicles. Neuroscience. 40:587–598. http://dx.doi.org/10.1016/0306-4522(91)90143-C
Higashida, C., T. Miyoshi, A. Fujita, F. Oceguera-Yanez, J. Monypenny, Y. Andou, S. Narumiya, and N. Watanabe. 2004. Actin polymeriza-tion-driven molecular movement of mDia1 in living cells. Science. 303:2007–2010. http://dx.doi.org/10.1126/science.1093923
Hirokawa, N. 1982. Cross-linker system between neurofilaments, microtubules, and membranous organelles in frog axons revealed by the quick-freeze, deep-etching method. J. Cell Biol. 94:129–142. http://dx.doi.org/10.1083/jcb.94.1.129
Hirokawa, N., K. Sobue, K. Kanda, A. Harada, and H. Yorifuji. 1989. The cy-toskeletal architecture of the presynaptic terminal and molecular struc-ture of synapsin 1. J. Cell Biol. 108:111–126. http://dx.doi.org/10.1083/jcb.108.1.111
Huang, B., W. Wang, M. Bates, and X. Zhuang. 2008. Three-dimensional su-per-resolution imaging by stochastic optical reconstruction microscopy. Science. 319:810–813. http://dx.doi.org/10.1126/science.1153529
Jareb, M., and G. Banker. 1997. Inhibition of axonal growth by brefeldin A in hippocampal neurons in culture. J. Neurosci. 17:8955–8963.
Kaech, S., C.F. Huang, and G. Banker. 2012. Short-term high-resolution imaging of developing hippocampal neurons in culture. Cold Spring Harb Protoc. 2012:340–343.
Ladt, K., A. Ganguly, and S. Roy. 2015. Axonal actin in action: imaging actin dynamics in neurons. Methods Cell Biol. http://dx.doi.org/10.1016/bs.mcb.2015.07.003
Landis, D.M., A.K. Hall, L.A. Weinstein, and T.S. Reese. 1988. The or-ganization of cytoplasm at the presynaptic active zone of a cen-tral nervous system synapse. Neuron. 1:201–209. http://dx.doi.org/10.1016/0896-6273(88)90140-7
Letourneau, P.C. 2009. Actin in axons: stable scaffolds and dynamic filaments. Results Probl. Cell Differ. 48:65–90.
Loudon, R.P., L.D. Silver, H.F. Yee Jr., and G. Gallo. 2006. RhoA-kinase and myosin II are required for the maintenance of growth cone polarity and guidance by nerve growth factor. J. Neurobiol. 66:847–867. http://dx.doi.org/10.1002/neu.20258
Lukinavičius, G., L. Reymond, E. D’Este, A. Masharina, F. Göttfert, H. Ta, A. Güther, M. Fournier, S. Rizzo, H. Waldmann, et al. 2014. Fluorogenic probes for live-cell imaging of the cytoskeleton. Nat. Methods. 11:731–733. http://dx.doi.org/10.1038/nmeth.2972
Melom, J.E., Y. Akbergenova, J.P. Gavornik, and J.T. Littleton. 2013. Spontaneous and evoked release are independently regulated at individ-ual active zones. J. Neurosci. 33:17253–17263. http://dx.doi.org/10.1523/JNEUROSCI.3334-13.2013
Michelot, A., and D.G. Drubin. 2011. Building distinct actin filament networks in a common cytoplasm. Curr. Biol. 21:R560–R569. http://dx.doi.org/10.1016/j.cub.2011.06.019
Morales, M., M.A. Colicos, and Y. Goda. 2000. Actin-dependent regulation of neurotransmitter release at central synapses. Neuron. 27:539–550. http://dx.doi.org/10.1016/S0896-6273(00)00064-7
Morton, W.M., K.R. Ayscough, and P.J. McLaughlin. 2000. Latrunculin alters the actin-monomer subunit interface to prevent polymerization. Nat. Cell Biol. 2:376–378. http://dx.doi.org/10.1038/35014075
Nelson, J.C., A.K. Stavoe, and D.A. Colón-Ramos. 2013. The actin cytoskele-ton in presynaptic assembly. Cell Adhes. Migr. 7:379–387. http://dx.doi.org/10.4161/cam.24803
Nolen, B.J., N. Tomasevic, A. Russell, D.W. Pierce, Z. Jia, C.D. McCormick, J. Hartman, R. Sakowicz, and T.D. Pollard. 2009. Characterization of two classes of small molecule inhibitors of Arp2/3 complex. Nature. 460:1031–1034. http://dx.doi.org/10.1038/nature08231
Okabe, S., and N. Hirokawa. 1990. Turnover of fluorescently labelled tu-bulin and actin in the axon. Nature. 343:479–482. http://dx.doi.org/10.1038/343479a0
Ovesný, M., P. Křížek, J. Borkovec, Z. Svindrych, and G.M. Hagen. 2014. ThunderSTORM: a comprehensive ImageJ plug-in for PALM and STORM data analysis and super-resolution imaging. Bioinformatics. 30:2389–2390. http://dx.doi.org/10.1093/bioinformatics/btu202
Pfender, S., V. Kuznetsov, S. Pleiser, E. Kerkhoff, and M. Schuh. 2011. Spire-type actin nucleators cooperate with Formin-2 to drive asymmetric oocyte division. Curr. Biol. 21:955–960. http://dx.doi.org/10.1016/j.cub.2011.04.029
Prekeris, R., D.L. Foletti, and R.H. Scheller. 1999. Dynamics of tubulove-sicular recycling endosomes in hippocampal neurons. J. Neurosci. 19:10324–10337.
Riedl, J., A.H. Crevenna, K. Kessenbrock, J.H. Yu, D. Neukirchen, M. Bista, F. Bradke, D. Jenne, T.A. Holak, Z. Werb, et al. 2008. Lifeact: a versa-tile marker to visualize F-actin. Nat. Methods. 5:605–607. http://dx.doi.org/10.1038/nmeth.1220
Rizvi, S.A., E.M. Neidt, J. Cui, Z. Feiger, C.T. Skau, M.L. Gardel, S.A. Kozmin, and D.R. Kovar. 2009. Identification and characterization of a small mol-ecule inhibitor of formin-mediated actin assembly. Chem. Biol. 16:1158–1168. http://dx.doi.org/10.1016/j.chembiol.2009.10.006
Roy, S., G. Yang, Y. Tang, and D.A. Scott. 2012. A simple photoactivation and image analysis module for visualizing and analyzing axonal trans-port with high temporal resolution. Nat. Protoc. 7:62–68. http://dx.doi.org/10.1038/nprot.2011.428
Ruthel, G., and G. Banker. 1998. Actin-dependent anterograde movement of growth-cone-like structures along growing hippocampal axons: a novel form of axonal transport? Cell Motil. Cytoskeleton. 40:160–173. http://dx.doi.org/10.1002/(SICI)1097-0169(1998)40:2<160::AID-CM5>3.0.CO;2-J
Ryan, T.A. 1999. Inhibitors of myosin light chain kinase block synaptic ves-icle pool mobilization during action potential firing. J. Neurosci. 19:1317–1323.
Saheki, Y., and P. De Camilli. 2012. Synaptic vesicle endocytosis. Cold Spring Harb. Perspect. Biol. 4:a005645. http://dx.doi.org/10.1101/cshperspect.a005645
Sankaranarayanan, S., P.P. Atluri, and T.A. Ryan. 2003. Actin has a molecular scaffolding, not propulsive, role in presynaptic function. Nat. Neurosci. 6:127–135. http://dx.doi.org/10.1038/nn1002
Dow
nloaded from http://rupress.org/jcb/article-pdf/210/3/401/1369488/jcb_201506110.pdf by guest on 12 M
Schafer, D.P., S. Jha, F. Liu, T. Akella, L.D. McCullough, and M.N. Rasband. 2009. Disruption of the axon initial segment cytoskeleton is a new mech-anism for neuronal injury. J. Neurosci. 29:13242–13254. http://dx.doi.org/10.1523/JNEUROSCI.3376-09.2009
Schindelin, J., I. Arganda-Carreras, E. Frise, V. Kaynig, M. Longair, T. Pietzsch, S. Preibisch, C. Rueden, S. Saalfeld, B. Schmid, et al. 2012. Fiji: an open-source platform for biological-image analysis. Nat. Methods. 9:676–682. http://dx.doi.org/10.1038/nmeth.2019
Schnapp, B.J., and T.S. Reese. 1982. Cytoplasmic structure in rapid-frozen axons. J. Cell Biol. 94:667–669. http://dx.doi.org/10.1083/jcb.94.3.667
Schuh, M. 2011. An actin-dependent mechanism for long-range vesicle trans-port. Nat. Cell Biol. 13:1431–1436. http://dx.doi.org/10.1038/ncb2353
Scott, D., and S. Roy. 2012. α-Synuclein inhibits intersynaptic vesicle mobility and maintains recycling-pool homeostasis. J. Neurosci. 32:10129–10135. http://dx.doi.org/10.1523/JNEUROSCI.0535-12.2012
Scott, D.A., U. Das, Y. Tang, and S. Roy. 2011. Mechanistic logic underlying the axonal transport of cytosolic proteins. Neuron. 70:441–454. http://dx.doi.org/10.1016/j.neuron.2011.03.022
Shupliakov, O., O. Bloom, J.S. Gustafsson, O. Kjaerulff, P. Low, N. Tomilin, V.A. Pieribone, P. Greengard, and L. Brodin. 2002. Impaired recycling of synaptic vesicles after acute perturbation of the presynaptic actin cy-toskeleton. Proc. Natl. Acad. Sci. USA. 99:14476–14481. http://dx.doi.org/10.1073/pnas.212381799
Tang, Y., D.A. Scott, U. Das, S.D. Edland, K. Radomski, E.H. Koo, and S. Roy. 2012. Early and selective impairments in axonal transport kinetics of syn-aptic cargoes induced by soluble amyloid β-protein oligomers. Traffic. 13:681–693. http://dx.doi.org/10.1111/j.1600-0854.2012.01340.x
Tang, Y., D. Scott, U. Das, D. Gitler, A. Ganguly, and S. Roy. 2013. Fast vesicle transport is required for the slow axonal transport of synapsin. J. Neurosci. 33:15362–15375. http://dx.doi.org/10.1523/JNEUROSCI.1148-13.2013
Tilney, L.G., and D.A. Portnoy. 1989. Actin filaments and the growth, movement, and spread of the intracellular bacterial parasite, Listeria monocytogenes. J. Cell Biol. 109:1597–1608. http://dx.doi.org/10.1083/jcb.109.4.1597
Vidali, L., P.A. van Gisbergen, C. Guérin, P. Franco, M. Li, G.M. Burkart, R.C. Augustine, L. Blanchoin, and M. Bezanilla. 2009. Rapid formin-me-diated actin-filament elongation is essential for polarized plant cell growth. Proc. Natl. Acad. Sci. USA. 106:13341–13346. http://dx.doi.org/10.1073/pnas.0901170106
Voglmaier, S.M., K. Kam, H. Yang, D.L. Fortin, Z. Hua, R.A. Nicoll, and R.H. Edwards. 2006. Distinct endocytic pathways control the rate and extent of synaptic vesicle protein recycling. Neuron. 51:71–84. http://dx.doi.org/10.1016/j.neuron.2006.05.027
Waites, C.L., S.A. Leal-Ortiz, T.F. Andlauer, S.J. Sigrist, and C.C. Garner. 2011. Piccolo regulates the dynamic assembly of presynaptic F-actin. J. Neurosci. 31:14250–14263. http://dx.doi.org/10.1523/JNEUROSCI.1835-11.2011
Wang, X.H., J.Q. Zheng, and M.M. Poo. 1996. Effects of cytochalasin treat-ment on short-term synaptic plasticity at developing neuromuscular junctions in frogs. J. Physiol. 491:187–195. http://dx.doi.org/10.1113/jphysiol.1996.sp021206
Wang, L., U. Das, D.A. Scott, Y. Tang, P.J. McLean, and S. Roy. 2014. α-syn-uclein multimers cluster synaptic vesicles and attenuate recycling. Curr. Biol. 24:2319–2326. http://dx.doi.org/10.1016/j.cub.2014.08.027
Watanabe, S., T. Trimbuch, M. Camacho-Pérez, B.R. Rost, B. Brokowski, B. Söhl-Kielczynski, A. Felies, M.W. Davis, C. Rosenmund, and E.M. Jorgensen. 2014. Clathrin regenerates synaptic vesicles from en-dosomes. Nature. 515:228–233. http://dx.doi.org/10.1038/nature13846
Willard, M., M. Wiseman, J. Levine, and P. Skene. 1979. Axonal transport of actin in rabbit retinal ganglion cells. J. Cell Biol. 81:581–591. http://dx.doi.org/10.1083/jcb.81.3.581
Xu, K., G. Zhong, and X. Zhuang. 2013. Actin, spectrin, and associated proteins form a periodic cytoskeletal structure in axons. Science. 339:452–456. http://dx.doi.org/10.1126/science.1232251
Zhong, G., J. He, R. Zhou, D. Lorenzo, H.P. Babcock, V. Bennett, and X. Zhuang. 2014. Developmental mechanism of the periodic membrane skeleton in axons. eLife. 3. http://dx.doi.org/10.7554/eLife.04581
Dow
nloaded from http://rupress.org/jcb/article-pdf/210/3/401/1369488/jcb_201506110.pdf by guest on 12 M


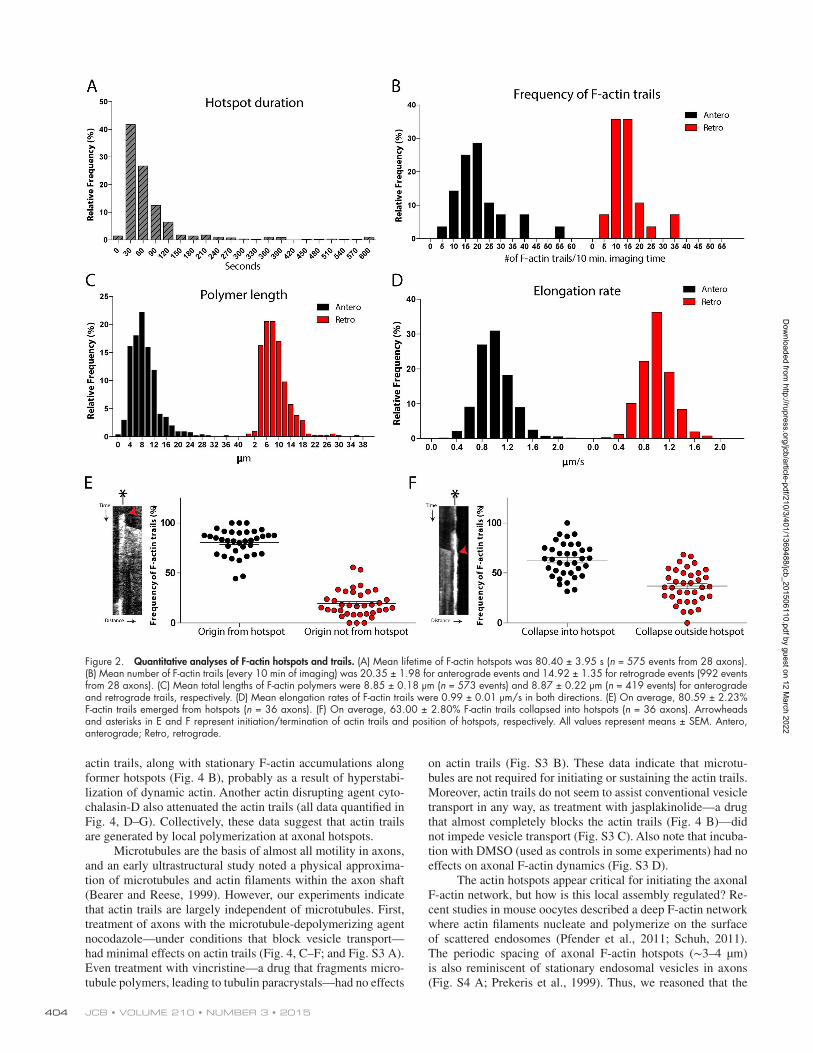


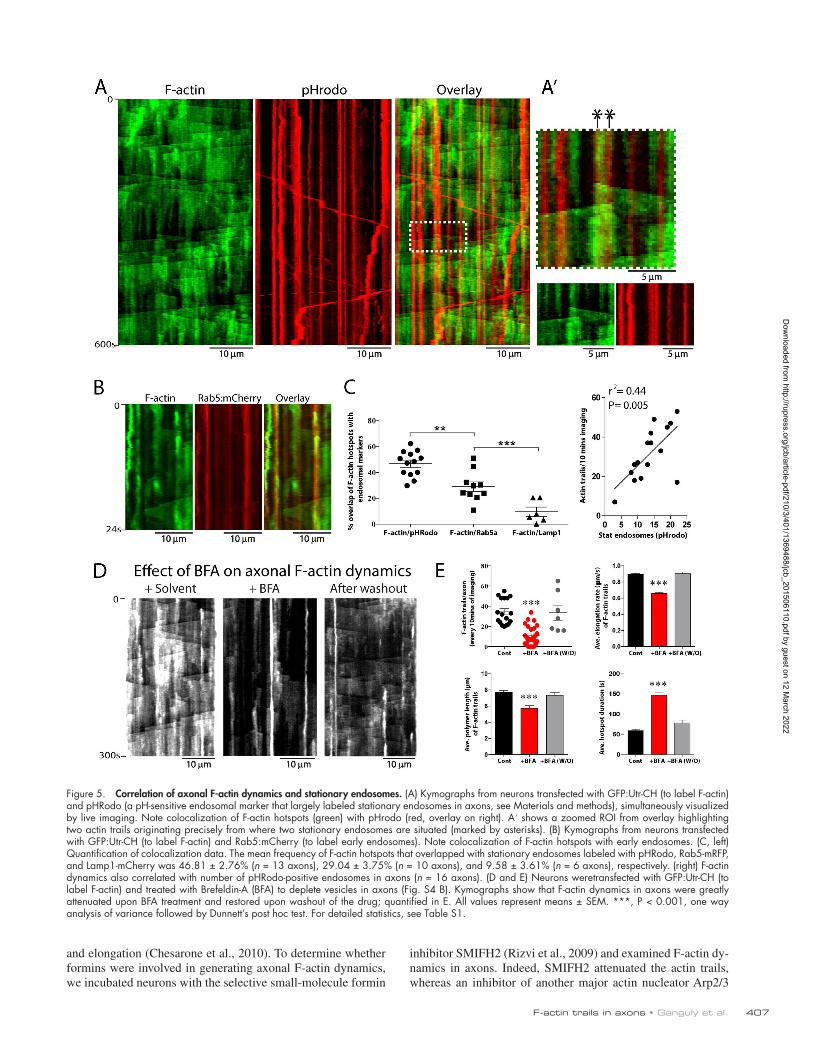

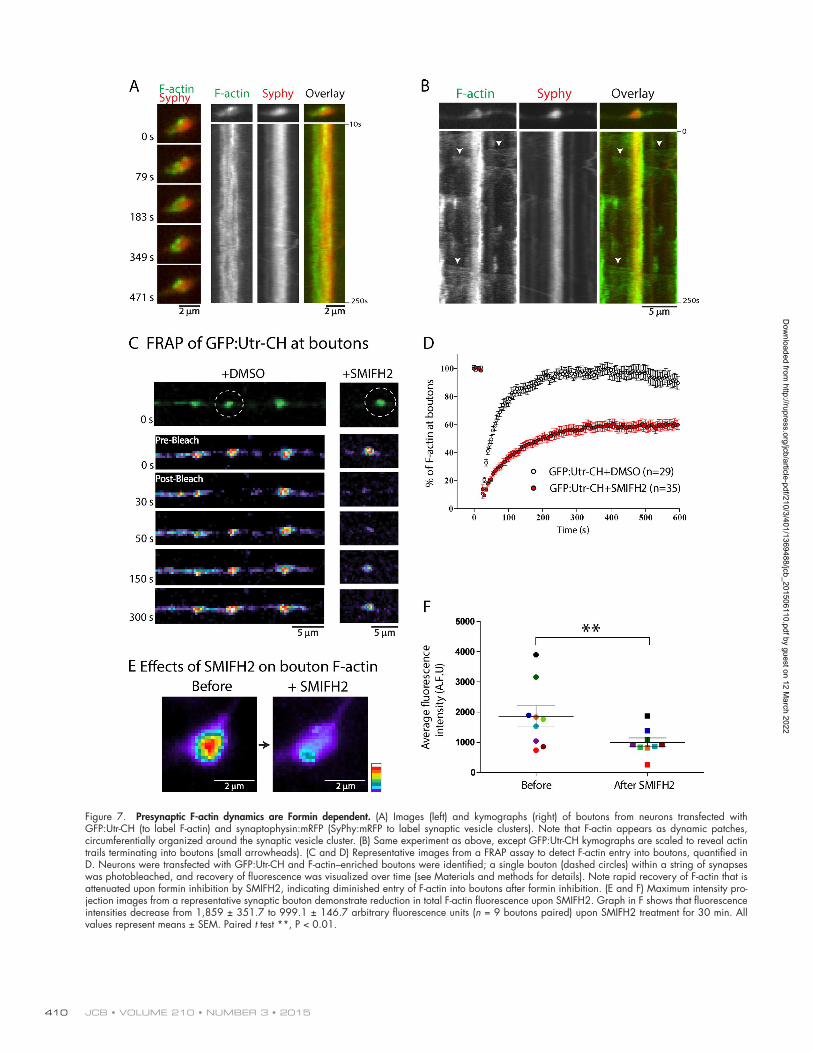
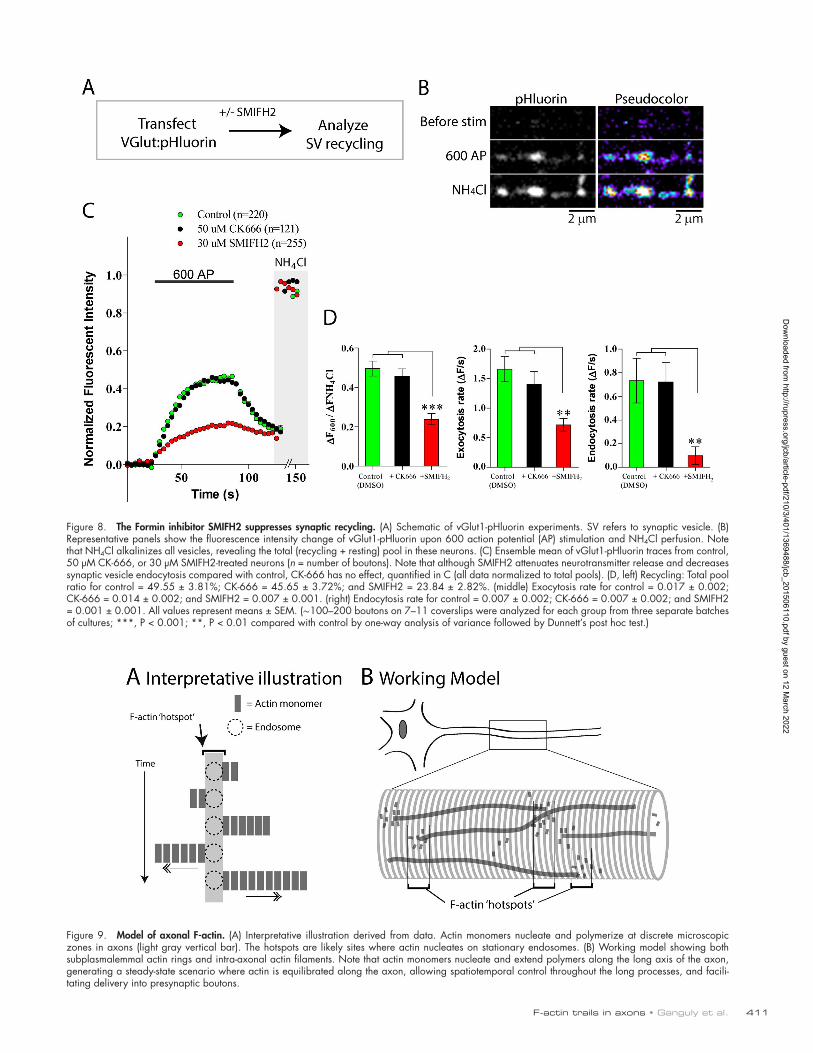


![CYTOSKELETON NEWS - fnkprddata.blob.core.windows.net · Dynamic remodeling of the actin cytoskeleton [i.e., rapid cycling between filamentous actin (F-actin) and monomer actin (G-actin)]](https://static.documents.pub/doc/80x56/609edd2b88630103265d18ee/cytoskeleton-news-dynamic-remodeling-of-the-actin-cytoskeleton-ie-rapid-cycling.jpg)


