A Dynamic Intraday Measure of the Probability of Informed Trading and Firm-Specific Return Variation Sanders S. Chang a, * , Lenisa V. Chang b , F. Albert Wang a , a Department of Economics and Finance, University of Dayton, USA b Department of Economics, University of Cincinnati, USA March 10, 2014 Abstract: A central question in financial economics is how private information is incorporated into asset prices. A common method of measuring private information is the PIN measure, which uses statistical estimation of a sequential trade model of the trading process to estimate the probability of informed trading. A notable limiting feature of PIN is that one must aggregate very fine intraday data over very long macro horizons in order to estimate it. In this paper, our aim is to develop and implement a dynamic intraday measure of the probability of informed trading that circumvents this aggregation issue and allows for the measurement of information based trading activity at much higher frequencies. We then apply our dynamic intraday measure of the probability of informed trading to examine the relationship between private information and firm-specific return variation. JEL Classification: G10, G14, G19 Keywords: Informed trading, Private information, Price discovery, High-frequency, Firm- specific return variation, Price non-synchronicity * Corresponding author at: Department of Economics and Finance, University of Dayton, 300 College Park, Dayton, OH, 45469-2251, USA. Email: [email protected] (S. Chang), [email protected] (L. Chang), [email protected] (F. Wang). Acknowledgements: The authors would like to thank the editor (R.T. Baillie) and two anonymous referees for helpful comments and suggestions. Jung-Yu Liu provided excellent research assistance. Any mistakes, of course, are our own.
Transcript
A Dynamic Intraday Measure of the Probability of Informed Trading
and Firm-Specific Return Variation
Sanders S. Changa, *, Lenisa V. Changb, F. Albert Wanga,
aDepartment of Economics and Finance, University of Dayton, USA bDepartment of Economics, University of Cincinnati, USA
March 10, 2014
Abstract: A central question in financial economics is how private information is incorporated into asset prices. A common method of measuring private information is the PIN measure, which uses statistical estimation of a sequential trade model of the trading process to estimate the probability of informed trading. A notable limiting feature of PIN is that one must aggregate very fine intraday data over very long macro horizons in order to estimate it. In this paper, our aim is to develop and implement a dynamic intraday measure of the probability of informed trading that circumvents this aggregation issue and allows for the measurement of information based trading activity at much higher frequencies. We then apply our dynamic intraday measure of the probability of informed trading to examine the relationship between private information and firm-specific return variation. JEL Classification: G10, G14, G19 Keywords: Informed trading, Private information, Price discovery, High-frequency, Firm-specific return variation, Price non-synchronicity
* Corresponding author at: Department of Economics and Finance, University of Dayton, 300 College Park, Dayton, OH, 45469-2251, USA. Email: [email protected] (S. Chang), [email protected] (L. Chang), [email protected] (F. Wang). Acknowledgements: The authors would like to thank the editor (R.T. Baillie) and two anonymous referees for helpful comments and suggestions. Jung-Yu Liu provided excellent research assistance. Any mistakes, of course, are our own.
1
1. Introduction
A central question in financial economics is related to the role of information in markets
and the process by which information is incorporated into asset prices. The market
microstructure literature identifies two broad investor types: informed traders, who buy and sell
assets based on information they possess regarding the asset's true future intrinsic value, and
liquidity (or noise) traders, who trade for purposes unrelated to information such as meeting
liquidity needs. Empirically, however, while detailed transactions level data are available at the
intraday level (i.e., trade-by-trade basis), these data do not indicate whether a particular trade is
initiated by an individual who is informed or not. To make this determination, researchers must
commonly infer from the data whether trades are more likely information or liquidity based.
One of the most common and widely accepted methods of doing this is the PIN measure
of Easley et al. (1997a,b) and Easley et al. (2002), which estimates the probability of informed
trading based on a sequential trade model drawn from Glosten and Milgrom (1985) and Easley
and O'Hara (1987). With a measure of information based trading in hand, researches have
extensively applied PIN to study the effect of informed trading in a broad range of areas in
finance, including stock price informativeness, corporate governance and investment decisions,
stock market volatility, and insider trading, just to name a few.
However, the traditional PIN measure has some well known limiting features. Most
notably, in order to estimate it one must aggregate very fine intraday data, which occur at
approximately five-minute intervals within the trading day, across multiple days (Easley et al.
1997a,b). The resulting estimate measures informed trading over a very long macro horizon --
typically from one month to one year. Arguably, the variation and information content of
intraday trades is diluted, or possibly even lost, when combining over such long time periods,
especially in modern financial markets where information is short-lived and traders act with
increasing alacrity. Indeed, with regard to the necessity of using many days in their maximum
likelihood procedure, Easley et al. (1997a) concede the tradeoff between estimation accuracy and
2
economic reasonableness: "[w]hat is also apparent, however, is that while it may be sensible to
use large sample methods to estimate [certain parameters in the PIN model], it is less so for [other
parameters in the model]. The presumed stationarity of information is unlikely to be true over a
long sample period, dictating a natural limit to the number of days we can sensibly employ." As
such, horizons of multiple months, or up to one year in the case of Easley et al. (2002), might
seem to push the envelope of such sensibility.
In addition, over such long macro horizons it is likely that the actual impact of short-lived
private information may become diluted or masked by other factors. For example, Duarte and
Young (2009) argue and find that PIN can be decomposed into two further components: one that
represents private information, as originally postulated, but another component that is a proxy for
market illiquidity (i.e., disruptions in the supply and demand conditions in stock markets) that is
unrelated to information. Since market illiquidity is certainly a more long-lived phenomenon
than private information, this is suggestive that Duarte and Young's finding may be an artifact of
the aggregation process.
The first aim of our paper is to develop and implement a dynamic intraday version of
PIN, which we refer to as DPIN, that circumvents the aggregation issue described above and
allows us to estimate the probability of informed trading at much finer frequencies -- specifically,
at 15-minute intervals throughout the trading day. Since such frequencies are more in line with
the speed at which traders react to and digest information in modern financial markets, our
dynamic DPIN measure may be better suited to more accurately capture information based
trading activity at higher frequencies, even within the trading day.
Our method for constructing DPIN comes from an extension of the approach of Aramov
et al. (2006), which is based on the trading model of Campbell et al. (1993) and used to study the
effect of informed selling on daily stock price volatility. The contribution of our paper in this
respect is to recognize that this approach can be further employed to derive a dynamic intraday
measure of the probability of informed trading, essentially by calculating the proportion of trades
3
that are classified as information based over a given time interval. The DPIN measure has the
advantage of being dynamic and flexible -- it can be aggregated over many intervals to make
comparisons with existing macro-horizon models, yet it is also capable of capturing cross-
sectional and time-series variation in the probability of informed trading at much higher daily and
intraday frequencies. Another advantage is that the DPIN measure does not require any form of
numerical optimization for its estimation and thus is relatively simple and quick to compute from
the transactions data, thus providing a more straightforward and less time consuming alternative
method for dealing with tremendously large datasets involving intraday transactions.
Upon specifying several versions of the DPIN measure, we find numerical estimates that
are generally consistent with existing measures for the probability of informed trading. When
aggregated to similarly long horizons as the PIN in Easley et al. (2002), several of our DPIN
measures are remarkably close in terms of location, spread, and skewness when combining across
firms and years. Another version of our DPIN measure turns out to be quite close numerically to
that of Nyholm (2002), who also attempts to measure the probability of informed trading at the
transaction level. We take these results as evidence that our proposed DPIN measures are not too
far off the mark and conform to the range of previous estimates found in the literature. However,
a distinguishing feature of our analysis is that we are also able to disaggregate the time horizon,
allowing an examination of the intraday pattern of informed trading, as well as how this pattern
has evolved over time. As we will discuss, such results provide new empirical evidence for
existing microstructure theories on the intraday behavior of information based trading activity.
With a new dynamic intraday measure of the probability of informed trading in hand, the
second aim of the paper is to apply this measure to study an open question in finance regarding
the role of private information and a particular aspect of asset returns, namely firm-specific return
variation, or price non-synchronicity. Roll (1988) finds that firm-specific stock price movements
are generally not associated with identifiable news releases and thus surmised that private
information might play a crucial role in explaining such movements. Ever since Roll's
4
conjecture, researchers have taken (for granted) the notion that firm specific-return variation
might be caused by private information. For example, Morck et al. (2000), Durnev et al. (2003),
Durnev at al. (2004), and Chen et al. (2007) use firm-specific return variation as a proxy for stock
price informativeness to study an array of issues at the intersection of private information, price
formation, corporate earnings forecasts, capital budgeting, and investment policy. Tellingly, each
of these papers acknowledges that their respective analyses rest upon the validity of the notion
that price non-synchronicity is indeed caused by private information, and ultimately only provide
indirect and circumstantial evidence of their possible link. Indeed, Durnev et al. (2004) states
further the caveat that the "conceptual arguments and empirical studies [cited above] constitute a
subtle case [emphasis added] for accepting firm-specific return variation as a proxy for stock
price informativeness...(p.66)."
While many of these indirect arguments are conceptually appealing and point
convincingly to a relationship between private information and price non-synchronicity, very few
studies have directly investigated the relationship between the two variables, especially at higher
frequencies. Thus, as an application of our dynamic intraday measure of informed trading, we
examine the empirical link between private information and firm-specific return variation to
provide more in-depth and direct evidence on the validity of Roll's (1988) conjecture.
The rest of the paper is organized as follows. Section 2 describes the data used in the
study. In Section 3, we construct and compute the various DPIN measures and compare them to
previous measures of informed trading in the literature. We also examine their intraday properties
and implications for the theoretical microstructure literature in this regard. Section 4 uses the
DPIN measures to study the relationship between price non-synchronicity and private
information, providing direct evidence for Roll's (1988) conjecture. Section 5 concludes.
5
2. Data
The intraday transaction data for this paper come from the Trades and Quotes (TAQ)
database and information on other share characteristics (e.g., share code, exchange code, shares
outstanding, etc.) are from the Center for Research in Security Prices (CRSP) database. The data
span the period January 1993 to December 2008. We restrict our attention to NYSE-listed
REITs (real estate investment trusts). Transactions occurring outside the normal opening and
closing times of the exchange are omitted, along with transactions that have special conditions,
corrections, or other indicators. Lastly, to avoid complications associated with thinly traded,
illiquid stocks, only shares for which there are at least 250 trades per month are included in the
analysis.
As is standard in the empirical microstructure literature, we use the Lee and Ready
(1991) algorithm to match trades and quotes and to determine whether a particular trade is buyer-
or seller-initiated. Since we are interested in intraday horizons, each trading day is divided into
26 fifteen-minute intervals, with each buy or sell trade being assigned to one of these intervals
depending on when the trade occurred during the trading day. For each firm in the sample, the
total number of trades in any 15-minute interval is the sum of all buy and sell trades (as well as
unsigned trades) occurring within the corresponding time span. Fifteen-minute returns are
obtained by log-differencing the last recorded midpoint prices of consecutive intervals.
Proceeding in the above fashion yields 14,405,663 firm-interval observations with which to
conduct our analysis.
3. A dynamic intraday measure of the probability of informed trading
3.1. Construction of DPIN measures
Our approach for constructing a dynamic, intraday measure of the probability of
informed trading extends previous theoretical work by Campbell et al. (1993) and empirical work
6
by Aramov, Chordia, and Goyal (henceforth, ACG; 2006). The basic intuition behind the
Campbell et al. model is that changes in a stock's price are caused by information that affects the
valuation of the firm, or are due to the actions of liquidity or "noninformational" traders, who
desire to buy or sell stock for exogenous reasons. In the former case, prices reflect new
information and thus price reversals are less likely to be observed, if any. In the latter case,
temporary demand and supply pressures are expected to be short-lived, and thus price reversals
are more likely to be observed. Thus, uninformed trading should be associated with negative
serial correlation in individual stock returns, while no such dependence should be associated with
informed trading.
Based on this intuition, ACG (2006) devise an empirical framework for aggregating
intraday data to delineate whether a particular trading day, overall, is dominated by broadly
"contrarian" versus "herding" behavior on the part of investors. Consistent with the Campbell et
al. (1993) model, ACG show that unexpected returns associated with herding days exhibit
significant negative serial correlation, while the autocorrelation for contrarian days is
insignificant. Thus, it appears that contrarian trades are closely akin to informed trades and
herding trades are a good representation of uninformed trades. ACG also refine this broad
delineation of informed trading by considering additional dimensions known in the literature to
be associated with the behavior of investors, such as the disposition effect and the size of trades.
They then apply these methods to determine whether informed or uninformed trading can explain
asymmetric volatility effects in daily returns.1
Below, we adopt the ACG (2006) approach but adapt it for use at a higher frequency.
First, unlike ACG, who focus solely on the effects of sell trades on volatility, our aim is to
1 To be clear, this approach does not imply that the simple contrarian reaction to past returns is by definition informed. As pointed out by an anonymous referee, a useful interpretation is to assume that there is an unobserved high frequency dynamic of a variable that induces informed traders to trade. Our goal, then, is to construct a proxy for this unobserved variable based on what is observed in the data ex post. To the extent that contrarian trading, along with accounting for disposition and size effects, is associated with informed trading (which has been established in the literature), periods where the data show signs of such effects therefore have a higher likelihood of informed trading.
7
delineate both informed buy and sell transactions from their uninformed counterparts, thus
allowing for a standalone measure of the probability of informed trading. Second, since our
measure is constructed at a much higher (15-minute) frequency, it will allow us to study the
intraday pattern of informed trading, providing empirical evidence and allowing comparisons for
previous theoretical work in this particular area. Third, given the dynamic, high-frequency nature
of our measure, it will be better suited to capture the short-lived nature of private information and
its effect on firm-specific return variation (as we will discuss in Section 4).
3.1.1. Baseline DPIN measure
In order to arrive at our first broad delineation of informed (contrarian) versus
uninformed (herding) trades, we first isolate the unexpected component of returns as the residuals
from the following regression:
(1) tik
ktikik
Intktki
k
Dayktkiji RDDR ,
12
1,,3
26
1,2
4
1,10, εγγγγ ++++= ∑∑∑
=−
==
where jiR , is the return on stock i at intraday interval j, DayktD represents day-of-week dummy
variables for Tuesday through Friday, and IntktD represents dummy variables corresponding to the
particular 15-minute interval at which returns are measured. Thus, the residual ji,ε captures the
variation in returns leftover after average day-of-week effects, average time-of-day effects, and
the effects of past returns have been accounted for and therefore serves as a proxy for unexpected
returns.
Our baseline measure of the dynamic probability of informed trading ( BASEDPIN ) is then
constructed as follows. Extending ACG (2006), buy (sell) trades in the presence of negative
(positive) unexpected returns are classified as informed trades. On the other hand, buy (sell)
trades in the presence of positive (negative) unexpected returns are classified as uninformed
trades. Formally, let jiNB , , jiNS , , and jiNT , be the number of buy, sell, and total trades,
respectively, for stock i at interval j. Then, our baseline DPIN measure is constructed as follows:
8
(2) )0()0( ,,
,,
,
,, >+<= ji
ji
jiji
ji
jijiBASE NT
NSNTNB
DPIN εε ,
where )0( , <jiε is an indicator variable that equals 1 when the unexpected return is negative and
zero otherwise, and )0( , >jiε takes on the value of unity when unexpected returns are positive
and zero otherwise. The rationale behind Equation (2) is that buy (sell) trades made amid
declining (rising) prices are contrarian in nature, and thus indicative of informed trading as shown
by ACG. On the other hand, buy (sell) trades initiated during rising (declining) markets suggest
uninformed herding. Thus, a straightforward measure of the probability of informed trading
during any given 15-minute interval can be simply obtained by calculating the proportion of
contrarian trades taking place during that interval, as in our baseline DPIN measure, BASEDPIN ,
above.
3.1.2. DPIN with disposition effect and trend chasing
The baseline DPIN measure in Equation (2) is somewhat broad in the sense that while
buying (selling) amid falling (rising) prices is necessary for a trade to be considered
contrarian/informed, it is not sufficient to make such a conclusion. To better pinpoint informed
trading activity, we consider several refinements to our baseline DPIN measure. The first of
these refinements is accounting for the disposition effect in the selling of shares and trend chasing
in share purchases.
For the selling of shares, ACG (2006) note that the behavioral finance literature
documents several well known cognitive biases among unsophisticated investors, chief among
these being loss aversion, in which investors are reluctant to realize losses. Thus, the resulting
disposition effect suggests that uninformed investors will be less willing to sell shares following
price declines, and more likely to sell after price increases. Thus sells taking place when
unexpected returns are negative and past cumulative returns are positive reflect both herding and
the disposition effect and are likely initiated by uninformed investors.
9
On the buying side, various behavioral explanations of trend chasing exist, such as
anchoring, herding and feedback trading, confirmation bias, and overreaction. In any case, to the
extent that investors perceive past price increases as a positive signal and are more likely to buy
additional shares, such trades are more likely to be initiated by uninformed investors. Thus, buys
taking place when unexpected returns are positive and past cumulative returns are positive reflect
both herding and trend chasing and are likely to be initiated by uninformed investors.
Accounting for the disposition effect and trend chasing allows for a finer partition of
informed and uninformed trades, thus yielding a refined measure of the probability of informed
trading, DISPDPIN , which is constructed as follows:
(3) )0()0()0( 1;10,,,
,,
,
,, <
⎥⎥⎦
⎤
⎢⎢⎣
⎡>+<= −− jjiji
ji
jiji
ji
jijiDISP R
NTNS
NTNB
DPIN εε ,
where )0( 1;10, <−− jjiR is an indicator variable that takes on the value of unity if the cumulative
return over the last ten intervals is negative and zero otherwise. Equation (3) builds on the
baseline approach in Equation (2) for broadly classifying informed trades but imposes the
additional condition that trades made when past cumulative returns are negative are "even more"
informed. Specifically, buying (selling) that takes place amid declining (rising) prices and when
past cumulative returns are negative are more likely to reflect informed trades rather than trend
chasing (the disposition effect) on the part of uninformed investors.
3.1.3. DPIN with trading size effects
Another type of partition that considers trade size can be made to also obtain finer
classification of informed trades. Using the finding in Easley and O'Hara (1987) that informed
traders are more likely to submit larger orders, we can refine the probability of informed trading
by imposing a condition on Equation (2) that accounts for trade size as follows:
(4) )()0()0( ,,,
,,
,
,, jiji
ji
jiji
ji
jijiSIZE LT
NTNS
NTNB
DPIN⎥⎥⎦
⎤
⎢⎢⎣
⎡>+<= εε ,
10
where )( , jiLT is a "large trades" indicator variable that equals 1 if the total trade size for stock i
over interval j is larger than the stock's median interval trade size throughout the same trading
day, and zero otherwise. Again, Equation (4) builds on the broad approach in Equation (2), but
adds the nuance that large contrarian buys and sells are more likely to be initiated by informed
investors.2,3
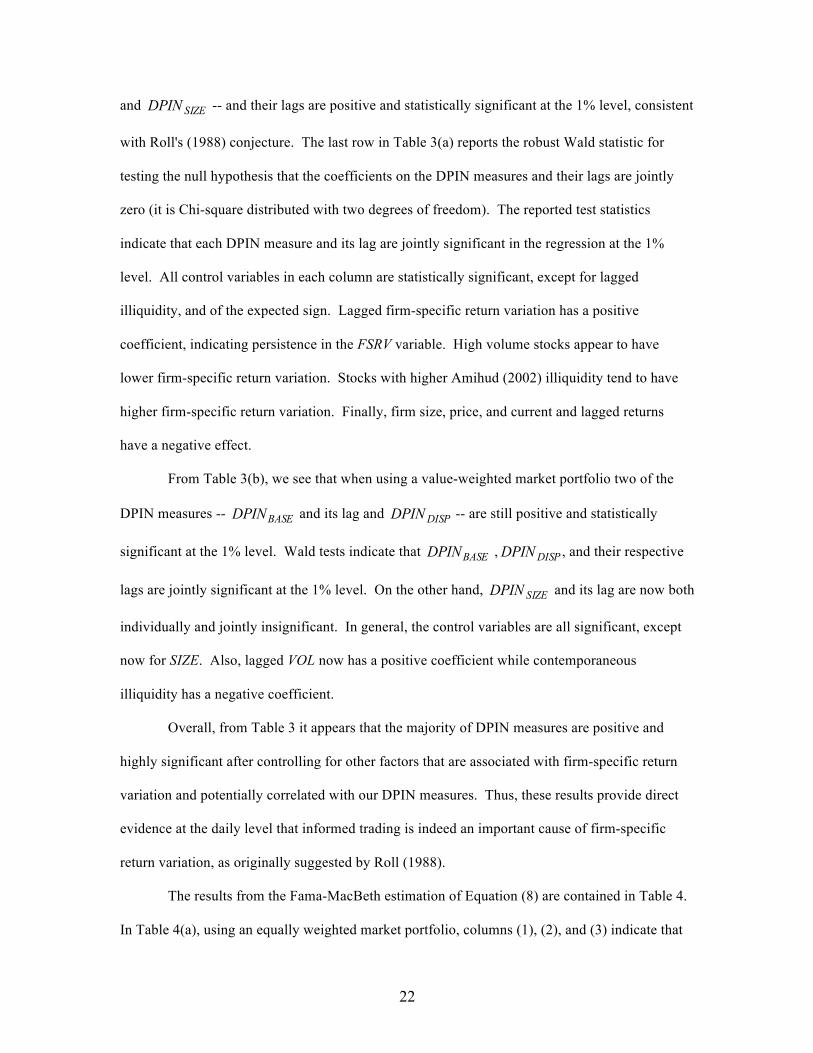
3.2. The DPIN measure as a proxy for informed trading
Private information arrival by its nature is short-lived and is a random shock across
stocks and across time. In this spirit, we have constructed our DPIN measure to capture such
unobservable high frequency dynamics of private information arrival. To verify that the DPIN
measure is a reasonable proxy for informed trading, we conduct several empirical examinations
and find that to a large extent the DPIN measure is a reasonable proxy for the unobservable
information trading as follows. First, the aggregate DPIN measure is consistent with the prior
literature of informed trading, i.e., the PIN measure of Easley et al. (2002). Second, the
unconditional (average) DPIN measure is associated with firm characteristics in terms of the
degree of opaqueness. For example, high DPIN stocks are likely to be associated with high
opaqueness such as small size, low volume, high illiquidity, etc. Third, the DPIN measure
(conditional on size) is able to capture the widely known U-shaped intraday pattern of
information trading. These collaborating results lend a strong support to our use of the DPIN
measure to capture the unobservable high frequency dynamic of the underlying private
information arrival. We next relate our findings to the previous literature and discuss the
2 ACG (2006) provide further tests on the feasibility of the trading size refinement by conducting daily autocorrelation tests. They find that large contrarian trades lead to zero serial correlation in unexpected returns, while herding trades, whether large or small, are associated with negative autocorrelation. The rationale is that large contrarian trades reflect information and therefore, unlike for uninformed trades, tend not to be followed by price reversals. 3 We use the median rather than average trade size to delineate large and small trades as the later will be skewed in the presence of a few extremely large trades or when there are many consecutive periods with very few trades.
11
relationship between our DPIN measure and firm characteristics. Intraday properties of the DPIN
measures are examined in the next subsection (Section 3.3).
3.2.1. Results and comparison of DPIN with previous models
The formulations in the preceding section lead to various measures of the probability of
informed trading. These measures have the advantage of being dynamic and flexible -- they can
be aggregated over many intervals to make comparisons with existing macro-horizon models, yet
they are also capable of capturing cross-sectional and time-series variation in the probability of
informed trading at the much higher daily and intraday frequencies (in our case, 15-minute
intervals). Another advantage is that the various DPIN measures presented above do not require
any form of numerical optimization for their estimation and are thus relatively simple and quick
to compute from the transactions data, thus providing a more straightforward and less time
consuming alternative method for dealing with tremendously large datasets such as TAQ.
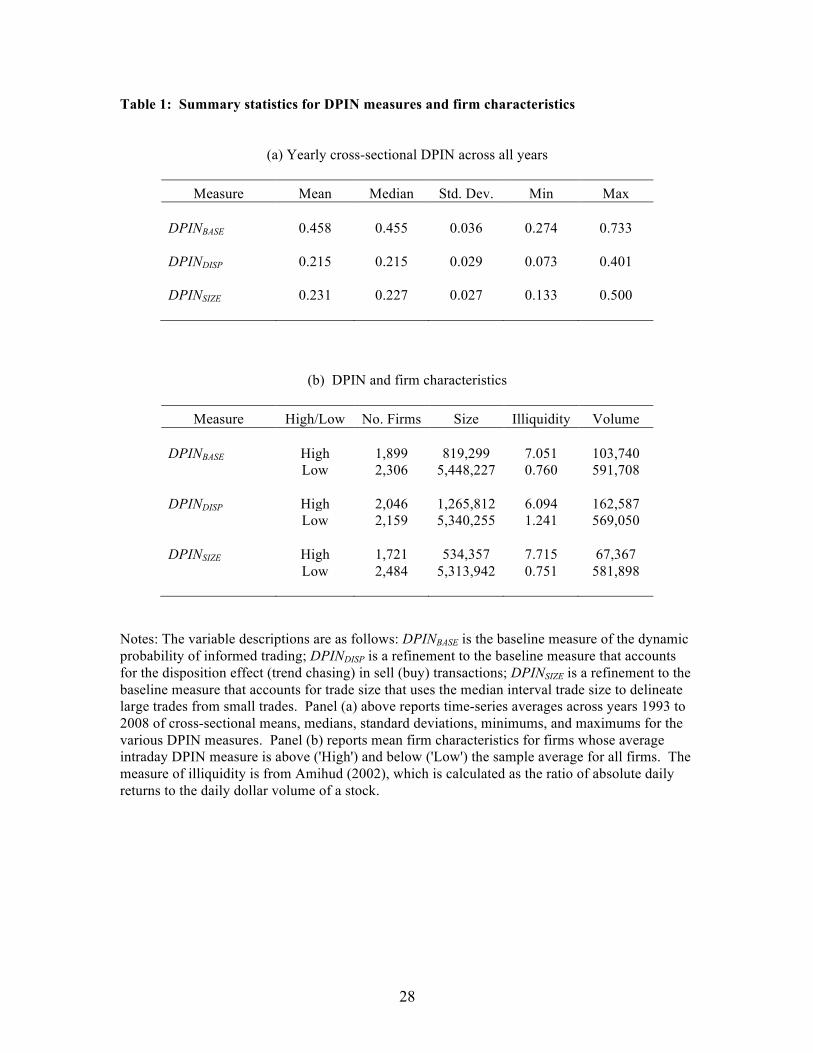
To facilitate comparisons with other existing estimates of the probability of informed
trading in the literature, Table 1(a) presents summary statistics for yearly cross-sectional DPIN
measures averaged across years 1993 to 2008. Not surprisingly, given the broad nature of the
baseline DPIN measure, BASEDPIN yields the largest mean and median estimates of the
probability of informed trading. The most noteworthy feature in Table 1(a) is that the means and
medians of two of the refined DPIN measures, namely DISPDPIN and SIZEDPIN , are quite close
to the PIN estimates of Easley et al. (2002, p. 2208), who find a parameter mean and median of
0.191 and 0.185, respectively. Restricting the sample to the 1993-98 period (which is the overlap
between our sample and that of Easley et al.), yields even closer results: we find 0.185 and 0.206,
respectively. Interestingly, although constructed at a much higher, intraday frequency the refined
DPIN measures come surprisingly close to approximating the properties of the macro-horizon
PIN when aggregated to similarly long time horizons, although the cross-sectional dispersion of
the DPIN measures appears lower than for PIN (standard deviations of 0.027 and 0.057,
12
respectively). Also worth mentioning is that our DPIN measures are also in proximity to the
probability of informed trading found in Nyholm (2002, p.495), who computes a mean value of
0.1106 for high volume stocks and 0.1380 for low volume stocks.4
Continuing with a comparison of the properties of DPIN with existing measures in the
literature, Figure 1 shows the yearly cross-sectional average DPIN measures over the years 1993
to 2008. Again, the results are quite similar to those of Easley et al. (2002), who find very little
year-to-year variation in their PIN estimates (see their Figure 3 Panel A on p. 2204). Thus, it
again appears that when aggregated over comparably long horizons as the PIN estimate of Easley
et al., our DPIN measures exhibit a similar stability across time. Across stocks, Figure 2 plots the
distribution of average DPIN measures for all stocks in the sample. From the plotted histograms,
it appears that each of the various DPIN measures yields adequate cross-sectional variation;
importantly, stocks appear to differ very noticeably along the dimensions associated with the
various DPIN measures. Again with respect to Easley et al. (2002), the most striking similarity
occurs with the distribution of our SIZEDPIN measure. Comparing our Figure 2(c) with their
Figure 4 Panel C (p. 2207), which shows the cross-sectional distribution of PIN, not only are the
two histograms centered in the same approximate location but there is a similar left skew in both
plots, with both also exhibiting a relatively long right tail. However, the overall dispersion of
PIN appears higher, consistent with the fact that it has a higher standard deviation.
3.2.2. DPIN measures and firm characteristics
We next split the sample into two groups by taking High (Low) DPIN stocks to be stocks
whose average intraday DPIN measure are above (below) the sample average for all stocks.
Table 1(b) reports mean firm characteristics for high and low DPIN stocks. It is clear that
4 Nyholm (2002) is similarly interested in a dynamic estimate of the probability of informed trading at the transaction level. Placing the trade-indicator model of Huang and Stoll (1997) in a Markov-switching framework, he estimates the probability of informed trading using the evolution of the smoothed conditional state probabilities through time. Nyholm uses 108 stocks and one-month of TAQ data in the analysis.
13
High DPIN stocks are associated with firms characteristics consistent with higher levels of
opaqueness. Stocks with higher DPIN measures are associated with much smaller firm size (by
an order of magnitude in most cases), low volume, and much higher illiquidity (as measured by
Amihud (2002) as the ratio of absolute daily returns to the daily dollar volume of a stock). These
results bolster the case that the various DPIN measures reasonably capture the unobserved
dynamics of informed trading and thus serve as a suitable proxy for it.
3.3. Intraday properties of the DPIN measures
An advantage of the DPIN measures constructed above is that they provide estimates of
the probability of informed trading at much finer frequencies. Thus, we can examine the intraday
patterns of informed trading and provide new evidence with regard to the theoretical
microstructure literature in this area.
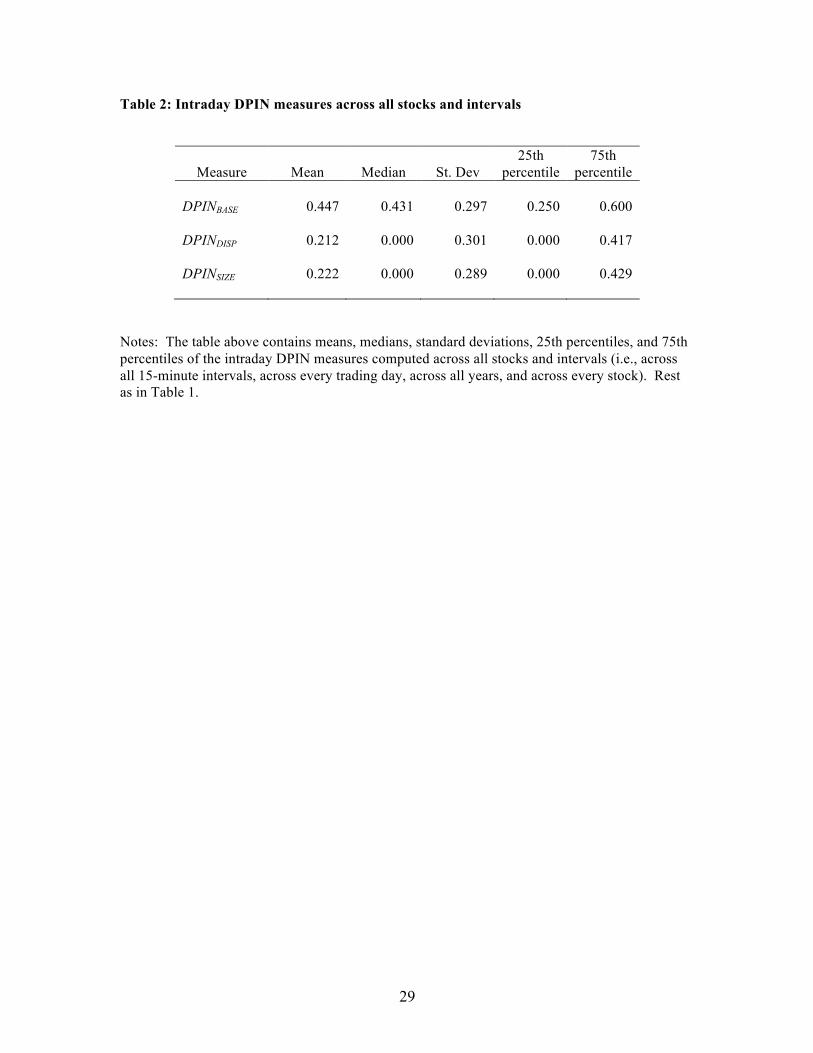
Table 2 reports summary statistics for the (disaggregated) intraday DPIN measures across
all 15-minute intervals and stocks. Of course, the means of each of the measures are very similar
to those in Table 1(a), while the standard deviations are much higher given the higher variability
that is expected at the intraday level across intervals and stocks. Notably, the medians for the two
refined DPIN measures are zero, indicating that the majority of 15-minute intervals do not exhibit
any signs of informed trading activity whatsoever. Typically, for any given stock on any given
trading day, the pattern of the probability of informed trading exhibits a cycle in which there are
several consecutive 15-minute intervals where the probability of informed trading is nonzero, and
then reverts to zero for several more intervals, etc. Stocks with generally higher average intraday
DPIN measures tend to display longer runs of consecutive "nonzero" intervals, and shorter runs
of consecutive "zero" intervals. This finding is in contrast to the PIN model, which postulates a
constant Poisson arrival rate of informed trading throughout the trading day. However, our
finding is more consistent with the notion of strategic timing on the part of informed investors of
14
when to take advantage of the camouflage provided by uninformed investors to exploit their
asymmetric information advantage (Kyle, 1985; Back 1992; Lei and Wu, 2005).5
Further results on the intraday pattern of the probability of informed trading are reported
in Figure 3, which shows the various DPIN measures at each 15-minute interval throughout a
trading day aggregated across all stocks and time periods. Such an analysis gives a glimpse of the
market-wide dynamics of informed trading throughout a typical trading day. Similar to their
macro-horizon counterparts, BASEDPIN and DISPDPIN exhibit a high degree of stability
throughout the trading day. However, SIZEDPIN exhibits an interesting U-shaped pattern, with a
relatively high degree of informed trading (conditional on large trades) taking place closer to the
opening (9:00am to 11:30am) and closing (2:45pm to 4:00pm) hours of the trading day, and
relatively less informed activity (conditional on large trades) occurring during the middle portion
of the day in between (especially during the lunch hours from 12:00pm to 2:00pm).
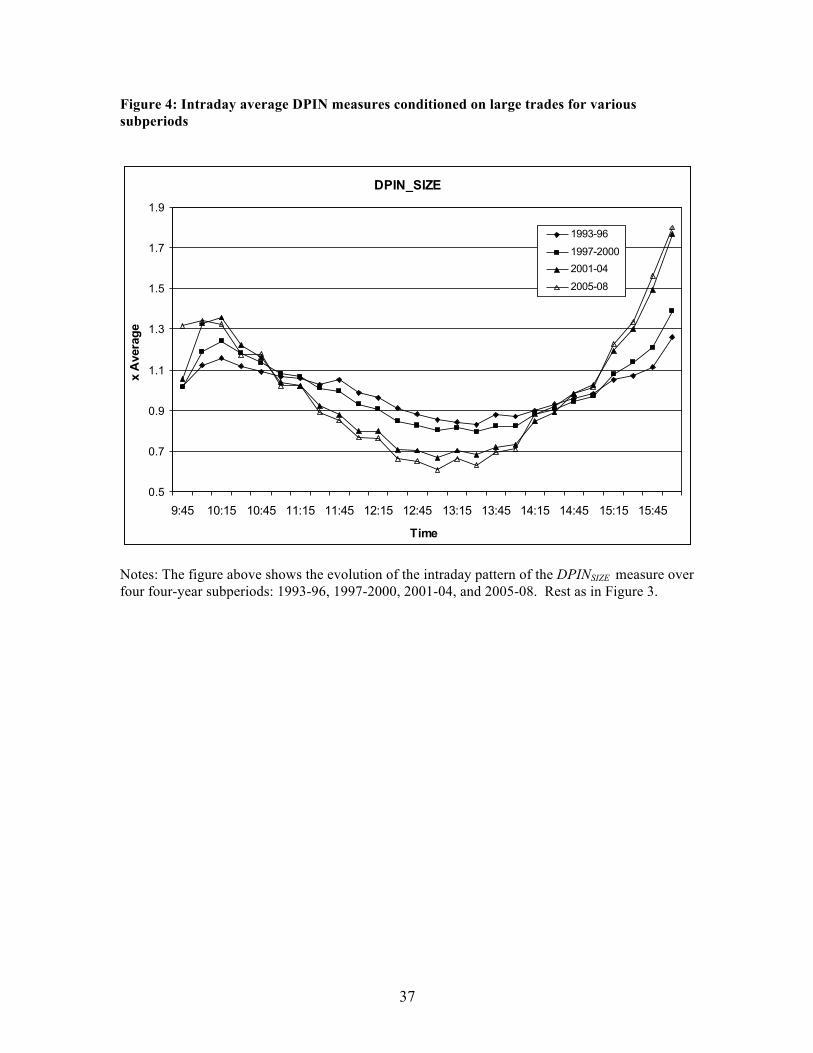
Examining how this U-shaped intraday pattern of informed trading has evolved over the
years, Figure 4 considers four four-year sub-periods of SIZEDPIN . It is clearly evident from both
panels that the intraday U-shaped pattern of the probability of informed trading has become much
more pronounced over time. Over each of the sub-periods, there is a marked increase in informed
trading activity (conditional on large trades) during the opening and closing hours of the trading
day. On the other hand, the probability of informed trading (conditional on large trades) appears
to have declined considerably over time during the middle of the day.
It is important to note that the increasing U-shaped pattern in the DPIN measure occurs
when conditioning on large trade size, while no such pattern is exhibited in BASEDPIN or
DISPDPIN , both of which are unrelated to size. This seemingly perplexing result is in fact
5 Lei and Wu (2005) develop a theoretical model in which informed investors monitor market movements and respond rationally to any change in the arrival of uninformed traders. They point out that because theoretical frameworks in Glosten and Milgrom (1985) and Easley et al. (1996) assume that traders are chosen probabilistically to submit orders, informed traders cannot respond to camouflage provided by the uninformed traders in such models.
15
consistent with the predictions of the prior literature on market microstructure theory. In his
seminal paper, Kyle (1985) posits that the informed investor will trade strategically to camouflage
his/her trading among those of the uninformed investors. Admati and Pfleiderer (1988) argue
further that uninformed investors have an incentive to concentrate their trades in order to
minimize their trading costs. To the extent that inventory-motivated trades are likely to occur in
anticipation of and following non-trading periods, uninformed investors naturally concentrate
their trades toward the beginning and the end of the trading day. Consequently, the informed
investor can take advantage of the thick market during both ends of the trading day by submitting
large sizes of trade without revealing much private information. This also means that in the
middle of the trading day when uninformed trading is sparse, the informed investor will
strategically avoid large trades to minimize information revelation. Such strategic behavior on
the part of informed traders is consistent with the U-shaped intraday pattern in SIZEDPIN .
Once we understand the strategic behavior of informed investors behind the U-shaped
intraday trading pattern conditional on large trades, we naturally ask why no such pattern is
exhibited in the DPIN measures without conditioning on size, i.e., in BASEDPIN and DISPDPIN .
If informed investors only concentrated their trading at both ends of the trading day, then we
would have observed the same intraday U-shaped pattern of informed trading regardless of trade
size. The fact that we do not observe such a pattern in BASEDPIN and DISPDPIN might seem to
refute such a simple scenario of informed trading. Moreover, if information arrival is random and
short-lived during the trading day, then informed investors have an incentive to trade whenever
information arises since delayed trading can mean a reduced information advantage, or none at
all. Knowing this, however, informed investors also recognize the impact of their trading on
prices, especially when the market is thin during the middle of the trading day. To resolve this
dilemma, informed traders can strategically break up intended large orders into a series of small
trades to minimize information revelation. Such strategic behavior of the informed traders can
16
actually lead to an inverse U-shaped intraday trading pattern when conditioned on small trade
sizes. That is, conditional on small trades, the probability of information trading is high in the
middle of the trading day and low at both ends. To verify this prediction in our DPIN framework,
we define a corresponding measure for small trades, SMALLDPIN , such that
(5) )()0()0( ,.,
,,
,
,, jiji
ji
jiji
ji
jijiSMALL ST
NTNS
NTNB
DPIN⎥⎥⎦
⎤
⎢⎢⎣
⎡>+<= εε ,
where )( , jiST is a "small trades" indicator variable that equals 1 if the total trade size for stock i
over interval j is smaller than the stock's median interval trade size throughout the same trading
day, and zero otherwise. We then plot the results of the intraday pattern of this measure for small
trades in Figure 5(a) for the whole sample and in Figures 5(b) for sub-periods. Indeed, the figures
clearly show an inverse U-shaped pattern in both measures. Furthermore, Figure 5(b) indicates
that the inverse U-shaped intraday pattern of the probability of informed trading has become
much more pronounced over time. Over each of the sub-periods, there is a marked increase in
informed trading activity during the middle hours of the trading day conditional on small trades.
The strategic behavior of informed traders who break up large orders into a series of
small trades to hide their information is first posited in the stealth trading hypothesis of Barclay
and Warner (1993) and well documented in later empirical studies by Chakravarty (2001),
Alexander and Peterson (2007), Hansch and Choe (2007), and Blau et al. (2009). Among these
studies, our sample period (1993 to 2008) overlaps best with that of Hansch and Choe (2007),
who examine the period from 1993 to 2003. Interestingly, they find that the distribution of stealth
informed trading shifts from medium-sized trades to small trades around the year 2000, partly due
to increased access to information after the millennium during the internet era. This phenomenon
may explain what we observe in Figure 5(b) with the inverse U-shaped pattern of information
based trading becoming more pronounced over time. Since large trades are the opposite of small
trades, as small informed trades become more pronounced during the middle of the trading day
17
over time, large informed trades at the same time are likely to become more pronounced towards
both ends of the trading day – a result which is indeed confirmed in Fig. 3 and Fig. 4.
Once we realize that the U-shaped intraday pattern of large informed trades and the
inverse U-shaped pattern of small informed trades are two sides of the same coin, or two distinct
pieces of the whole puzzle, we obtain a more complete picture of informed trading. That is,
informed investors do not solely trade at both ends, nor do they trade only in the middle of the
trading day. They will trade anytime during the day whenever short-lived information arises for
fear of losing their information advantage. During both ends of the trading day when the market
is thick, the informed traders can afford to submit large trades without revealing much
information. However, during the middle of the trading day when the market is thin, the
informed traders cannot afford to submit large trades and hence have to strategically break up
their large orders into a series of small trades. Combining these two opposite forces or U-shaped
patterns result in a flat probability of informed trading throughout the trading day, dictated mainly
by the random arrival of information. Thus, we obtain a flat intraday pattern of informed trading
in both of the unconditional DPIN measures, BASEDPIN or DISPDPIN , as shown in Figure 3. In
this sense, then, such an unconditional, flat intraday pattern of informed trading may actually lend
support to the theoretical models of Glosten and Milgrom (1985) and Easley et al. (1996) that
traders are chosen probabilistically to submit orders.
Lastly, it is worth noting that while the U-shaped intraday pattern has been widely
documented in earlier literature concerning the role of informed trading, for example, Wood et al.
(1985), Harris (1986), Jain and Joh (1988), Gerety and Mulherin (1992), Chan et al. (1995), and
Wang (1998), few have uncovered a corresponding, inverse U-shaped intraday pattern in
informed trading for small trades. One notable exception is Blau et al. (2009) who use price
changes as a proxy for informed trading and find a similar U-shaped intraday pattern in large
informed trades and an inverse U-shaped intraday pattern in small informed trades. To our
18
knowledge, we are the first study that uses a direct measure of the probability of informed trading
to document such complementary intraday patterns of informed trading in its totality.
4. DPIN and daily firm-specific return variation
As discussed above, ever since Roll (1988) surmised that firm specific-return variation
might be caused by private information, researchers have taken (for granted) the former as a
proxy for the latter to study an array of issues in finance. While many appealing conceptual and
indirect arguments have been made for such an approach, very few studies (to our knowledge)
directly investigate the relationship between the two variables, especially at the higher frequency,
intraday level. In this section, we examine the empirical link between informed trading and firm-
specific return variation to provide more in-depth and direct evidence on the validity of Roll's
conjecture.
4.1. Methodology
To construct our measure of daily firm-specific return variation, we use the standard
approach in the literature based on the R-squared statistic from a market model regression (e.g.,
Roll (1988), Durnev et al. (2003, 2004), and Chen et al. (2007)). Namely, for each firm on day t
we perform the following regression:
(6) jijmiiji RR ,,1,0,, εγγ ++= ,
where jiR , is the return of firm i at intraday interval j (within day t) and jmR , is the market
return at interval j using both an equally weighted and value weighted portfolio. Daily firm-
specific return variation for firm i on day t is then defined as tiFSRV , = log[(1 - 2,tiR )/ 2
,tiR ],
where 2,tiR is the daily R-squared statistic for firm i on day t from the regression in Equation (6).
Thus, FSRV captures the unexplained variation in a firm's returns that remains after market
19
returns have been accounted for. 6 As a result, for each day in the sample, we have a measure of
the firm-specific return variation for each stock.
The daily probability of informed trading for a given stock is taken to be the average
DPIN across all intervals over a particular trading day. Thus, stocks with higher interval DPINs
within a trading day will tend to have higher daily DPINs. We use the three DPIN measures in
Equations (2), (3), and (4), and report the results using each below.
To directly examine the empirical relationship between daily firm-specific return
variation and informed trading, we use the Fama and MacBeth (1973) regression framework,
which involves performing cross-sectional regressions to obtain parameter estimates for each day,
and then taking the time-series average across all days to arrive at parameter estimates and their
sampling distributions for the entire sample. There are a total of N = 4,191 stocks and T = 3,994
days in the regressions. The Fama-MacBeth regressions are specified as follows:
for Ni ,...,1= and Tt ,...,1= , where i denotes firm and t denotes day, DPIN corresponds to one of
the four DPIN measures constructed above (with one lag of DPIN included to account for lagged
effects), and X is a vector of control variables. The control variables are: total daily volume
(VOL); the Amihud (2002) illiquidity measure (ILL), which is calculated as the ratio of absolute
daily returns to the daily dollar volume of a stock; firm size (SIZE); stock price (PRC); and
returns (RET). To account for short-term dynamics, we also include in the vector of controls one
lag each of FSRV, VOL, ILL, and RET.
The Fama-MacBeth approach is widely used in the empirical asset pricing literature,
especially in the "large T, large N" panel data context (i.e., a large number of time-series
observations and cross-sectional observations (which characterizes our dataset)), as opposed to
6 There are a maximum of 26 return observations for each firm-day. Some stocks do not have transactions, and thus returns, in all intervals, resulting in missing data for those intervals and insufficient observations with which to perform the regression in Equation (6). To avoid problems associated with having too small of a sample, we restrict our attention to firm-days with greater than 10 interval return observation per day.
20
fixed or random effects estimation (which appears to be more widely used in the "large N, small
T" settings commonly arising in corporate finance or empirical microeconomics). The properties
of the Fama-MacBeth approach are explored further in Skoulakis (2008) and Petersen (2009). Of
concern is the computation of unbiased standard errors in the presence of cross-sectional and
serial correlations; ignoring such correlations can result in underestimation of the standard errors
and thus inflated t-statistics and invalid inferences.
In particular, Petersen (2009) shows that the Fama-MacBeth standard errors are robust to
cross-sectional correlation across firms (or stocks) in a given time period (as this is what Fama-
MacBeth was originally designed to handle), but are biased downwards in the presence of an
unobserved firm fixed effect that induces serial correlation for a given stock across periods, even
after Newey and West (1987) adjustments are made for serial correlation and heteroskedasticity
of unknown form (i.e., HAC estimation). As such, Petersen notes that Fama-MacBeth
regressions containing persistent data (which may arise from such firm fixed effects) are most
likely to suffer from biased standard errors.
To address this potential problem, we conduct two robustness checks. First, we perform
the Fama-MacBeth regression on first-differenced data, as this helps to remove any firm fixed
effects and reduces persistence in the data, thereby possibly leading to potentially more reliable
standard errors. In addition, first-differencing has the advantage of mitigating potential
microstructure effects (e.g., the bid-ask bounce), while allowing an examination of the dynamics
of how day-to-day changes in informed trading affect day-to-day changes in firm-specific return
variation across firms. Specifically, we perform Fama-MacBeth regressions based on the
for Ni ,...,1= and Tt ,...,1= , where, ΔDPIN corresponds to the daily first-difference of the
corresponding DPIN measure (with one lag of ΔDPIN included to account for the effects of
21
lagged daily changes), and Z is a vector of control variables that includes the change in total daily
volume (ΔVOL) and the daily change in the Amihud (2002) illiquidity measure (ΔILL), with one
lag of each included. Contemporaneous and lagged returns (RET) are also included, but not
further differenced. Firm size (SIZE) and stock price (PRC) are not included as these are
insignificant in the regression, while their first differences are omitted due to possible multi-
collinearity issues, as these are highly correlated with returns.
Second, we use the intermediate demeaning method developed in Skoulakis (2008), who
performs the Fama-MacBeth regressions on time-demeaned data. In the presence of an
unobserved fixed firm effect, Skoulakis shows that such an approach (by effectively eliminating
the fixed effect) also yields accurate asymptotic approximations. In addition, evidence from
simulations indicates that standard econometric tools such as Newey-West HAC estimators
produce reliable t-statistics. The specification is as follows:
(9) titittittitti VDPINDPINFSRV ,~,
'~1,,2
~,,1
~, εγββα ++++= − ,
for Ni ,...,1= and Tt ,...,1= , where for each variable for a stock on day t, we subtract the
corresponding time-series mean over all days from the variable. The demeaned variable is
represented by a "tilde" superscript. The vector of controls ~V contains demeaned volume,
illiquidity, and size, as well as one lag each of demeaned volume and demeaned illiquidity. As in
Equation (8), returns are included but are not demeaned since they are mean-reverting with very
little persistence.
4.2. Estimation results
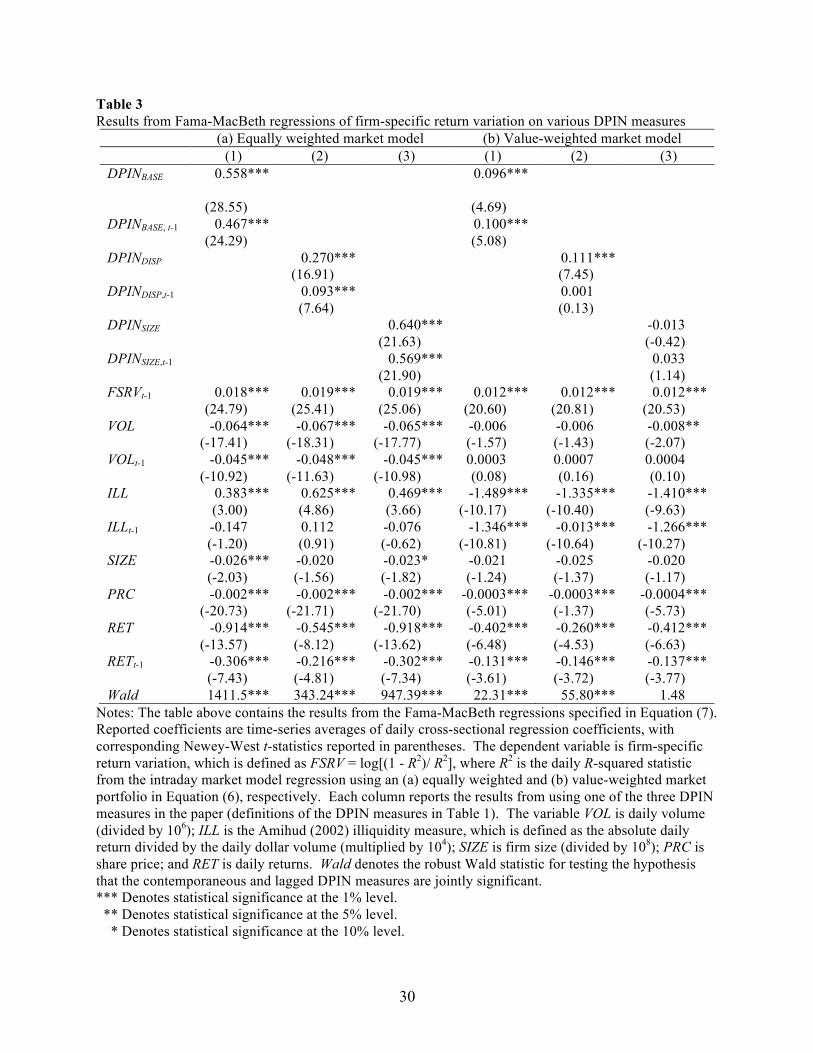
The results from the Fama-MacBeth estimation of Equation (7) are contained in Table 3;
panel (a) uses an equally weighted market portfolio in the market model regression in Equation
(6), while panel (b) uses a value-weighted market portfolio. Newey and West (1987) t-statistics
are reported in parentheses below the corresponding parameter estimate. It is evident from
columns (1), (2), and (3) in Table 3(a) that all three DPIN measures -- BASEDPIN , DISPDPIN ,
22
and SIZEDPIN -- and their lags are positive and statistically significant at the 1% level, consistent
with Roll's (1988) conjecture. The last row in Table 3(a) reports the robust Wald statistic for
testing the null hypothesis that the coefficients on the DPIN measures and their lags are jointly
zero (it is Chi-square distributed with two degrees of freedom). The reported test statistics
indicate that each DPIN measure and its lag are jointly significant in the regression at the 1%
level. All control variables in each column are statistically significant, except for lagged
illiquidity, and of the expected sign. Lagged firm-specific return variation has a positive
coefficient, indicating persistence in the FSRV variable. High volume stocks appear to have
lower firm-specific return variation. Stocks with higher Amihud (2002) illiquidity tend to have
higher firm-specific return variation. Finally, firm size, price, and current and lagged returns
have a negative effect.
From Table 3(b), we see that when using a value-weighted market portfolio two of the
DPIN measures -- BASEDPIN and its lag and DISPDPIN -- are still positive and statistically
significant at the 1% level. Wald tests indicate that BASEDPIN , DISPDPIN , and their respective
lags are jointly significant at the 1% level. On the other hand, SIZEDPIN and its lag are now both
individually and jointly insignificant. In general, the control variables are all significant, except
now for SIZE. Also, lagged VOL now has a positive coefficient while contemporaneous
illiquidity has a negative coefficient.
Overall, from Table 3 it appears that the majority of DPIN measures are positive and
highly significant after controlling for other factors that are associated with firm-specific return
variation and potentially correlated with our DPIN measures. Thus, these results provide direct
evidence at the daily level that informed trading is indeed an important cause of firm-specific
return variation, as originally suggested by Roll (1988).
The results from the Fama-MacBeth estimation of Equation (8) are contained in Table 4.
In Table 4(a), using an equally weighted market portfolio, columns (1), (2), and (3) indicate that
23
BASEDPINΔ , DISPDPINΔ , and SIZEDPINΔ , and each of their respective lags, are positive and
significant at the 1% level for explaining firm-specific return variation (except for the lag of
DISPDPINΔ , which is significant at the 10% level). Wald tests indicate that all three DPIN
measures and their respective lags are jointly significant at the 1% level. The first-differenced
control variables ΔVOL and its lag, as well as lagged ΔILL, are all significant, indicating that
firms that experience a contemporaneous and lagged increase in daily volume have lower daily
firm-specific return variation, while shares that experience an increase in lagged illiquidity have
higher firm-specific return variation, suggesting mean reversion in the response of FSRV to the
illiquidity measure. Finally, firms with high contemporaneous (lagged) returns tend to experience
declines (increases) in firm-specific return variation. In Table 4(b), we use a value-weighted
market portfolio and repeat the analysis as in Table 4(a). Now, only DISPDPINΔ is significant
and of the correct sign, although it and its lag are highly jointly significant.. The signs,
magnitudes, and statistical significance of the control variables are similar to those reported Table
4(a) and discussed above.
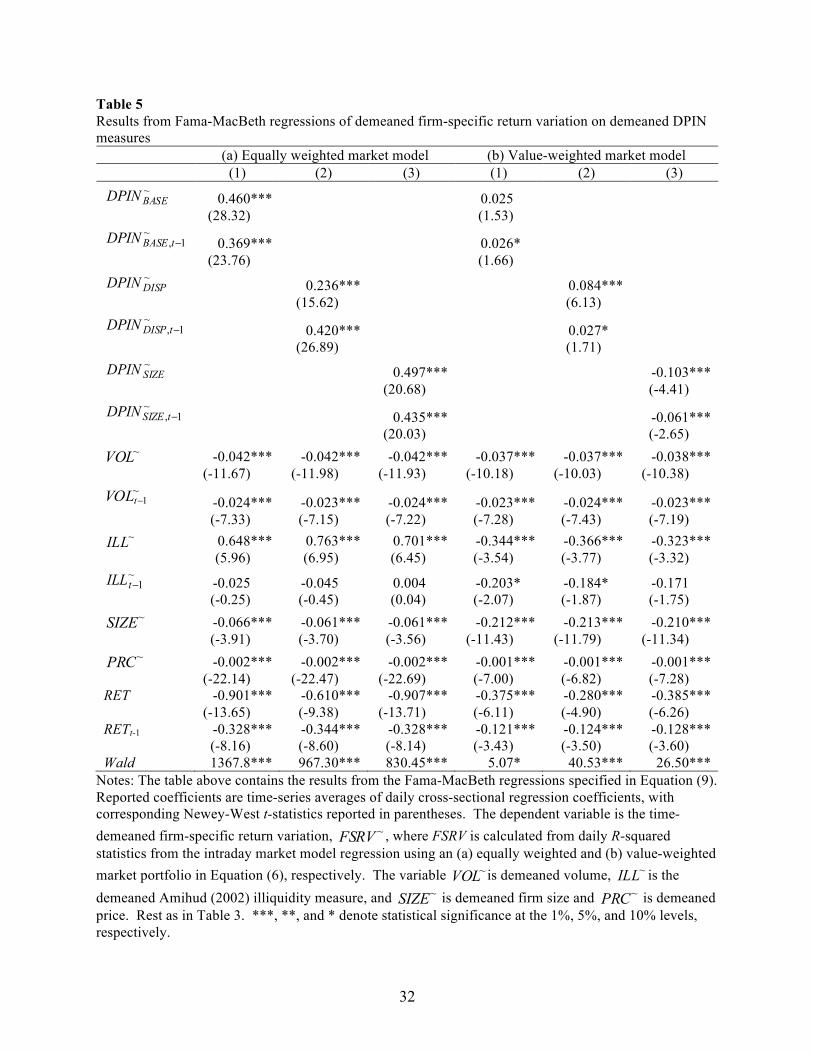
The results from the Fama-MacBeth estimation of Equation (9) are contained in Table 5.
Using an equally weighted market portfolio, Table 5(a) indicates that all three demeaned DPIN
measures and their lags are highly statistically significant, both individually and jointly. All other
controls are also significant (except lagged illiquidity) and of the similar to sign to previous
specifications. Using a value-weighted portfolio, Table 5(b) indicates that the demeaned
DISPDPIN and its lag, as well as the lag of demeaned BASEDPIN remain statistically significant
at conventional levels and of the correct sign, and both variables and their lags are jointly
significant at conventional levels.
Overall, and on balance, the results in Tables 4 and 5 Corroborate the evidence from the
original analysis in Table 3. Namely, a clear majority of the measures of informed trading
activity remain positive and highly significant after controlling for other factors that are
24
associated with changes in firm-specific return variation and potentially correlated with our DPIN
measures. Again, these results provide further direct evidence at the daily level that informed
trading is indeed an important determinant of firm-specific return variation.
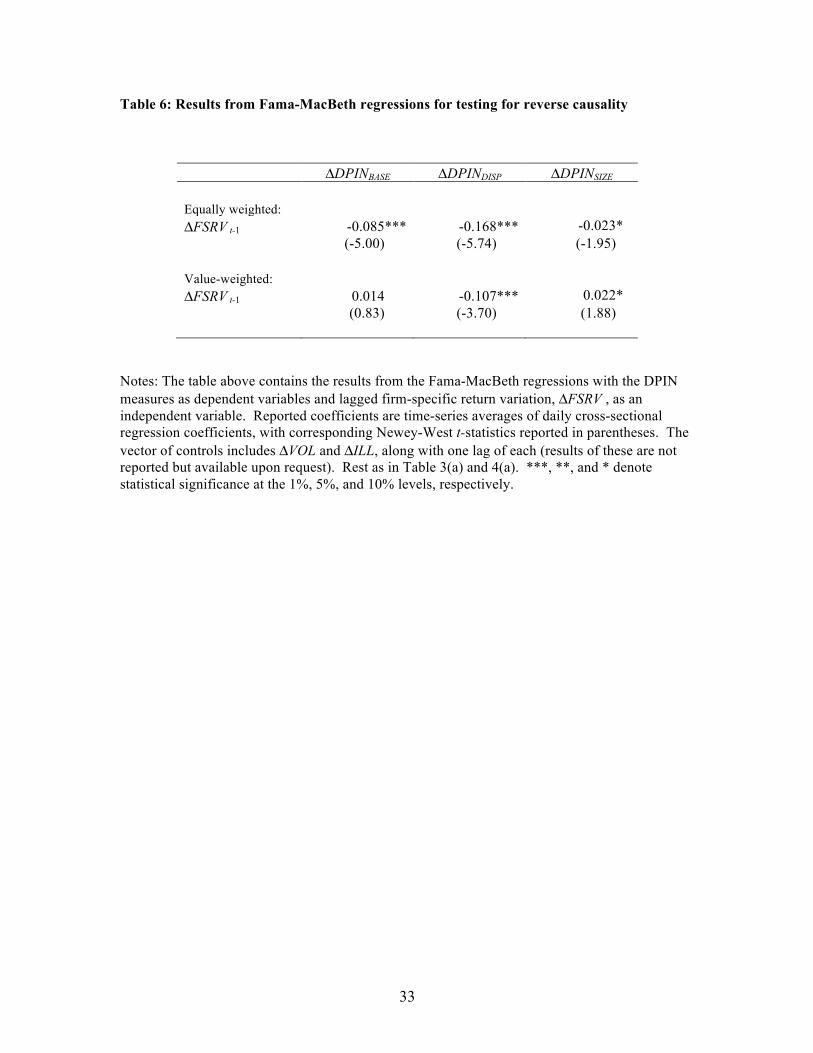
Finally, since our hypothesis is that higher informed trading causes higher firm-specific
return variation vis-à-vis Roll (1988), and not the other way around, we next examine the issue of
reverse causality. For this purpose, we use first-differenced data and for each of the three DPIN
measures, we regress changes in DPIN on lagged changes in firm-specific return variation and the
control variables ΔVOL and ΔILL (and one lag of each). The results of these regressions are
reported in Table 6. The majority of coefficients on firm-specific return variation are negative,
while those that are positive are either insignificant or less significant. Overall, it thus appears
that an increase in firm-specific return variation causes a decline, rather than an increase, in
informed trading. Thus, reverse causality does not appear to be a problem in our study.
5. Conclusion
The aim of our paper has been twofold. First, we constructed a dynamic intraday
measure of the probability of informed trading that is relatively straightforward to implement and
circumvents the aggregation problem of other existing measures. As such, our DPIN measure
gives a finer and perhaps more accurate view of the dynamics of private information in modern
financial markets, especially at higher frequencies. Given the importance of private information
in the theoretical and empirical finance literature, such a measure is potentially useful in
understanding how markets incorporate information into prices and has broad applicability to a
large range of topics in market microstructure, asset pricing, and corporate finance. In this vein,
we employed our dynamic intraday measure of informed trading to examine the empirical link
between private information and firm-specific return variation. Unlike previous studies cited
above that provide indirect and circumstantial support for a relationship between the two, our
25
results using DPIN provide more in-depth and direct evidence on the validity of Roll's (1988)
conjecture.
26
References
Admati, A., Pleiderer, P., 1988. A theory of intraday patterns: Volume and price volatility. Review of Financial Studies 1, 3-40. Alexander, G. Peterson, M., 2007. An analysis of trade-size clustering and its relation to stealth trading. Journal of Financial Economics 84, 435-471. Amihud, Y., 2002. Illiquidity and stock returns: cross-section and time-series effects. Journal of Financial Markets 5, 31-56. Aramov, D., Chordia, T., Goyal, A., 2006. The impact of trades on daily volatility. Review of Financial Studies 19, 1241-1277. Back, K., 1992. Insider trading in continuous time. Review of Financial Studies 5, 387–409. Barclay, M., Warner, J., 1993. Stealth trading and volatility: which trades move prices? Journal of Financial Economics 34, 281-306. Blau, B., Van Ness, B., Van Ness, R., 2009. Intraday stealth trading: which trades move prices during periods of high volume? Journal of Financial Research 32, 1-21. Chakravarty, S., 2001. Stealth trading: which trader’s trades move prices? Journal of Financial Economics 61, 289-307. Chan, K., Christie, W., Schultz, P., 1995. Market structure and the intraday pattern of bid-ask spreads for NASDAQ securities. Journal of Business 68, 35-60. Campbell, J., Grossman, S., Wang J., 1993. Trading volume and serial correlation in stock returns. Quarterly Journal of Economics 31, 281-318. Chen, Q., Goldstein, I., Jiang, W., 2007. Price informativeness and investment sensitivity to stock prices. Review of Financial Studies 20, 619-650. Duarte, J., Young, L., 2009. Why is PIN priced? Journal of Financial Economics 91, 119-138. Durnev, A., Morck, R., Yeung B., 2004. Value enhancing capital budgeting and firm-specific stock return variation. Journal of Finance 59, 65-105. Durnev, A., Morck, R., Yeung, B., Zarowin, P., 2003. Does greater firm-specific return variation mean more or less informed stock pricing? Journal of Accounting Research 41, 797-836. Easley, D., Hvidkjaer, S., O'Hara, M., 2002. Is information risk a determinant of asset returns? Journal of Finance 57, 2185-2221. Easley, D., Kiefer, N., O’Hara, M., Paperman, J., 1996. Liquidity, information and infrequently traded stocks. Journal of Finance 51, 1405–1436. Easley, D., Kiefer, N., O'Hara, M., 1997a. One day in the life of a very common stock. Review of Financial Studies 10, 805-835. Easley, D., Kiefer, N., O'Hara, M., 1997b. The information content of the trading process. Journal of Empirical Finance 4, 159-186. Easley, D., O'Hara, M., 1987. Price, trade size, and information in securities markets. Journal of
27
Financial Economics 19, 69-90. Fama, E., MacBeth, J., 1973. Risk, return, and equilibrium: empirical tests. Journal of Political Economy 81, 607-636. Glosten, L., Milgrom, P., 1985. Bid, ask, and transaction prices in a specialist market with heterogeneously informed traders. Journal of Financial Economics 14, 71–100. Gerety, M., Mulherin, H., 1992. Trading halts and market activity: an analysis of volume at the open and the close. Journal of Finance 47, 1765-1784. Hansch, O., Choe, H., 2007. Which trades move stock prices? Stealth trading revisited. Working paper, Pennsylvania State University. Harris, L., 1986. A transaction data study of weekly and intraday patterns of stock returns. Journal of Financial Economics 16, 99-118. Huang, R., Stoll, H., 1997. The components of the bid-ask spread: A general approach. Review of Financial Studies 10, 995-1034. Jain, P., Joh, G., 1988. The dependence between hourly prices and trading volume. Journal of Financial and Quantitative Analysis 23, 269-283. Kyle, A., 1985. Continuous auctions and insider trading. Econometrica 53, 1315-1335. Lee, C., Ready, M., 1991. Inferring trade direction from intraday data. Journal of Finance 46, 733-746. Lei, Q., Wu, G., 2005. Time-varying informed and uninformed trading activities. Journal of Financial Markets 8, 153-181. Morck, R, Yeung, B., Yu, W., 2000. The information content of stock markets: why do emerging markets have synchronous stock price movements? Journal of Financial Economics 59, 215- 260. Newey, W., West, K., 1987. A simple, positive semi-definite, heteroskedasticity and autocorrelation consistent covariance matrix. Econometrica 55, 703-708. Nyholm, K., 2002. Estimating the probability of informed trading. Journal of Financial Research 25, 485-505. Petersen, M., 2009. Estimating Standard Errors in Finance Panel Data Sets: Comparing Approaches. Review of Financial Studies 22, 435-480. Roll, R., 1988. R2. Journal of Finance 43, 541-566. Skoulakis, G., 2008. Panel Data Inference in Finance: Least-Squares vs. Fama-MacBeth. Working paper, University of Maryland. Wang, F., 1998. Strategic trading, asymmetric information and heterogeneous prior beliefs. Journal of Financial Markets 1, 321-352. Wood, R., McInish, T., Ord, J., 1985. An investigation of transaction data for NYSE stocks. Journal of Finance 40, 723-740.
28
Table 1: Summary statistics for DPIN measures and firm characteristics
Notes: The variable descriptions are as follows: DPINBASE is the baseline measure of the dynamic probability of informed trading; DPINDISP is a refinement to the baseline measure that accounts for the disposition effect (trend chasing) in sell (buy) transactions; DPINSIZE is a refinement to the baseline measure that accounts for trade size that uses the median interval trade size to delineate large trades from small trades. Panel (a) above reports time-series averages across years 1993 to 2008 of cross-sectional means, medians, standard deviations, minimums, and maximums for the various DPIN measures. Panel (b) reports mean firm characteristics for firms whose average intraday DPIN measure is above ('High') and below ('Low') the sample average for all firms. The measure of illiquidity is from Amihud (2002), which is calculated as the ratio of absolute daily returns to the daily dollar volume of a stock.
29
Table 2: Intraday DPIN measures across all stocks and intervals
Notes: The table above contains means, medians, standard deviations, 25th percentiles, and 75th percentiles of the intraday DPIN measures computed across all stocks and intervals (i.e., across all 15-minute intervals, across every trading day, across all years, and across every stock). Rest as in Table 1.
30
Table 3 Results from Fama-MacBeth regressions of firm-specific return variation on various DPIN measures
(a) Equally weighted market model (b) Value-weighted market model (1) (2) (3) (1) (2) (3)
Notes: The table above contains the results from the Fama-MacBeth regressions specified in Equation (7). Reported coefficients are time-series averages of daily cross-sectional regression coefficients, with corresponding Newey-West t-statistics reported in parentheses. The dependent variable is firm-specific return variation, which is defined as FSRV = log[(1 - R2)/ R2], where R2 is the daily R-squared statistic from the intraday market model regression using an (a) equally weighted and (b) value-weighted market portfolio in Equation (6), respectively. Each column reports the results from using one of the three DPIN measures in the paper (definitions of the DPIN measures in Table 1). The variable VOL is daily volume (divided by 106); ILL is the Amihud (2002) illiquidity measure, which is defined as the absolute daily return divided by the daily dollar volume (multiplied by 104); SIZE is firm size (divided by 108); PRC is share price; and RET is daily returns. Wald denotes the robust Wald statistic for testing the hypothesis that the contemporaneous and lagged DPIN measures are jointly significant. *** Denotes statistical significance at the 1% level. ** Denotes statistical significance at the 5% level. * Denotes statistical significance at the 10% level.
31
Table 4 Results from Fama-MacBeth regressions of first-differenced firm-specific return variation on changes in first-differenced DPIN measures
(a) Equally weighted market model (b) Value-weighted market model (1) (2) (3) (1) (2) (3)
Notes: The table above contains the results from the Fama-MacBeth regressions specified in Equation (8). Reported coefficients are time-series averages of daily cross-sectional regression coefficients, with corresponding Newey-West t-statistics reported in parentheses. The dependent variable is the first-difference of firm-specific return variation, ΔFSRV, where FSRV is calculated from daily R-squared statistics from the intraday market model regression using an (a) equally weighted and (b) value-weighted market portfolio in Equation (6), respectively. Each column reports the results from using first-differences of one of the DPIN measures in the paper (see Table 1 for definitions of the DPIN measures). The variable ΔVOL is the daily change in volume and ΔILL is the daily change in the Amihud (2002) illiquidity measure. Rest as in Table 3. *** Denotes statistical significance at the 1% level. ** Denotes statistical significance at the 5% level. * Denotes statistical significance at the 10% level.
32
Table 5 Results from Fama-MacBeth regressions of demeaned firm-specific return variation on demeaned DPIN measures
(a) Equally weighted market model (b) Value-weighted market model (1) (2) (3) (1) (2) (3) ~BASEDPIN 0.460*** 0.025***
Notes: The table above contains the results from the Fama-MacBeth regressions specified in Equation (9). Reported coefficients are time-series averages of daily cross-sectional regression coefficients, with corresponding Newey-West t-statistics reported in parentheses. The dependent variable is the time-demeaned firm-specific return variation, ~FSRV , where FSRV is calculated from daily R-squared statistics from the intraday market model regression using an (a) equally weighted and (b) value-weighted market portfolio in Equation (6), respectively. The variable ~VOL is demeaned volume, ~ILL is the demeaned Amihud (2002) illiquidity measure, and ~SIZE is demeaned firm size and ~PRC is demeaned price. Rest as in Table 3. ***, **, and * denote statistical significance at the 1%, 5%, and 10% levels, respectively.
33
Table 6: Results from Fama-MacBeth regressions for testing for reverse causality
Notes: The table above contains the results from the Fama-MacBeth regressions with the DPIN measures as dependent variables and lagged firm-specific return variation, ΔFSRV , as an independent variable. Reported coefficients are time-series averages of daily cross-sectional regression coefficients, with corresponding Newey-West t-statistics reported in parentheses. The vector of controls includes ΔVOL and ΔILL, along with one lag of each (results of these are not reported but available upon request). Rest as in Table 3(a) and 4(a). ***, **, and * denote statistical significance at the 1%, 5%, and 10% levels, respectively.
34
Figure 1: Yearly cross-sectional average DPIN measures over time
0
0.2
0.4
0.6
0.8
1
1993 1995 1997 1999 2001 2003 2005 2007
Year
DPIN
DPIN_BASE
DPIN_DISP
DPIN_SIZE
Notes: The figure above shows yearly cross-sectional average DPIN measures for each year from 1993 to 2008. Variable definitions as in Table 1.
35
Figure 2: Distribution of intraday DPIN measures across stocks
DPIN_SIZE_Med Notes: The figures above show the distributions of the average intraday DPIN measures across all stocks (i.e., the histogram frequency represents proportion of stocks with a given average DPIN measure). Rest as in Table 1.
36
Figure 3: Intraday average DPIN measures across all stocks and trading days
Notes: The figure above shows the intraday pattern of the various DPIN measures across 26 15-minute intervals throughout the trading day. Each point corresponds to an average DPIN measure across all stocks and trading days for the given 15-minute interval. Each point is reported in proportion to the average DPIN measure calculated across the 26 15-minute intervals. Rest is as in Table 1.
37
Figure 4: Intraday average DPIN measures conditioned on large trades for various subperiods
Notes: The figure above shows the evolution of the intraday pattern of the DPINSIZE measure over four four-year subperiods: 1993-96, 1997-2000, 2001-04, and 2005-08. Rest as in Figure 3.
38
Figure 5: Intraday average DPIN measures across all stocks and trading days, conditioned on small trade size
Notes: The figure in panel (a) above shows the intraday pattern of DPINSMALL, which is conditioned on small trade size as in Equation (5), across 26 15-minute intervals throughout the trading day. Each point corresponds to the average across all stocks and trading days for the given 15-minute interval. Each point is reported in proportion to the average calculated across the 26 15-minute intervals. The figure in panel (b) shows the evolution of the intraday pattern of DPINSMALL over four four-year subperiods: 1993-96, 1997-2000, 2001-04, and 2005-08.