A Dynamic Mesh-Based Approach to Model Melting and Shape of an ESR Electrode E. KARIMI-SIBAKI, A. KHARICHA, J. BOHACEK, M. WU, and A. LUDWIG This paper presents a numerical method to investigate the shape of tip and melt rate of an electrode during electroslag remelting process. The interactions between flow, temperature, and electromagnetic fields are taken into account. A dynamic mesh-based approach is employed to model the dynamic formation of the shape of electrode tip. The effect of slag properties such as thermal and electrical conductivities on the melt rate and electrode immersion depth is dis- cussed. The thermal conductivity of slag has a dominant influence on the heat transfer in the system, hence on melt rate of electrode. The melt rate decreases with increasing thermal con- ductivity of slag. The electrical conductivity of slag governs the electric current path that in turn influences flow and temperature fields. The melting of electrode is a quite unstable process due to the complex interaction between the melt rate, immersion depth, and shape of electrode tip. Therefore, a numerical adaptation of electrode position in the slag has been implemented in order to achieve steady state melting. In fact, the melt rate, immersion depth, and shape of electrode tip are interdependent parameters of process. The generated power in the system is found to be dependent on both immersion depth and shape of electrode tip. In other words, the same amount of power was generated for the systems where the shapes of tip and immersion depth were different. Furthermore, it was observed that the shape of electrode tip is very similar for the systems running with the same ratio of power generation to melt rate. Comparison between simulations and experimental results was made to verify the numerical model. DOI: 10.1007/s11663-015-0384-0 Ó The Minerals, Metals & Materials Society and ASM International 2015 I. INTRODUCTION THE electroslag remelting (ESR) process is used for manufacture of premium-grade steel and super alloys such as Ni-based or titanium alloys. The Joule heating released within the molten slag layer is used to melt a consumable electrode. The departed melt droplets from the tip of electrode pass through the slag and reach the liquid melt pool. The melt pool solidifies finally in a water-cooled mold to build the high-grade, with mini- mum defect and segregation ingot. [1] Generally, the quality of the ingot is characterized by the surface and internal quality, which depends highly on the shape of melt pool, i.e., the depth and thickness of mushy zone. The desired outcome of the ESR process is a shallow melt pool that promotes unidirectional (upwards) solid- ification of the ingot and subsequent formation of segregation-minimal alloy. [2] In addition, ingots with good surface quality can be directly forged after the ESR process. The expensive process of surface machin- ing is not required for ESR ingots with smooth surfaces. [3] The remelting parameters of the ESR process such as melt rate and immersion depth can significantly influ- ence the quality of the final ingot. The influence of melt rate of the electrode on the melt pool depth was investigated by Holzgruber. [4] It was found that the melt pool becomes deeper with the increase of melt rate. In addition, Mitchell [5] studied the effect of melt rate on the pool profile and the thickness of mushy zone for an ESR ingot. The depth of melt pool and thickness of the mushy zone were found to increase when the process was run with higher melt rate. On the other hand, a relatively smooth ingot surface can be obtained with higher melting rate as reported by Suarez et al. [6] Furthermore, it is believed that maintaining a constant shallow immersion depth of the electrode leads to producing superior quality ingots. [7] As stated by Kharicha et al., [8] the surface quality of ingot is significantly influenced by distribution of mold current in the process that in turn depends on the electrode immersion depth. As a consequence, the improper control of immersion depth can severely influence the compositional homo- geneity and grain structure of the solidified ingot. Currently, there is no system or method for the direct measurement of the melt rate and immersion depth of electrode. Practically, the immersion depth is controlled E. KARIMI-SIBAKI, Ph.D. Student, is with the Christian Doppler Laboratory for Advanced Process Simulation of Solidification and Melting, University of Leoben, Leoben, Austria. A. KHARICHA, Senior Scientist, and M. WU, Associate Professor, are with the Christian Doppler Laboratory for Advanced Process Simulation of Solidification and Melting, University of Leoben, and also with the Chair of Simulation and Modeling of Metallurgical Processes University of Leoben. Contact e-mail: abdellah.kharicha@unileoben. ac.at J. BOHACEK, Postdoctoral Researcher, and A. LUDWIG, Professor, are with the Chair of Simulation and Modeling of Metallurgical Processes University of Leoben. Manuscript submitted December 3, 2014. Article published online June 11, 2015. METALLURGICAL AND MATERIALS TRANSACTIONS B VOLUME 46B, OCTOBER 2015—2049
Transcript
A Dynamic Mesh-Based Approach to Model Meltingand Shape of an ESR Electrode
E. KARIMI-SIBAKI, A. KHARICHA, J. BOHACEK, M. WU, and A. LUDWIG
This paper presents a numerical method to investigate the shape of tip and melt rate of anelectrode during electroslag remelting process. The interactions between flow, temperature, andelectromagnetic fields are taken into account. A dynamic mesh-based approach is employed tomodel the dynamic formation of the shape of electrode tip. The effect of slag properties such asthermal and electrical conductivities on the melt rate and electrode immersion depth is dis-cussed. The thermal conductivity of slag has a dominant influence on the heat transfer in thesystem, hence on melt rate of electrode. The melt rate decreases with increasing thermal con-ductivity of slag. The electrical conductivity of slag governs the electric current path that in turninfluences flow and temperature fields. The melting of electrode is a quite unstable process dueto the complex interaction between the melt rate, immersion depth, and shape of electrode tip.Therefore, a numerical adaptation of electrode position in the slag has been implemented inorder to achieve steady state melting. In fact, the melt rate, immersion depth, and shape ofelectrode tip are interdependent parameters of process. The generated power in the system isfound to be dependent on both immersion depth and shape of electrode tip. In other words, thesame amount of power was generated for the systems where the shapes of tip and immersiondepth were different. Furthermore, it was observed that the shape of electrode tip is very similarfor the systems running with the same ratio of power generation to melt rate. Comparisonbetween simulations and experimental results was made to verify the numerical model.
DOI: 10.1007/s11663-015-0384-0� The Minerals, Metals & Materials Society and ASM International 2015
I. INTRODUCTION
THE electroslag remelting (ESR) process is used formanufacture of premium-grade steel and super alloyssuch as Ni-based or titanium alloys. The Joule heatingreleased within the molten slag layer is used to melt aconsumable electrode. The departed melt droplets fromthe tip of electrode pass through the slag and reach theliquid melt pool. The melt pool solidifies finally in awater-cooled mold to build the high-grade, with mini-mum defect and segregation ingot.[1] Generally, thequality of the ingot is characterized by the surface andinternal quality, which depends highly on the shape ofmelt pool, i.e., the depth and thickness of mushy zone.The desired outcome of the ESR process is a shallowmelt pool that promotes unidirectional (upwards) solid-ification of the ingot and subsequent formation ofsegregation-minimal alloy.[2] In addition, ingots with
good surface quality can be directly forged after theESR process. The expensive process of surface machin-ing is not required for ESR ingots with smoothsurfaces.[3]
The remelting parameters of the ESR process such asmelt rate and immersion depth can significantly influ-ence the quality of the final ingot. The influence of meltrate of the electrode on the melt pool depth wasinvestigated by Holzgruber.[4] It was found that themelt pool becomes deeper with the increase of melt rate.In addition, Mitchell[5] studied the effect of melt rate onthe pool profile and the thickness of mushy zone for anESR ingot. The depth of melt pool and thickness of themushy zone were found to increase when the processwas run with higher melt rate. On the other hand, arelatively smooth ingot surface can be obtained withhigher melting rate as reported by Suarez et al.[6]
Furthermore, it is believed that maintaining a constantshallow immersion depth of the electrode leads toproducing superior quality ingots.[7] As stated byKharicha et al.,[8] the surface quality of ingot issignificantly influenced by distribution of mold currentin the process that in turn depends on the electrodeimmersion depth.As a consequence, the improper control of immersion
depth can severely influence the compositional homo-geneity and grain structure of the solidified ingot.Currently, there is no system or method for the directmeasurement of the melt rate and immersion depth ofelectrode. Practically, the immersion depth is controlled
E. KARIMI-SIBAKI, Ph.D. Student, is with the Christian DopplerLaboratory for Advanced Process Simulation of Solidification andMelting, University of Leoben, Leoben, Austria. A. KHARICHA,Senior Scientist, and M. WU, Associate Professor, are with theChristian Doppler Laboratory for Advanced Process Simulation ofSolidification and Melting, University of Leoben, and also with theChair of Simulation and Modeling of Metallurgical ProcessesUniversity of Leoben. Contact e-mail: [email protected] J. BOHACEK, Postdoctoral Researcher, and A. LUDWIG,Professor, are with the Chair of Simulation and Modeling ofMetallurgical Processes University of Leoben.
Manuscript submitted December 3, 2014.Article published online June 11, 2015.
METALLURGICAL AND MATERIALS TRANSACTIONS B VOLUME 46B, OCTOBER 2015—2049
based on the variation of impedance or voltage (voltageswing) during the process.[9–12] In this way, the increaseof impedance swing is quantitatively related to theimmersion depth. However, fluctuations of immersiondepth are observed over the standard swing controller inmany instances during the process. Therefore, themeasurement precision of the actual immersion depthis questionable.
During the ESR process, a massive amount of heatgenerated in the slag is lost through radiation and moldcooling. Only a small portion of power is supplied tomelt the electrode. Over the last decades, attempts havebeen made to investigate the temperature profile,immersion depth, melt rate, and the shape of electrode.The effects of input power and electrode polarity on themelt rate and shape of the electrode tip were experi-mentally investigated by Maulvault.[13] It is reportedthat increasing the input power leads to higher meltingspeed and subsequently to a flattening of electrode tip.Mitchell et al.[14] proposed a two-dimensional model tostudy the heat balance across the electrode. The immer-sion depth is taken into account to compute the steadystate temperature profile of the electrode. In addition,the electrode temperature gradient was experimentallymeasured for a laboratory scale ESR process. Themodel agreed successfully with the experimental results.A one-dimensional analytical model was developed byMendrykowski et al.[15] to study the heat transfer aboveand below the slag level. Their computed results suggestthat thermal radiation is negligible in comparison to theheat conduction along the electrode. A good agreementis observed between the calculated and measured tem-perature profile within the electrode. Kishida et al.[16]
reported the relationship between the immersion depth,shape of the electrode tip, and voltage drop for a smallscale ESR process. They found that with the increase ofvoltage, the immersion depth decreases and the shape ofthe electrode tip becomes flatter. Tacke and Schwerdt-feger[17] used a two-dimensional numerical model tocompute the temperature, pool profile, and immersiondepth for a laboratory scale ESR electrode. An approx-imation formula for the immersion depth was proposedand validated against experiments.
Jardy et al.[18] modeled the ESR process to evaluatethermal fluxes through boundaries. Their model pre-dicted the highest melt rate for the case where thebuoyance force is stronger than electromagnetic force.Yanke et al.[19] predicted melting behavior of anindustrial ESR process using an effective heat transfercoefficient between electrode and slag. Their results werefairly similar to measured data.
Recently, Kharicha et al.[20] directly simulated themelting of electrode using the multiphase volume offluid (VOF) method considering complex interactionsbetween flow, temperature, and magnetic fields. It isfound that the coupling between the Joule heat releaseand melting rate is very unstable. Furthermore, it isshown that the stability in simulation can be achievedonly by including a numerical adaptation on immersiondepth and feeding velocity of electrode. Within theframework of the multiphase model, details of processconditions such as temperature, velocity, and magnetic
force can be captured. However, the method used in thisinvestigation is computationally expensive.It is generally recognized that the electric current is
conducted by ions in the slag region.[21] The melt ratewas reported to be dependent on electrode polarity.During DC ESR process, smaller current is required forelectrode positive in comparison to electrode negative toachieve the same melt rate, even though the voltage iskept unchanged.[22] The highest specific melt rate isobtained using positive polarity for electrodes contain-ing high oxide concentrations (>10 wt pct) due to theincrease of electrochemical polarization overpotential atelectrode tip–slag interface.[21] There are other phenom-ena that can influence the amount of supplied heat toelectrode tip and consequently melt rate. For instance, athin liquid film is formed related to formation anddeparture of droplets at electrode tip during remelting.Furthermore, droplets drip through the slag and theyintensify turbulence under the electrode tip. As aconsequence of strong turbulence, reaction rate andheat transfer between the remelting electrode and slagare enhanced.[23,24]
The present model is an extension of electromagneticmodel developed by Kharicha for ESR process.[12,20]
Here, a dynamic mesh-based approach is used to predictthe shape and melt rate of the electrode. The method isrobust and computationally efficient. Effects of electro-chemical polarization overpotential, formation of liquidfilm near the electrode tip, and dripping of droplets inslag bath are not included in the current model.Solidification of liquid metal in melt pool is ignored.Simulations considering different electric current paths(with and without mold current) are performed andcompared. Furthermore, the influence of electric con-ductivity and molecular thermal conductivity of slag onthe melt rate and shape of electrode tip are investigated.Experimental results of Tacke and Schwerdtfeger[17] areused to evaluate the current model.
II. MODELING
The commercial CFD software, FLUENT-ANSYSv.14.5, is used with a finite volume approach to simulatethe fluid flow, heat transfer, and electromagnetic fields.The software includes a dynamic mesh technique for thesimulation of displacements of boundaries. The requiredmodeling equations for boundaries (stationary andmoving) and fields (e.g., electromagnetic field) areimplemented using user-defined functions (UDF). Tran-sient calculation is made to predict the evolution ofshape of electrode tip. The induced magnetic field isdominantly azimuthal and the process conditions areassumed to be mainly axisymmetric;[25] thus, a 2Daxisymmetric computational domain is considered.Configuration of the computational domain and bound-aries are schematically illustrated in Figure 1(a).
A. Governing Equations
The computational domain includes zones of air,electrode, slag, melt pool, and mold. Each zone is
2050—VOLUME 46B, OCTOBER 2015 METALLURGICAL AND MATERIALS TRANSACTIONS B
treated separately. However, the transport phenomenaat interfaces such as momentum or heat transfer aretaken into account. The interface between zones can berigid, deforming, moving, or stationary. The governingequations and the boundary conditions are introducedin the following sections. A summary of thermal andelectrical boundary conditions is given in Table I.
1. Electromagnetic fieldThe A–/ formulation is used to calculate the electro-
magnetic field,[20] where / denotes the electric scalarpotential and ~A is the magnetic vector potential. Themethod is computationally more expensive in compar-ison to the common approach based on electromagnetic
induction equation (Bh), but the A–/ formulation is veryrobust and accurate for solving electromagnetic field inthe presence of moving boundaries. In addition, it caneffectively model the current path including moldcurrent and eddy current. The electric scalar potentialis obtained by solving the conservation equation ofelectric current:
r �~j ¼ 0: ½1�
The treatment of current density (~j) includes twoparts:
~j ¼ �r ru� r@~A
@t: ½2�
First, the imposed current is computed as a functionof electric conductivity of material (r) and electric scalarpotential. The second term includes the effect of eddycurrents generated in the process. Note that, theunsteady term in the right-hand side of Eq. [2] can beomitted when the process approaches steady state and adirect current (DC) is applied.The magnetic field (~B) is calculated by solving the
equation of magnetic vector potential that is expressedas
r� 1
l0r� ~A
� �¼~j; ½3�
(a) (b)
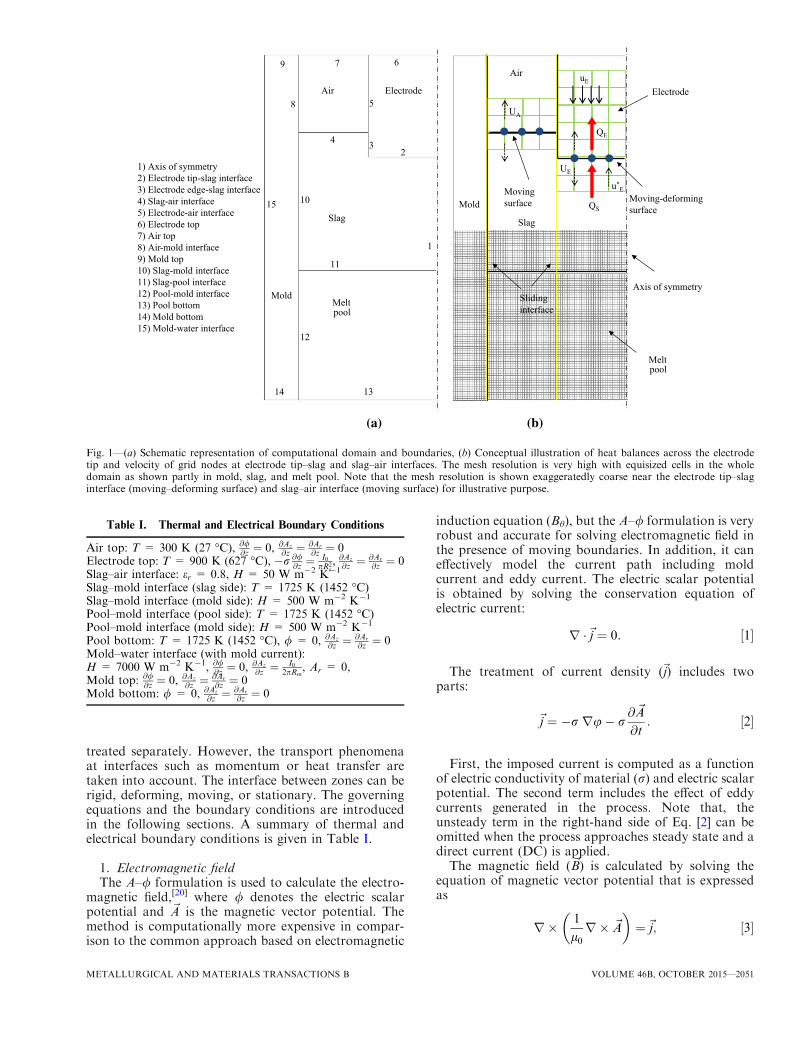
1) Axis of symmetry2) Electrode tip-slag interface3) Electrode edge-slag interface4) Slag-air interface5) Electrode-air interface6) Electrode top7) Air top 8) Air-mold interface9) Mold top10) Slag-mold interface11) Slag-pool interface12) Pool-mold interface13) Pool bottom14) Mold bottom15) Mold-water interface
Slag
Electrode
Mold
Air
Meltpool
1
234
7
8
10
12
5
69
11
1314
15
Electrode
Slag
QS
QE
uE
UE
UA
Mold
Air
Meltpool
u*EMoving
surface Moving-deformingsurface
Axis of symmetrySlidinginterface
Fig. 1—(a) Schematic representation of computational domain and boundaries, (b) Conceptual illustration of heat balances across the electrodetip and velocity of grid nodes at electrode tip–slag and slag–air interfaces. The mesh resolution is very high with equisized cells in the wholedomain as shown partly in mold, slag, and melt pool. Note that the mesh resolution is shown exaggeratedly coarse near the electrode tip–slaginterface (moving–deforming surface) and slag–air interface (moving surface) for illustrative purpose.
Table I. Thermal and Electrical Boundary Conditions
Air top: T = 300 K (27 �C), @/@z ¼ 0, @Az
@z ¼ @Ar
@z ¼ 0Electrode top: T = 900 K (627 �C), �r @/
@z ¼I0pR2
e, @Az
@z ¼ @Ar
@z ¼ 0Slag–air interface: er = 0.8, H = 50 W m�2 K�1
Slag–mold interface (slag side): T = 1725 K (1452 �C)Slag–mold interface (mold side): H = 500 W m�2 K�1
Pool–mold interface (pool side): T = 1725 K (1452 �C)Pool–mold interface (mold side): H = 500 W m�2 K�1
METALLURGICAL AND MATERIALS TRANSACTIONS B VOLUME 46B, OCTOBER 2015—2051
r� ~A ¼ ~B: ½4�
Note that, to obtain a unique solution for Eq. [3], theCoulomb gauge (r � ~A ¼ 0) is used.[26] Additionally, thedisplacement currents are ignored and the magneticpermeability (l0) is assumed to be constant (4p 910�7 J m�1 A�2). Finally, the Joule heating (Q) andLorentz force (~FL) are computed and added as sourceterms to the energy and momentum conservationequations, respectively.
Q ¼ *j
��� ���2r
; ½5�
~FL ¼~j� ~B: ½6�
The required boundary conditions for electric scalarpotential and magnetic vector potential (axial and radialcomponents) are obtained from Eqs. [2] and [4]. Amagnetic induction flux of zero is used at the bottomboundaries (mold and pool) and top boundaries (air,mold, and electrode). Additionally, a value of zero isapplied for electric scalar potential at the bottomboundaries. However, an electric potential flux of zerois used at top boundaries (air and mold) except electrodetop where the flux of electric potential is prescribed. Theelectric scalar potential is treated similar to the mold topboundary at mold–water interface where axial compo-nent of magnetic induction flux is prescribed. The lattertakes the value zero for the radial component ofmagnetic vector potential. Furthermore, continuity ofelectric and magnetic potentials is applied at thefollowing interfaces: electrode tip–slag, electrode edge–slag, electrode–air, air–mold, slag–air, slag–mold, slag–pool, and pool–mold. It should be stated that theelectric current is allowed to cross the slag skin enteringinto the mold (mold current). In the case of insulatingmold (without mold current), the slag–mold, air–mold,and pool–mold interfaces take similar boundary condi-tions as mold–water interface.
2. Temperature fieldThe temperature field is obtained by solving an
enthalpy (h) conservation equation:
@
@tðqhÞ þ r � ðq~uhÞ ¼ r � ðkrTÞ þQ� SLH; ½7�
where q is the density, ~u the velocity, and k the effectivethermal conductivity including the effect of turbulence.SLH denotes the energy sink required to melt theelectrode in the vicinity of electrode tip, and it is furtherdescribed in Section II–C.
A combined radiation–convection condition is ap-plied to model the heat transfer between electrode andair, and between slag and air, where a value of 0.8 isused for emissivity. At the top boundaries, the temper-ature is fixed: 300 K (27 �C) at mold and air top, and900 K (627 �C) at electrode top. The latter is calculated
based on the electrode feeding velocity and distancefrom the electrode tip.[20] In addition, temperature isfixed at the slag liquidus temperature that is 1725 K(1452 �C) at the following interfaces: slag–mold (slagside) and pool–mold (melt pool side). Assuming aconstant thickness of solidified slag skin layer (1 mm),the heat conduction through the slag skin at slag–mold(mold side) and pool–mold (mold side) interfaces istaken into account. The cooling condition at mold–water interface is modeled using a constant convectiveheat transfer coefficient (7000 W m�2 K�1). The re-stricted maximum allowable temperature at electrodetip–slag and electrode edge–slag interfaces is the meltingtemperature of the alloy. In addition, the two sides ofthe wall at slag–pool interface are thermally coupled.
3. Turbulent flow fieldThe continuity and momentum equations are solved:
@q@t
þr � ðq~uÞ ¼ 0; ½8�
@
@tq~uð Þ þ r � q~u~uð Þ ¼ �rpþr � l r~uþr~uT
� �� �þ q0~gb T� T0ð Þ þ ~FL;
½9�
where p is the pressure, l the dynamic viscosity, ~g thegravity, b the thermal expansion coefficient, and q0 andT0 are reference density and reference temperature,respectively. Boussinesq approximation is consideredfor the thermal convection in the slag region.Non-slip boundary condition is applied at electrode
edge–slag, electrode tip–slag, and slag–pool interfaces.Additionally, a free-slip condition is applied for theinterfaces of slag–air, slag–mold, and pool–mold. Noflow calculation is made in the air zone. Treatment ofvelocity inside the electrode will be discussed in Sec-tion II–D.The turbulence is considered using the shear stress
transport model (SST). The model is known to effec-tively blend the precision and robustness of k–x modelin the near-wall region with the bulk liquid k–emodelingin far field. One of the essential features of SST model isan accurate and effective near-wall treatment. Themodel is insensitive to the grid spacing of the near-wallcells.[27] In fact, the model automatically shifts from low-Re formulation to wall functions based on the near-wallgrid resolution. A comprehensive description of themodel was given by Menter.[28,29]
B. Dynamic Mesh
Displacement of domain boundaries can be modeledusing dynamic and deformable meshes in which themesh nodes are adjusted to new locations. In order toapply this technique, all governing conservation equa-tions must be modified according to the velocity of thegrid boundaries (~ug).
[30] The integral form of the generalconservation equation for an arbitrary variable (n) withrespect to the dynamic meshes is expressed as
2052—VOLUME 46B, OCTOBER 2015 METALLURGICAL AND MATERIALS TRANSACTIONS B
@
@t
ZV
qndVþZX
qnð~u�~ugÞ �d~S¼ZX
Crn �d~SþZV
SndV;
½10�
where X represents the boundary of the control volume(V), ~S is the area vector, C denotes the diffusioncoefficient, and Sn is the source term.
The unsteady term in Eq. [10] must take into accountthe variation of cell sizes during the simulation ofmoving boundaries.[31] It can also be computed usingthe grid velocity:
@V
@t¼
ZX
~ug � d~S ¼Xnfj
~ug;j � ~Sj; ½11�
where nf is the number of faces on the control volume,~ug;jthe velocity, and ~Sj is the area vector of j face.
A number of dynamic mesh schemes are available tohandle the boundary motion that categorize into layer-ing, re-meshing, and smoothing techniques. In thepresent study, layering and smoothing techniques areemployed to simulate the motion of the boundaries.Essentially, layering technique involves creation anddestruction of cell rows in the vicinity of a movingboundary. Layers of cells are added or removed basedon a prescribed cell height (hideal) that is in the sameorder of magnitude as the cell size. The layer of cell nearto the moving boundary is allowed to expand orcompress if the following condition is fulfilled:(1+ as)hideal< hmin for expansion and hmin< achidealfor compression. Here, hmin is the minimum cell heightof the neighboring layer, and as and ac are the user-defined split and collapse factors, respectively. Themethod can be applied only for structured grid when themotion is purely linear like the motion of a piston in acylinder.
On the other hand, the smoothing technique is notrestricted to structured mesh. The nodes can be reposi-tioned but the connectivity remains unchanged. Addition-ally, they are considered as a network of interconnectedsprings in which positions of interior nodes are updatedbased on displacements of boundary nodes. The diffusion-based smoothing method to model the mesh motion isgoverned by the following equation:
r � 1
dar~ug
� �¼ 0; ½12�
where d stands for a normalized boundary distance anda is a positive arbitrary input parameter. Note that,quality of the mesh can be better preserved by increasingthe diffusivity coefficient (1/da). Thus, a value of zero isrecommended for a to reduce the mesh motion awayfrom the moving boundary.[30]
The configuration of the dynamic mesh boundaries isillustrated in Figure 1(b). In our computational domain,the mesh has two dynamic boundaries: slag–air (mov-ing) and electrode tip–slag (moving–deforming). Themoving boundaries are interior faces; thus, slidinginterfaces are required to allow the relative motion
between adjacent grids.[30] Geometrical data of dynamicmesh parameters are listed in Table II.
C. Melting of Electrode Tip
Both the temperature field of electrode and velocity ofmelting electrode tip are unknown. Generally, an alloysolidifies and develops a dendritic mushy zone. How-ever, no dendrites were observed during melting. Thus,the liquid–solid interface is assumed to remain smoothduring melting. Therefore, the melting of the electrode isconsidered as a Stefan problem where a phase boundarycan move with time.[32,33] Here, a dynamic mesh-basedapproach is proposed to capture the shape of theelectrode tip. A set of balance equations are solved tocompute the velocity of grid nodes at the electrode tip.As shown in Figure 1(b), the heat balance across theelectrode tip determines the velocity of the grid nodes(UE). The following equations and conditions describethe melting velocity of electrode tip:
QS �QE ¼ qmetalDHu�E; ½13�
u�E � 0 QS>QEð Þu�E<0 QS<QEð Þ
(; ½14�
UE ¼ uE þ u�E: ½15�
According to Eq. [15], the time-dependent grid nodevelocity of the electrode tip is the sum of melting velocity(uE
* ) and the electrode feeding velocity (uE). The origin ofx-referential is fixed at the bottom of computationaldomain. Consequently, the sign (positive or negative) ofmelting velocity depends on the balance of the heatfluxes at the electrode tip, Eq. [14]. According to Eq.[13], the melting velocity is dependent on the heat fluxprovided to electrode (QS), heat flux diffused into theelectrode (QE), density of metal (qmetal), and latent heatof fusion (DH). Note that the right-hand side of Eq. [13]describes the energy sink term (SLH) provided to meltthe electrode. The following equation expresses thevolumetric source of latent heat that is absorbed in thevicinity of electrode tip.
SLH ¼ qmetalu�EDH
Scell�electrode
Vcell�electrode
� �; ½16�
Table II. Geometrical Data of Mesh and Dynamic Mesh
METALLURGICAL AND MATERIALS TRANSACTIONS B VOLUME 46B, OCTOBER 2015—2053
where Scell-electrode is the face area of a cell which belongsto the electrode tip and Vcell-electrode is the cell volume.
D. Electrode Immersion Depth
Ideally, the electrode feeding velocity is constantduring operation of the ESR process. However, thefeeding velocity must be adapted in the simulation dueto melting instabilities so that the electrode tip neitherreaches the melt pool nor the slag-free surface.[20] Theelectrode feeding velocity is adapted based on the initialfeeding velocity (u0E) and immersion depth (l) as given byEq. [17].
uE ¼ u0Emin 1;lmax � l
lmax � lmin
� �: ½17�
The immersion depth is bounded between lmin andlmax, and both are input parameters. As such, theelectrode penetration depth is limited to lmax. Note that,the uniform velocity field inside the electrode zone isspecified that has the magnitude equal to the electrodefeeding velocity (uE).
Transient simulation is performed until a steady stateis reached when the velocity of the grid nodes (UE)becomes zero. The melt rate ( _m � 0) of the electrode canbe estimated as
_m ¼ �qmetal
ZZSelectrode
~u�E � d~S; ½18�
where Selectrode is the tip area of electrode.With the increase of electrode immersion depth, the
slag level rises since the total mass of slag must beconserved. The latter is modeled by considering aconstant velocity for the grid nodes at slag–air interface.The velocity of slag–air interface (UA) is computed as
UA ¼ m0 �m
qslagDt Smold � Selectrodeð Þ ; ½19�
where m0 is the initial mass of slag, m the computedmass, qslag density of slag, Dt time step size, and Smold
denotes the cross-sectional area of mold. Note that, thegrid node velocity (UE) weakly fluctuates around zeroonce the process reaches the steady state.
E. Simulation Setup
The physical properties of the materials are listed inTable III. The shape of electrode tip is mainly governedby the thermal field and flow in the slag region; hence,the electrical and thermal properties of slag play animportant role. The slag has the following composition:40 pct CaF2, 30 pct CaO, 30 pct Al2O3.
[17] The electricor thermal conductivities of the slag are temperaturedependent,[34] but due to the difficulty of the measure-ment, a large uncertainty of the properties exists. Theelectric conductivity of conventional slags in liquid statewas reported to vary between 80 and 300 X�1 m�1.[35]
The electric conductivity of the slag in solid state is even
unknown. The solidified slag skin layer formed on themold wall is assumed to be a perfectly electricalinsulator in most of simulations found in the litera-ture.[25,36,37] On the other hand, it is observed thatconsiderable amount of current can cross the solid slagskin (mold current) entering into the mold despite lowelectric conductivity of the layer.[22,38–45] Simulationsconsidering different current paths are performed anddetails of analyses are given in next section. The rate ofheat transfer between molten slag and mold, air, orelectrode is governed by thermal conductivity. The lattersignificantly influences the temperature field in theprocess. Approximate values for thermal conductivityof CaF2-based slags at elevated temperatures arereported to be between 0.5 and 5 W m�1 K�1.[46]
Therefore, parameter studies by varying the thermalconductivity of slag are also made. Table IV describesconditions for parameter studies.Tacke and Schwerdtfeger conducted a series of
experiments to investigate the influence of operationparameters on the shape of electrode tip for a laboratoryscale ESR process.[17] Here, we use the identical geom-etry for the simulations, and compare the simulationresults with one of their experiments (Table V).
III. RESULTS
A. Transient Melting of Electrode
Here, the capability of model to capture the shape ofelectrode during remelting is demonstrated. Transient
2054—VOLUME 46B, OCTOBER 2015 METALLURGICAL AND MATERIALS TRANSACTIONS B
behavior of process for one case study (Case I) isdiscussed in details considering interactions betweenflow field, temperature field, electromagnetic field, andshape of electrode. The evolution of electrode shape aswell as electric potential, temperature, and velocity fieldsare illustrated in Figure 2. Additionally, the meshresolution near moving–deforming boundary (electrodetip–slag interface) is shown. The magnitude of voltagedrop and subsequently power generation is stronglydependent on immersion depth of electrode (maximumdistance between electrode tip and slag–air interface). Asa result of higher voltage drop at lower immersiondepth, the power generation increases in the system.Consequently, the temperature rises in the slag at lowimmersion depth as shown in Figure 2(c). Furthermore,the velocity is increased under the shadow of electrodeat higher immersion depth as shown in Figures 2(d)through (f). The current density increases at largerimmersion depth under the electrode that intensifies theLorentz force. Thus, the velocity becomes higher incentral region of slag where stirring is promoted and thetemperature field is relatively uniform.
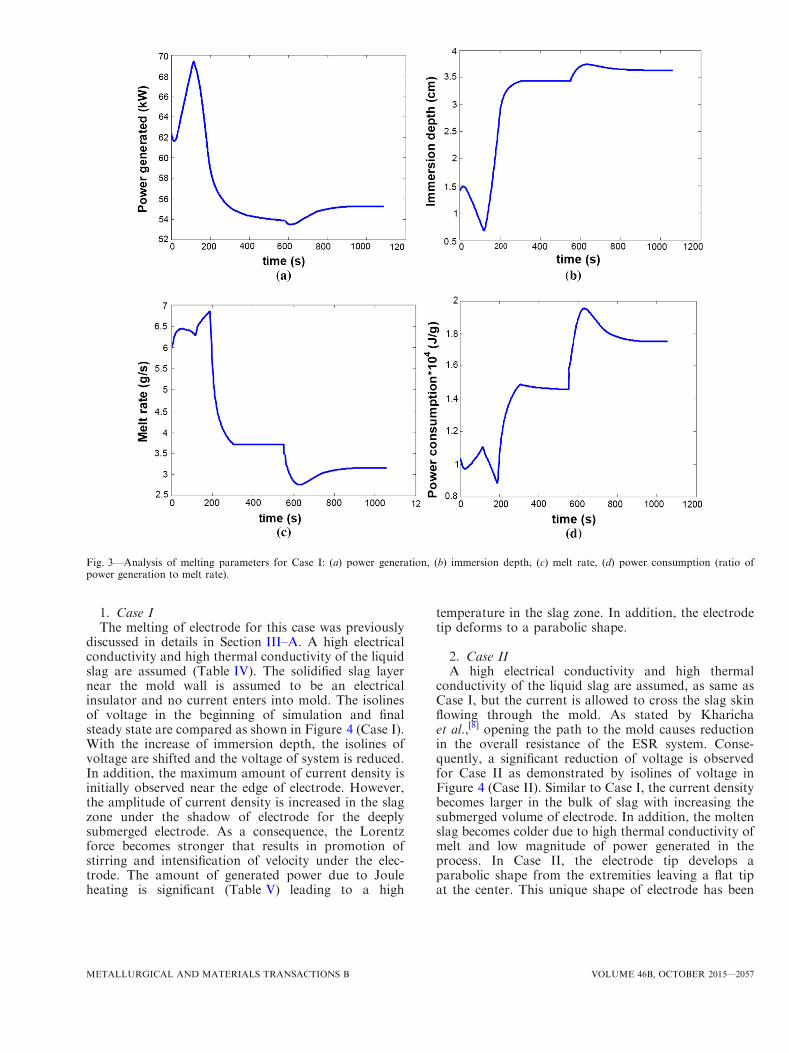
We have previously found that the coupling betweenmelt rate and power generation due to Joule heating isvery unstable.[20] This fact is verified in this study again.As shown in Figure 3(d), the ratio of the powergeneration to melt rate, called power consumption,changes during the whole remelting process. In additionto that the immersion depth, melt rate, and power
generation are also plotted in Figures 3(a) through (c).The results reveal that variation in power is muchgentler than the variation of melt rate. In other words,the melt rate can change dramatically although thepower generation remains relatively stable before reach-ing the steady state (>900 seconds). Furthermore, thepeak is observed in the power generation when theimmersion depth becomes very shallow, Figure 3(a).Essentially, power generation and immersion depthoppose each other as shown in Figures 3 (a) and (b).In other words, the power generation is higher at lowerimmersion depth and vice versa.In summary, the model enables us to study the
dynamic interactions between velocity field, temperaturefield, electromagnetic field, and shape of electrode tipduring remelting. Additionally, melting parameters suchas melt rate, immersion depth, power generation, andpower consumption can be directly computed.
B. Parameter Studies
Four cases are simulated (Table IV). Following theexperiment[17], a DC current is imposed and keptconstant. The initial feeding velocity of the electrode(not reported for the experiment) is assumed and keptunchanged for all simulation cases. Note that twoextreme cases might occur when an improper feedingvelocity is applied. One is that the electrode tip mighttotally leave out of the slag during operation when a
Table IV. Conditions of Parameter Studies
Slag ElectricConductivity,
Liquid (ohm�1 m�1)
Slag ThermalConductivity,
Liquid (W m�1 K�1)MoldCurrent
Case I 250 5 noCase II 250 5 yesCase III 170 1.5 yesCase IV 170 5 yes
Table V. Operation conditions and results of a laboratory scale ESR process,[17] and comparison with simulations (steady state)
METALLURGICAL AND MATERIALS TRANSACTIONS B VOLUME 46B, OCTOBER 2015—2055
very low feeding velocity is applied for a case with largemelt rate. The another extreme case is that the electrodetip might touch the slag–pool interface when very highfeeding velocity is applied for a case of low melt rate,which leads to an electrical shortcut between theelectrode tip and molten metal pool. Therefore, thefeeding velocity of the electrode must be adjustedaccording to Eq. [17] to avoid the aforementionedundesirable extreme cases. In the operation, the initialfeeding velocity is unknown, but the feeding velocity at
steady state is known. The steady state feeding velocitywas extracted from the simulations for the case studies.In addition, the melt rate is calculated using Eq. [18].The amplitude of voltage and power depends on thecurrent density and shape of the tip that are reported atthe steady state. A summary of case studies at the initialand steady states are shown in Figures 4 and 5. Inaddition, temperature, velocity, voltage, and currentdensity fields including the submerged part of electrodein slag zone are provided.
(a) t = 0 s (b) t = 50 s
(c) t = 150 s (d) t = 250 s
(e) t = 650 s (f) t = 1000 s
2419
16
4
1
8
28
2419
16
41
8
28
241916
4
1
8
2824
1916
41
8
24
1916
4
1
8
24
1916
41
8
8 cm/s2100
Temp. (K)
1000
Fig. 2—Modeling result of evolution of shape of electrode tip for Case I: (a) t = 0, (b) t = 50 s, (c) t = 150 s, (d) t = 250 s, (e) t = 650 s, (f)t = 1000 s. On left half: Isolines of voltage and the grid near the moving–deforming boundary (electrode tip–slag interface). On right half: Con-tour of temperature overlaid with vectors of velocity in the slag region.
2056—VOLUME 46B, OCTOBER 2015 METALLURGICAL AND MATERIALS TRANSACTIONS B
1. Case IThe melting of electrode for this case was previously
discussed in details in Section III–A. A high electricalconductivity and high thermal conductivity of the liquidslag are assumed (Table IV). The solidified slag layernear the mold wall is assumed to be an electricalinsulator and no current enters into mold. The isolinesof voltage in the beginning of simulation and finalsteady state are compared as shown in Figure 4 (Case I).With the increase of immersion depth, the isolines ofvoltage are shifted and the voltage of system is reduced.In addition, the maximum amount of current density isinitially observed near the edge of electrode. However,the amplitude of current density is increased in the slagzone under the shadow of electrode for the deeplysubmerged electrode. As a consequence, the Lorentzforce becomes stronger that results in promotion ofstirring and intensification of velocity under the elec-trode. The amount of generated power due to Jouleheating is significant (Table V) leading to a high
temperature in the slag zone. In addition, the electrodetip deforms to a parabolic shape.
2. Case IIA high electrical conductivity and high thermal
conductivity of the liquid slag are assumed, as same asCase I, but the current is allowed to cross the slag skinflowing through the mold. As stated by Kharichaet al.,[8] opening the path to the mold causes reductionin the overall resistance of the ESR system. Conse-quently, a significant reduction of voltage is observedfor Case II as demonstrated by isolines of voltage inFigure 4 (Case II). Similar to Case I, the current densitybecomes larger in the bulk of slag with increasing thesubmerged volume of electrode. In addition, the moltenslag becomes colder due to high thermal conductivity ofmelt and low magnitude of power generated in theprocess. In Case II, the electrode tip develops aparabolic shape from the extremities leaving a flat tipat the center. This unique shape of electrode has been
Fig. 3—Analysis of melting parameters for Case I: (a) power generation, (b) immersion depth, (c) melt rate, (d) power consumption (ratio ofpower generation to melt rate).
METALLURGICAL AND MATERIALS TRANSACTIONS B VOLUME 46B, OCTOBER 2015—2057
8 cm/s
2419
16
41
8
282419
16
4
1
8
C-den. (A/m2)
0.001 3.6x10⁴
C-den. (A/m2)
0.001 3.6x10⁴
C-den. (A/m2)
0.001 3.6x10⁴
C-den. (A/m2)
0.001 3.6x10⁴
2100
Temp. (K)
1000
Temp. (K)
Temp. (K) Temp. (K)20201000
21001000
20201000
Cas
e I
Cas
e II
1916
4
1
812
4
1
8
Steady stateInitial state
Fig. 4—Contour of current density overlaid with isolines of voltage (left half), contour of temperature overlaid with vectors of velocity (righthalf) for Case I (upper row) and Case II (bottom row).
1
1916
48
2419
16
1
12
48
2419
1
12
48
16
8 cm/s
Cas
e II
IC
ase
IV 19
1
12
4 8
16
C-den. (A/m2)
0.001 3.6x10⁴
C-den. (A/m2)
0.001 3.6x1042270
Temp. (K)
1000
Temp. (K)
20801000
C-den. (A/m2)
0.001 3.6x10⁴
C-den. (A/m2)
0.001 3.6x1042075
Temp. (K)
1000
Temp. (K)
20201000
Steady stateInitial state
Fig. 5—Contour of current density overlaid with isolines of voltage (left half), contour of temperature overlaid with vectors of velocity (righthalf) for Case III (upper row) and Case IV (bottom row).
2058—VOLUME 46B, OCTOBER 2015 METALLURGICAL AND MATERIALS TRANSACTIONS B
previously observed in both simulation[20] and realprocess.[13]
3. Case IIIA lower electrical conductivity and lower thermal
conductivity of the slag are assumed, and the current isallowed to cross the slag skin flowing through the mold.The lower electric conductivity of slag results in highergenerated power in the system. Significant amount ofJoule heating is released under the shadow of electrodewhere the current density is fairly large .With theincrease of immersion depth, the reduction in totalvoltage is observed as shown using isolines of voltage forinitial and final steady states. Note that, the globalenergy transfer is weak due to low thermal conductivityof molten slag. As a consequence, the bulk of moltenslag becomes very hot as shown in Figure 5 (Case III).The immersion depth is shallow, and the electrode tipdevelops a relatively flat concave shape.
4. Case IVThe molten slag in Case IV is considered thermally a
better conductor compared to the former case. Conse-quently, the heat transfer is efficient in the slag zoneresulting in colder slag compared to Case III asindicated in Figure 5 (Case IV). The current density isintensified in the bulk of slag with the increase ofelectrode immersion depth. Thus, the Lorentz forcebecomes dominant resulting in promotion of stirring inslag zone. The electrode is deeply immersed into the slagzone at the steady state. Therefore, a significant reduc-tion of the voltage is observed comparing the initial andfinal steady states for Case IV. In addition, the amountof released Joule heating is notably decreased during theprocess for this case. Finally, electrode tip develops aparabolic shape.
IV. DISCUSSION
The melting rate and shape of electrode tip areimportant indicators of the ESR process, and they
determine the efficiency of system. The predicted shapeof electrode tip is compared with the experimentallyobserved one (Figure 6).A fairly good agreementwith theexperiment is obtained for Case I and Case IV. Addition-ally, the power generation predicted by Case I and CaseIV agrees with the experiment as well (Table V). The heatcan efficiently transfer to the electrode due to largethermal conductivity of the slag (~5 W m�1 K�1). In fact,the turbulent flow in the bulk of slag zone can dramat-ically increase the effective thermal conductivity of theslag (~84 to 973 W m�1 K�1) as described by Choudharyand Szekely.[47] As illustrated in Figure 7, the effectivethermal conductivity is significantly increased by theturbulence, and it leads to a strong enhancement of heattransfer in the bulk slag. Thus, the temperature remainsrelatively uniform in the bulk as shown inFigures 4 and 5.On the other hand, the effective turbulence thermalconductivity gradually decreases from the bulk to theregion near walls where it has the same order ofmagnitude as molecular thermal conductivity due todamping of turbulence near walls.[27–29] The main differ-ence between Case III and Case IV is the molecularthermal conductivity of slag. The heat transfers to theboundaries such as mold, air, or electrode are minimizedfor Case III leading to high temperature in the slag zone.As a consequence, the melt rate becomes large and theimmersion depth decreases. In other words, increasingthermal conductivity of slag will lead to a decrease ofmeltrate. It must be noted that significant differences areobserved regarding to the shape of electrode tip and theimmersion depth between Case III and Case IV despitesimilar power generation. Thus, the voltage drop andsubsequently power generation depend on both immer-sion depth and shape of electrode tip. A comparison ismade between Case I and Case II to explore the effect ofcurrent path (without and with mold current). Theamount of power generation and temperature is largerand higher for Case I (without mold current) that causeshigher melt rate as described in Table V. The shape of tipfor Case II is quite similar to Case III although thethermal and electrical conductivities are noticeably dif-ferent. The immersion depth is approximately the same
Fig. 6—Shape of electrode tip observed in experiment conducted (upper row) by Tacke and Schwerdtfeger,[17] numerically simulated shapes ofelectrode tip of 4 Cases (bottom row).
METALLURGICAL AND MATERIALS TRANSACTIONS B VOLUME 46B, OCTOBER 2015—2059
for all cases except Case III which has the highest meltingrate and lowest immersion depth. For the latter, thehighest temperature in slag zone is observed among allcases due to low molecular thermal conductivity andinefficient heat transfer through the walls.
In a real ESR process, the stability is achieved byincluding a control system on electrode immersion depthto avoid undesirable extreme cases happening (theelectrode tip touches melt pool). Therefore, it is neces-sary to apply a numerical adaptation of electrodeimmersion depth as described in Eq. [17]. It should alsobe stated that the choice of lmin and lmax in Eq. [17]might influence the feeding velocity of electrode (uE) andconsequently the melt rate and shape of electrode tip ofsteady state. For that, further investigations aredemanded. According to Table V, approximately equiv-alent ratios (power generation to melt rate) are obtainedfor Case I and Case IV at steady state in which the shapeof electrode tip is fairly similar. Additionally, Case IIand Case III are following the same behavior due toinsignificant difference in the ratio calculated at steadystate. In conclusion, the shape of electrode tip at steadystate is much similar for ESR processes running with thesame ratio of power generation to melt rate.
The predicted melt rate for all cases is always lowerthan the value reported from the experiment (Table V).This indicates that the amount of heat provided toelectrode is underestimated by simulations. The currentmodel does not take into account electrochemicalpolarization overpotential, enhancement of turbulencein the slag bulk due to droplet dripping, and formationof liquid film under the electrode. Departure of droplets
from the electrode can generate stronger turbulence inthe slag bulk that certainly enhances the global energytransfer and melt rate.[23,24] In order to improve thequantitative accuracy of the numerical result, theaforementioned factors must be included in the futuremodel.
V. SUMMARY
A 2D axisymmetric numerical model was applied tosimulate the electrode melting during ESR process. Thesubmerging and remelting of electrode is modeled usinga dynamic mesh-based approach. The shape of electrodetip at the steady state validated against an experiment.The following conclusions were made:
1. The dynamic mesh-based approach is proved to be asuccessful method to model the electrode shape. Thesimulation results agree with the experimental factthat with the increase of melt rate, the immersiondepth decreases when the magnitude of imposedcurrent is kept constant. Furthermore, the ratio ofpower generation to melt rate, called power con-sumption, is an important factor to determine theshape of electrode: it is observed that the shape ofelectrode remains almost the same when the ratio iskept constant.
2. The voltage drop and subsequent power generationin the system are governed by both immersion depthand shape of electrode tip. In other words, similarpower generation is observed for systems where theshapes of tip and immersion depth were different.Therefore, the melt rate, immersion depth, and shapeof electrode tip are interdependent parameters.
The total power generation and the efficiency ofglobal heat transfer in the system are highly dependenton the molten slag physicochemical properties such aselectrical and thermal conductivities. Due to difficulty ofmeasurements of properties, a large uncertainty of theproperties exists. Therefore, parameter studies by vary-ing the electrical and thermal conductivities of slag aremade. It is found that
3. The electrical conductivity of slag (liquid and solid)mainly influences the electric current path whichimpacts the velocity and temperature distribution inthe process. As a consequence of different electriccurrent paths, the power generation, melt rate, andshape of electrode are significantly influenced.
4. The thermal conductivity of slag determines the effi-ciency of global heat transfer in the process.Increasing thermal conductivity of slag will result indecreasing melt rate.
To improve the quantitative accuracy of the modelingresults, the following phenomena must be included tothe current model. Firstly, it is essential to incorporatethe effect of droplets dripping through the slag into themodel. Secondly, it is necessary to include the influenceof electrochemical polarization overpotential since theelectric current is conducted by ions in the slag.
Case IV
Case I Case II
Case III
Turb. eff. thermal cond.(W/m.K)
2201
Fig. 7—Isolines of effective thermal conductivity due to turbulencefor simulation cases.
2060—VOLUME 46B, OCTOBER 2015 METALLURGICAL AND MATERIALS TRANSACTIONS B
ACKNOWLEDGMENTS
The authors acknowledge the financial support bythe Austrian Federal Ministry of Economy, Familyand Youth and the National Foundation for Research,Technology and Development within the framework ofthe Christian Doppler Laboratory for Advanced Pro-cess Simulation of Solidification and Melting.
REFERENCES1. G. Hoyle: Electroslag Processes, Applied Science Publishers,
London, 1983.2. E.J. Pickering: ISIJ Int., 2013, vol. 53, pp. 935–49.3. G. Hoyle: 6th International Vacuum Metallurgy Conference on
Special Melting, San Diego, 1979, pp. 624–40.4. W. Holzgruber: 5th International Symposium on Electroslag and
Other Special Melting Technologies, Pittsburgh, 1974, pp. 70–91.5. A. Mitchell: Perspective in Metallurgical Development Conference,
Sheffield, England, 1984, pp. 89–98.6. F.S. Suarez, J.E. Roberts, and L.D Schley: 5th International
Symposium on Electroslag and Other Special Melting Technologies,Pittsburgh, 1974, pp. 126–45.
7. A. Mitchell: Electric Furnace Steelmaking Conference, ISS, War-rendale, PA, 1985, p. 212.
8. A. Kharicha, E. Karimi-Sibaki, M. Wu, and A. Ludwig: Interna-tional Symposium on Liquid Metal Processing and Casting, Austin,2013, pp. 95–99.
9. D.K. Melgaard, J.J. Beaman, and G.J. Shelmidine: U.S. Patent7,180,931 B1, 2007.
11. D.K. Melgaard, R.L. Williamson, and J.J. Beaman: JOM, 1998,vol. 50, pp. 13–17.
12. A. Kharicha, M. Wu, and A. Ludwig: International Symposium onLiquid Metal Processing and Casting, Austin, 2013, pp. 145–50.
13. M. A. Maulvault: Ph.D. Thesis, MIT, 1967, pp. 80–85.14. A. Mitchell, S. Joshi, and J. Cameron: Metall. Trans., 1971, vol. 2,
pp. 561–67.15. J. Mendrykowski, J.J. Poveromo, J. Szekely, and A. Mitchell:
Metall. Trans., 1972, vol. 4, pp. 1761–68.16. T. Kishida, K. Yamaguchi, T. Tomioka, and T. Ichihara: Electr.
Steel, 1974, vol. 45, pp. 219–27.17. K.H. Tacke and K. Schwerdtfeger: Arch. Eisenhuttenwesen, 1981,
vol. 52, pp. 137–42.18. A. Jardy, D. Ablitzer, and J.F. Wadier: Metall. Trans. B, 1991,
vol. 22, pp. 111–20.19. J. Yanke, K. Fezi, M. Fahrmann, and M.J.M. Krane: Interna-
tional Symposium on Liquid Metal Processing and Casting, Austin,2013, pp. 47–55.
20. A. Kharicha, M. Wu, and A. Ludwig: ISIJ, 2014, vol. 54,pp. 1621–28.
21. A. Mitchell and G. Beynon:Metall. Trans., 1971, vol. 2, pp. 3333–45.
22. M. Kawakami, K. Nagata, M. Yamamura, N. Sakata, Y.Miyashita, and K.S. Goto: Testsu- to-Hagane, 1977, vol. 63, p. 220.
23. A. Kharicha, A. Ludwig, and M. Wu: EPD Congress, San Diego,USA, 2011, pp. 771–78.
24. A. Kharicha, M. Wu, A. Ludwig, M. Ramprecht, and H.Holzgruber: CFD modeling and simulation in materials, Wiley,Florida, 2012, pp. 139–46.
25. V. Weber, A. Jardy, B. Dussoubs, D. Ablitzer, S. Ryberon, V.Schmitt, S. Hans, and H. Poisson: Metall. Mater. Trans. B, 2009,vol. 40B, pp. 271–80.
26. H. Song and N. Ida: IEEE Trans. Magn., 1991, vol. 27, pp. 4012–15.
27. T. Esch and F. R. Menter: Turbulence Heat and Mass TransferConference, Antalya, Turkey, 2003.
28. F.R. Menter: AIAA J., 1994, vol. 32, pp. 1598–605.29. F.R. Menter, M. Kuntz, and R. Langtry: Turbul. Heat Mass
Transf., 2003, vol. 4, pp. 625–32.30. Fluent 14.5 User’s Guide, Fluent Inc., 2012.31. A. Menendez Blanco and J.M. Fernandez Oro: Comput. Fluids,
2012, vol. 57, pp. 138–50.32. G. Lame and B.P. Clapeyron: Ann. Chem. Phys., 1831, vol. 47,
pp. 250–56.33. L.I. Rubinstein: The Stefan Problem, American Mathematical
Society, Providence, 1971.34. K.C. Mills and B.J. Keene: Int. Met. Rev., 1981, vol. 1, pp. 21–69.35. M. Hajduk and T.E. Gammal: Stahl Eisen, 1979, vol. 99, p. 113.36. K.M. Kelkar, S.V. Patankar, S.K. Srivatsa, R.S. Minisandram,
D.G. Evans, J.J. deBarbadillo, R.H. Smith, R.C. Helmink, A.Mitchell, and H.A. Sizek: International Symposium on LiquidMetal Processing and Casting, Austin, 2013, pp. 3–12.
37. A.D. Patel: International Symposium on Liquid Metal Processingand Casting, Nancy, France, 2011, pp. 49–56.
38. S.F. Medina and M.P. de Andres: Ironmak. Steelmak., 1987,vol. 14, pp. 110–21.
39. E. Karimi-Sibaki, A. Kharicha, M. Wu, and A. Ludwig: Interna-tional Symposium on Liquid Metal Processing and Casting, Austin,2013, pp. 13–19.
40. E. Karimi-Sibaki, A. Kharicha, M. Wu, and A. Ludwig: IngotCasting Rolling Forging Conference, Milan, Italy, 2014.
41. H. Holzgruber, W. Holzgruber, A. Scheriau, M. Knabl, M. Kubin,J. Korp, and R Pierer: International Symposium on Liquid MetalProcessing and Casting, Nancy, France, 2011, pp. 57–64.
42. M. Hugo, B. Dussoubs, A. Jardy, J. Escaffre, and H. Poisson:International Symposium on Liquid Metal Processing and Casting,Austin, 2013, pp. 79–85.
43. A. Kharicha, A. Ludwig, and M. Wu: Mater. Sci. Eng. A, 2005,vols. 413–414, pp. 129–34.
44. E. Karimi-Sibaki, A. Kharicha, J. Korp, M. Wu, and A. Ludwig:Met. Trans. Forum, 2014, vol. 790, pp. 396–401.
45. A. Kharicha, W. Schutzenhofer, A. Ludwig, R. Tanzer, and M.Wu: Steel Res. Int., 2008, vol. 79, pp. 632–36.
46. R. Taylor and K.C. Mills: Arch. Eisenhuttenwesen, 1982, vol. 53,pp. 55–63.
47. M. Choudhary and J. Szekely: Ironmak. Steelmak., 1981, vol. 5,pp. 225–32.
METALLURGICAL AND MATERIALS TRANSACTIONS B VOLUME 46B, OCTOBER 2015—2061