THE ASTRONOMICAL JOURNAL, 120 : 1691È1712, 2000 October 2000. The American Astronomical Society. All rights reserved. Printed in U.S.A. ( A DYNAMICAL STUDY OF GALAXIES IN THE HICKSON COMPACT GROUPS SHINGO NISHIURA,1,2 MASASHI SHIMADA,1,2,3 YOUICHI OHYAMA,2,4 TAKASHI MURAYAMA,1,2 AND YOSHIAKI TANIGUCHI1,2 Received 2000 April 17 ; accepted 2000 May 10 ABSTRACT To investigate dynamical properties of spiral galaxies in the Hickson compact groups (HCGs), we present rotation curves of 30 galaxies in 20 HCGs. We found as follows : (1) There is no signiÐcant rela- tion between dynamical peculiarity and morphological peculiarity in HCG spiral galaxies. (2) There is no signiÐcant relation between the dynamical properties and the frequency distribution of nuclear activities in HCG spiral galaxies. (3) There are no signiÐcant correlations between the dynamical properties of HCG spiral galaxies and any group properties (i.e., size, velocity dispersion, galaxy number density, and crossing time). (4) Asymmetric and peculiar rotation curves are more frequently seen in the HCG spiral galaxies than in Ðeld spiral galaxies or in cluster ones. However, this tendency is more obviously seen in late-type HCG spiral galaxies. These results suggest that the dynamical properties of HCG spiral gal- axies do not strongly correlate with the morphology, the nuclear activity, and the group properties. Our results also suggest that more frequent galaxy collisions occur in the HCGs than in the Ðeld and in the clusters. Key word : galaxies : clusters : general È galaxies : interactions È galaxies : kinematics and dynamics 1. INTRODUCTION The dynamical properties of a galaxy are basically gov- erned by both the mass and angular momentum distribu- tions in the galaxy. Since such dynamical properties are deeply related to the formation and evolution of galaxies, many dynamical studies have been done for various kinds of galaxies (e.g., Rubin et al. 1985 ; see for recent papers Rubin, Waterman, & Kenney 1999 ; Sofue et al. 1999). Dynamical properties also provide important information on the interaction between galaxies (Keel 1993, 1996 ; Chengalur, Salpeter, & Terizian 1994 ; & Moles Marquez 1996 ; Barton, Bromley, & Geller 1999) and on the galaxy environment, such as clusters of galaxies (Rubin, Whitmore, & Ford 1988 ; Rubin et al 1999 ; Whitmore, Forbes, & Rubin 1988). In addition to the central region of clusters of galaxies, compact groups (CGs) of galaxies are also useful labor- atories to investigate violent interactions between or among galaxies because they are small isolated systems whose galaxy number densities are comparable to those in the center of a cluster of galaxies, e.g., D104È106 galaxies Mpc~3 (Shakhbazian 1973 ; Rose 1977 ; Hickson 1982, 1993). Among such CGs, the Hickson compact groups (HCGs) of galaxies have been studied extensively (Hickson 1982, 1993). Many galaxies in the HCGs show peculiar morphologies, such as tidal tails, tidal bridges, distorted isophotes, and shell structures (Mendes de Oliveira & Hickson 1994). It is also known that a number of early-type galaxies in the HCGs have unusually blue colors (Zepf, ÈÈÈÈÈÈÈÈÈÈÈÈÈÈÈ 1 Astronomical Institute, Graduate School of Science, Tohoku Uni- versity, Aramaki, Aoba, Sendai 980-8578, Japan. 2 Visiting astronomer, Okayama Astrophysical Observatory, National Astronomical Observatory, Kamogata, Okayama, 719-0232 Japan. 3 Asahi Optical Co., Ltd., Optical Research Department, 2-36-9, Maeno-cho, Itabashi-ku, Tokyo, 174-8639, Japan. 4 National Astronomical Observatory of Japan, 2-21-1 Osawa, Mitaka, Tokyo 181-8588, Japan. Whitmore, & Levison 1991 ; Moles et al. 1994). These obser- vational results suggest that galaxies in the HCGs have experienced frequent dynamical interactions. Indeed, Rubin, Hunter, & Ford (1991) showed that rotation curves of many spiral galaxies in HCGs appear abnormal. To investigate the e†ect of dynamical interactions in the CG environment, we recently conducted an optical spec- troscopy program of HCG galaxies (Shimada et al. 2000, hereafter Paper I). This paper presents results of statistical studies with rotation curve properties of HCG spiral gal- axies. We describe our observations and the data reduction in ° 2. Making the rotation curve, estimating rotation curve asymmetry, and classifying rotation curve shapes are described in ° 3. In ° 4, we compare the rotation curve properties of the HCG spiral galaxies with the optical mor- phologies, nuclear activities, and group properties (group size, velocity dispersion, galaxy number density, and cross- ing time). We compare the rotation curve properties between the HCG spiral galaxies and Ðeld ones in ° 5 and clusters ones in ° 6. In ° 7, we discuss our results. We adopt a Hubble constant km s~1 Mpc~1 H 0 \ 100 and a deceleration parameter throughout this paper. q 0 \ 0 2. OBSERVATIONS We have obtained optical long-slit spectra along the major axis of 30 galaxies (mostly disk galaxies) in 20 HCGs. The sample galaxies were randomly selected from the HCG catalog (Hickson 1993). The optical spectroscopy was made using the new Cassegrain spectrograph with an SITe 512 ] 512 CCD camera attached to the 188 cm telescope at the Okayama Astrophysical Observatory (OAO) between 1996 February and 1997 January. A journal of the obser- vations is listed in Table 1. Basic data of the observed gal- axies from Hickson (1993) are summarized in Table 2. As for the morphology type, we preferentially adopted the Hubble type taken from de Vaucouleurs et al. (1991, here- after RC3). For galaxies whose Hubble type is uncertain in RC3, we adopted the Hubble type taken from Hickson (1993). 1691
Transcript
THE ASTRONOMICAL JOURNAL, 120 :1691È1712, 2000 October2000. The American Astronomical Society. All rights reserved. Printed in U.S.A.(
A DYNAMICAL STUDY OF GALAXIES IN THE HICKSON COMPACT GROUPS
SHINGO NISHIURA,1,2 MASASHI SHIMADA,1,2,3 YOUICHI OHYAMA,2,4 TAKASHI MURAYAMA,1,2 AND YOSHIAKI TANIGUCHI1,2Received 2000 April 17 ; accepted 2000 May 10
ABSTRACTTo investigate dynamical properties of spiral galaxies in the Hickson compact groups (HCGs), we
present rotation curves of 30 galaxies in 20 HCGs. We found as follows : (1) There is no signiÐcant rela-tion between dynamical peculiarity and morphological peculiarity in HCG spiral galaxies. (2) There is nosigniÐcant relation between the dynamical properties and the frequency distribution of nuclear activitiesin HCG spiral galaxies. (3) There are no signiÐcant correlations between the dynamical properties ofHCG spiral galaxies and any group properties (i.e., size, velocity dispersion, galaxy number density, andcrossing time). (4) Asymmetric and peculiar rotation curves are more frequently seen in the HCG spiralgalaxies than in Ðeld spiral galaxies or in cluster ones. However, this tendency is more obviously seen inlate-type HCG spiral galaxies. These results suggest that the dynamical properties of HCG spiral gal-axies do not strongly correlate with the morphology, the nuclear activity, and the group properties. Ourresults also suggest that more frequent galaxy collisions occur in the HCGs than in the Ðeld and in theclusters.Key word : galaxies : clusters : general È galaxies : interactions È galaxies : kinematics and dynamics
1. INTRODUCTION
The dynamical properties of a galaxy are basically gov-erned by both the mass and angular momentum distribu-tions in the galaxy. Since such dynamical properties aredeeply related to the formation and evolution of galaxies,many dynamical studies have been done for various kindsof galaxies (e.g., Rubin et al. 1985 ; see for recent papersRubin, Waterman, & Kenney 1999 ; Sofue et al. 1999).Dynamical properties also provide important informationon the interaction between galaxies (Keel 1993, 1996 ;Chengalur, Salpeter, & Terizian 1994 ; & MolesMa� rquez1996 ; Barton, Bromley, & Geller 1999) and on the galaxyenvironment, such as clusters of galaxies (Rubin, Whitmore,& Ford 1988 ; Rubin et al 1999 ; Whitmore, Forbes, &Rubin 1988).
In addition to the central region of clusters of galaxies,compact groups (CGs) of galaxies are also useful labor-atories to investigate violent interactions between or amonggalaxies because they are small isolated systems whosegalaxy number densities are comparable to those in thecenter of a cluster of galaxies, e.g., D104È106 galaxiesMpc~3 (Shakhbazian 1973 ; Rose 1977 ; Hickson 1982,1993). Among such CGs, the Hickson compact groups(HCGs) of galaxies have been studied extensively (Hickson1982, 1993). Many galaxies in the HCGs show peculiarmorphologies, such as tidal tails, tidal bridges, distortedisophotes, and shell structures (Mendes de Oliveira &Hickson 1994). It is also known that a number of early-typegalaxies in the HCGs have unusually blue colors (Zepf,
ÈÈÈÈÈÈÈÈÈÈÈÈÈÈÈ1 Astronomical Institute, Graduate School of Science, Tohoku Uni-
Maeno-cho, Itabashi-ku, Tokyo, 174-8639, Japan.4 National Astronomical Observatory of Japan, 2-21-1 Osawa, Mitaka,
Tokyo 181-8588, Japan.
Whitmore, & Levison 1991 ; Moles et al. 1994). These obser-vational results suggest that galaxies in the HCGs haveexperienced frequent dynamical interactions. Indeed,Rubin, Hunter, & Ford (1991) showed that rotation curvesof many spiral galaxies in HCGs appear abnormal.
To investigate the e†ect of dynamical interactions in theCG environment, we recently conducted an optical spec-troscopy program of HCG galaxies (Shimada et al. 2000,hereafter Paper I). This paper presents results of statisticalstudies with rotation curve properties of HCG spiral gal-axies. We describe our observations and the data reductionin ° 2. Making the rotation curve, estimating rotation curveasymmetry, and classifying rotation curve shapes aredescribed in ° 3. In ° 4, we compare the rotation curveproperties of the HCG spiral galaxies with the optical mor-phologies, nuclear activities, and group properties (groupsize, velocity dispersion, galaxy number density, and cross-ing time). We compare the rotation curve propertiesbetween the HCG spiral galaxies and Ðeld ones in ° 5 andclusters ones in ° 6. In ° 7, we discuss our results.
We adopt a Hubble constant km s~1 Mpc~1H0\ 100and a deceleration parameter throughout this paper.q0\ 0
2. OBSERVATIONS
We have obtained optical long-slit spectra along themajor axis of 30 galaxies (mostly disk galaxies) in 20 HCGs.The sample galaxies were randomly selected from the HCGcatalog (Hickson 1993). The optical spectroscopy was madeusing the new Cassegrain spectrograph with an SITe512 ] 512 CCD camera attached to the 188 cm telescope atthe Okayama Astrophysical Observatory (OAO) between1996 February and 1997 January. A journal of the obser-vations is listed in Table 1. Basic data of the observed gal-axies from Hickson (1993) are summarized in Table 2. Asfor the morphology type, we preferentially adopted theHubble type taken from de Vaucouleurs et al. (1991, here-after RC3). For galaxies whose Hubble type is uncertain inRC3, we adopted the Hubble type taken from Hickson(1993).
a HCG 73a and 92a are redshift discordant gal-axies, and we exclude these galaxies from our sta-tistical sample.
b HCG 87a is classiÐed as a lenticular galaxy inRC3, and we exclude this galaxy from our statisticalsample.
A long (5@) slit with a width of was used and put on1A.8each target galaxy with a position angle of the major axis.The 600 grooves mm~1 grating was used to cover a 6300È7050 region with a spectral resolution of 3.4 (^157 kmA� A�s~1 at 6500 Two-pixel binning was made of the CCDA� ).along the slit, and thus the spatial resolution was per1A.75element. The typical seeing during the runs was 2A.
The data were analyzed using IRAF.5 We also used aspecial data reduction package, SNGRED (Kosugi et al.1995), developed for the OAO new Cassegrain spectrographdata. The reduction was made with a standard procedure :bias subtraction, Ñat-Ðelding with the data of the dome Ñats,and cosmic-ray removal. Flux calibration was obtainedusing standard stars available in IRAF.
3. RESULTS
3.1. Major-Axis Velocity CurvesWe use the Ha emission line to construct a heliocentric
velocity curve as a function of the radial distance, r, from
ÈÈÈÈÈÈÈÈÈÈÈÈÈÈÈ5 Image Reduction and Analysis Facility (IRAF) is distributed by the
National Optical Astronomy Observatories, which are operated by theAssociation of Universities for Research in Astronomy, Inc., under co-operative agreement with the National Science Foundation.
the nucleus for each galaxy ; i.e., Vobs(r) \ c[j obs(r)/j0 [ 1]where and are the measured and the rest-framejobs(r) j0wavelengths of Ha, respectively. For each galaxy, we derivethe rotation velocity curve, correcting for the inclinatione†ect ; i.e., whereV (r) \ [Vobs(r) [ V
_]/[(1 ] V
_/c)sin i],
is the heliocentric velocity of the galaxy center, c is theV_velocity of light, and i is the inclination angle of the galaxy
(i \ 0¡ corresponds to the face-on view). Following Rubinet al. (1982), we estimate the inclination angle using therelation sin i \ 1.0420.5(1[ 10~2x) 0.5, where x \
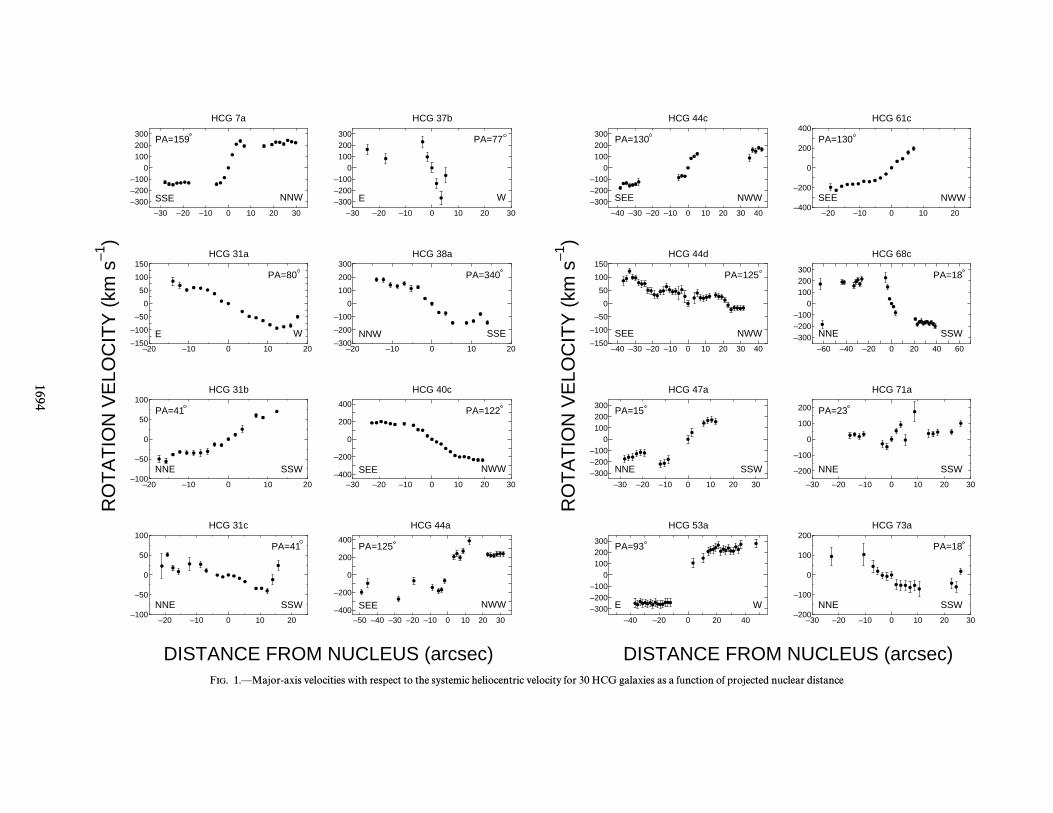
and and are the semimajor andlog (Rmaj/Rmin) Rmaj Rminsemiminor axes of the isophote at 25 mag arcsec~2 in the Bband, respectively (Hickson 1993). The adopted values ofsin i are listed in Table 2. Distances r from the galacticnucleus, rotation velocities, V (r), and their 1 p Ðtting errors,dV (r), are listed in Table 15. In Figure 1, we show the rota-tion velocity curves as a function of distance from the galac-tic nucleus in units of arcseconds for the observed galaxies.
3.2. Asymmetry of the Rotation CurveIt is known that galaxy collisions disturb the rotation
curves of galaxies. The kinematical e†ect due to the tidaldisturbance often di†ers between the side facing the collid-ing partner and the opposite side, and thus the rotationcurve tends to show an asymmetric property (Barton et al.1999 and references therein). Therefore, it is interesting toinvestigate the asymmetry of the rotation curve. To quan-tify the asymmetry of the rotation curve, we deÐne an asym-metry parameter,
A4C 1N
;j
NGCV (rj) [ V ([r
j)
V (rj) ] V ([r
j)D2HD1@2
, (1)
where j is the bin number along the major axis and N is thetotal number of bins. Here we use the data between r \
and where is the length of the radius0.2R25 r \ 0.5R25, R25of the isophote at 25 mag arcsec~2 in the B band. Thereason for this is as follows : The minimum radius, is0.2R25,adopted to exclude the data in the central region of galaxies,where the tidal disturbance is expected to be negligiblysmall ; i.e., if we include the data with the di†er-r \ 0.2R25,ence of the asymmetry parameter among the galaxies couldbe less pronounced. On the other hand, the maximumradius, is adopted to cover the observed rotation0.5R25,curves for most of the galaxies studied here. According tothe deÐnition of A, galaxies with higher asymmetric rota-tion curves tend to have larger values of A. The results arelisted in Table 3. We cannot estimate A for six spiral gal-axies (HCG 37b, 47a, 61c, 87a, 92c, and 96a) because of thefew data points in their rotation curves.
3.3. Shape of the Rotation CurvesAs shown in Figure 1, the observed velocity curves show
various shapes. However, we simply adopt three shapes : (1)type f, for which the rotation velocity monotonically risesnear the center and tends to be almost Ñat at r/R25 ¹ 1(note that most ordinary spiral galaxies have this type ofrotation curve e.g., Rubin et al. 1985) ; (2) type fp, for whichthe rotation curve appears almost Ñat, but some dips and/orbumps are seen ; (3) type p, for which the rotation curveshows a signiÐcantly peculiar shape. Rotation curves with asinusoidal shape or a linearly rising shape are included inthis type. The results of our classiÐcation are listed in Table3. Note that rotation curves of two galaxies (HCG 37b and
No. 4, 2000 DYNAMICS OF HICKSON COMPACT GROUPS 1693
TABLE 2
PROPERTIES OF OUR HCG GALAXIES
V_
Rmaja RminHCG Hickson Type RC3 Type Adopted Type (km s~1) (arcsec) (arcsec) sin i
corresponds toa Rmaj R25.b HCG 73a and 92a are redshift-discordant galaxies, and we exclude these galaxies from our statistical sample.c HCG 87a is classiÐed as a lenticular galaxy in RC3, and we exclude this galaxy from our statistical sample.
HCG 92c) cannot be classiÐed because they have only a fewdata points.
4. THE ROTATION CURVE PROPERTIES OF HCG GALAXIES
4.1. Enlarged HCG SampleAmong the 30 galaxies observed by us, two galaxies are
redshift-discordant galaxies in the HCGs (HCG 73a andHCG 92a). One of the remaining 28 galaxies is classiÐed asan S0 in RC3 (HCG 87a). Therefore, our HCG sample con-tains 27 spiral galaxies. To enlarge the sample, we includeHCG galaxies observed by Rubin et al. (1991) (see Table 4).Their sample contains 34 spiral galaxies. Excluding twounavailable galaxies (HCG 10a and HCG 37c) for whichrotation curve data were not shown, two redshift-discordant galaxies (HCG 31d and HCG 78a), and Ðve S0galaxies classiÐed in RC3 (HCG 16c, 16d, 23a, 34b, and57e), we obtained the rotation curve data of the 25 HCGspiral galaxies from Rubin et al. (1991). For these 25 HCGspiral galaxies, we estimate the asymmetry parameter andclassify the rotation curve shape using the same method forour HCG data. The results are also listed in Table 4. Twelveof these 25 spiral galaxies are commonly observed (HCG31a, 31b, 31c, 37b, 40c, 44a, 44b, 44d, 79d, 88a, 88c, and89a). The A values of these twelve spiral galaxies areadopted from the average A. Finally, we obtain an enlargedHCG sample that contains 40 spiral galaxies. Hereafter, we
discuss the rotation curves of HCG spiral galaxies with theenlarged HCG spiral sample containing 40 spiral galaxies.
4.2. Rotation Curve Properties versus Morphologiesof Host Galaxies
Mendes de Oliveira & Hickson (1994) showed that abouthalf the galaxies in HCGs have peculiar morphologies, suchas tidal tails, tidal debris, or distorted isophotes, indicatinggalaxy collisions. On the other hand, Rubin et al. (1991)found that there is a loose correlation between peculiarity ofrotation curve and peculiarity of morphology. In Table 5,we classiÐed our HCG spiral galaxies into two categoriesbased on the optical morphology from Mendes de Oliveira& Hickson (1994) and RC3. The spiral galaxies with orwithout optical peculiar morphologies are listed in Table 5.We compare the shape of the rotation curves with theoptical morphologies of host galaxies. The result is shownin Table 6. Although it is generally expected that spiralgalaxies with normal rotation curves have normal morphol-ogy and those with peculiar rotation curves have peculiarmorphology, there are galaxies with normal morphologythat have peculiar kinematics, and galaxies with peculiarmorphology that have normal kinematics. We adopted thenull hypothesis that distribution for the HCG spiral gal-axies with peculiar morphology is the same as that for thosewith normal morphology and applied the s2 test. The resultis shown in Table 6. We obtained the probability
–30 –20 –10 0 10 20 30–300–200–100
0100200300
HCG 7a
SSE NNW
PA=159
–20 –10 0 10 20–150
–100
–50
0
50
100
150HCG 31a
E W
PA=80
–20 –10 0 10 20–100
–50
0
50
100HCG 31b
NNE SSW
PA=41
–20 –10 0 10 20–100
–50
0
50
100HCG 31c
NNE SSW
PA=41
–30 –20 –10 0 10 20 30–300–200–100
0100200300
HCG 37b
E W
PA=77
–20 –10 0 10 20–300
–200
–100
0
100
200
300HCG 38a
NNW SSE
PA=340
–30 –20 –10 0 10 20 30–400
–200
0
200
400
HCG 40c
SEE NWW
PA=122
–50 –40 –30 –20 –10 0 10 20 30–400
–200
0
200
400
HCG 44a
SEE NWW
PA=125
DISTANCE FROM NUCLEUS (arcsec)
RO
TA
TIO
N V
ELO
CIT
Y (
km s
–1)
–40 –30 –20 –10 0 10 20 30 40–300–200–100
0100200300
HCG 44c
SEE NWW
PA=130
–40 –30 –20 –10 0 10 20 30 40–150
–100
–50
0
50
100
150HCG 44d
SEE NWW
PA=125
–30 –20 –10 0 10 20 30–300–200–100
0100200300
HCG 47a
NNE SSW
PA=15
–40 –20 0 20 40–300–200–100
0100200300
HCG 53a
E W
PA=93
–20 –10 0 10 20–400
–200
0
200
400HCG 61c
SEE NWW
PA=130
–60 –40 –20 0 20 40 60–300–200–100
0100200300
HCG 68c
NNE SSW
PA=18
–30 –20 –10 0 10 20 30
–200
–100
0
100
200
HCG 71a
NNE SSW
PA=23
–30 –20 –10 0 10 20 30–200
–100
0
100
200HCG 73a
NNE SSW
PA=18
DISTANCE FROM NUCLEUS (arcsec)
RO
TA
TIO
N V
ELO
CIT
Y (
km s
–1)
FIG. 1.ÈMajor-axis velocities with respect to the systemic heliocentric velocity for 30 HCG galaxies as a function of projected nuclear distance
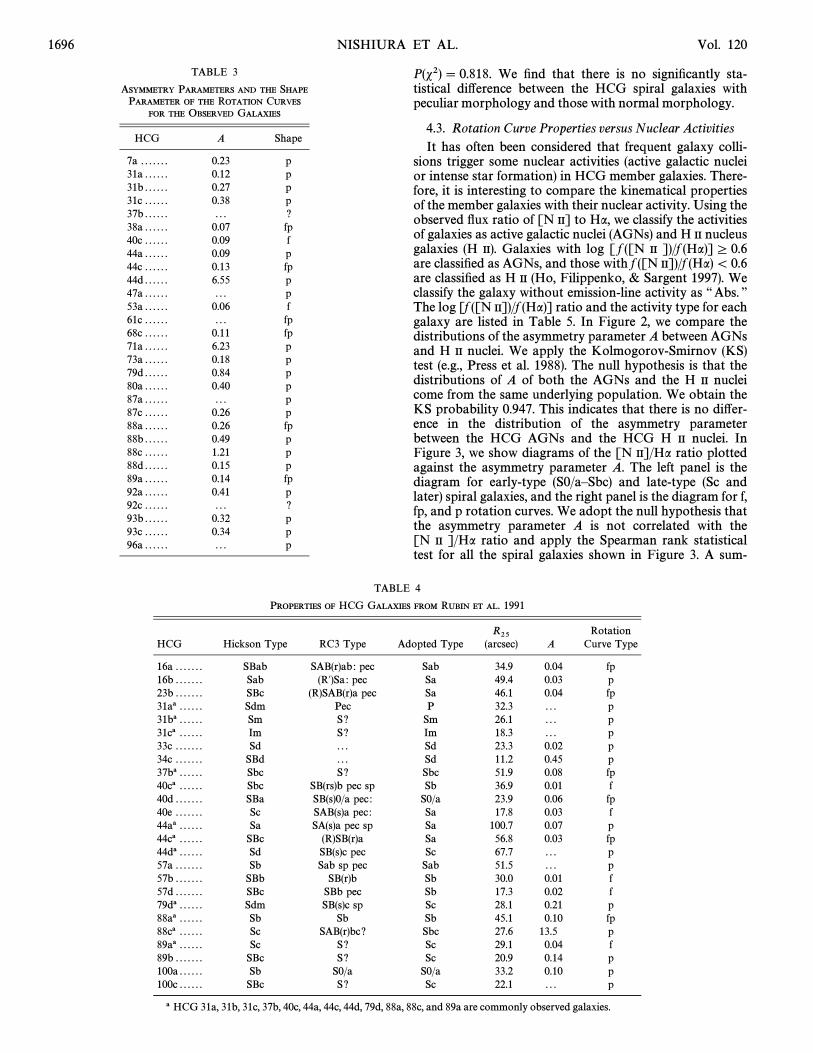
P(s2) \ 0.818. We Ðnd that there is no signiÐcantly sta-tistical di†erence between the HCG spiral galaxies withpeculiar morphology and those with normal morphology.
4.3. Rotation Curve Properties versus Nuclear ActivitiesIt has often been considered that frequent galaxy colli-
sions trigger some nuclear activities (active galactic nucleior intense star formation) in HCG member galaxies. There-fore, it is interesting to compare the kinematical propertiesof the member galaxies with their nuclear activity. Using theobserved Ñux ratio of [N II] to Ha, we classify the activitiesof galaxies as active galactic nuclei (AGNs) and H II nucleusgalaxies (H II). Galaxies with log [ f ([N II ])/f (Ha)]º 0.6are classiÐed as AGNs, and those with f ([N II])/f (Ha)\ 0.6are classiÐed as H II (Ho, Filippenko, & Sargent 1997). Weclassify the galaxy without emission-line activity as ““ Abs. ÏÏThe log [f ([N II])/f (Ha)] ratio and the activity type for eachgalaxy are listed in Table 5. In Figure 2, we compare thedistributions of the asymmetry parameter A between AGNsand H II nuclei. We apply the Kolmogorov-Smirnov (KS)test (e.g., Press et al. 1988). The null hypothesis is that thedistributions of A of both the AGNs and the H II nucleicome from the same underlying population. We obtain theKS probability 0.947. This indicates that there is no di†er-ence in the distribution of the asymmetry parameterbetween the HCG AGNs and the HCG H II nuclei. InFigure 3, we show diagrams of the [N II]/Ha ratio plottedagainst the asymmetry parameter A. The left panel is thediagram for early-type (S0/aÈSbc) and late-type (Sc andlater) spiral galaxies, and the right panel is the diagram for f,fp, and p rotation curves. We adopt the null hypothesis thatthe asymmetry parameter A is not correlated with the[N II ]/Ha ratio and apply the Spearman rank statisticaltest for all the spiral galaxies shown in Figure 3. A sum-
TABLE 4
PROPERTIES OF HCG GALAXIES FROM RUBIN ET AL. 1991
R25 RotationHCG Hickson Type RC3 Type Adopted Type (arcsec) A Curve Type
mary of the statistical tests is presented in Table 7. There isno correlation between A and the [N II ]/Ha ratio in theHCG spiral galaxies.
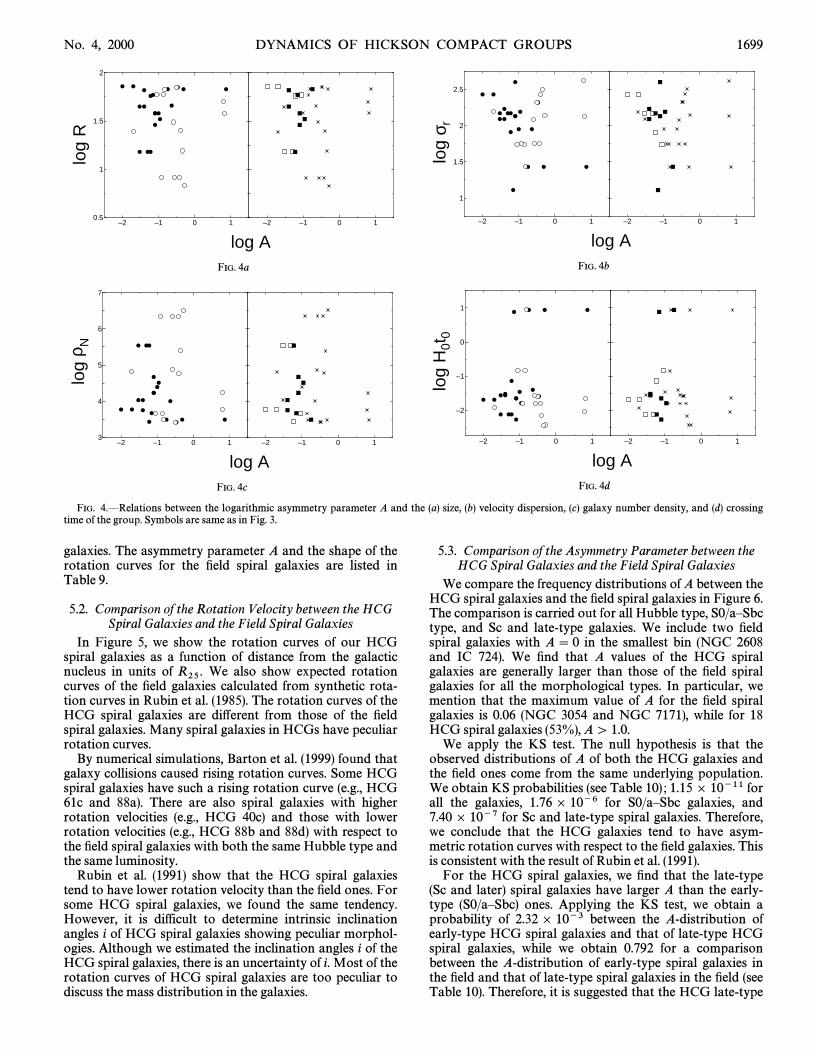
4.4. Rotation Curve Properties versus Group PropertiesRubin et al. (1991) mentioned that there appears to be no
correlation between normal or abnormal rotation curvesand the velocity dispersion of the group. To conÐrm this, weinvestigated correlations between dynamics and other
TABLE 6
COMPARISON OF KINEMATICAL PROPERTIES WITH
MORPHOLOGICAL PECULIARITIES
f Rotation fp Rotation p RotationMorphology Curves Curves Curves
a The probability that rejects the null hypothesis.
properties of group. The group size, velocity dispersion,galaxy number density, and crossing time from previousstudies by Hickson, Kindl, & Huchra (1988), and Hicksonet al. (1992) are listed in Table 5 for each HCG galaxy.Figure 4 shows relations between the asymmetry parameterA and the group size (Hickson et al. 1992), velocity disper-
a The probability that rejects the nullhypothesis.
0
2
4
6AGN
–2 –1.5 –1 –0.5 0 0.5 1 1.50
2
4
HII
log A
Num
ber
–2 –1 0 1–2
–1
0
1
2
–2 –1 0 1
log A
log
[NII]
/Hα
1698 NISHIURA ET AL. Vol. 120
FIG. 2.ÈComparisons of frequency distributions of the logarithmicasymmetric parameter (log A) between the AGNs (top) and the H II nuclei(bottom).
sion (Hickson et al. 1992), galaxy number density (Hicksonet al. 1988), and crossing time (Hickson et al. 1992) forearly-type (S0/aÈSbc) galaxies, late-type (Sc and later) gal-axies, and f, fp, and p rotation curves. We adopt the null
TABLE 8
SUMMARY OF THE SPEARMAN RANK TEST FOR THE CORRELATIONS
BETWEEN ASYMMETRY PARAMETER A AND THE PROPERTIES OF THE HCGS
a The probability that rejects the null hypothesis.
hypothesis that the asymmetry parameter A is not corre-lated with each group property and apply the Spearmanrank statistical test for all the correlations shown in Figure4. A summary of the statistical tests is presented in Table 8.Although the probability of a relation between A and groupvelocity dispersion for f rotation curves is 4.8 ] 10~3, the 3p conÐdence level is 1.3] 10~3. Therefore, for any spiralgalaxy, it is found that there is no correlation between theasymmetry parameter A and the group properties.
5. COMPARISON OF ROTATION CURVES BETWEEN HCG
GALAXIES AND FIELD GALAXIES
5.1. Field SampleTo investigate how the dynamical properties of HCG
galaxies are di†erent from those of isolated galaxies, weneed a reference sample of Ðeld galaxies. Rubin, Ford, &Thonnard (1980) and Rubin et al. (1982, 1985) publishedrotation curves for 60 spiral galaxies (16 Sa, 23 Sb, and 21Sc galaxies). Excluding two Virgo spiral galaxies (NGC4321 and NGC 4419) and two galaxies in groups (NGC1353 and NGC 4448), we adopt 56 spiral galaxies (15 Sa, 21Sb, and 20 Sc) as a Ðeld galaxy sample. The basic data ofthese Ðeld galaxies are summarized in Table 9.
Unfortunately, Rubin et al. (1980, 1982, 1985) show onlyaverage rotation velocity V ( o r o ), the mean of velocitieswithin the radial bins of both r and [r, and 1 p error of themean, dV ( o r o ). It is hard to know how many data pointseither r or [r contains and to estimate V (r) and V ([r).Therefore, we simply assume that there is only one velocitydata point in each bin of r and [r. Making V (r) and V ([r)that data point here, we reconstruct V ( o r o ) and dV ( o r o ) ofRubin et al. (1980, 1982, 1985). Under this assumption, oneÐnds that the rotation velocity at distance r is V (r)\V( o r o )
and that the rotation velocity at distance] dV ( o r o )/J2[r is In this case we canV ([r) \ V ( o r o ) [ dV ( o r o )/J2.deÐne the asymmetry parameter A as
A41
J2
G 1N
;j
N CdV ( o rjo )
V ( o rjo )D2H1@2
. (2)
The meaning of j and N are the same as in equation (1).Note that the asymmetry parameters A for Ðeld spiral gal-axies are all upper limits according to the above deÐnition.We also classify the shape of rotation curves for Ðeld spiral
FIG. 3.ÈRelations between the logarithmic asymmetry parameter A and the [N II]/Ha ratio. Filled circles and open circles indicate the early-type(S0/aÈSbc) and the late-type (Sc and later) HCG spiral galaxies, respectively. Open squares, Ðlled squares, and crosses indicate the f, fp, and p rotation curves,respectively.
–2 –1 0 10.5
1
1.5
2
–2 –1 0 1
log A
log
R
–2 –1 0 1
1
1.5
2
2.5
–2 –1 0 1
log A
log
rσ–2 –1 0 1
3
4
5
6
7
–2 –1 0 1
log A
log
Nρ
–2 –1 0 1
–2
–1
0
1
–2 –1 0 1
log Alo
g H
0t0
No. 4, 2000 DYNAMICS OF HICKSON COMPACT GROUPS 1699
FIG. 4a FIG. 4b
FIG. 4c FIG. 4d
FIG. 4.ÈRelations between the logarithmic asymmetry parameter A and the (a) size, (b) velocity dispersion, (c) galaxy number density, and (d) crossingtime of the group. Symbols are same as in Fig. 3.
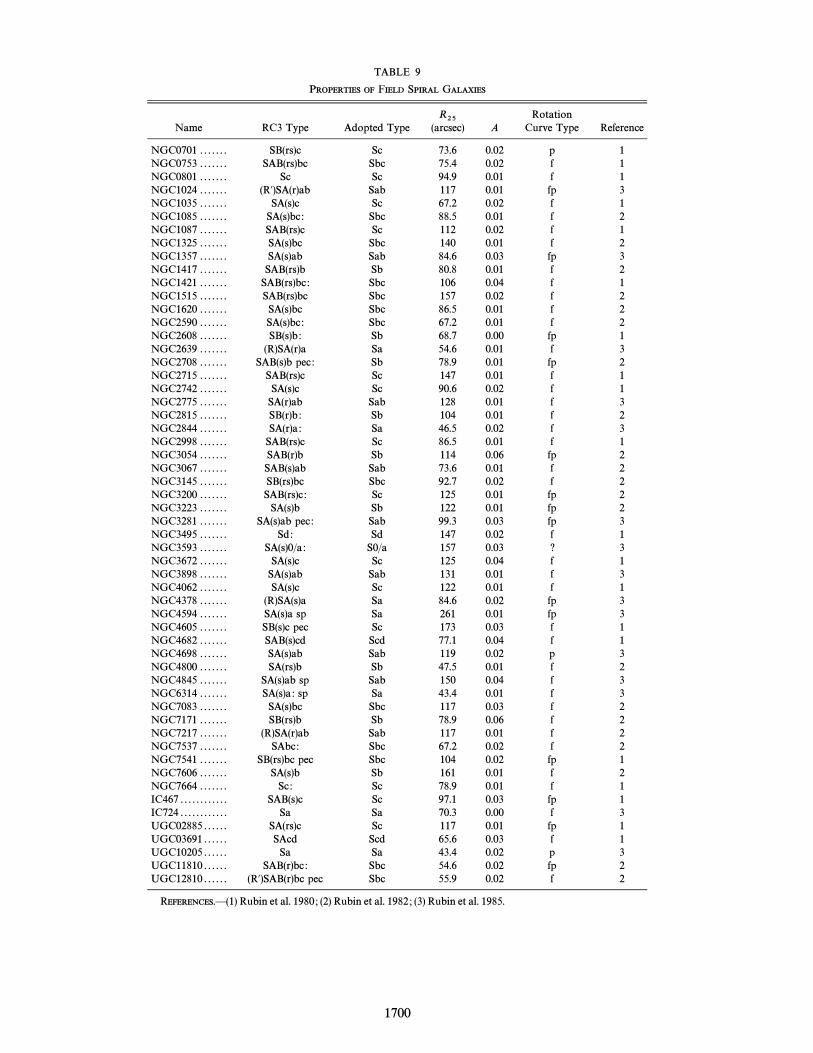
galaxies. The asymmetry parameter A and the shape of therotation curves for the Ðeld spiral galaxies are listed inTable 9.
5.2. Comparison of the Rotation Velocity between the HCGSpiral Galaxies and the Field Spiral Galaxies
In Figure 5, we show the rotation curves of our HCGspiral galaxies as a function of distance from the galacticnucleus in units of We also show expected rotationR25.curves of the Ðeld galaxies calculated from synthetic rota-tion curves in Rubin et al. (1985). The rotation curves of theHCG spiral galaxies are di†erent from those of the Ðeldspiral galaxies. Many spiral galaxies in HCGs have peculiarrotation curves.
By numerical simulations, Barton et al. (1999) found thatgalaxy collisions caused rising rotation curves. Some HCGspiral galaxies have such a rising rotation curve (e.g., HCG61c and 88a). There are also spiral galaxies with higherrotation velocities (e.g., HCG 40c) and those with lowerrotation velocities (e.g., HCG 88b and 88d) with respect tothe Ðeld spiral galaxies with both the same Hubble type andthe same luminosity.
Rubin et al. (1991) show that the HCG spiral galaxiestend to have lower rotation velocity than the Ðeld ones. Forsome HCG spiral galaxies, we found the same tendency.However, it is difficult to determine intrinsic inclinationangles i of HCG spiral galaxies showing peculiar morphol-ogies. Although we estimated the inclination angles i of theHCG spiral galaxies, there is an uncertainty of i. Most of therotation curves of HCG spiral galaxies are too peculiar todiscuss the mass distribution in the galaxies.
5.3. Comparison of the Asymmetry Parameter between theHCG Spiral Galaxies and the Field Spiral Galaxies
We compare the frequency distributions of A between theHCG spiral galaxies and the Ðeld spiral galaxies in Figure 6.The comparison is carried out for all Hubble type, S0/aÈSbctype, and Sc and late-type galaxies. We include two Ðeldspiral galaxies with A\ 0 in the smallest bin (NGC 2608and IC 724). We Ðnd that A values of the HCG spiralgalaxies are generally larger than those of the Ðeld spiralgalaxies for all the morphological types. In particular, wemention that the maximum value of A for the Ðeld spiralgalaxies is 0.06 (NGC 3054 and NGC 7171), while for 18HCG spiral galaxies (53%), A[ 1.0.
We apply the KS test. The null hypothesis is that theobserved distributions of A of both the HCG galaxies andthe Ðeld ones come from the same underlying population.We obtain KS probabilities (see Table 10) ; 1.15 ] 10~11 forall the galaxies, 1.76 ] 10~6 for S0/aÈSbc galaxies, and7.40] 10~7 for Sc and late-type spiral galaxies. Therefore,we conclude that the HCG galaxies tend to have asym-metric rotation curves with respect to the Ðeld galaxies. Thisis consistent with the result of Rubin et al. (1991).
For the HCG spiral galaxies, we Ðnd that the late-type(Sc and later) spiral galaxies have larger A than the early-type (S0/aÈSbc) ones. Applying the KS test, we obtain aprobability of 2.32] 10~3 between the A-distribution ofearly-type HCG spiral galaxies and that of late-type HCGspiral galaxies, while we obtain 0.792 for a comparisonbetween the A-distribution of early-type spiral galaxies inthe Ðeld and that of late-type spiral galaxies in the Ðeld (seeTable 10). Therefore, it is suggested that the HCG late-type
TABLE 9
PROPERTIES OF FIELD SPIRAL GALAXIES
R25 RotationName RC3 Type Adopted Type (arcsec) A Curve Type Reference
REFERENCES.È(1) Rubin et al. 1980 ; (2) Rubin et al. 1982 ; (3) Rubin et al. 1985.
1700
0 0.2 0.4 0.6 0.8 1 1.20
100
200
300
400
HCG 7a
–20.20 Sa
–21.20 Sa
–19.20 Sa
0 0.2 0.4 0.6 0.8 1 1.20
50
100
150
HCG 31a
–18.18 Sc
–17.18 Sc
–19.18 Sc
0 0.2 0.4 0.6 0.8 1 1.20
50
100
150
200HCG 31b
–18.70 Sc
–17.70 Sc
–19.70 Sc
0 0.2 0.4 0.6 0.8 1 1.20
100
200
300HCG 31c
–20.51 Sc–21.51 Sc
–19.51 Sc
0 0.2 0.4 0.6 0.8 1 1.20
100
200
300
HCG 37b
–19.61 Sbc–18.61 Sbc
–20.61 Sbc
0 0.2 0.4 0.6 0.8 1 1.20
100
200
HCG 38a
–19.43 Sbc
–20.43 Sbc
–18.43 Sbc
0 0.2 0.4 0.6 0.8 1 1.20
100
200
300HCG 40c
–18.92 Sb
–19.92 Sb
–17.92 Sb
0 0.2 0.4 0.6 0.8 1 1.20
100
200
300
400
HCG 44a
–19.04 Sa–20.04 Sa
–18.04 Sa
DISTANCE FROM NUCLEUS (R25)
RO
TA
TIO
N V
ELO
CIT
Y (
km s
–1)
0 0.2 0.4 0.6 0.8 1 1.20
100
200
HCG 44c
–18.01 Sa–19.01 Sa
–17.01 Sa
0 0.2 0.4 0.6 0.8 1 1.20
50
100
150HCG 44d
–17.47 Sc–16.47 Sc
–18.47 Sc
0 0.2 0.4 0.6 0.8 1 1.20
100
200
300
HCG 47a
–20.26 Sb
–21.26 Sb
–19.26 Sb
0 0.2 0.4 0.6 0.8 1 1.20
100
200
300
400
HCG 53a
–21.02 Sbc
–22.02 Sbc
–20.02 Sbc
0 0.2 0.4 0.6 0.8 1 1.20
100
200
300HCG 61c
–19.43 Sbc
–20.43 Sbc
–18.43 Sbc
0 0.2 0.4 0.6 0.8 1 1.20
100
200
300
HCG 68c
–20.03 Sb
–21.03 Sb
–19.03 Sb
0 0.2 0.4 0.6 0.8 1 1.20
100
200
300
HCG 71a
–21.04 Sc
–20.04 Sc
–22.04 Sc
0 0.2 0.4 0.6 0.8 1 1.20
100
200
300HCG 73a
–20.52 Sc–19.52 Sc
–21.52 Sc
DISTANCE FROM NUCLEUS (R25)
RO
TA
TIO
N V
ELO
CIT
Y (
km s
–1)
FIG. 5.ÈMajor-axis velocities with respect to the systemic heliocentric velocity for 30 HCG galaxies as a function of nuclear distance in units of showing the approaching side (open circles) and theR25,receding side ( Ðlled circles). In each panel, the middle line indicates the expected rotation curve of the Ðeld spiral galaxies with similar Hubble type and luminosity calculated from synthetic rotation curves inRubin et al. (1985), and the top and bottom lines indicate the expected rotation curve of the Ðeld spiral galaxies with similar Hubble type that have luminosity 1 mag brighter and fainter, respectively.
1701
0 0.2 0.4 0.6 0.8 1 1.20
50
100
150HCG 79d
–17.37 Sc–18.37 Sc
–16.37 Sc
0 0.2 0.4 0.6 0.8 1 1.20
100
200
300HCG 80a
–20.12 Sc
–21.12 Sc
–19.12 Sc
0 0.2 0.4 0.6 0.8 1 1.20
100
200
300
400
500
HCG 87a
–20.79 Sa
–21.79 Sa
–19.79 Sa
0 0.2 0.4 0.6 0.8 1 1.20
100
200
300HCG 87c
–19.74 Sc
–20.74 Sc
–18.74 Sc
0 0.2 0.4 0.6 0.8 1 1.20
100
200
300
400
HCG 88a
–20.77 Sb
–21.77 Sb
–19.77 Sb
0 0.2 0.4 0.6 0.8 1 1.20
100
200
300
400
500
HCG 88b
–20.71 Sa
–21.71 Sa
–19.71 Sa
0 0.2 0.4 0.6 0.8 1 1.20
100
200
300HCG 88c
–20.08 Sbc
–21.08 Sbc
–19.08 Sbc
0 0.2 0.4 0.6 0.8 1 1.20
100
200
HCG 88d
–19.46 Sc
–20.46 Sc
–18.46 Sc
DISTANCE FROM NUCLEUS (R25)
RO
TA
TIO
N V
ELO
CIT
Y (
km s
–1)
0 0.2 0.4 0.6 0.8 1 1.20
50
100
150
200
250
300HCG 89a
–20.68 Sc
–21.68 Sc
–19.68 Sc
0 0.2 0.4 0.6 0.8 1 1.20
50
100
150
HCG 92a
–17.31 Sc
–18.31 Sc
–16.31 Sc
0 0.2 0.4 0.6 0.8 1 1.20
100
200
300
HCG 92c
–20.79 Sbc
–21.79 Sbc
–19.79 Sbc
0 0.2 0.4 0.6 0.8 1 1.20
50
100
150
200
250
300HCG 93b
–20.40 Sc
–21.40 Sc
–19.40 Sc
0 0.2 0.4 0.6 0.8 1 1.20
100
200
300
400HCG 93c
–19.64 Sa
–20.64 Sa
–18.64 Sa
0 0.2 0.4 0.6 0.8 1 1.20
100
200
300
400
500HCG 96a
–21.22 Sbc
–22.22 Sbc
–20.22 Sbc
DISTANCE FROM NUCLEUS (R25)
RO
TA
TIO
N V
ELO
CIT
Y (
km s
–1)
FIG. 5.ÈContinued
10
20
30
40
50
HCG (All) HCG (S0a–Sbc) HCG (Sc–)
10
20
30
40
50
Field (All) Field (S0a–Sbc) Field (Sc–)
–3 –2 –1 0 10
10
20
30
40
50
Cluster (All)
–2 –1 0 1
Cluster (S0a–Sbc)
–2 –1 0 1
Cluster (Sc–)
Num
ber
log A
DYNAMICS OF HICKSON COMPACT GROUPS 1703
FIG. 6.ÈComparisons of frequency distributions of the logarithmic asymmetric parameter (log A) between the HCG spiral galaxies (top), the Ðeld ones(middle), and the cluster spiral galaxies (bottom) for all Hubble type, early-type (S0/aÈSbc), and late-type (Sc and later) spiral galaxies.
spiral galaxies tend to have more asymmetric rotationcurves with respect to the HCG early-type ones.
5.4. Comparison of the Rotation Curve Shape between theHCG Spiral Galaxies and the Field Spiral Galaxies
We compare the rotation curve shapes between the HCGgalaxies and the Ðeld ones. In Figure 7 we compare the
TABLE 10
RESULTS OF KS TEST FOR DISTRIBUTIONS OF THE ASYMMETRY
a The probability that rejects the null hypothesis.
frequency distributions of rotation curve shapes betweenthe HCG spiral galaxies and the Ðeld ones for all galaxies,early-type spiral galaxies, and late-type spiral galaxies. Weadopt the null hypothesis that the distribution for the HCGspiral galaxies is the same as that for the Ðeld ones andapply the s2 test. The results are listed in Table 11. We Ðndthat there are signiÐcant statistical di†erences between theHCG spiral galaxies and the Ðeld ones.
Among the 39 HCG galaxies, 33 (B85%) galaxies haveeither fp or p rotation curves. It is remarkable that almostall the HCG late-type spiral galaxies (B93%) have p rota-tion curves. On the contrary, only 42% of the HCG early-type spiral galaxies have p rotation curves, and 21% of theHCG early-type spiral galaxies have f rotation curves. Theprobability from the s2 test between the frequency distribu-tions of the rotation curve shape of the early-type Ðeldspiral galaxies and that of late-type Ðeld spiral galaxies is0.673, while that between the early-type HCG spiral gal-axies and the late-type HCG spiral galaxies is 4.44] 10~3.Although the latter probability suggests a marginally sig-
TABLE 11
FREQUENCY DISTRIBUTIONS OF THE ROTATION CURVE SHAPE BETWEEN THE HCG SPIRAL
a Numbers in parentheses are the actual values.b ““ All ÏÏ means the total sample of S0aÈSbc and Sc galaxies.c The probability that rejects the null hypothesis.
10
20
30
40
HCG
10
20
30
40
Field
0
10
20
30
40
f fp p
Cluster
f fp p f fp p
All S0a–Sbc Sc–
Num
ber
1704 NISHIURA ET AL. Vol. 120
FIG. 7.ÈComparison of frequency distributions of the rotation curveshapes between the HCG spiral galaxies (top), the Ðeld ones (middle), andthe cluster ones (bottom) for all Hubble type, early-type (S0/aÈSbc), andlate-type (Sc and later) spiral galaxies.
niÐcant di†erence, a larger sample will be necessary toconÐrm it.
6. COMPARISON OF ROTATION CURVES BETWEEN HCG
GALAXIES AND CLUSTER GALAXIES
6.1. Cluster SampleAs we previously mentioned, the local galaxy number
density of HCGs is comparable to that of cluster centers.Therefore it is interesting to compare the dynamical proper-ties of the HCG spiral galaxies with those of cluster spiralgalaxies. We use a sample of cluster spiral galaxies takenfrom Amram et al. (1992, 1994, and 1995), who publishedrotation curves of 41 spiral galaxies in eight clusters. Thebasic data of these cluster galaxies are summarized in Table12. Their morphological types were taken from RC3 ifavailable (32 galaxies). For the remaining nine spiral gal-axies without RC3, we adopt the morphological types takenfrom Bell & Whitmore (1989), Amram et al. (1995), andGavazzi & Boselli (1996). Using equation (1), we calculatedthe asymmetry parameter A of the cluster spiral galaxies.We also classiÐed the shape of the rotation curves for them.The results are also listed in Table 12.
6.2. Comparison of the Asymmetry Parameter between theHCG Spiral Galaxies and the Cluster Spiral Galaxies
In Figure 6, we compare the frequency distribution of theasymmetry parameter A between the HCG spiral galaxiesand the cluster ones. The comparison is carried out for allHubble type, S0/aÈSbc type, and Sc and late-type galaxies.The null hypothesis is that the observed distributions of Aof both HCG spiral galaxies and the cluster ones come fromthe same underlying population. Applying the KS test, weobtain the following KS probabilities (see Table 13) ;6.64] 10~4 for all the galaxies, 4.50] 10~2 for the S0/aÈSbc spiral galaxies, and 8.48 ] 10~4 for the Sc and late-typespiral galaxies. We Ðnd that the A values of HCG spiralgalaxies tend to be larger than those of the cluster ones forall galaxies.
6.3. Comparison of the Rotation Curve Shape between theHCG Spiral Galaxies and the Cluster Spiral Galaxies
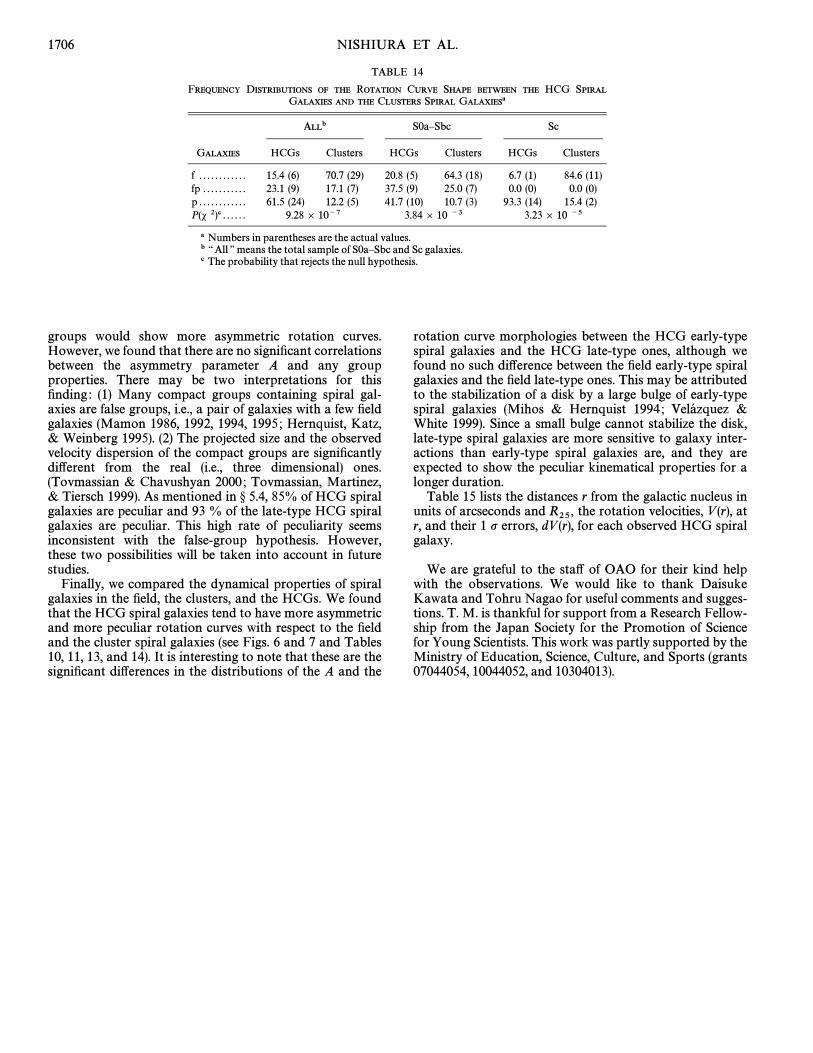
We show the frequency distribution of the rotation curveshape for the HCG, the Ðeld, and the cluster spiral galaxiesin Figure 7. We compare the two distributions for allHubble type, S0/aÈSbc type, and Sc and late-type spiralgalaxies. The null hypothesis is that the observed distribu-tions of the rotation curve shape of both the HCG spiralgalaxies and the cluster ones come from the same under-lying population. Applying the s2 test, we obtain the follow-ing probabilities (see Table 14) ; 9.28] 10~7 for all thegalaxies, 3.84] 10~3 for the S0/aÈSbc spiral galaxies, and3.23] 10~5 for the Sc and late-type spiral galaxies. Theseresults suggest that the HCG spiral galaxies tend to showmore peculiar shapes in their rotation curves.
7. DISCUSSION
In this paper, we have investigated the asymmetry andthe shape of the rotation curves of spiral galaxies in HCGs.Table 15 lists the distances from the galactic nucleus, r, inunits of arcseconds and the rotation velocities, V (r), atR25,r, and their 1 p errors dV (r) for each observed HCG spiralgalaxy.
First, we investigated the relation between the morpho-logical peculiarity and dynamical peculiarity of HCG spiralgalaxies. We found that there is no statistical di†erencebetween them (Table 6), which is consistent with the Ðndingby Rubin et al. (1991). It is likely that the HCG spiral gal-axies with both the morphological peculiarity and thedynamical peculiarity have experienced recent galaxy colli-sions. However, there are galaxies of normal morphologywith peculiar dynamical properties and ones of peculiarmorphology with normal dynamical properties. That thereis no correlation between the dynamical peculiarity and themorphological peculiarity suggests that the dynamicalproperties of the HCG spiral galaxies may be governed bygalaxy collision parameters such as the di†erence of massesand the orbital parameters. While morphological pecu-liarities such as tidal tails, tidal bridges, and asymmetry aremore clearly seen in the outer regions of galaxies, thedynamical peculiarities probed by the Ha line emission areobserved in inner regions of galaxies (see Fig.(r \ 0.5R25)5). The morphological peculiarity can be more easilyinduced by galaxy collisions than the dynamical peculiarity.Thus, weak galaxy collisions could not perturb the galaxyrotation curves, although it has been shown that morpho-logical deformation could be induced in outer parts of the
No. 4, 2000 DYNAMICS OF HICKSON COMPACT GROUPS 1705
TABLE 12
PROPERTIES OF CLUSTER SPIRAL GALAXIES
R25 RotationGalaxy Cluster RC3 Type Adopted Type (arcsec) A Curve Type Reference
REFERENCES.È(1) Amram et al. 1994 ; (2) Amram et al. 1992 ; (3) Gavazzi & Boselli 1996 ; (4) Amram et al. 1995 ; (5) Bell &Whitmore 1989.
galaxies. On the other hand, minor mergers could perturbthe rotation curve in the inner regions of galaxies withoutcausing global morphological peculiarities.
Second, we investigated the relation between the proper-ties of the rotation curves and the properties of the nuclear
TABLE 13
RESULTS OF KS TEST FOR DISTRIBUTIONS OF THE ASYMMETRY
a The probability that rejects the null hypothesis.
activity. Since it has often been suggested that the galaxycollisions trigger nuclear activities such as AGNs andnuclear starburst phenomena (Kennicutt & Keel 1984 ; Keel1996), it is expected that such nuclear activities would bemore often observed in HCG galaxies. However, we foundthat there is no signiÐcant statistical di†erence in the dis-tribution of the asymmetry parameter A among the nuclearactivities (Fig. 2). We also found that there is no correlationbetween the asymmetry parameter A and [N II]/Ha ratio(Fig. 3). All these Ðndings indicate that galaxy collisions donot always trigger the nuclear activity
Third, we investigated the relation between the dynami-cal properties of HCG spiral galaxies and properties ofcompact groups such as group size, velocity dispersion ofmember galaxies, galaxy number density, and crossing time(see Fig. 4 and Table 8). In compact groups with highernumber densities with smaller sizes, more frequent galaxycollision would occur, and thus spiral galaxies in such
1706 NISHIURA ET AL.
TABLE 14
FREQUENCY DISTRIBUTIONS OF THE ROTATION CURVE SHAPE BETWEEN THE HCG SPIRAL
a Numbers in parentheses are the actual values.b ““ All ÏÏ means the total sample of S0aÈSbc and Sc galaxies.c The probability that rejects the null hypothesis.
groups would show more asymmetric rotation curves.However, we found that there are no signiÐcant correlationsbetween the asymmetry parameter A and any groupproperties. There may be two interpretations for thisÐnding : (1) Many compact groups containing spiral gal-axies are false groups, i.e., a pair of galaxies with a few Ðeldgalaxies (Mamon 1986, 1992, 1994, 1995 ; Hernquist, Katz,& Weinberg 1995). (2) The projected size and the observedvelocity dispersion of the compact groups are signiÐcantlydi†erent from the real (i.e., three dimensional) ones.(Tovmassian & Chavushyan 2000 ; Tovmassian, Martinez,& Tiersch 1999). As mentioned in ° 5.4, 85% of HCG spiralgalaxies are peculiar and 93 % of the late-type HCG spiralgalaxies are peculiar. This high rate of peculiarity seemsinconsistent with the false-group hypothesis. However,these two possibilities will be taken into account in futurestudies.
Finally, we compared the dynamical properties of spiralgalaxies in the Ðeld, the clusters, and the HCGs. We foundthat the HCG spiral galaxies tend to have more asymmetricand more peculiar rotation curves with respect to the Ðeldand the cluster spiral galaxies (see Figs. 6 and 7 and Tables10, 11, 13, and 14). It is interesting to note that these are thesigniÐcant di†erences in the distributions of the A and the
rotation curve morphologies between the HCG early-typespiral galaxies and the HCG late-type ones, although wefound no such di†erence between the Ðeld early-type spiralgalaxies and the Ðeld late-type ones. This may be attributedto the stabilization of a disk by a large bulge of early-typespiral galaxies (Mihos & Hernquist 1994 ; &Vela� zquezWhite 1999). Since a small bulge cannot stabilize the disk,late-type spiral galaxies are more sensitive to galaxy inter-actions than early-type spiral galaxies are, and they areexpected to show the peculiar kinematical properties for alonger duration.
Table 15 lists the distances r from the galactic nucleus inunits of arcseconds and the rotation velocities, V (r), atR25,r, and their 1 p errors, dV (r), for each observed HCG spiralgalaxy.
We are grateful to the sta† of OAO for their kind helpwith the observations. We would like to thank DaisukeKawata and Tohru Nagao for useful comments and sugges-tions. T. M. is thankful for support from a Research Fellow-ship from the Japan Society for the Promotion of Sciencefor Young Scientists. This work was partly supported by theMinistry of Education, Science, Culture, and Sports (grants07044054, 10044052, and 10304013).
Sullivan, W. T., III. 1995, A&AS, 113, 35Amram, P., Le Coarer, E., Marcelin, M., Balkowski, C., Sullivan, W. T., III,
& Cayatte, V. 1992, A&AS, 94, 175Amram, P., Marcelin, M., Balkowski, C., Cayatte, V., Sullivan, W. T., III,
& Le Coarer, E. 1994, A&AS, 103, 5Barton, E. J., Bromley, B. C., & Geller, M. J. 1999, ApJ, 511, 25LBell, M., & Whitmore, B. C. 1989, ApJS, 70, 139Chengalur, J. N., Salpeter, E. E., & Terzian, Y. 1994, AJ, 107, 1984de Vaucouleurs, G., de Vaucouleurs, A., Corwin, H. G., Jr., Buta, R. J.,
Paturel, G., & P. 1991, Third Reference Catalog of BrightFouque� ,Galaxies (New York : Springer) (RC3)
Gavazzi, G., & Boselli, A. 1996, Astrophys. Lett. Commun., 35, 1Hernquist, L., Katz, N., & Weinberg, D. H. 1995, ApJ, 442, 57Hickson, P. 1982, ApJ, 255, 382ÈÈÈ. 1993, Astrophys. Lett. Commun., 29, 1Hickson, P., Kindl, E., & Huchra, J. P. 1988, ApJ, 331, 64Hickson, P., Mendes de Oliveira, C., Huchra, J. P., & Palumbo, G. G. C.
1992, ApJ, 399, 353Ho, L. C., Filippenko, A. V., & Sargent, W. L. W. 1997, ApJS, 112, 315Keel, W. C. 1993, AJ, 106, 1771ÈÈÈ. 1996, ApJS, 106, 27Kennicutt, R. C., Jr. & Keel, W. C. 1984, ApJ, 279, L5Kosugi, G., et al. 1995, PASP, 107, 474Mamon, G. A. 1986, ApJ, 307, 426ÈÈÈ. 1992, ApJ, 401, 3LÈÈÈ. 1994, in Clusters of Galaxies, ed. F. Durret, A. Mazure, & T. T.
Van (Paris : Ed. 297Frontieres),
Mamon, G. A. 1995, in ASP Conf. Ser. 70, Groups of Galaxies, ed. O.-G.Richter & K. Borne (San Francisco : ASP), 83
I., & Moles, M. 1996, A&AS, 120, 1Ma� rquez,Mendes de Oliveira, C., & Hickson, P. 1994, ApJ, 427, 684Mihos, J. C., & Hernquist, L. 1994, ApJ, 431, 9LMoles, M., Del Olmo, A., Perea, J., Masegosa, J., I., & Costa, V.Ma� rquez,
1994, A&A, 285, 404Press, W. H., Teukolsky, S. A., Vetterling, W. T., & Flannery, B. P. 1988, in
Numerical Recipes in C (Cambridge : Cambridge Univ. Press)Rose, J. A. 1977, ApJ, 211, 311Rubin, V. C., Burstein, D., Ford, W. K., Jr., & Thonnard, N. 1985, ApJ,
289, 81Rubin, V. C., Ford, W. K., Jr., & Thonnard, N. 1980, ApJ, 238, 471Rubin, V. C., Ford, W. K., Jr., Thonnard, N., & Burstein, D. 1982, ApJ,
261, 439Rubin, V. C., Hunter, D. A., & Ford, W. K., Jr. 1991, ApJS, 76, 153Rubin, V. C., Waterman, A. H., & Kenney, J. D. P. 1999, AJ, 118, 236Rubin, V. C., Whitmore, B. C., & Ford, W. K., Jr. 1988, ApJ, 333, 522Shakhbazian, R. K. 1973, AstroÐzika, 9, 495Shimada, M., Ohyama, Y., Nishiura, S., Murayama, T., & Taniguchi, Y.
2000, AJ, 119, 2664Sofue, Y., Tutui, Y., Honma, M., Tomita, A., Takamiya, T., Koda, J., &
Takeda, Y. 1999, ApJ, 523, 136Tovmassian, H. M., & Chavushyan, V. H. 2000, AJ, 119, 1687Tovmassian, H. M., Martinez, O., & Tiersch, H. 1999, A&A, 348, 693
H., & White, S. D. M. 1999, MNRAS, 304, 254Vela� zquez,Whitmore, B. C., Forbes, D. A., & Rubin, V. C. 1988, ApJ, 333, 542Zepf, S. E., Whitmore, B. C., & Levison, H. F. 1991, ApJ, 383, 524