27
STUDENT EVALUATIONS AT WESTERN CAROLINA UNIVERSITY Procedural manual

STUDENT EVALUATIONS AT WESTERN CAROLINA UNIVERSITY
Procedural manual

2
STUDENT EVALUATIONS AT WESTERN CAROLINA UNIVERSITY
OVERVIEW
Western Carolina University uses an on-line course evaluation system, CoursEval™, for
gathering and disseminating the results of student evaluations. The process and procedures for
student evaluations are the same across the campus so that data collected can be as uniform as
possible. These policies and procedures are outlined in this short handbook. It is recommended
that all faculty review this document. Student evaluations are often referred to by the acronym
SAI (Student Assessment Instrument). This term refers to the on-line evaluations done using the
CoursEval system. SAI data are an integral part of the reappointment, tenure, and promotion
process at WCU.
3
Table of Contents
History and Background ................................................................................................................. 4
Evaluation Forms ............................................................................................................................ 5
Sections ....................................................................................................................................... 5 Form Types ................................................................................................................................. 6
Timeline .......................................................................................................................................... 7
CoursEval Specifics ........................................................................................................................ 8
What Students Receive and See .................................................................................................. 8 What Faculty Members Receive and See ................................................................................. 11
Getting Results .............................................................................................................................. 13
Frequently Asked Questions ......................................................................................................... 18 From Students ........................................................................................................................... 18 From Faculty ............................................................................................................................. 18
Questions or Problems .................................................................................................................. 21
Annotated Bibliography ................................................................................................................ 22

4
History and Background
Student Assessment Instruments are important to both faculty and administrators. The work
involved with reviewing and implementing an online process was considerable.
Previous SAIs used Scantron sheets as evaluation tools. The software system used for this
function became increasingly unreliable and finally obsolete. Additionally, the University of
North Carolina‟s General Administration mandated that all system universities create a uniform
mechanism for measuring performance.
A WCU SAI task force formed and agreed with the GA mandate: compiling university-wide data
on student evaluation of instruction would be useful. Any new SAI would need to demonstrate
uniform and universal bases for evaluation. The task force also recognized that WCU was
offering a greater diversity of courses than in the past. SAIs would need to be able to work for
many different types of courses and to offer enough flexibility to address the distinctive aspects
of WCU‟s many departments and programs.
The Faculty Senate investigated the SAI issue and generated a list of standardized questions to
be used in course evaluation. As a result, 12 different form types of SAI questions were created.
These form types applied to different types of courses. This system satisfied the two goals
outlined by the task force. A resolution adopting these 12 “master” questions was passed by the
Faculty Senate in 2005.
A task force was then created to review online course evaluation systems available through
current software used on campus. Online evaluation systems provide a uniform system for
gathering course evaluation information (thus meeting the GA mandate). The task force
determined the logistics of online course evaluation and investigated three potential solutions:
WebCT/WebCat, Banner, and Ultimate Survey. For logistical reasons (privacy, customization,
product support, etc.), these solutions were deemed as not feasible options.
A new task force was created to investigate outside vendors that could provide online SAI
systems. This task force selected Academic Management System‟s product CoursEval3. A pilot
program was conducted in Spring 2007 and included five volunteer departments: Psychology,
Political Science, Applied Criminology, Marketing and Business Law, and Chemistry & Physics.
The results were evaluated to determine the utility and efficacy of the online system. Upon
review, the pilot project was successful and implementation was recommended for campus-wide
use.
CoursEval became open to all faculty and all departments as of the 2008 – 2009 academic year.
Response rates have steadily increased and the University conducted a full validation study to
ensure that the results of these evaluations provide faculty, administration, and departments with
the necessary information. Oversight of the CoursEval process is now shared among Academic
Affairs, the Office of Institutional Research, and the Faculty Senate.

5
Evaluation Forms
Sections
The form is divided into five major sections reflecting the “seven dimensions of teaching” as
described in the Faculty Handbook:
Organization and Clarity
Enthusiasm and Intellectual Stimulation
Rapport and Respect
Feedback and Accessibility
Student Perceptions of Learning
Each section contains four statements. These statements vary by course format. Response
categories follow a Likert-type format with response options of:
Strongly Agree / Agree / Disagree / Strongly Disagree / N/A
A typical set of questions used for the “Standard Course” form is below:
Organization and Clarity
My instructor is well prepared for class meetings.
My instructor explains the subject matter clearly.
My instructor clearly communicates course goals and objectives.
My instructor answers questions appropriately.
Enthusiasm and Intellectual Stimulation
My instructor is enthusiastic about teaching this course.
My instructor presents the subject in an interesting manner.
My instructor stimulates my thinking.
My instructor motivates me to do my best work.
Rapport and Respect
My instructor helps students sufficiently with course-related issues.
My instructor is regularly available for consultation.
My instructor is impartial in dealing with students.
My instructor respects opinions different from his or her own.
Feedback and Accessibility
Assessment methods accurately assess what I have learned in this course.
Grades are assigned fairly.
The basis for assigning grades is clearly explained.
The instructor provides feedback on my progress in the course on a regular basis.

6
Student Perceptions of Learning
My instructor advances my knowledge of course content.
My instructor promotes my understanding of important conceptual themes.
My instructor enhances my capacity to communicate effectively about the course subject
matter.
My instructor encourages me to value new viewpoints related to the course.
To see all the formats and the questions being used in each format please refer to the following
website http://www.wcu.edu/8356.asp.
Form Types
The WCU Faculty Senate adapted the twenty statements from the Standard Course form to suit
the variety of courses being taught across campus. If a faculty member is dissatisfied with the
Standard Course form, there are eleven other possible formats including:
Activities Course
Hybrid Course
Independent Research Course
Internship, Practica, and Clinical Course
ITV-Delivered Course
Laboratory Course
Lecture/ Lab (Project) Course
Lecture/ Lab (Traditional) Course
Online Course
Seminar Course
Standard Course
Studio-Performance Course
Click on the links to see the statements available for each format.
The Standard Course form is the default option for student evaluations. Should a faculty
member desire to implement another assessment form for a course, he or she should consult with
his or her department head prior to the beginning of every term.
7
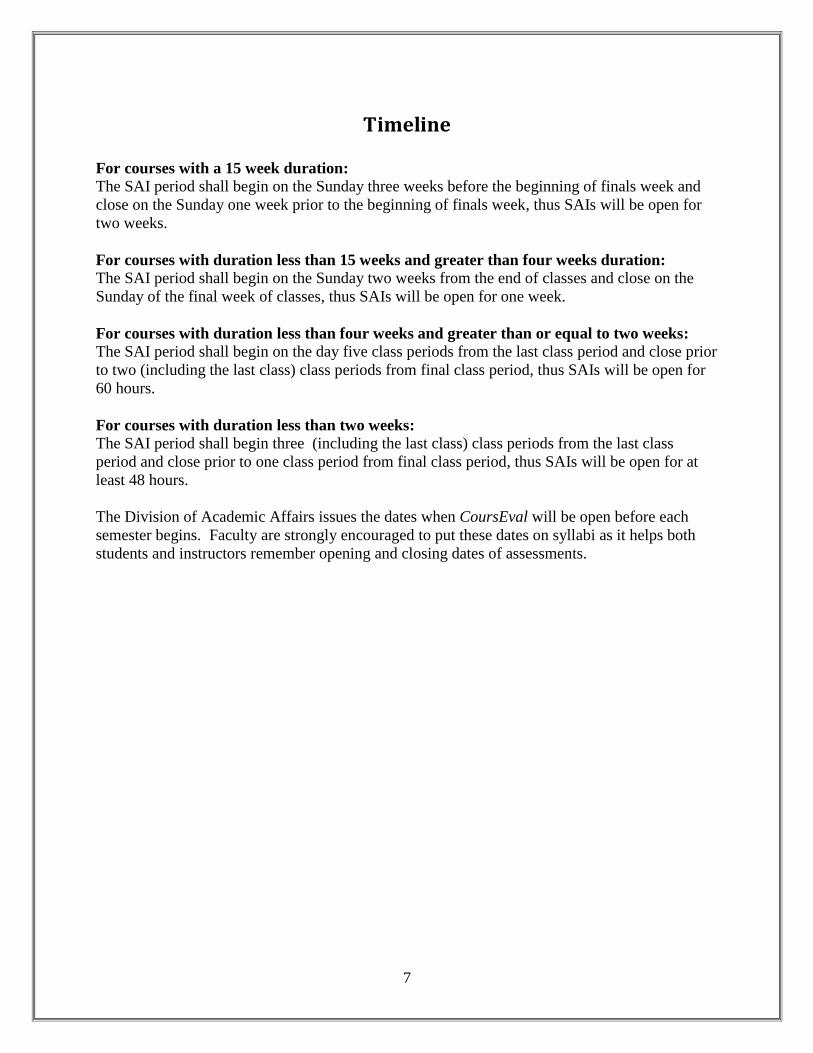
Timeline
For courses with a 15 week duration:
The SAI period shall begin on the Sunday three weeks before the beginning of finals week and
close on the Sunday one week prior to the beginning of finals week, thus SAIs will be open for
two weeks.
For courses with duration less than 15 weeks and greater than four weeks duration:
The SAI period shall begin on the Sunday two weeks from the end of classes and close on the
Sunday of the final week of classes, thus SAIs will be open for one week.
For courses with duration less than four weeks and greater than or equal to two weeks:
The SAI period shall begin on the day five class periods from the last class period and close prior
to two (including the last class) class periods from final class period, thus SAIs will be open for
60 hours.
For courses with duration less than two weeks:
The SAI period shall begin three (including the last class) class periods from the last class
period and close prior to one class period from final class period, thus SAIs will be open for at
least 48 hours.
The Division of Academic Affairs issues the dates when CoursEval will be open before each
semester begins. Faculty are strongly encouraged to put these dates on syllabi as it helps both
students and instructors remember opening and closing dates of assessments.
8
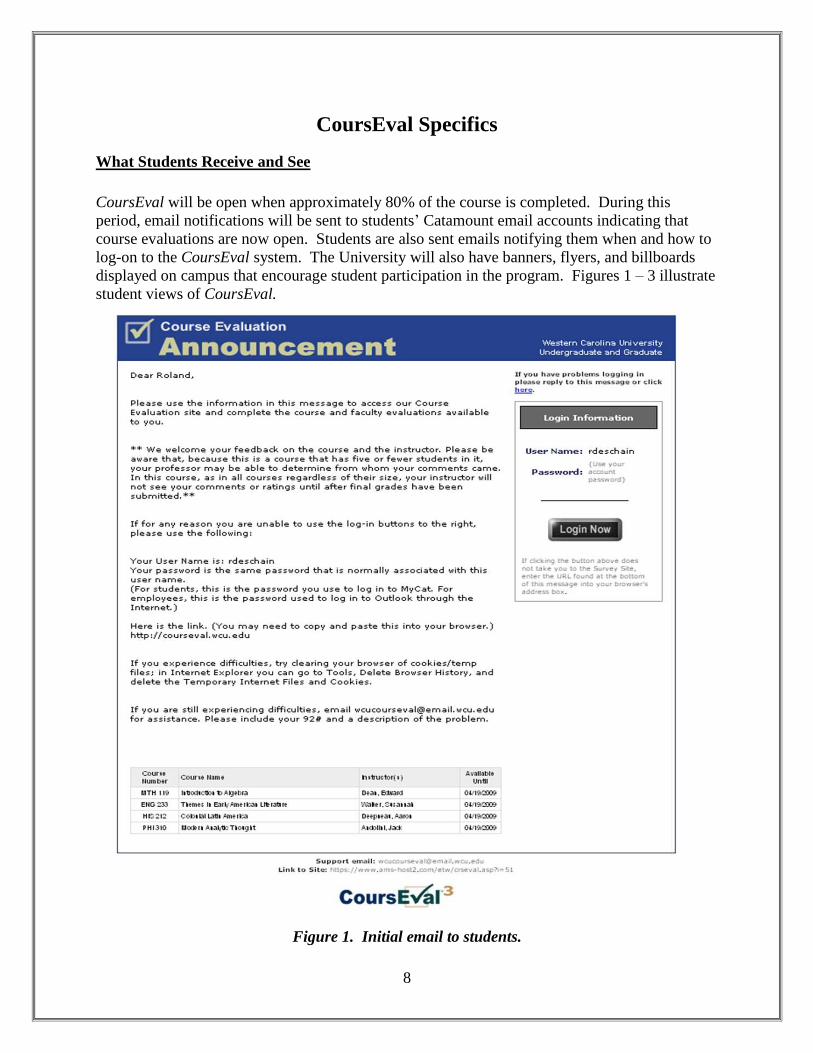
CoursEval Specifics
What Students Receive and See
CoursEval will be open when approximately 80% of the course is completed. During this
period, email notifications will be sent to students‟ Catamount email accounts indicating that
course evaluations are now open. Students are also sent emails notifying them when and how to
log-on to the CoursEval system. The University will also have banners, flyers, and billboards
displayed on campus that encourage student participation in the program. Figures 1 – 3 illustrate
student views of CoursEval.
Figure 1. Initial email to students.
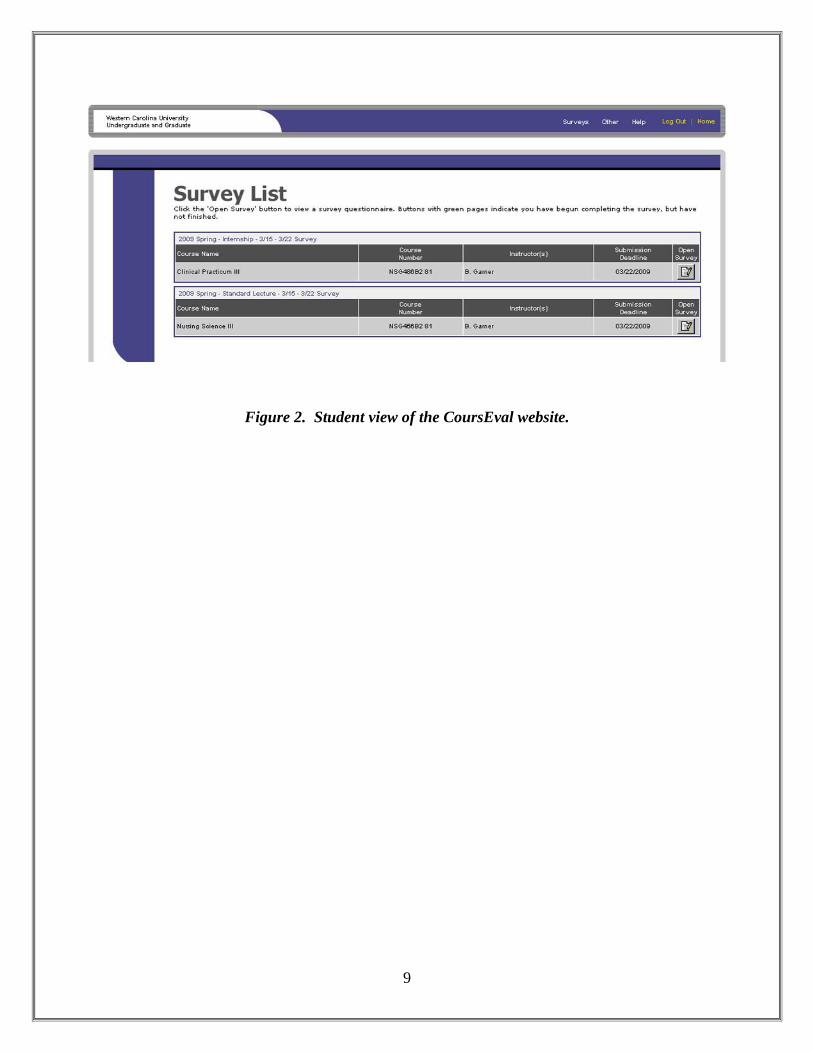
9
Figure 2. Student view of the CoursEval website.

10
Figure 3. Student view of survey.

11
Open-Ended Questions
The SAI also contains a section with the following two open-ended questions:
1. Describe the best aspects of this course.
2. Describe changes that could be made to improve the course.
Students have a text box in which to respond to these questions.
Unlike the scaled answers, these open-ended responses are viewable only by the specific faculty,
dean, and department head. These open-ended responses may be included in reappointment,
tenure, promotion, and annual evaluation documents. The inclusion of open-ended responses is
at the discretion of individual faculty.
The open-ended questions were selected to provide formative information, i.e. be constructive in
helping faculty to continue to improve teaching. Faculty may choose to use them as part of the
summative evaluation, however, that is not the primary purpose.
What Faculty Members Receive and See
An email is sent to the faculty member alerting him/her that CoursEval is open (Figure 4).
Approximately half way through the CoursEval period, a second email is sent to the faculty
member indicating the percentage of students that have responded at that time (Figure 5). At this
point, it is appropriate to remind students of the importance the CoursEval process and
encourage them to participate.
Figure 4. First faculty notification that CoursEval is open.

12
Figure 5. Email to the faculty indicating response rate.
After Final Grades Have Been Submitted:
After grades are submitted, emails will be sent from CoursEval notifying faculty that evaluations
are ready for review. The email contains password and user name information.
The Following Semester:
Evaluations from a given semester will be available for one academic year. Faculty are
encouraged to print out results for collegial review portfolios.
13
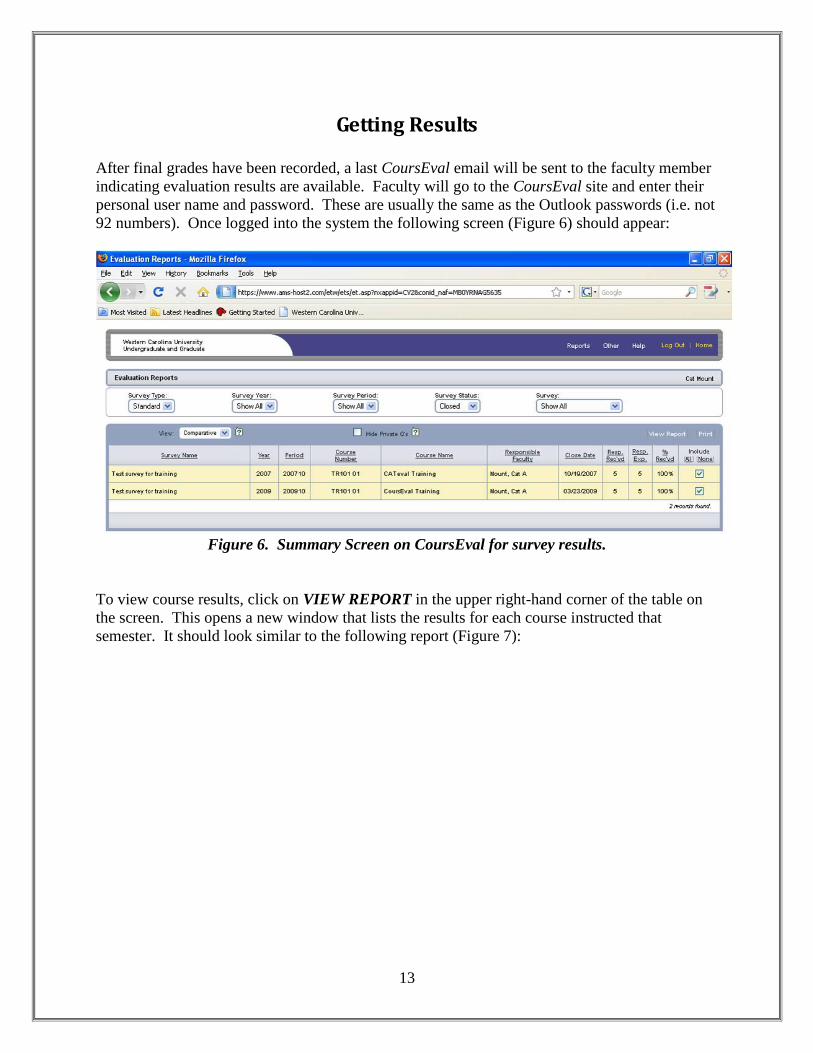
Getting Results
After final grades have been recorded, a last CoursEval email will be sent to the faculty member
indicating evaluation results are available. Faculty will go to the CoursEval site and enter their
personal user name and password. These are usually the same as the Outlook passwords (i.e. not
92 numbers). Once logged into the system the following screen (Figure 6) should appear:
Figure 6. Summary Screen on CoursEval for survey results.
To view course results, click on VIEW REPORT in the upper right-hand corner of the table on
the screen. This opens a new window that lists the results for each course instructed that
semester. It should look similar to the following report (Figure 7):
14
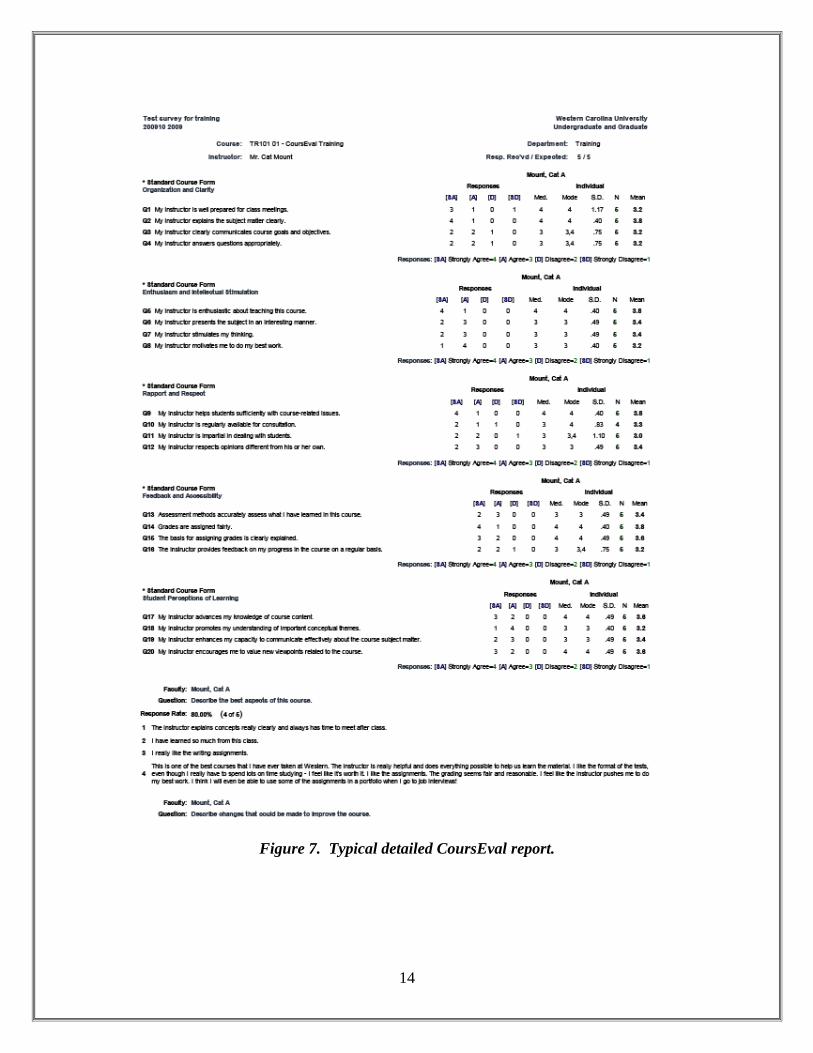
Figure 7. Typical detailed CoursEval report.
15
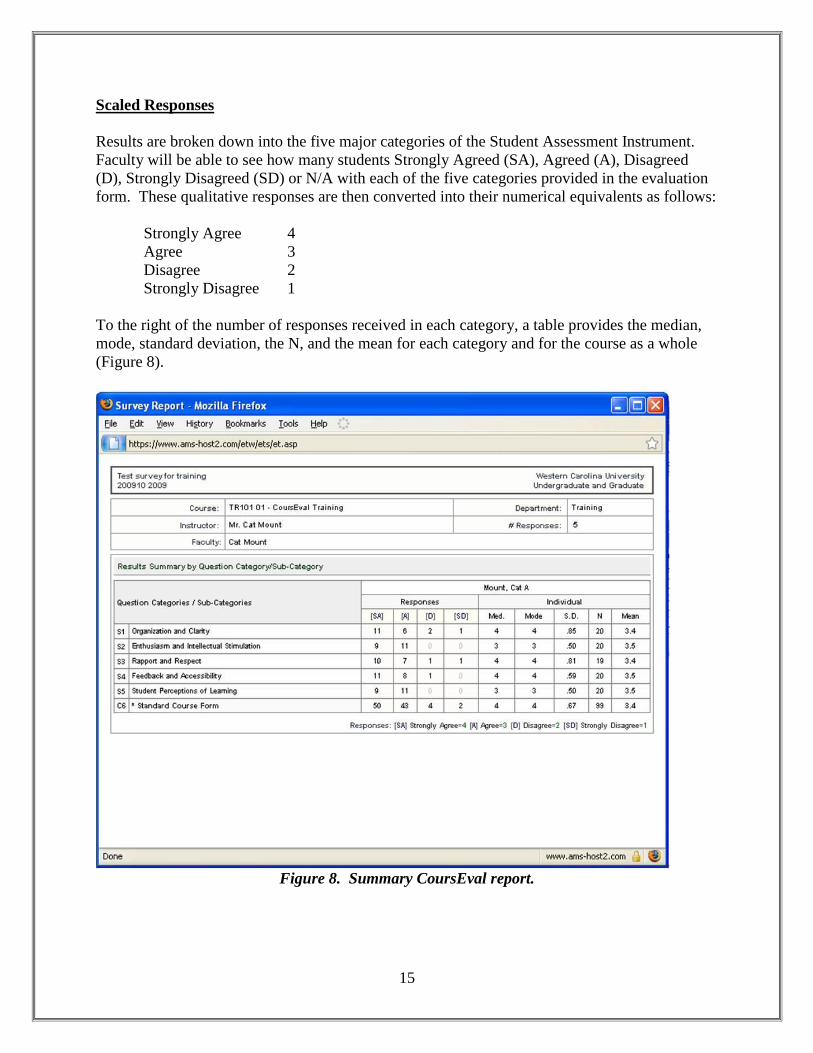
Scaled Responses
Results are broken down into the five major categories of the Student Assessment Instrument.
Faculty will be able to see how many students Strongly Agreed (SA), Agreed (A), Disagreed
(D), Strongly Disagreed (SD) or N/A with each of the five categories provided in the evaluation
form. These qualitative responses are then converted into their numerical equivalents as follows:
Strongly Agree 4
Agree 3
Disagree 2
Strongly Disagree 1
To the right of the number of responses received in each category, a table provides the median,
mode, standard deviation, the N, and the mean for each category and for the course as a whole
(Figure 8).
Figure 8. Summary CoursEval report.

16
Each category -labeled S1, S2, etc. - represents four individual questions. To get result
breakdowns by individual question, return to the main results page. In the upper right-hand
corner, there is a drop-down menu (Figure 9) labeled REPORTS. From this menu, click on
DETAILED RESULTS. One can also view the OVERALL REPORT (See instructions
under Open-Ended Responses below)
To print results, look to the upper right-hand side of the Main Screen for the word “PRINT”
(Figure 10). This will open a new window with a printable version of the report.
Figure 9. Retrieving reports from main results page.
Figure 10. Main results page.
Faculty should include these reports in reappointment, tenure, and promotion documents as well
as annual faculty evaluation dossiers. The exact format for including information in these
documents may vary by department and college.

17
Open-Ended Responses
To access student responses to open-ended questions, click on the box marked OVERALL
REPORT at the opening page (Figure 11). By clicking this, a full report can be viewed
(including scaled and open-ended responses) for each individual class. Color charts are also
provided. The responses to the open-ended questions follow the scaled responses on this report.
They appear in individual text boxes (Figure 12).
Figure 11. Individual course report page.
Figure 12. Open-ended student responses.
18
Frequently Asked Questions From Students
Why are student evaluations of faculty important?
Student evaluations are important for two reasons. First, individual instructors can
and do use student evaluations to improve their teaching. Second, student evaluations
are used as one of several factors in judging the teaching component in
reappointment, tenure, and promotion, as well as salary determinations.
What if I don't want to evaluate my courses?
While students are strongly urged to complete course evaluations, the process is
voluntary.
Will my evaluations be confidential?
All evaluations are kept strictly confidential.
When are the evaluations shared with faculty?
Faculty are only allowed access to the evaluation after all grades for the course have
been posted.
Can I see past evaluations of WCU faculty?
Access to past evaluations is not available.
From Faculty
How does the use of online course evaluation systems like CoursEval affect response
rates?
This answer depends a great deal on how the program is administered; the
bibliography of this manual has suggested readings. Variation in response rates exist.
Most research indicates that the initial phases of implementing an online course
evaluation system will result in lower response rates than traditional paper systems
(the average is approximately 30%; WCU had a pilot response in the mid-40's). It is
expected that response rates will improve over time for online evaluation methods.
What can I do to improve response rates?
Faculty can help increase response rates by announcing to students the change in the
evaluation system and leading a discussion in class on how their evaluations are used
by the individual faculty members and the University. The University will be using a
variety of methods to inform students about the new CoursEval system including
banners, posters, and radio announcements on WWCU-FM. In some departments
administrative staff or department heads may visit classes to make announcements to
the classes.
Computer labs are available on campus and faculty can reserve time to facilitate
evaluations as a class. Again, reminding students and identifying „time lines‟ on the
syllabi are beneficial. It is not acceptable policy to provide extra credit or incentives
to students for participation in the evaluation process.

19
How will the use of CoursEval affect the quality of student responses?
Available evidence indicates that no difference occurs in quantitative ratings
(comparing online and in class written evaluation formats), and that written
comments (both positive and negative) tend to be longer in online evaluations than on
evaluations filled out by hand in class.
How will I know if my students have filled out an evaluation?
Faculty members receive a midpoint report by email during the evaluation period.
The reports indicate the number of students who have yet to fill out the evaluations,
but will not identify individual students. Similar reports will go to department heads,
deans, and other stakeholders.
How long do students have to complete the evaluations using CoursEval?
The evaluation period will last from 2 weeks to one day depending on the length of
the course and takes place near the end of the course. For the more usual 15 week
courses, for example, course evaluation occurs in the two weeks prior to the last week
of classes.
What will be done with the evaluation results once they have been entered? Who gets to
see them?
Currently, the information is stored by Academic Management Systems, the company
that hosts CoursEval. The information will be accessible to the same people that get
to see faculty paper-based evaluations, i.e. individual faculty, department head, dean,
and other stakeholders. It will also be made available to the Office of Institutional
Research and Planning, but that data will be compiled and distributed without
attribution to individual instructors. Faculty will be able to read student responses
and view summary reports (sample reports ) after the evaluation period ends and
grades are posted.
How do I know to which type of student assessment instrument (SAI), i.e., lecture, lab,
seminar, etc., my course is assigned?
Each course is initially assigned the standard course format as the default SAI
instrument. It is the responsibility of each faculty member to review the tool and
select the appropriate SAI form for his/her individual course subject to the review of
his/her department head who has the responsibility to enter the selected form into the
system. The form selected for each course shall be made available to the faculty
member teaching the course prior to its implementation.
20
Do I have to use CoursEval? Can I use supplementary evaluations?
Yes to both questions. The UNC PACE evaluation process has identified the paper-
based course evaluation system as an expense that can be reduced dramatically
through the use of technology. Thus, the paper system is no longer operational at
WCU and there are no other options available. Also, with the growing number of
courses being taught online, these evaluations are the only option.
Faculty are invited to supplement the data from the online evaluation forms with
other instruments; however, the costs of such supplements will be borne by the
department or the individual faculty member.

21
Questions or Problems
What do I do if I have a problem with or question about CoursEval?
If the problem is largely technical in nature (login problems, difficulty viewing certain screens,
or problematic software installation), contact WCU‟s Office of Assessment which administers
the CoursEval system.
Contact Information:
Dr. Melissa Canady Wargo
Director of Assessment
H.F.R. Administration Building 450
Western Carolina University
Cullowhee, NC 28723
(828) 227-3082
Email: [email protected]
If the problem or question relates to using the data to improve teaching scores, faculty are urged
to discuss the matter with the appropriate department head. The Coulter Center is also available
to the faculty member for guidance and assistance.
Contact Information:
Dr. Anna McFadden
Director and Professor
Office: Hunter 182
Phone: 2093
E-Mail: [email protected]
Web page: http://paws.wcu.edu/amcfadden
22
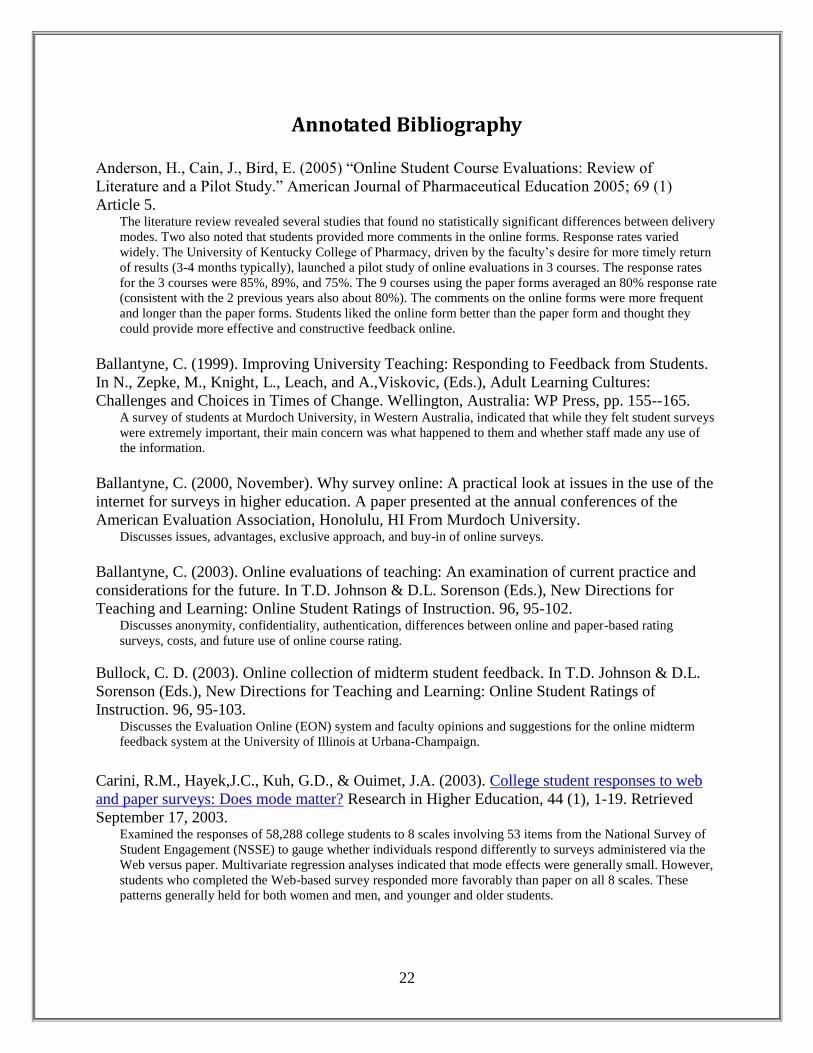
Annotated Bibliography
Anderson, H., Cain, J., Bird, E. (2005) “Online Student Course Evaluations: Review of
Literature and a Pilot Study.” American Journal of Pharmaceutical Education 2005; 69 (1)
Article 5. The literature review revealed several studies that found no statistically significant differences between delivery
modes. Two also noted that students provided more comments in the online forms. Response rates varied
widely. The University of Kentucky College of Pharmacy, driven by the faculty‟s desire for more timely return
of results (3-4 months typically), launched a pilot study of online evaluations in 3 courses. The response rates
for the 3 courses were 85%, 89%, and 75%. The 9 courses using the paper forms averaged an 80% response rate
(consistent with the 2 previous years also about 80%). The comments on the online forms were more frequent
and longer than the paper forms. Students liked the online form better than the paper form and thought they
could provide more effective and constructive feedback online.
Ballantyne, C. (1999). Improving University Teaching: Responding to Feedback from Students.
In N., Zepke, M., Knight, L., Leach, and A.,Viskovic, (Eds.), Adult Learning Cultures:
Challenges and Choices in Times of Change. Wellington, Australia: WP Press, pp. 155--165. A survey of students at Murdoch University, in Western Australia, indicated that while they felt student surveys
were extremely important, their main concern was what happened to them and whether staff made any use of
the information.
Ballantyne, C. (2000, November). Why survey online: A practical look at issues in the use of the
internet for surveys in higher education. A paper presented at the annual conferences of the
American Evaluation Association, Honolulu, HI From Murdoch University. Discusses issues, advantages, exclusive approach, and buy-in of online surveys.
Ballantyne, C. (2003). Online evaluations of teaching: An examination of current practice and
considerations for the future. In T.D. Johnson & D.L. Sorenson (Eds.), New Directions for
Teaching and Learning: Online Student Ratings of Instruction. 96, 95-102. Discusses anonymity, confidentiality, authentication, differences between online and paper-based rating
surveys, costs, and future use of online course rating.
Bullock, C. D. (2003). Online collection of midterm student feedback. In T.D. Johnson & D.L.
Sorenson (Eds.), New Directions for Teaching and Learning: Online Student Ratings of
Instruction. 96, 95-103. Discusses the Evaluation Online (EON) system and faculty opinions and suggestions for the online midterm
feedback system at the University of Illinois at Urbana-Champaign.
Carini, R.M., Hayek,J.C., Kuh, G.D., & Ouimet, J.A. (2003). College student responses to web
and paper surveys: Does mode matter? Research in Higher Education, 44 (1), 1-19. Retrieved
September 17, 2003. Examined the responses of 58,288 college students to 8 scales involving 53 items from the National Survey of
Student Engagement (NSSE) to gauge whether individuals respond differently to surveys administered via the
Web versus paper. Multivariate regression analyses indicated that mode effects were generally small. However,
students who completed the Web-based survey responded more favorably than paper on all 8 scales. These
patterns generally held for both women and men, and younger and older students.
23
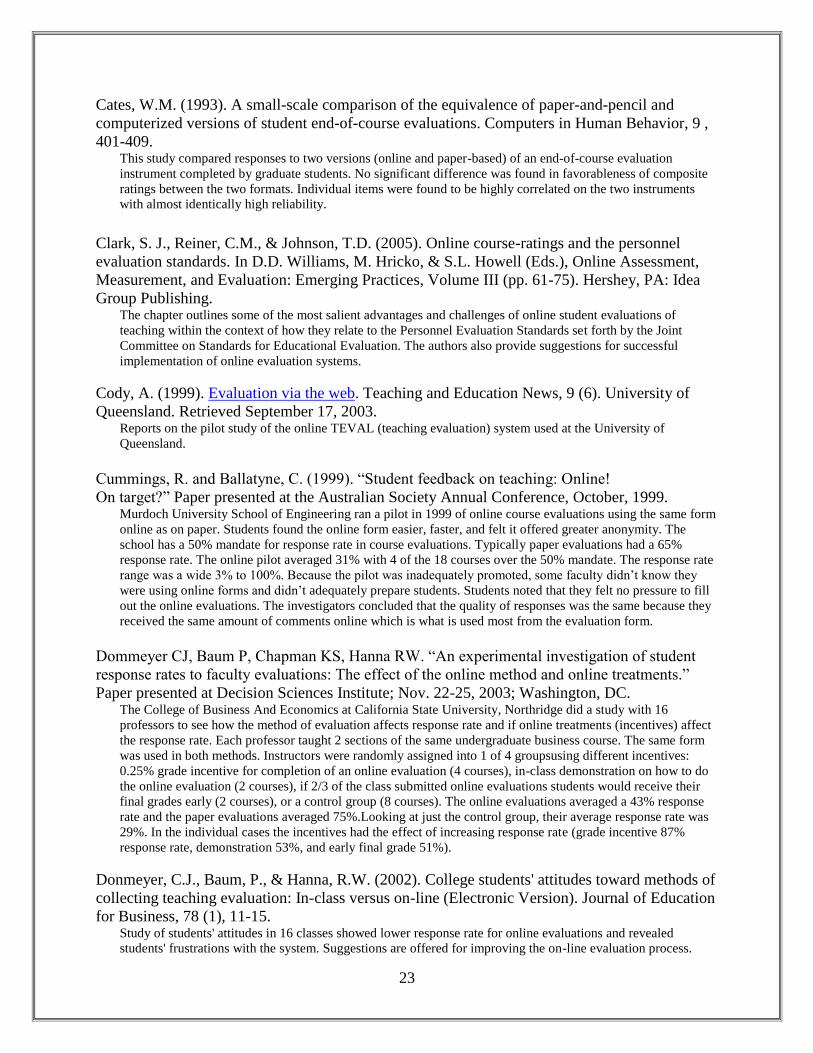
Cates, W.M. (1993). A small-scale comparison of the equivalence of paper-and-pencil and
computerized versions of student end-of-course evaluations. Computers in Human Behavior, 9 ,
401-409. This study compared responses to two versions (online and paper-based) of an end-of-course evaluation
instrument completed by graduate students. No significant difference was found in favorableness of composite
ratings between the two formats. Individual items were found to be highly correlated on the two instruments
with almost identically high reliability.
Clark, S. J., Reiner, C.M., & Johnson, T.D. (2005). Online course-ratings and the personnel
evaluation standards. In D.D. Williams, M. Hricko, & S.L. Howell (Eds.), Online Assessment,
Measurement, and Evaluation: Emerging Practices, Volume III (pp. 61-75). Hershey, PA: Idea
Group Publishing. The chapter outlines some of the most salient advantages and challenges of online student evaluations of
teaching within the context of how they relate to the Personnel Evaluation Standards set forth by the Joint
Committee on Standards for Educational Evaluation. The authors also provide suggestions for successful
implementation of online evaluation systems.
Cody, A. (1999). Evaluation via the web. Teaching and Education News, 9 (6). University of
Queensland. Retrieved September 17, 2003. Reports on the pilot study of the online TEVAL (teaching evaluation) system used at the University of
Queensland.
Cummings, R. and Ballatyne, C. (1999). “Student feedback on teaching: Online!
On target?” Paper presented at the Australian Society Annual Conference, October, 1999. Murdoch University School of Engineering ran a pilot in 1999 of online course evaluations using the same form
online as on paper. Students found the online form easier, faster, and felt it offered greater anonymity. The
school has a 50% mandate for response rate in course evaluations. Typically paper evaluations had a 65%
response rate. The online pilot averaged 31% with 4 of the 18 courses over the 50% mandate. The response rate
range was a wide 3% to 100%. Because the pilot was inadequately promoted, some faculty didn‟t know they
were using online forms and didn‟t adequately prepare students. Students noted that they felt no pressure to fill
out the online evaluations. The investigators concluded that the quality of responses was the same because they
received the same amount of comments online which is what is used most from the evaluation form.
Dommeyer CJ, Baum P, Chapman KS, Hanna RW. “An experimental investigation of student
response rates to faculty evaluations: The effect of the online method and online treatments.”
Paper presented at Decision Sciences Institute; Nov. 22-25, 2003; Washington, DC. The College of Business And Economics at California State University, Northridge did a study with 16
professors to see how the method of evaluation affects response rate and if online treatments (incentives) affect
the response rate. Each professor taught 2 sections of the same undergraduate business course. The same form
was used in both methods. Instructors were randomly assigned into 1 of 4 groupsusing different incentives:
0.25% grade incentive for completion of an online evaluation (4 courses), in-class demonstration on how to do
the online evaluation (2 courses), if 2/3 of the class submitted online evaluations students would receive their
final grades early (2 courses), or a control group (8 courses). The online evaluations averaged a 43% response
rate and the paper evaluations averaged 75%.Looking at just the control group, their average response rate was
29%. In the individual cases the incentives had the effect of increasing response rate (grade incentive 87%
response rate, demonstration 53%, and early final grade 51%).
Donmeyer, C.J., Baum, P., & Hanna, R.W. (2002). College students' attitudes toward methods of
collecting teaching evaluation: In-class versus on-line (Electronic Version). Journal of Education
for Business, 78 (1), 11-15. Study of students' attitudes in 16 classes showed lower response rate for online evaluations and revealed
students' frustrations with the system. Suggestions are offered for improving the on-line evaluation process.
24
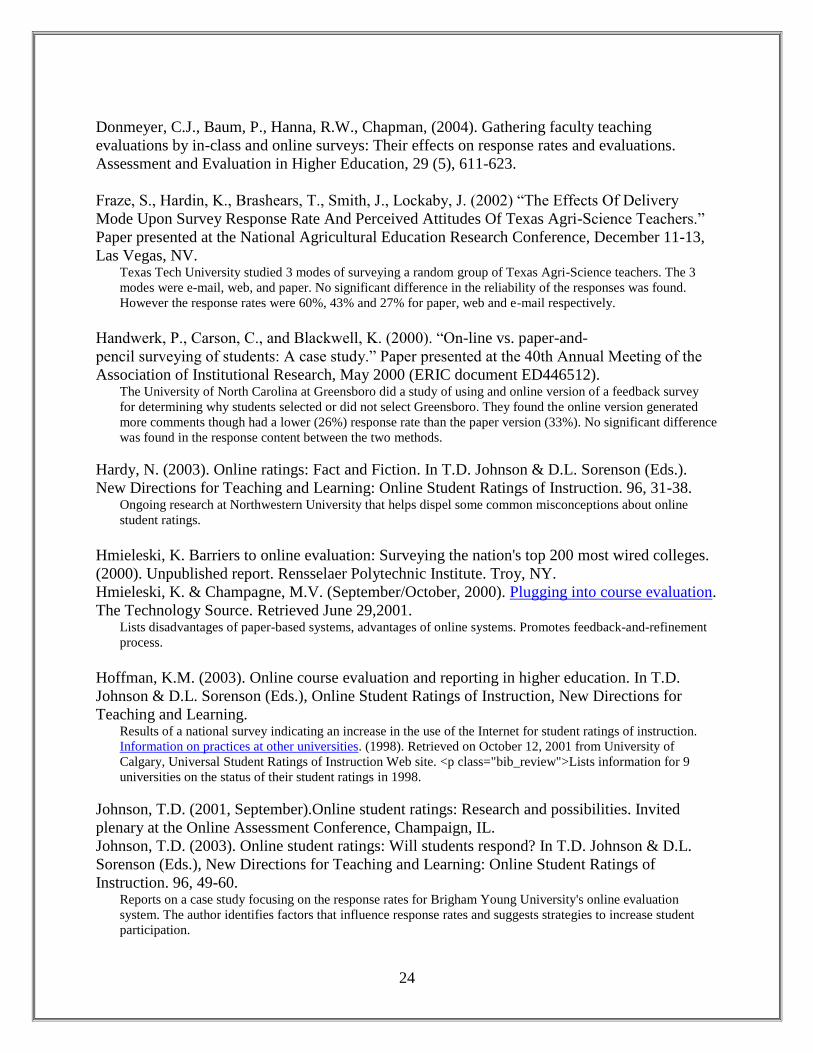
Donmeyer, C.J., Baum, P., Hanna, R.W., Chapman, (2004). Gathering faculty teaching
evaluations by in-class and online surveys: Their effects on response rates and evaluations.
Assessment and Evaluation in Higher Education, 29 (5), 611-623.
Fraze, S., Hardin, K., Brashears, T., Smith, J., Lockaby, J. (2002) “The Effects Of Delivery
Mode Upon Survey Response Rate And Perceived Attitudes Of Texas Agri-Science Teachers.”
Paper presented at the National Agricultural Education Research Conference, December 11-13,
Las Vegas, NV. Texas Tech University studied 3 modes of surveying a random group of Texas Agri-Science teachers. The 3
modes were e-mail, web, and paper. No significant difference in the reliability of the responses was found.
However the response rates were 60%, 43% and 27% for paper, web and e-mail respectively.
Handwerk, P., Carson, C., and Blackwell, K. (2000). “On-line vs. paper-and-
pencil surveying of students: A case study.” Paper presented at the 40th Annual Meeting of the
Association of Institutional Research, May 2000 (ERIC document ED446512). The University of North Carolina at Greensboro did a study of using and online version of a feedback survey
for determining why students selected or did not select Greensboro. They found the online version generated
more comments though had a lower (26%) response rate than the paper version (33%). No significant difference
was found in the response content between the two methods.
Hardy, N. (2003). Online ratings: Fact and Fiction. In T.D. Johnson & D.L. Sorenson (Eds.).
New Directions for Teaching and Learning: Online Student Ratings of Instruction. 96, 31-38. Ongoing research at Northwestern University that helps dispel some common misconceptions about online
student ratings.
Hmieleski, K. Barriers to online evaluation: Surveying the nation's top 200 most wired colleges.
(2000). Unpublished report. Rensselaer Polytechnic Institute. Troy, NY.
Hmieleski, K. & Champagne, M.V. (September/October, 2000). Plugging into course evaluation.
The Technology Source. Retrieved June 29,2001. Lists disadvantages of paper-based systems, advantages of online systems. Promotes feedback-and-refinement
process.
Hoffman, K.M. (2003). Online course evaluation and reporting in higher education. In T.D.
Johnson & D.L. Sorenson (Eds.), Online Student Ratings of Instruction, New Directions for
Teaching and Learning. Results of a national survey indicating an increase in the use of the Internet for student ratings of instruction.
Information on practices at other universities. (1998). Retrieved on October 12, 2001 from University of
Calgary, Universal Student Ratings of Instruction Web site. <p class="bib_review">Lists information for 9
universities on the status of their student ratings in 1998.
Johnson, T.D. (2001, September).Online student ratings: Research and possibilities. Invited
plenary at the Online Assessment Conference, Champaign, IL.
Johnson, T.D. (2003). Online student ratings: Will students respond? In T.D. Johnson & D.L.
Sorenson (Eds.), New Directions for Teaching and Learning: Online Student Ratings of
Instruction. 96, 49-60. Reports on a case study focusing on the response rates for Brigham Young University's online evaluation
system. The author identifies factors that influence response rates and suggests strategies to increase student
participation.

25
Johnson, T.D. & Sorenson, D.L. (Eds.) (2003). New directions for teaching and learning: Online
student ratings of instruction, 96. San Francisco, CA: Jossey-Bass. This issue of NDTL examines current practice and deals with various issues surrounding online student ratings
of instruction including the increase in use of the Internet, common misconceptions, psychometric properties,
response rates, online reporting of results, costs, online collection of midterm student feedback, and
considerations for the future.
Layne B.H., DeCristofor J.R., McGinty D (1999). “Electronic versus traditional student ratings
of instruction.” Res Higher Educ. 1999; 40:221-32. At a southeastern university 66 courses made up of 2453 students did a comparison of response effects between
paper-and-pencil and online using the same form. Half did online and half did paper-and-pencil forms. The
online response rate was 47% and the traditional group was 60%. Also, 76% of the online forms provided
comments compared to 50% of the traditional forms. No significant difference was found in methods.
Liegle, J. and McDonald, D. (2004). “Lessons Learned From Online vs. Paper-based Computer
Information Students‟ Evaluation System” Paper (refereed) presented at 21st Annual Information
Systems Education Conference. Georgia State University College of Business ran a voluntary pilot from 2002 to 2003using an identical online
version of their paper course evaluation form in the Department of Computer Information Systems. Faculty
feared an online form would yield lower scores and lower response rates. In particular, the fear was that few
students would submit online evaluations, poor students would “take revenge” on the faculty and good students
wouldn‟t bother. The paper form had a 67% response rate and the online form had an 82% response rate. This
likely due to the fact that the CIS department had easy access to computer labs for students to take the
evaluations online. Using a question on teacher effectiveness, the study found no significant difference between
the methods. Good students participated in the same numbers and weaker students did fewer online evaluations.
Matz, C. (1999). “Administration of web versus paper surveys: Mode effects and
response rates.” Masters Research Paper, University of North Carolina at Chapel Hill. (ERIC
document ED439694). In a survey of academic reference librarians in North Carolina, Matz found no significant difference in response
contents between the methods used. The online form had a 33% response rate and the paper form had a 43%
response rate.
McCormack, C., Applebee, A., & Donnan, P. (2003, July/August). Opening a can of worms: A
conversation about the ethics of online student evaluation of teaching. The Technology Source.
Retrieved August 18, 2003.
Monsen, S., Woo, W., Mahan, C. Miller, G. & W. “Online Course Evaluations: Lessons
Learned.” Presentation at The CALI Conference for Law School Computing 2005. Yale Law started online course evaluations in 2001 with a less than 20% response rate. The current 8-question
form is run by student representatives and has a 90% response rate. Students cannot see their grades until they
fill out the evaluation. Northwestern University School of Law started online course evaluations in 2004. So far
they have a 68% response rate which compares to a 70-80% paper response rate. Northwestern is against using
any penalties (withholding information from a student until they fill out an evaluation). The University of
Denver Sturm College started online course evaluations in 2002 with a pilot of 10 courses. The pilot had an
83% response rate. Continuing into 2003 the pilot expanded to 80 courses (with an 81% response rate) and then
expanded to all of their offerings (with a 64% response rate). Currently they maintain a response rate around
70%. Duke Law started online course evaluations in 2003 when their scantron machine broke and the expense
of replacing was too great. They proposed a goal of 70% response rate and used the same form online. The first
term averaged a 66% response rate (with 29% of the 82 courses reaching the 70% goal). In spring 2004 the
average was 60% (with 30% of the 119 courses reaching the 70% goal). In fall 2004 the average was 52% (with
8% of the 93 courses reaching the 70% goal). In spring 2005, after dropping non-law students from the pool, the
26
average was 67% (with 41% of the 117 courses reaching the 70% goal). The school is considering several
penalties for failure to fill out an evaluation – withholding registration, withholding grades, or withholding free
printing.
Norris, J., Conn, C. (2005). “Investigating strategies for increasing student response rates to
online-delivered course evaluations.” Quarterly Review of Distance Education 2005; 6 (1) p13-
32 (ProQuest document ID 975834871). This paper reports the findings of 2 studies done at Northern Arizona State University. The first study looked at
historic data from 2000-2002 to examine student responses to online course evaluations in 1108 course sections.
This group had an average response rate of 31%. A follow-up questionnaire was sent to 50 faculty in the group
to explore what strategies improved response rate. These results informed the second study on 39 online course
sections and 21 sections of a required freshman face-to-face course. The second study used some basic
strategies (no penalty strategies) in the implementation of the online course evaluations: 2 weeks before the end
of the course the URL to evaluation was posted in the course management system, an announcement containing
a statement of course evaluation value and due date was sent in a method appropriate to the class (email, online
syllabus or discussion board), and a reminder email was sent 1 week before the class ended containing the URL
and due date. The 39 online course sections averaged a 74% response rate and the 21 face-to-face courses
averaged a 67% response rate. In addition, 11 sections of the face-to-face course used paper evaluations and
received a 83% response rate. These suggestions are very similar to the emerging findings from the TLT
Group‟s BeTA project.
Sax, L., Gilmartin, S., Keup, J., Bryant, A., and Plecha, M. (2002). Findings from
the 2001 pilot administration of Your First College Year (YFCY): National norms. Higher
Education Research Institute, University of California. The YFCY distributed its survey that assesses student development during the first year in college using 3
methods: online, online or paper, and paper. In a pool of 57 schools, 16 used the alternative methods of
distribution. The study found no significant difference in responses between the methods. The response rate
overall was 21%. The online only method response rate was 17% and the online or paper group had a 24%
response rate.
Schawitch, M. (2005) “Online Course Evaluations: One Institute‟s Success in Transitioning from
a Paper Process to a Completely Electronic Process!” Presentation at the Association for
Institutional Research Forum, June 2005. The Rose-Hulman Institute of Technology piloted an online course evaluation in 2002 with a small group of
faculty. Over the academic year the pilot had a 70% response rate. 77% of students preferred the online mode
and faculty reacted positively to the pilot. In 2003 the entire campus adopted the online form. Over the 3 terms,
the online evaluations had response rates of 86%, 78% and 67%. In 2004 the 3 terms had 75%, 71% and 67%.
Historically paper evaluations had an 85-87% response rate. They are investigating various incentive
possibilities.
Thorpe, S. (2002) “Online Student Evaluation of Instruction: An Investigation of Non-Response
Bias.” Paper presented at the 42nd
Annual Forum of the Association of Institutional Research,
June 2002. Drexel University studied whether significant differences exist in student responses to course evaluations given
on paper and online in 3 courses. Response rates in the 3 classes for paper and online (respectively) were 37%
and 45%, 44% and 50%, 70& and 37%. In comparing students who responded to the evaluations across the 3
courses the study found that women were more likely than men to respond, students who earned higher grades
were more likely to respond, and students with a higher overall GPA were more likely to respond. For two
courses the online evaluations had a slightly higher average item rating. For the other course 2 significant
differences were found: students doing the online evaluation were less likely to participate actively and
contribute thoughtfully during class and to attend class when compared to the paper evaluation group. But the
responses overall were not significantly different.

27
These annotations were compiled by Scott Krajewski, Augsburg College,
[email protected] and by OnSet: Online Student Evaluation of Teaching in Higher
Education portal.
Student Evaluations at Western Carolina University: Procedural Manual
Edited and Revised by Faculty Affairs Council
Published April 2009


