A fatigue damage indicator parameter for P91 chromium-molybdenumalloy steel and fatigue pre-damaged P54T carbon steel
G. SOCHA1 and L. DIETRICH2
1Institute of Aviation, Al. Krakowska 110/114, 02-256 Warsaw, Poland 2Department for Strength of Materials, Institute of Fundamental TechnologicalResearch, Polish Academy of Sciences, Pawińskiego 5B, 02-106 Warsaw, Poland
Received Date: 7 February 2013; Accepted Date: 27 July 2013; Published Online: 23 October 2013
ABSTRACT Two grades of structural steel were subjected to fully reversible, constant stress amplitudecyclic loading. The local strain response of the material was measured and recorded duringthe test, with the applied testing technique enabling the monitoring of hysteresis loopvariation for the narrowest cross-section of the hourglass specimen. Changes in hysteresisloop width, representing the local inelastic response of the material, were recorded in orderto monitor the density of structural imperfections. Material ratcheting behaviour wasobserved as changes in the mean strain for selected load cycles. Ratcheting was attributedto local deformation of the material in the vicinity of imperfections such as voids or inclu-sions, as well as deformation induced by the propagation of microcracks. Definitions of adamage indicator parameter and damage parameter were proposed. The fatigue behaviourof the two investigated grades of steel was finally illustrated in the form of damage curves fordifferent stress amplitudes and for undamaged and fatigue pre-damaged material.
N, n = number of load cycleNf = number of cycles to failureR = cycle asymmetry ratioεi = inelastic strain range for load cycleεm =mean strain for load cycleφ = damage indicator parameterσa = stress amplitude
INTRODUCT ION
In the two hundred years since fatigue in metal alloys wasfirst investigated,1 numerous studies have been carriedout with the aim of identifying the physical phenomenaunderlying the accumulation of fatigue damage and lead-ing to final failure of construction components. Althoughsignificant progress has been achieved, with the results ofinvestigations published in many papers, the basic proce-dure for the estimation of fatigue life in constructioncomponents is still based on Wöhler’s proposition.1 Thisis because of the fact that observations of changes ininternal structure have revealed the huge complexity of
physical phenomena underlying fatigue damage accu-mulation. Many attempts have been made to relate iden-tified phenomena to changes in the macroscopicallyobserved mechanical properties of the investigated alloys.A summary regarding the elaborated damage models canbe found in a number of review books2 and papers.3–5
Because finding relationships between changes in mate-rial mechanical characteristics and the physical phen-omena underlying fatigue damage accumulation is verydifficult, none of the mathematical models developed inthis way have as yet been accepted by the engineeringcommunity for the estimation of component fatigue life.
One obvious result of fatigue damage accumulation isthe formation of dominant crack. The rapid developmentof fracture mechanics theory and testing methods haveCorrespondence: G. Socha. E-mail: [email protected]
enabled engineers to accurately predict propagationtimes for the dominant crack, observed using modern in-spection methods. Progress in the technique has allowedobservation not only of surface cracks (using various kindsof microscopy and well-developed nondestructive ins-pection methods), but also of internal cracks via the useof X-ray tomography, as well as magnetic or ultrasonictechniques.6,7 Because most engineering materials havebeen observed to exhibit some type of defect even beforeany service load is applied, a number of researchers haveconcluded that all fatigue damage accumulation processescan be described as the propagation of a crack from aninternal or surface imperfection, which acts as a crackstarter.8 Mathematical models enabling the estimation offatigue life in terms of crack propagation time were subse-quently proposed.9 However, this approach, apparentlyeasy to apply in the case of a real component under serviceconditions using modern computer software for crackpropagation simulation, did not lead to good results. Manyresearchers theorised that the reason for this was thedifference in behaviour of the small cracks (microstructurelevel) and macrocracks propagating during standard testssuch as da/dN. As a result, it was concluded that materialparameters determined during standard tests performedaccording to standard procedure on testing machines byusing standard specimens cannot be applied to the simula-tion of microcrack behaviour. Various models have beenproposed to simulate the initiation and propagation ofcracks at microlevel, but none were successfully appliedto engineering practice. Moreover, it has never beenproven that such an approach can be successfully appliedto all phases of the fatigue damage accumulation process,with the crack initiation phase especially difficult todescribe using the laws of fracture mechanics.
For many engineering materials, especially modernalloys, no internal imperfections acting as crack startersare present before service. For such materials, crackinitiation is often preceded by local plastic deformation.In this case, dislocation models of fatigue crack initiationmust be employed.10,11 Imperfections in the crystalstructure (such as dislocation) move in the stress field,creating new imperfections and forming slip bands.Imperfection density increases until the moment when itis locally high enough to initiate material decohesion inthe applied stress field. This phenomenon, at least forlow stacking fault energy alloys such as austenitic steel,can be observed macroscopically as an increase in theinelastic response of the material.12
Changes in the hysteresis loop of materials subject tocyclic load have been reported in many papers,3,4,6,12–14
with most of the results inconsistent because of the factthat during the damage accumulation process, both thecreation of crystal structure imperfections and crackpropagation take place. Some researchers have associated
an increase in hysteresis loop width (inelastic response ofthe material) with material damage accumulation.15,16
Damage caused by the movement of dislocations leadingto the creation of new imperfections in crystal structurecan exhibit a homogenising tendency in the stressed bulkof the material. Crack propagation is, on the other hand,a local phenomenon, starting in a certain area of thematerial and developing from there. Superposition ofthe two phenomena can result in a complex picture, espe-cially if traditional strain-measuring methods are applied.For example, a mechanical extensometer or strain gaugecan measure only the average strain for the measurementbase; attempting to apply this technique to the obser-vation of local phenomena would make consistent resultsvery difficult to achieve. This is why more advancedexperimental methods examining fatigue damage accu-mulation are necessary in order to obtain a clear pictureof the phenomenon.
A series of papers17–19 published by a French researchgroup represent a good example of extensive experim-ental analysis resulting in the formulation of a mathemat-ical model enabling fatigue life prediction. Assumptionsfor the model formulation were prepared in an earlierpaper20 based on in situ scanning electron microscopeobservations made during fatigue and tensile tests ofInconel 718, with two mechanisms of crack initiationproposed. The first of these, for coarse-grained material,was the initiation of microcracking along slip bands andthe propagation of microcracks smaller than grain size tothe grain boundary (Stage I). For this stage, Tanaka andMura’s dislocation model10 was employed to calculatecrack initiation life. The second mechanism, for fine-grained material, was the simple propagation of cracksfrom existing imperfections. For this stage (Stage II), allmaterial life was assumed to be in crack propagation mode,with Tomkins model9 used to calculate fatigue life interms of the time required to propagate the crack frominitial to critical size. The developed framework wasthen employed to investigate fatigue behaviour in 9Cr-1Mo (P91) steel pre-damaged by creep, relaxation oroxidation.17–19
In order to be successfully applied in engineeringpractice, any proposed model requires a set of parametersto be determined for the investigated material to estimatecrack initiation time. Another method of establishingcrack initiation time is based on direct observation ofdamage-induced changes in the mechanical characteris-tics of the material. One successful example involving thistype of experimental analysis of fatigue damage accumu-lation was published in earlier papers by one of thepresent authors.12,13 In this case, strain was measuredfor the narrowest cross-section of a small hourglass-shaped specimen via the use of a transversal extensome-ter, with both stress and strain recorded for selected
hysteresis loops, and changes in inelastic strain during theload cycle used as the damage indicator parameter. Amore detailed description of the testing technique canbe found in the aforementioned papers. The approachworked very well for the analysis of austenitic and ferriticsteel, with a consistent picture of the investigated phe-nomenon obtained and a mathematical model proposedfor the estimation of fatigue life. However, the modelwas limited to the first phase of the process when thegeneration of imperfections was dominated by cyclic,local plastic deformation (Stage I). The formation of adominant crack was considered to represent the finalmoment of fatigue life; from this point on, fracturemechanics rules had to be applied in order to estimatecrack propagation time.
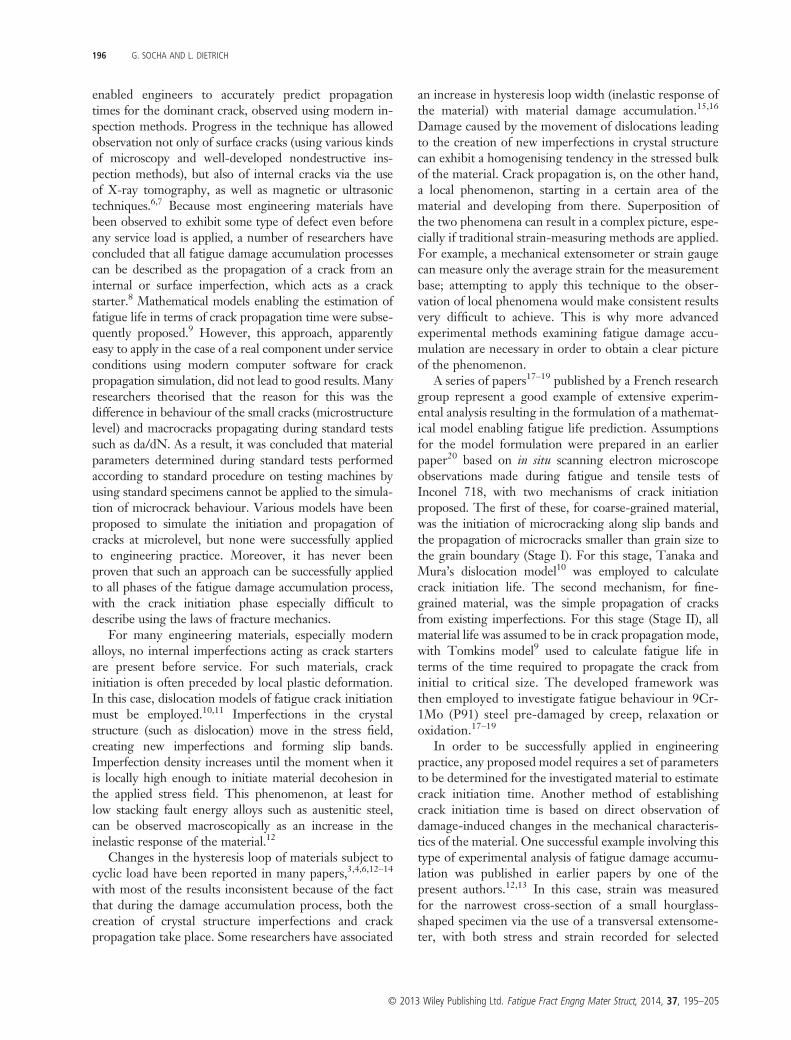
Deformation of the construction component underservice load is usually not considered to contribute tomaterial damage. Such deformation in elastic–plasticmaterials is the result of dislocation slip and does notdecrease material strength, instead, potentially evenstrengthening the material because of the strain harden-ing effect. This is all true when the material is loadedabove the yield limit, and dislocations can move in theconsidered volume of the construction component. Ifthe material is loaded in elastic range, theoretically nodislocation slip occurs. In practice, however, certainimperfections can be found in all real structural materials,including hard inclusions, grain boundaries and evenmicrocracks and voids. Such imperfections always act asstress raisers, causing local plastic deformation of thematerial in their vicinity. For some configurations ofimperfections, if the material is subject to fully reversibleload cycles, deformation around an imperfection canaccumulate. This phenomenon is observed macroscopi-cally as the ratcheting effect. As can be seen in Fig. 1, inthe case of hard inclusions, this process can even lead todebonding and the formation of material discontinuities(Fig. 1b). For a high-cycle fatigue regime, this effect is
represented by variation in the mean strain for recordedhysteresis loops. Theoretically, in the case of a materialwithout any imperfections, no ratcheting is observed inthe crack initiation phase. For real structural alloys,especially pre-damaged examples, ratcheting always takesplace. Local deformation in the vicinity of materialimperfections contributes significantly to damage accu-mulation; any proper definition of the damage indicatorparameter should therefore reflect this fact.
The aim of the present paper was to investigatechanges in the mechanical characteristics of undamagedas well as fatigue pre-damaged material, for which localdeformation and microcrack propagation dominatesfrom the beginning of the process. On the basis of theobtained results, a damage indicator parameter definitionwill be proposed that is applicable to all phases of thefatigue damage process for both undamaged and pre-damaged materials. This damage indicator should be help-ful for future experimental investigation of both crackinitiation and propagation phases.
Investigated materials
Two grades of steel were investigated within the frame-work of the reported testing program. The first of thesewas martensitic chromium-molybdenum alloy steel P91(9Cr-1Mo-V according to ASTM A335/335M), com-monly used for high temperature applications such as hotsteam pipelines in power plants. The chemical composi-tion of the alloy is presented in Table 1. This steel wasinvestigated in as-delivered condition without any servicehistory, with its basic mechanical properties determinedvia the use of a static tension test as follows: elasticity limit455MPa, 0.2% offset; yield limit 671MPa; tensilestrength 900MPa. Based on the determined static proper-ties, a test matrix was prepared for the fatigue testing pro-gram, with stress amplitudes ranging from 400 to 680MPaand a cycle asymmetry ratio R=�1.
Fig. 1 Structural imperfections in P54T steel: (a) hard inclusions under specimen surface, (b) enlarged picture of hard inclusion.
The second material under investigation was theferritic-perlitic carbon steel ASTM A551/551M-08,commonly used in the construction of railway wheelsand other rapid transport applications. This steel wasdelivered for testing after service and was thus expectedto be strongly fatigue defected. The chemical composi-tion of the alloy, denoted P54T according to Polishstandard PN-84/H-84027/06, is displayed in Table 2.Static characteristics were determined via the use of astatic tension test and the following parameters calcu-lated: elasticity limit 400MPa; tensile strength 750MPa.As with the first material, a test matrix was prepared forthis grade of steel, with stress amplitudes ranging from320 to 410MPa, and a cycle asymmetry ratio R =�1.All reported tests were performed at room temperature.
As the two grades of steel differed in terms of chemicalcomposition and structure, a comparison of their fatiguebehaviour was made in order to identify the mechanismsresponsible for damage accumulation.
Experimental technique
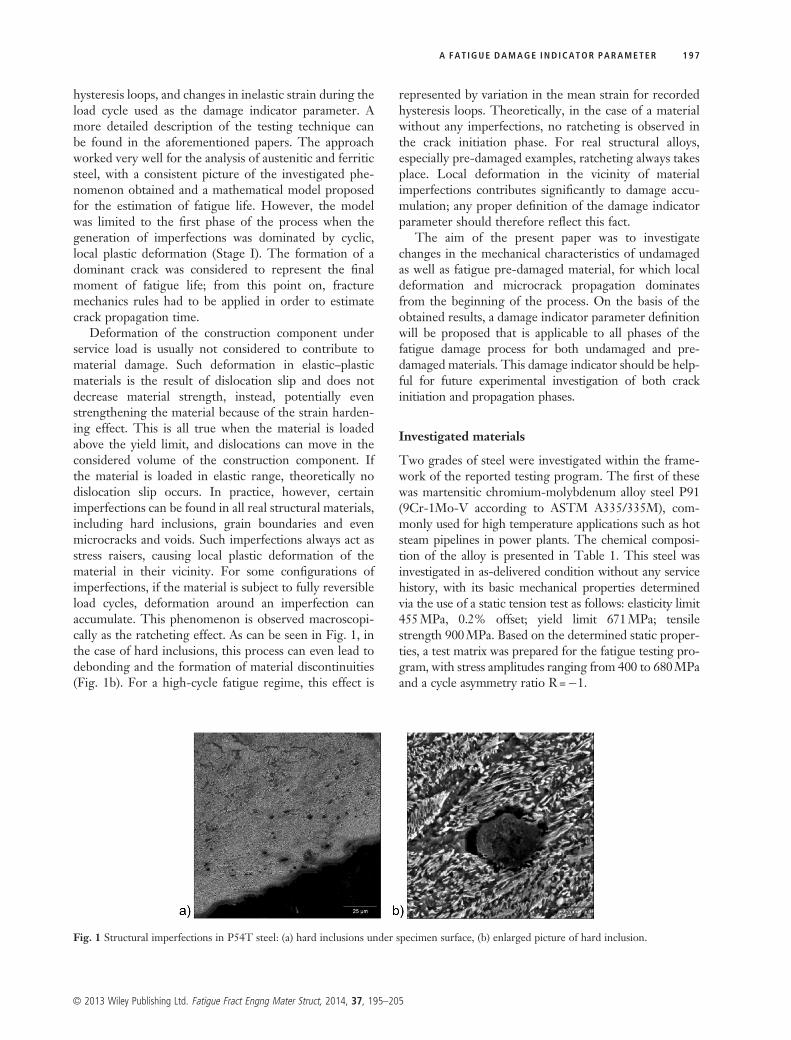
The specimen design shown in Fig. 2 is the same as thatreported in the two aforementioned papers.12,13 Speci-mens were held using a patented, self-aligning grippingsystem enabling the user to compensate for misalignment(shift of the axes between upper and lower pull rods) ofthe machine load train. The hourglass shape of the gaugepart of the specimen, with minimum diameter 4mm,
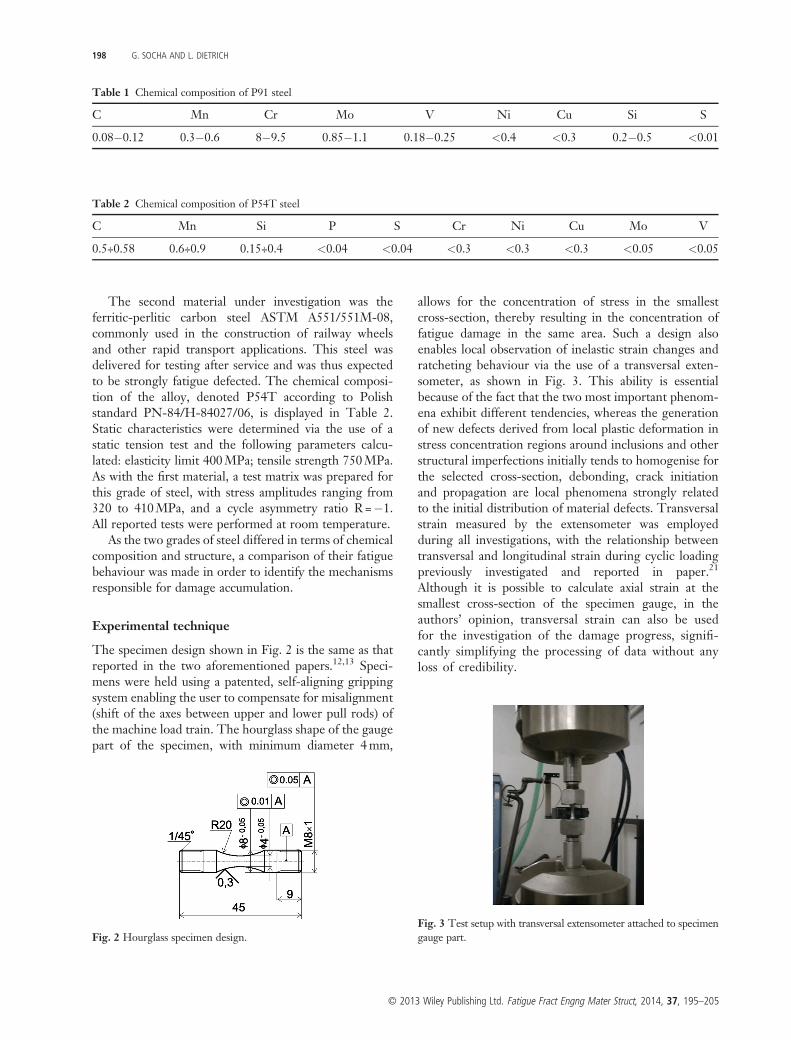
allows for the concentration of stress in the smallestcross-section, thereby resulting in the concentration offatigue damage in the same area. Such a design alsoenables local observation of inelastic strain changes andratcheting behaviour via the use of a transversal exten-someter, as shown in Fig. 3. This ability is essentialbecause of the fact that the two most important phenom-ena exhibit different tendencies, whereas the generationof new defects derived from local plastic deformation instress concentration regions around inclusions and otherstructural imperfections initially tends to homogenise forthe selected cross-section, debonding, crack initiationand propagation are local phenomena strongly relatedto the initial distribution of material defects. Transversalstrain measured by the extensometer was employedduring all investigations, with the relationship betweentransversal and longitudinal strain during cyclic loadingpreviously investigated and reported in paper.21
Although it is possible to calculate axial strain at thesmallest cross-section of the specimen gauge, in theauthors’ opinion, transversal strain can also be usedfor the investigation of the damage progress, signifi-cantly simplifying the processing of data without anyloss of credibility.
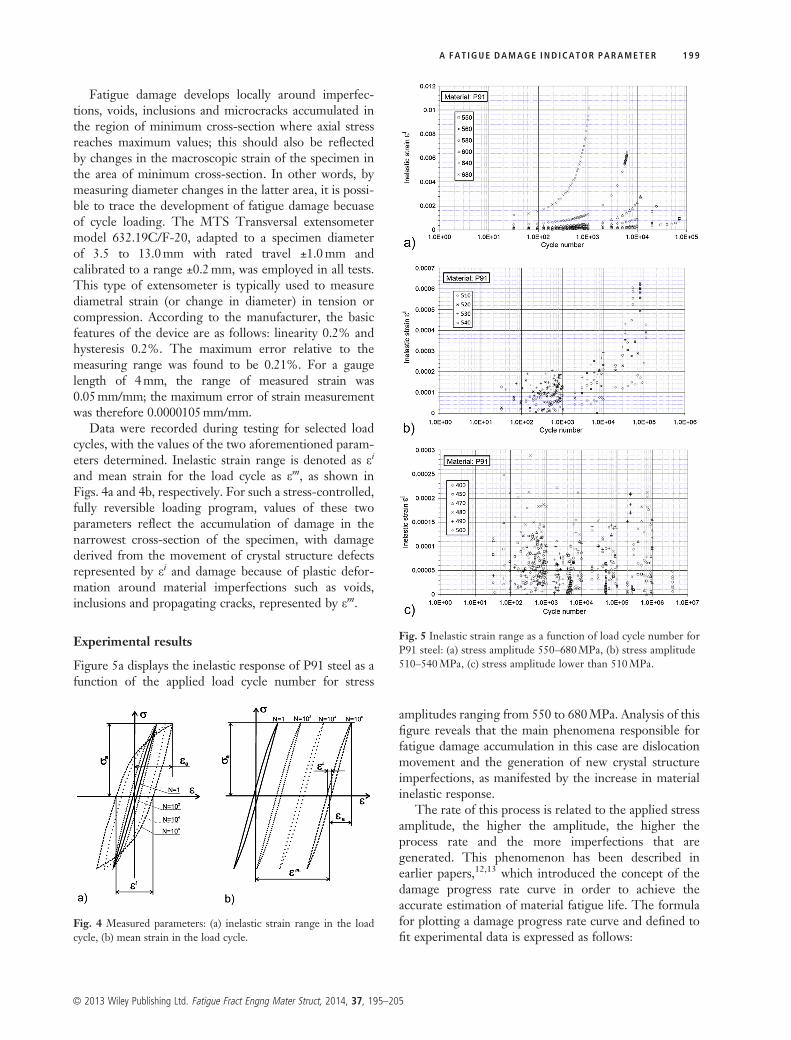
Fatigue damage develops locally around imperfec-tions, voids, inclusions and microcracks accumulated inthe region of minimum cross-section where axial stressreaches maximum values; this should also be reflectedby changes in the macroscopic strain of the specimen inthe area of minimum cross-section. In other words, bymeasuring diameter changes in the latter area, it is possi-ble to trace the development of fatigue damage becuaseof cycle loading. The MTS Transversal extensometermodel 632.19C/F-20, adapted to a specimen diameterof 3.5 to 13.0mm with rated travel ±1.0mm andcalibrated to a range ±0.2mm, was employed in all tests.This type of extensometer is typically used to measurediametral strain (or change in diameter) in tension orcompression. According to the manufacturer, the basicfeatures of the device are as follows: linearity 0.2% andhysteresis 0.2%. The maximum error relative to themeasuring range was found to be 0.21%. For a gaugelength of 4mm, the range of measured strain was0.05mm/mm; the maximum error of strain measurementwas therefore 0.0000105mm/mm.
Data were recorded during testing for selected loadcycles, with the values of the two aforementioned param-eters determined. Inelastic strain range is denoted as εi
and mean strain for the load cycle as εm, as shown inFigs. 4a and 4b, respectively. For such a stress-controlled,fully reversible loading program, values of these twoparameters reflect the accumulation of damage in thenarrowest cross-section of the specimen, with damagederived from the movement of crystal structure defectsrepresented by εi and damage because of plastic defor-mation around material imperfections such as voids,inclusions and propagating cracks, represented by εm.
Experimental results
Figure 5a displays the inelastic response of P91 steel as afunction of the applied load cycle number for stress
amplitudes ranging from 550 to 680MPa. Analysis of thisfigure reveals that the main phenomena responsible forfatigue damage accumulation in this case are dislocationmovement and the generation of new crystal structureimperfections, as manifested by the increase in materialinelastic response.
The rate of this process is related to the applied stressamplitude, the higher the amplitude, the higher theprocess rate and the more imperfections that aregenerated. This phenomenon has been described inearlier papers,12,13 which introduced the concept of thedamage progress rate curve in order to achieve theaccurate estimation of material fatigue life. The formulafor plotting a damage progress rate curve and defined tofit experimental data is expressed as follows:
Fig. 4 Measured parameters: (a) inelastic strain range in the loadcycle, (b) mean strain in the load cycle.
Fig. 5 Inelastic strain range as a function of load cycle number forP91 steel: (a) stress amplitude 550–680MPa, (b) stress amplitude510–540MPa, (c) stress amplitude lower than 510MPa.
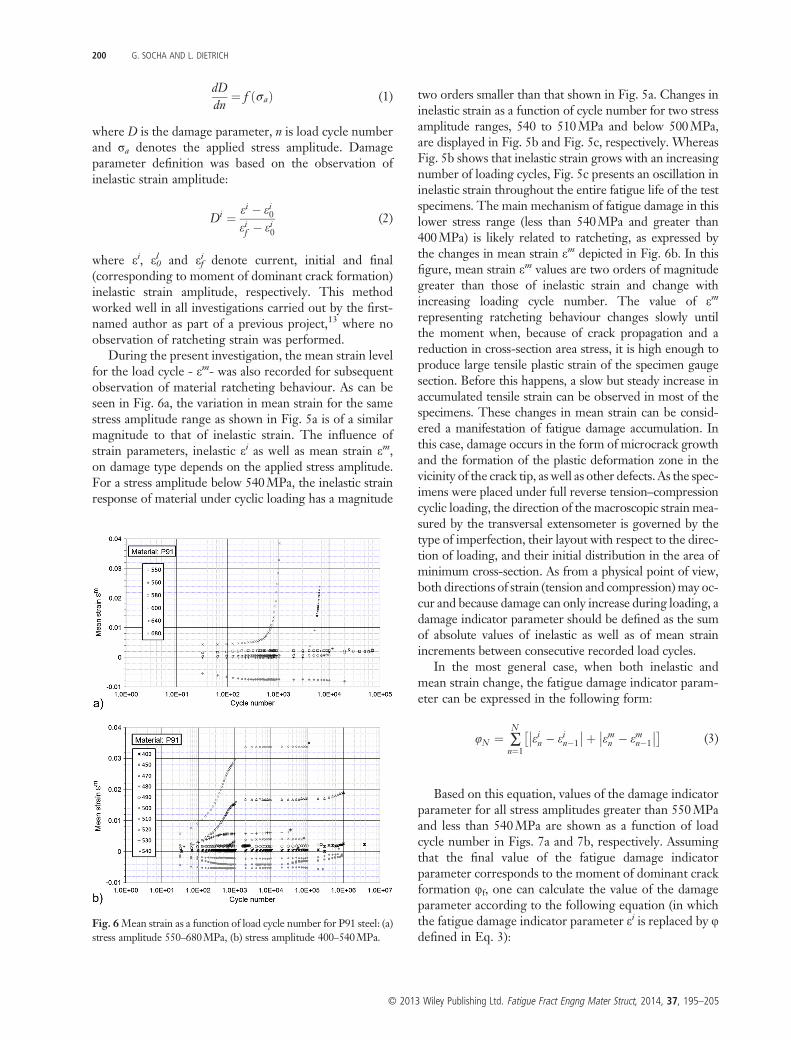
where D is the damage parameter, n is load cycle numberand σa denotes the applied stress amplitude. Damageparameter definition was based on the observation ofinelastic strain amplitude:
Di ¼ εi � εi0εif � εi0
(2)
where εi, εl0 and εif denote current, initial and final(corresponding to moment of dominant crack formation)inelastic strain amplitude, respectively. This methodworked well in all investigations carried out by the first-named author as part of a previous project,13 where noobservation of ratcheting strain was performed.
During the present investigation, the mean strain levelfor the load cycle - εm- was also recorded for subsequentobservation of material ratcheting behaviour. As can beseen in Fig. 6a, the variation in mean strain for the samestress amplitude range as shown in Fig. 5a is of a similarmagnitude to that of inelastic strain. The influence ofstrain parameters, inelastic εi as well as mean strain εm,on damage type depends on the applied stress amplitude.For a stress amplitude below 540MPa, the inelastic strainresponse of material under cyclic loading has a magnitude
two orders smaller than that shown in Fig. 5a. Changes ininelastic strain as a function of cycle number for two stressamplitude ranges, 540 to 510MPa and below 500MPa,are displayed in Fig. 5b and Fig. 5c, respectively. WhereasFig. 5b shows that inelastic strain grows with an increasingnumber of loading cycles, Fig. 5c presents an oscillation ininelastic strain throughout the entire fatigue life of the testspecimens. The main mechanism of fatigue damage in thislower stress range (less than 540MPa and greater than400MPa) is likely related to ratcheting, as expressed bythe changes in mean strain εm depicted in Fig. 6b. In thisfigure, mean strain εm values are two orders of magnitudegreater than those of inelastic strain and change withincreasing loading cycle number. The value of εm
representing ratcheting behaviour changes slowly untilthe moment when, because of crack propagation and areduction in cross-section area stress, it is high enough toproduce large tensile plastic strain of the specimen gaugesection. Before this happens, a slow but steady increase inaccumulated tensile strain can be observed in most of thespecimens. These changes in mean strain can be consid-ered a manifestation of fatigue damage accumulation. Inthis case, damage occurs in the form of microcrack growthand the formation of the plastic deformation zone in thevicinity of the crack tip, as well as other defects. As the spec-imens were placed under full reverse tension–compressioncyclic loading, the direction of the macroscopic strain mea-sured by the transversal extensometer is governed by thetype of imperfection, their layout with respect to the direc-tion of loading, and their initial distribution in the area ofminimum cross-section. As from a physical point of view,both directions of strain (tension and compression)may oc-cur and because damage can only increase during loading, adamage indicator parameter should be defined as the sumof absolute values of inelastic as well as of mean strainincrements between consecutive recorded load cycles.
In the most general case, when both inelastic andmean strain change, the fatigue damage indicator param-eter can be expressed in the following form:
φN ¼ ∑N
n¼1εin � εin�1
�� ��þ εmn � εmn�1
�� ��� �(3)
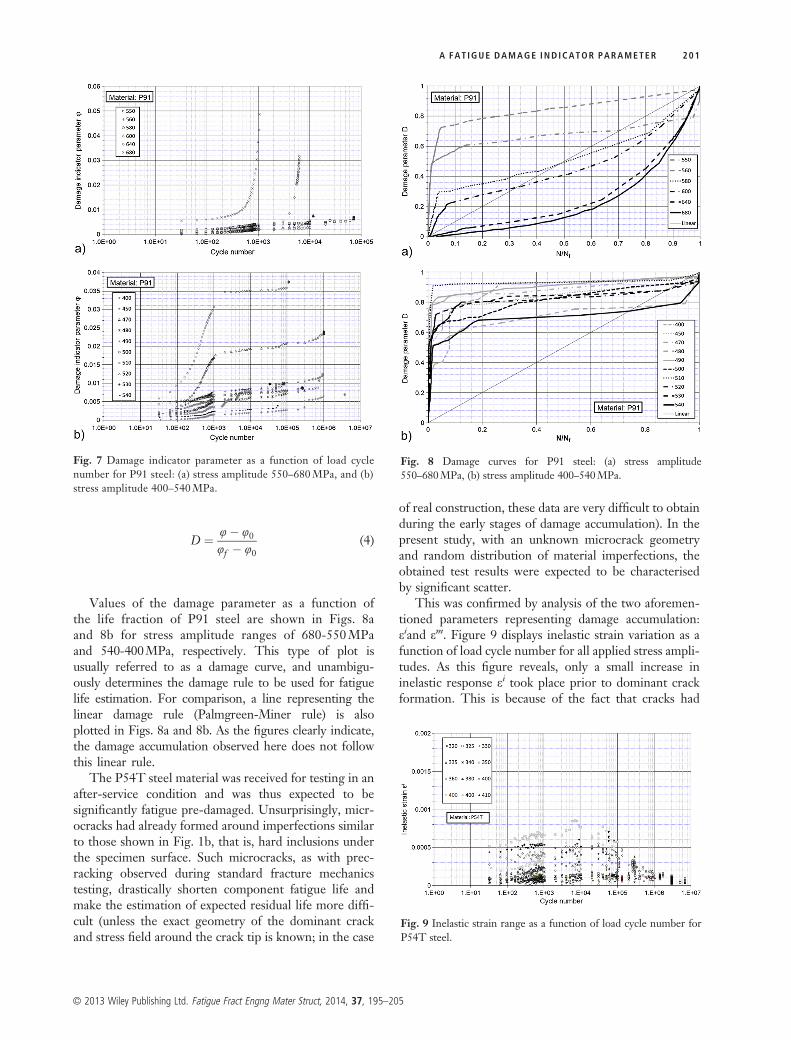
Based on this equation, values of the damage indicatorparameter for all stress amplitudes greater than 550MPaand less than 540MPa are shown as a function of loadcycle number in Figs. 7a and 7b, respectively. Assumingthat the final value of the fatigue damage indicatorparameter corresponds to the moment of dominant crackformation φf, one can calculate the value of the damageparameter according to the following equation (in whichthe fatigue damage indicator parameter εi is replaced by φdefined in Eq. 3):
Fig. 6Mean strain as a function of load cycle number for P91 steel: (a)stress amplitude 550–680MPa, (b) stress amplitude 400–540MPa.
Values of the damage parameter as a function ofthe life fraction of P91 steel are shown in Figs. 8aand 8b for stress amplitude ranges of 680-550MPaand 540-400MPa, respectively. This type of plot isusually referred to as a damage curve, and unambigu-ously determines the damage rule to be used for fatiguelife estimation. For comparison, a line representing thelinear damage rule (Palmgreen-Miner rule) is alsoplotted in Figs. 8a and 8b. As the figures clearly indicate,the damage accumulation observed here does not followthis linear rule.
The P54T steel material was received for testing in anafter-service condition and was thus expected to besignificantly fatigue pre-damaged. Unsurprisingly, micr-ocracks had already formed around imperfections similarto those shown in Fig. 1b, that is, hard inclusions underthe specimen surface. Such microcracks, as with prec-racking observed during standard fracture mechanicstesting, drastically shorten component fatigue life andmake the estimation of expected residual life more diffi-cult (unless the exact geometry of the dominant crackand stress field around the crack tip is known; in the case
of real construction, these data are very difficult to obtainduring the early stages of damage accumulation). In thepresent study, with an unknown microcrack geometryand random distribution of material imperfections, theobtained test results were expected to be characterisedby significant scatter.
This was confirmed by analysis of the two aforemen-tioned parameters representing damage accumulation:εiand εm. Figure 9 displays inelastic strain variation as afunction of load cycle number for all applied stress ampli-tudes. As this figure reveals, only a small increase ininelastic response εi took place prior to dominant crackformation. This is because of the fact that cracks had
Fig. 7 Damage indicator parameter as a function of load cyclenumber for P91 steel: (a) stress amplitude 550–680MPa, and (b)stress amplitude 400–540MPa.
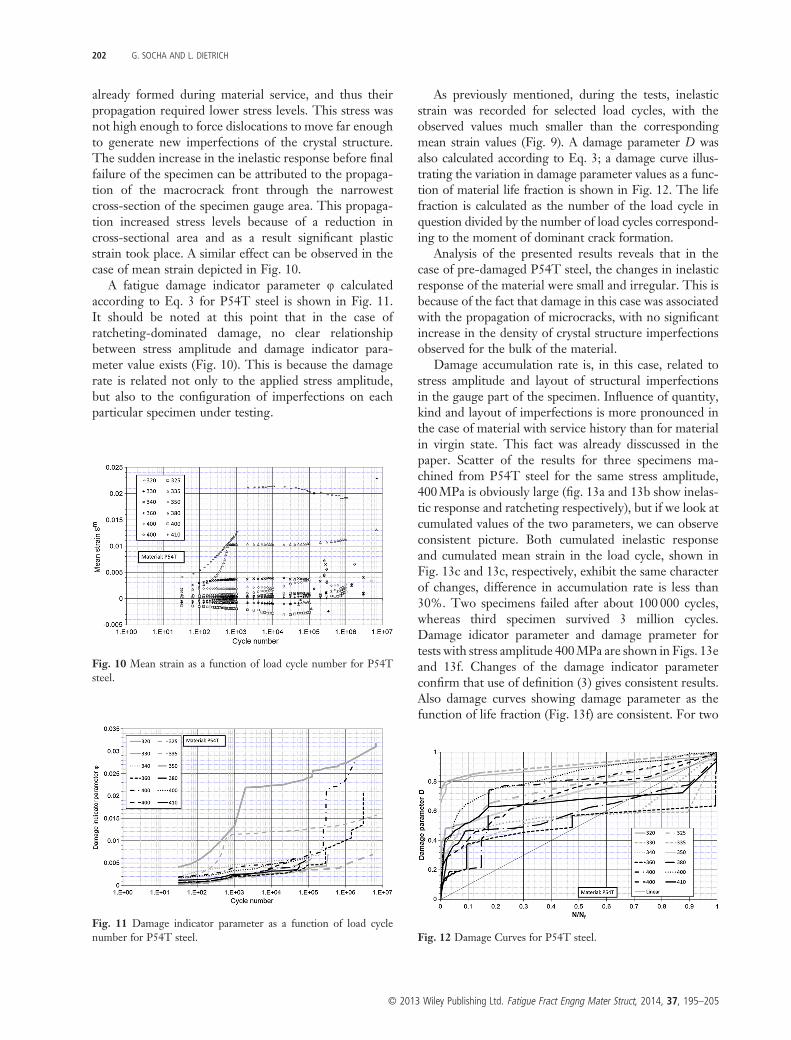
already formed during material service, and thus theirpropagation required lower stress levels. This stress wasnot high enough to force dislocations to move far enoughto generate new imperfections of the crystal structure.The sudden increase in the inelastic response before finalfailure of the specimen can be attributed to the propaga-tion of the macrocrack front through the narrowestcross-section of the specimen gauge area. This propaga-tion increased stress levels because of a reduction incross-sectional area and as a result significant plasticstrain took place. A similar effect can be observed in thecase of mean strain depicted in Fig. 10.
A fatigue damage indicator parameter φ calculatedaccording to Eq. 3 for P54T steel is shown in Fig. 11.It should be noted at this point that in the case ofratcheting-dominated damage, no clear relationshipbetween stress amplitude and damage indicator para-meter value exists (Fig. 10). This is because the damagerate is related not only to the applied stress amplitude,but also to the configuration of imperfections on eachparticular specimen under testing.
As previously mentioned, during the tests, inelasticstrain was recorded for selected load cycles, with theobserved values much smaller than the correspondingmean strain values (Fig. 9). A damage parameter D wasalso calculated according to Eq. 3; a damage curve illus-trating the variation in damage parameter values as a func-tion of material life fraction is shown in Fig. 12. The lifefraction is calculated as the number of the load cycle inquestion divided by the number of load cycles correspond-ing to the moment of dominant crack formation.
Analysis of the presented results reveals that in thecase of pre-damaged P54T steel, the changes in inelasticresponse of the material were small and irregular. This isbecause of the fact that damage in this case was associatedwith the propagation of microcracks, with no significantincrease in the density of crystal structure imperfectionsobserved for the bulk of the material.
Damage accumulation rate is, in this case, related tostress amplitude and layout of structural imperfectionsin the gauge part of the specimen. Influence of quantity,kind and layout of imperfections is more pronounced inthe case of material with service history than for materialin virgin state. This fact was already disscussed in thepaper. Scatter of the results for three specimens ma-chined from P54T steel for the same stress amplitude,400MPa is obviously large (fig. 13a and 13b show inelas-tic response and ratcheting respectively), but if we look atcumulated values of the two parameters, we can observeconsistent picture. Both cumulated inelastic responseand cumulated mean strain in the load cycle, shown inFig. 13c and 13c, respectively, exhibit the same characterof changes, difference in accumulation rate is less than30%. Two specimens failed after about 100 000 cycles,whereas third specimen survived 3 million cycles.Damage idicator parameter and damage prameter fortests with stress amplitude 400MPa are shown in Figs. 13eand 13f. Changes of the damage indicator parameterconfirm that use of definition (3) gives consistent results.Also damage curves showing damage parameter as thefunction of life fraction (Fig. 13f) are consistent. For two
Fig. 10 Mean strain as a function of load cycle number for P54Tsteel.
Fig. 11 Damage indicator parameter as a function of load cyclenumber for P54T steel. Fig. 12 Damage Curves for P54T steel.
specimens, damage curves have similar character, thirdspecimen, because of some event, probably deformationaround imperfection resulting in crack retradation, differsfrom the aforementioned two. Knowing the character ofdamage curve we, can explain the fact that for the samestress amplitude fatigue, life of the specimens can differso significantly. This phenomenon was obseved experi-mentally by many researchers, but it was hard to explainassuming linear damage rule. On the basis of presentedresults, we can conclude that damage accumulation, spe-cially for damaged material, is not liear function of the lifefraction, and linear damage rule should not be assumedfor life estimation.
The possibility of employing the damage law for anygiven stress amplitude represents the most importantbenefit of tracing changes in the fatigue damage indicatorparameter. This then enables fatigue life to be predictedmore precisely for a known stress amplitude history ofloading than would be the case if assuming linear damagelife in advance (such as reported in 13).
CONCLUS IONS
For the fatigue pre-damaged material under consid-eration, the entire fatigue damage process consisted ofthe growth of cracks from preexisting imperfections. Incontrast, for many undamaged metal alloys, as shownpreviously12,13 and confirmed here, there exists a periodof cyclic plastic deformation leading to an increase indislocation density prior to the formation of microcracks.Additional conclusions that can be drawn from thepresent experimental study include the following:
(1) In the case of the investigated steels, two mainphysical phenomena were found to underlie fatiguedamage accumulation during the phase precedingdominant crack formation. The first of these is thegeneration of crystal structure imperfections de-rived from the movement of existing dislocations.This phenomenon exhibits a tendency towardshomogenization, with dislocation movement easier
Fig. 13 Damage accumulation for three specimens machined form P54T steel and tested with stress amplitude 400MPa.
in the areas with a lower density of such imper-fections (interaction between dislocations inhibitsthis movement). The second phenomenon asso-ciated with damage accumulation is plastic defor-mation of material in the vicinity of structuralimperfections (voids and inclusions) acting asmicrocrack initiators.
(2) For undamaged material, the formation of micro-cracks is typically preceded by the relatively long-distance movement of dislocations. This movementresults in the generation of new imperfections,manifested macroscopically as the increase in mate-rial inelastic response shown in Fig. 5a.
(3) For initially fatigue pre-damaged material (such asthe P54T steel received for testing in an after-service condition), microcracks may already bepresent around existing imperfections, with damageaccumulation associated with the growth of suchmicrocracks. In this case, the high concentration ofplastic deformation around the crack tip does notallow the long-distance movement of dislocations orthe generation of new imperfections; as a result, nosignificant increase in inelastic response is observed(Fig. 9).
(4) An increase in inelastic response can be a goodmeasure of damage accumulation in many materials,for which movement and generation of crystal struc-ture imperfections is the main mechanism of damage.The definition of the damage parameter in this casewas provided in a previous paper of one of theauthors13.
(5) For the phase following microcrack formation in thevicinity of the material imperfection, ratchetingstrain represents a good damage progress indicator.Definitions of such a damage indicator parameterand damage parameter are established in the presentpaper (Eqs. 3 and 4). However, it should be notedthat in this case, the rate of damage indicator param-eter variation is strongly related to the initial config-uration of imperfections. As a consequence, this maylead to significant scattering of test results.
(6) All stages of the damage process- crack initiation,formation and propagation of microcracks, andfinally dominant crack propagation- can be analysedusing the definition of the damage parameter intro-duced in the present paper.
(7) Fatigue damage accumulation is a complex phenom-enon; sophisticated testing methods combining localand global observation of the strain field shouldtherefore be employed in order to obtain a clearpicture. The technique first presented in a previouspaper12 and used for the tests reported here hasproven to be successful for fatigue damage accum-ulation investigation.
ACKNOWLEDGEMENTS
The authors acknowledge the financial support providedthrough (Polish Ministry of Science and Higher Educa-tion) Grant Nr N N501 0784 35, ‘Elaboration of moni-toring methodology of damage development and itslocalization in low alloyed steels and aluminium alloys’
REFERENCES
1 Wöhler A. (1860) Versuche über die festigkeit dereisenbahnwagenachsen, Zeitschrift für Bauwesen.
2 Szala J. (1998) Hipotezy sumowania uszkodzeń zmęczeniowych,Wydawnictwa uczelniane Akademii Techniczno-Rolniczej.
3 Yang L., Fatemi A. (1998) Cumulative fatigue damagemechanismsand quantifying parameters: a literature review. J. Test. Eval.,JTEVA 26, 89–100.
4 Fatemi A., Yang L. (1998) Cumulative fatigue damage and lifeprediction theories: a syrvey of the state of the art for homoge-neous materials. Int J Fatigue 20, 9–34.
5 Lin J., Liu Y., Dean T. A. (2005) A review on damage mecha-nisms, models and calibration methods under various deforma-tion conditions. Int J Damage Mech 14, 299–319.
6 Dobmann G., Lang M. (2002) On-line monitoring of fatigue inthe LCF and HCF range by using micro-magnetic NDT atplain carbon and austenic stainless steel, European Federationfor Non-Destructive Testing -EFNDT-; Spanish Society forNon-Destructive Testing: Proc. of 8th European Conferenceon Nondestructive Testing 2002. CD-ROM.
7 Kowalewski Z. L., Szelążek J., Mackiewicz S. (2007) Destructiveand ultrasonic investigation of damage identification in metallicmaterials. Key Eng. Mater 340, 229–234.
8 Murakami Y., Miller K. J. (2005) What is fatigue damage? Aview point from the observation of low cycle fatigue process.Int J Fatigue 27, 991–1005.
10 Tanaka K., Murra T. (1981) A dislocation model for fatiguecrack initiation. J. Appl. Mech. 48, 97–103.
11 Murra T. (1994) A theory of fatigue crack initiation. Mater. Sci.Eng. A 176, 61–70.
12 Socha G. (2003) Experimental investigations of fatigue cracksnucleation, growth and coalescence in structural steel. Int JFatigue 25, 139–147.
13 Socha G. (2004) Prediction of the fatigue life on the basis ofdamage progress rate curves. Int J Fatigue 26, 339–347.
14 Dietrich L., Radziejewska J. (2011) The fatigue damage devel-opment in a cast Al–Si–Cu alloy. Mater. Des 32, 322–329.
15 Troshchenko V. T. (2011) Cyclic inelasticity and high-cyclefatigue of metals with consideration of the stress gradient effect.Strength Mater 43, 396–404.
16 Troshchenko V. T. (2010) Fatigue and inelasticity ofmetals under nonuniform stressed state. Strength Mater42, 494–505.
17 Fournier B., Sauzay M., Caës C., Noblecourt M., BougaultA., Rabeau V., et al. (2008) Creep-fatigue-oxidation inte-ractions in a 9Cr-1Mo martensitic steel. Part I: effect oftensile holding period on the fatigue lifetime. Int J Fatigue30, 649–62.
18 Fournier B., Sauzay M., Caës C., Noblecourt M., Bougault A.,Rabeau V., et al. (2008) Creep-fatigue-oxidation interactions
in a 9Cr-1Mo martensitic steel. Part II: effect of compressiveholding period on the fatigue lifetime. Int J Fatigue 30,663–76.
19 Fournier B., Sauzay M., Caës C., Noblecourt M., Bougault A.,Rabeau V., et al. (2008) Creep-fatigue-oxidation interactions ina 9Cr-1Mo martensitic steel. Part III: lifetime prediction. Int JFatigue 30, 1797.
20 Alexandre F., Deyber S., Pineau A. (2004) Modelling of theoptimum grain size on the low cycle fatigue life of a Ni basedsuperalloy in the presence of two possible crack initiation sites.Scripta Mater 50, 25–30.
21 Fomichev P. A., Trubchanin I. Y. (1997) Lateral contractionratio and strain hysteresis under cyclic loading. ProblemyProchnosti 4, 30–37.