67
A Feasibility Study of a Modified Deposit-Based Return System for PET and other Recyclable Bottles and Containers Jaferson Paurom Degree Thesis Materials Processing Technology 2020

Jaferson Paurom
A Feasibility Study of a Modified Deposit-Based
Return System for PET and other Recyclable
Bottles and Containers
Jaferson Paurom
Degree Thesis
Materials Processing Technology
2020

DEGREE THESIS
Arcada
Degree Programme: Materials Processing Technology
Identification number: 23012
Author: Jaferson Paurom
Title: A Feasibility Study of a Modified Deposit-Based Return
System for PET and other Recyclable Bottles and
Containers
Supervisor (Arcada): Mirja Andersson
Commissioned by:
Abstract:
The demand and supply for PET within Cagayan de Oro City is increasing by 3.1 percent
per annum based on per capita consumption of 8.4 kg in 2020 and 9.5 kg in 2025. Supply
was taken from the total off and on-trade sales multiplied by 91.5 percent less of demand
from 2020 to 2025. Carbonated drinks (soft drink) rank second in terms of beverage sales
with bottled water on top of the list. The consumers were satisfied with PET bottled drinks
in terms of design, size, shape, and durability; strong customer service support; ability to
respond to customer delivery needs; cost competitiveness of the product; and engagement
with customer-specific needs and requests. In terms of supply, the main features preferred
were recyclability, cost effectiveness, ideal for packaging, varied design possibilities and
customized solutions. PET bottle market share of 28 percent averages is higher than supply
with an average of 18 percent. A survey from the households revealed that DRS is generally
acceptable in terms of managing a modified and centralized deposit return system to be
owned and controlled by retailers, and manufacturers which assures that empty PET bottles
are returned to recycling by means of reverse vending machine, and consumer deposits are
refunded. There are 12 PET recycling companies in the Philippines but were not included
as participants of the survey as the study is primarily concerned with market, financial, and
management feasibility of establishing the system but are recommended to be included in
conducting a full-blown feasibility study. The implementation of the proposed DRS for the
city is estimated to cover a period of 19 months. Contingency plan for the implementation
of the project was not included since the proposed deposit return system requires enabling
laws by executive branch of the government whereby local retailers and manufacturers as
well as consumers could be guided accordingly by the implementing rules and guidelines.
Hence, contingency plan is held in abeyance.
Keywords: MDRS, DRS, PET, Reverse vending machine
Number of pages: 45
Language: English
Date of acceptance:
Table of Contents
1 INTRODUCTION ................................................................................................... 6
1.1 Aim of the study ............................................................................................................. 7
1.2 Research questions and hypotheses ............................................................................ 7
1.2.1 What is the supply of PET, aluminum, and glass raw materials utilized for the
production of beverage bottles? ............................................................................................ 7
1.2.2 What is the demand for PET, aluminum, and glass beverage bottle production? 7
1.2.3 What are the technical aspects of a deposit-based return system? ..................... 7
1.2.4 Financial analysis of the proposed DRS. .............................................................. 8
1.2.5 What is the level of acceptability of the proposed modified deposit-based return
system?.................................................................................................................................8
1.2.6 What action plan can be made for the implementation of the deposit-based return
system?.................................................................................................................................8
2 METHODS ............................................................................................................. 9
3 RESULTS AND DISCUSSIONS .......................................................................... 11
3.1 Profile and Supply Analysis ......................................................................................... 11
3.1.1 Profile of the participant company ....................................................................... 11
3.1.2 PET bottle supply analysis – raw materials ......................................................... 11
3.1.3 Share to company revenue ................................................................................. 12
3.1.4 Total Cost Comparison of PET, Aluminum, and Glass Bottle ............................. 12
3.1.5 Off-trade and On-trade Philippine Beverage ....................................................... 14
3.1.6 Projected Supply of PET bottles .......................................................................... 15
3.1.7 Population estimate per region, province, and city ............................................. 17
3.1.8 Supply of PET per capita by province and city .................................................... 18
3.1.9 Reasons and uses of PET bottles ....................................................................... 19
3.1.10 Supply chain ........................................................................................................ 20
3.1.11 Market share for PET, aluminum, and glass bottles ........................................... 21
3.1.12 Identification of market for PET, aluminum, and glass bottles ............................ 22
3.1.13 Satisfaction with PET, aluminum, and glass bottle features ............................... 22
3.1.14 Mode of payments and future market trend ........................................................ 23
3.2 Demand Analysis ......................................................................................................... 23
3.2.1 Market share of PET, aluminum, and glass bottle consolidation ........................ 23
3.2.2 Off-trade sales percentage for the demand for beverage ................................... 25
3.2.3 Demand and supply consolidation ...................................................................... 25
3.3 Technical Aspects ....................................................................................................... 27
3.3.1 Deposit Return System........................................................................................ 27
3.3.2 Cost-benefit analysis of deposit-based return system ....................................... 31
3.3.3 Simple process of reverse vending machine ...................................................... 31

3.3.4 Flow diagram ....................................................................................................... 32
3.4 Financial Feasibility ..................................................................................................... 33
3.4.1 Details of financial assumptions .......................................................................... 33
3.4.2 Projected income statement ................................................................................ 34
3.4.3 Projected balance sheet ...................................................................................... 35
3.4.4 Projected cash flow Statement ............................................................................ 36
3.5 Acceptability of MDRS ................................................................................................. 37
4 CONCLUSION..................................................................................................... 40
5 ACTION PLAN .................................................................................................... 41
REFERENCES ........................................................................................................... 46
APPENDIX 1. SURVEY QUESTIONNAIRE (SUPPLY)
APPENDIX 2. SURVEY QUESTIONNAIRE (DEMAND)
APPENDIX 3. DRS ACCEPTABILITY QUESTIONNAIRE
APPENDIX 4. CRONBACH’S ALPHA RESULT

Figures
Figure 1. Total cost comparison ..................................................................................... 13
Figure 2. Off-trade and on-trade PET supply ................................................................. 15
Figure 3. Projected annual PET supply .......................................................................... 16
Figure 4. Supply of PET by province and city ............................................................... 17
Figure 5. Supply of PET per capita per annum .............................................................. 18
Figure 6. Market share in the supply of PET, aluminum, and glass bottles ................... 21
Figure 7. Market share for demand and supply of PET, aluminum, and glass bottles ... 24
Figure 8. Forecast in volume percentage of beverage demand ...................................... 25
Figure 9. Demand and supply consolidation of PET, aluminum, and glass bottles ....... 26
Figure 10. Deposit Return Procedure ............................................................................. 28
Figure 11. Deposit Return System .................................................................................. 29
Figure 12. Bottle movement in the Deposit Return System .......................................... 29
Figure 13. Financing of the system ................................................................................ 30
Figure 14. Information in the barcode ............................................................................ 30
Figure 15. Reverse vending machine block diagram ..................................................... 32
Figure 16. Reverse vending machine flow diagram ....................................................... 33
Figure 17. PERT network ............................................................................................... 42
Tables Tabel 1. Interval scale for the acceptability mean score interpretation. ......................... 10
Table 2. Source of raw material of PET, aluminum, and glass bottles…………………11
Table 3. Share to company’s revenue.…………………………………………….……12
Table 4. Reasons and uses of PET, aluminum, and glass bottles.…………………...…19
Table 5. Satisfaction with product features o PET, aluminum, and glass bottles… …...23
Table 6. Projected income of PET bottles in the City…………….……………….... …34
Table 7. Projected balance sheet of PET bottles in the city…….…………...….….... …35
Table 8. Projected cash flow statement of PET bottles in the city………………...…….36
Table 9. DRS acceptability mean score interpretation…………………….…...….........38
Table 10. Implementation activity………………………………….…………....….......43
Table 11. PERT CPM………….….……………………………….…………....…........44

6
1 INTRODUCTION
This thesis examines the practicability of establishing a modified deposit-based return
system (MDRS). It focuses on the demand and supply analysis of PET, aluminum, and
glass bottles for beverages along with the financial analysis as well as a survey of the
acceptability of the deposit-based return system. Although these types of packaging ma-
terials particularly PET are cheaper and highly recyclable, their use worldwide has made
collection and recycling efforts to keep them from polluting landfills or oceans failed to
keep up [2]. This demonstrates that consumers are passive, that is, they do not contribute
to eradicating pollution from plastic unless an innovative solution is in place [3]. Hence,
the collection of used aluminum and glass bottles is of secondary importance as their
commercial utilization market is comparably small and recycling can be done repeatedly
without losing their integrity with less energy requirement [4]. Through a deposit-based
return system (DRS), recycling of PET bottles can be increased at the same time reduce
littering through a deposit system reclaimable upon return than as valueless waste plastic
material. Through the modified system consumers are provided with ample opportunities
to easily reclaim their deposits, cost of bottles added to the purchase price of bottled prod-
ucts when they dispose of the product at collection points [5]. This strategy has become
more important today with the growing use of plastic containers. It has been repeatedly
proven to be an effective driver for changing behavior, reducing littering, and increasing
recycling across Europe. Millions of people live with a deposit-based return system (DRS)
in many states in America and Australia while at the same time prevent littering of plastic,
glass, aluminum, and steel containers. The crucial question however is whether recycling
of PET bottles has future market potentials on account of the uncertainty of availability
and quality of recycled PET products. However, with policy interventions involving tax
incentives and charging of price premium for “Green” or “Recycled” plastics; taxes on the
use of virgin plastics; enforcement of recycled content and labeling standards; and crea-
tion of consumer education and awareness campaigns on the benefits of recycled plastic
bottles, toward a circular economy in the long run. The findings of the study will serve as
a basis for developing a framework for the implementation of modified DRS in the Phil-
ippines. Because of its sustainability, it is envisioned that MDRS would increase the pen-
etration of collecting PET bottles and increase the market through bottle-to-bottle recy-
cling methods.
7
1.1 Aim of the study
The study aims to determine the feasibility of adopting a modified deposit-based return
system (MDRS) in one city of Southern Philippines via market (supply and demand) pro-
spects such as raw materials, revenue, costs, uses, supply chain, market share, needs as-
sessment, customer satisfaction, and market projection and public perception on the ac-
ceptability of the proposed project.
1.2 Research questions and hypotheses
The study is hypothesis-free. It specifically answers the following questions:
1.2.1 What is the supply of PET, aluminum, and glass raw materials uti-
lized for the production of beverage bottles?
The above question adheres in terms of the source of PET materials (imported
or local), recyclability, revenue generation, cost, use, supply chain, market
share, need assessment, customer satisfaction, supply projection, and reasons
for future growth trends.
1.2.2 What is the demand for PET, aluminum, and glass beverage bottle
production?
This considers the market share of PET, aluminum, and glass bottles demand
and supply consolidation, forecast off-trade and on-trade of beverage con-
sumption, and demand and supply consolidation.
1.2.3 What are the technical aspects of a deposit-based return system?
The technical aspect in terms of how a deposit follows a bottle or can, how
material moves around a system, and how is it financed, and its cost-benefit
analysis.

8
1.2.4 Financial analysis of the proposed DRS.
This considers the income statement, balance sheet statement, and cash flow
statement.
1.2.5 What is the level of acceptability of the proposed modified de-
posit-based return system?
This tackles the deposit payment, reporting of returned packages, membership
fee, expenses covered, management, features of a reverse vending machine,
existing law and regulation, reclaim of value by customers, government con-
trol of MDRS, and the control of MDRS by a non-profit organization.
1.2.6 What action plan can be made for the implementation of the de-
posit-based return system?

9
2 METHODS
The study is set at one city of Southern Philippines which already has taken measures of
reducing PET pollution through the Republic Act 9003 known as the Ecological Solid
Waste Management Act of 2000 [6]. The study had a prior assumption that the law can
become more effective and efficient if people themselves have the means to take more
control of their PET bottles and become more sensitive to environment-friendly measures.
The study conducted an industry survey represented by one of the two largest beverage
and one largest beer company in the Philippines to determine the actual demand and sup-
ply conditions for PET, aluminum, and glass raw materials in one city in the southern
Philippines. Moreover, 180 households were interviewed on the acceptability of MDRS
as to implementation. Two sets of questionnaires were prepared: demand and supply
questionnaire for two beverage manufacturing firms and MDRS acceptability question-
naire disseminated to 180 households located near the two largest retail/wholesale stores
of the city. The scaled MDRS survey questionnaires were validated using the Cronbach
Alpha consistency criterion. Data gathered were statistically treated to answer the re-
search questions through the following formulae:
• Simple Percentage: 𝑝 =𝑥
𝑛× 100 [7]
Where: p = Percentage
x = raw score
n = Total number of responses
• Mean: �̅� = ∑ 𝑋
𝑁 [8]
Where: �̅� = Mean
X = Raw score
∑ = Summation
N = Total number of participants
10
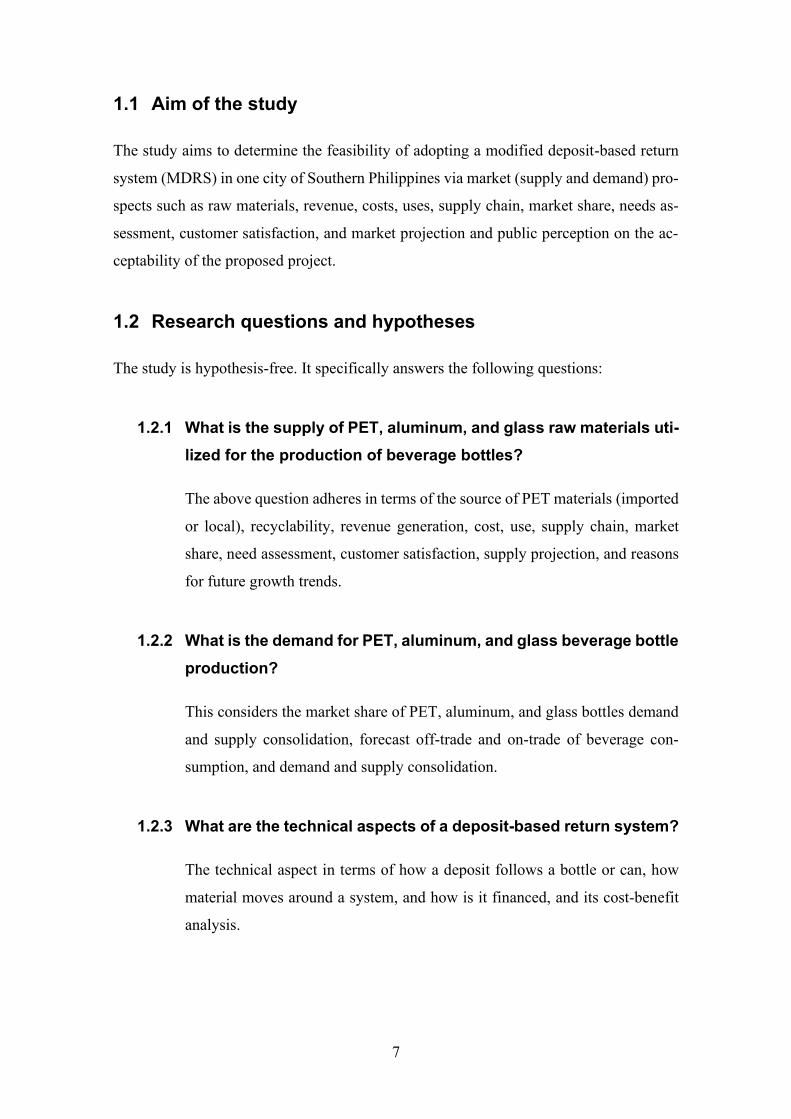
Table 1. Interval scale for the acceptability mean score interpretation.
Interval
Scale
Score Category Interpretation
4.21 – 5.00 5 Strongly Agree Completely Acceptable
3.41 - 4.20 4 Agree Acceptable
2.61 – 3.40 3 Not sure Somewhat acceptable
1.81 – 2.60 2 Disagree Unacceptable
1.00 – 1.80 1 Strongly Disagree Completely Unacceptable
• Cronbach’s Alpha 𝛼 =𝑁.𝑐̅
�̅�+(𝑁−1).𝑐̅ [9]
Where: N = number of items
𝑐̅ = average covariance between item-pairs
�̅� = average variance
• Program Evaluation and Review Technique (PERT)
Formula: µ = 𝑎+4𝑚+𝑏
6 [10,11]
Where: a = optimistic
m = Most probable
b = Pessimistic
µ = Expected time (mean)
Formula: 𝜎2 = 1
36(𝑏 − 𝑎)2 [10,11]
Where: a = Optimistic
b = Pessimistic
𝜎2 = Variance

11
3 RESULTS AND DISCUSSIONS
3.1 Profile and Supply Analysis
3.1.1 Profile of the participant company
One participant, a beverage manufacturer was interviewed and revealed that the company
was operating for PET bottled beverage production for 17 years while 31 years for alu-
minum and glass bottled drinks. According to the Department of Trade and Industry
(DTI) categorization, the company is considered a large scale with more than 200 em-
ployees [12].
3.1.2 PET bottle supply analysis – raw materials
In terms of new materials for PET bottle, Table 2 showed that the participant, a beverage
manufacturer revealed that for virgin PET material, aluminum, and glass were all im-
ported except for aluminum where raw materials that were availed locally. For recycle
and reuse/refill all were sourced locally. It appeared that with the company alone, all raw
materials for bottling beverages were imported as primary materials for new bottles while
it utilizes local sources for recycling and reuses or refill. PET materials, aluminum, and
glass may have been imported from China as the world’s leading exporting country of
these materials [13]. The findings also suggest that the company used two sources of raw
materials either: single-use (virgin) and recycle or reuse/refill whichever is most available
at any given time of need.
Table 2. Source of raw material of PET, aluminum, and glass bottles.
Source of Material
by type of
Single-Use (Vir-
gin)
Recycle Reuse/Refill
bottles Imported Local Imported Local Imported Local
PET Bottles ✓ ✓ ✓
Aluminum ✓
Glass ✓ ✓ ✓ ✓

12
3.1.3 Share to company revenue
In the light of market preference, the contribution to the company’s revenue, glass bottles
posted the highest contribution followed by PET bottles and then followed by aluminum
bottles. Apparently, glass bottles remained the largest source of revenue for the company.
This is of the fact that glass material comes in different colors used for a wide variety of
styles including juices, soda, and concentrates while ensuring that the liquid remains un-
changed in tastes and smell. Second in rank is PET bottles as a good alternative for glass
as it can offer a similar clarity as bottles but with the added benefit of impact resistance,
being lightweight, and will not leach chemicals into the product contained. At any rate,
CO2 is used to carbonate beverages which gives soda its distinct fresh and bubbly texture
that consumers might prefer. For instance, glass is a less permeable material than plastic
and aluminum, it is much harder for the CO2 to escape. This means that in a glass bot-
tle, soda will stay fresher and fizzier for a longer period. Hence, preferable by the con-
sumers.
Table 3. Share to company’s revenue.
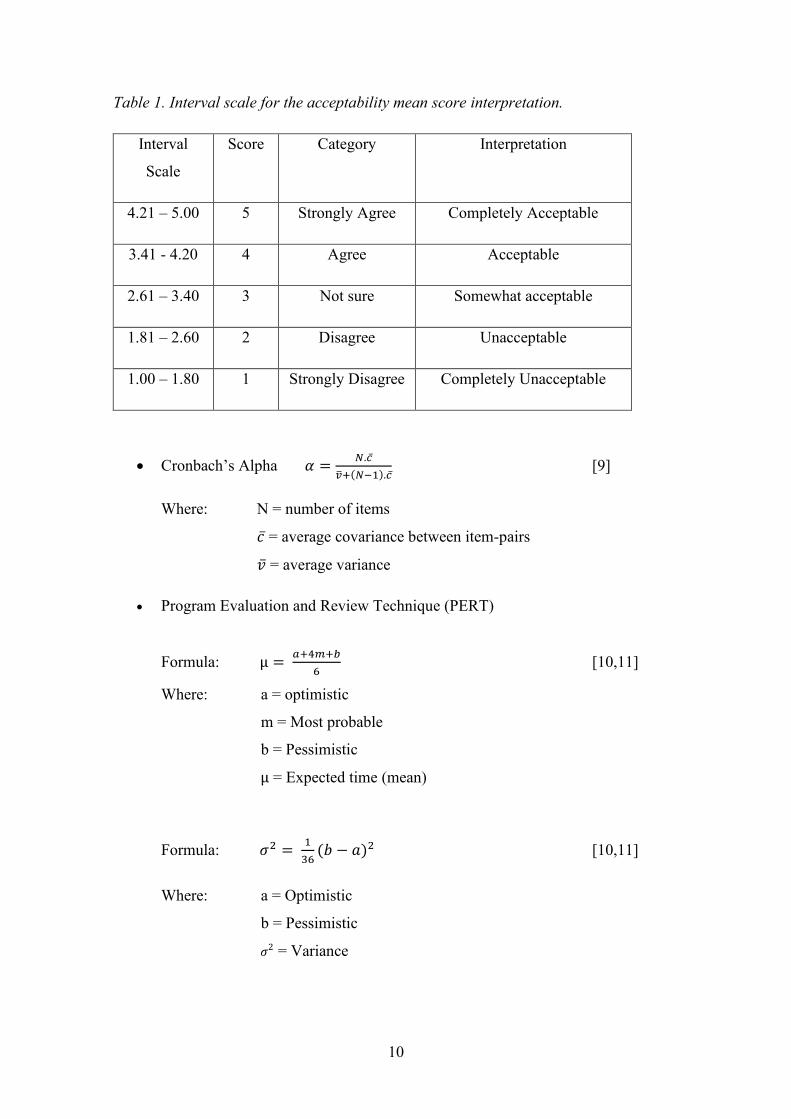
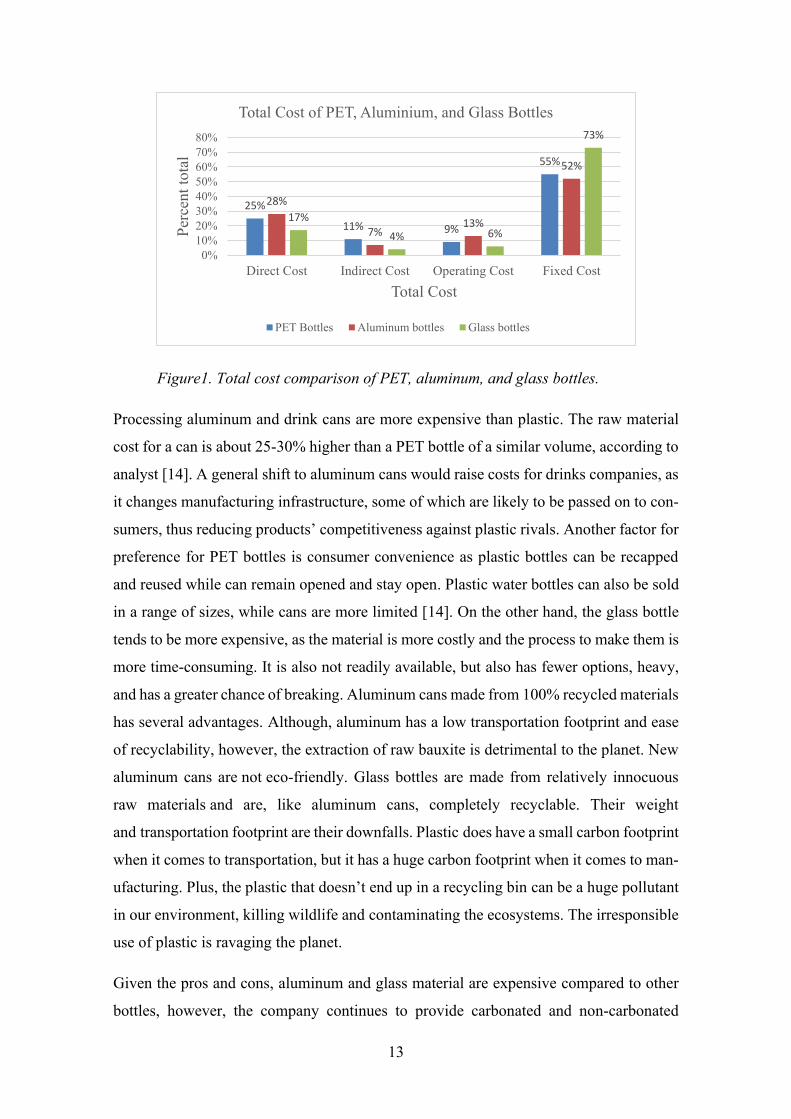
3.1.4 Total Cost Comparison of PET, Aluminum, and Glass Bottle
Results show that aluminum posted the highest cost of packaging beverages with 28%,
7%, and 13% respectively for direct and indirect cost and operating cost. PET ranked
second with 25%, 11%, and 9% respectively. Glass bottles ranked last in the order with
17%, 4%, and 6% respectively.
Type of Bottle Shares to Revenue Rank
PET Bottles 2 Next Highest
Aluminum 3 Lowest
Glass 1 Highest
13
Figure1. Total cost comparison of PET, aluminum, and glass bottles.
Processing aluminum and drink cans are more expensive than plastic. The raw material
cost for a can is about 25-30% higher than a PET bottle of a similar volume, according to
analyst [14]. A general shift to aluminum cans would raise costs for drinks companies, as
it changes manufacturing infrastructure, some of which are likely to be passed on to con-
sumers, thus reducing products’ competitiveness against plastic rivals. Another factor for
preference for PET bottles is consumer convenience as plastic bottles can be recapped
and reused while can remain opened and stay open. Plastic water bottles can also be sold
in a range of sizes, while cans are more limited [14]. On the other hand, the glass bottle
tends to be more expensive, as the material is more costly and the process to make them is
more time-consuming. It is also not readily available, but also has fewer options, heavy,
and has a greater chance of breaking. Aluminum cans made from 100% recycled materials
has several advantages. Although, aluminum has a low transportation footprint and ease
of recyclability, however, the extraction of raw bauxite is detrimental to the planet. New
aluminum cans are not eco-friendly. Glass bottles are made from relatively innocuous
raw materials and are, like aluminum cans, completely recyclable. Their weight
and transportation footprint are their downfalls. Plastic does have a small carbon footprint
when it comes to transportation, but it has a huge carbon footprint when it comes to man-
ufacturing. Plus, the plastic that doesn’t end up in a recycling bin can be a huge pollutant
in our environment, killing wildlife and contaminating the ecosystems. The irresponsible
use of plastic is ravaging the planet.
Given the pros and cons, aluminum and glass material are expensive compared to other
bottles, however, the company continues to provide carbonated and non-carbonated
25%
11% 9%
55%
28%
7%13%
52%
17%
4% 6%
73%
0%
10%
20%
30%
40%
50%
60%
70%
80%
Direct Cost Indirect Cost Operating Cost Fixed Cost
Per
cent
tota
l
Total Cost
Total Cost of PET, Aluminium, and Glass Bottles
PET Bottles Aluminum bottles Glass bottles

14
drinks packaged in aluminum and glass to increase the supply of packaging material and
maintain demand for a segment of the market which continues to buy aluminum packed
beverage products. In terms of fixed cost, glass registered the highest (73%) followed by
plastic (55%) and aluminum (52%). Fixed costs which constitute the largest account (60%
average) however remain fixed irrespective of output level are expenses that must be paid
whether any units are produced. They are fixed over a specified period or range of prod-
ucts. It often is used in conjunction with a sales forecast when developing a pricing strat-
egy, either as part of a marketing or business plan. Onstad (2019), reported that recycling
plastic is more complex that leads to degradation, and has lower reuse rates than alumi-
num such that aluminum can be a greener alternative. He added that the aluminum indus-
try can play on the fact that its product is substantially recyclable, however, it uses huge
amounts of electricity and has some chemical releases of greenhouse gas emissions.
Moreover, since aluminum is lightweight and can make efficient use of space, less
transport is usually needed than for plastics or glass, while less power is also needed to
chill drinks in cans - particularly useful in tropical climes. Onstad (2019) further reported
that simple economics is a major factor; aluminum is more expensive than plastic - the
raw material cost for a can is about 25-30% higher than a PET bottle of a similar volume.
Hence, a broad shift to aluminum cans would raise costs for drinks companies, also in-
cluding new manufacturing infrastructure, some of which are likely to be passed on to
consumers, thus hitting products’ competitiveness against plastic rivals [14].
3.1.5 Off-trade and On-trade Philippine Beverage
Figure 2 reveals the off-trade, on-trade, and total trade of PET supply of beverage bottles
in liters based on sales from 2011 to 2016 [15] and converted into kilograms based on the
ratio 0.5-liter equivalent to 59.4 grams [18]. The total supply R2 indicates high goodness
of fit of the data (98.7%). The regression model reveals an increase by 28.7 million kilo-
grams per year with a small standard error of 2.35 million kilograms the sample estimate
deviate from the actual. There is nothing but chance present in the data and the Durbin-
Watson statistics (2.52> DL and DU indicates that the error term is not correlated, hence,
the model is good in predicting future supply values. When taken separately as off-trade
and on-trade trend, figure 2 also indicates the same predicted direction with parameters
(R2 = .966, ρ = .000, SE = 2.28, DW = 2.49; R2 = .997, ρ = .000, SE = .103, DW = 1.98)
respectively.

15
Figure 2. Off Trade and on-Trade PET supply. [15]
The data shows an upward trend as overall data points move in an upward direction at the
national level. On other hand, the data shows a systematic trend showing an overall per-
sistent and continuous rise in PET beverage sales. This could be attributed to the upward
movement of population, income per capita, changes in product designs, additional prod-
uct lines, and the like. The upward movement of beverage sales suggests large potential
profits and therefore beverage companies are expected to respond by tapping potential
investment opportunities in the long run. Along with this, the supply for PET bottle ma-
terials is expected to increase to maximize the potential for profits. However, there is a
need for companies to understand the factors that may affect the value of plastic bottles
versus aluminum or glass irrespective of general market conditions. For this, the company
will also need to study the market and technologies, competition, and financial conditions
of the company.
3.1.6 Projected Supply of PET bottles
The data on PET supply are national figures and must be disaggregated to estimate supply
value by provincial, and city levels. Figure 3 shows the annual projection (2017-2025)
from the actual PET bottle data sales in kilogram from 2011 to 2016. Total supply is
expected to increase by 28.74 million kilograms which is a 2.77 percent compounded
annual growth rate (CAGR) and the initial value of 823 million kilograms expected to
reach 1,646 million kilograms in 25 years. Splitting the model into two separate parts,
off-trade and on-trade supply will increase by 2.78 and 2.73 CAGR, respectively.
539,6574,96
600,4624,16 628,4
672,34
104,54 109,28 113,5 117,81 122,06 127,69
644,14684.24
713.9741.97 750.46
800.03
y = 24.222x + 521.87R² = 0.9656 ρ = .000 SE = 2.38 DW = 1.49
y = 4.5257x + 99.973R² = 0.9979 ρ = .000 SE = ..103 DW = 1.98
y = 28.748x + 621.84R² = 0.9739 ρ =.000 SE = 2.35 DW = 2.52
0
100
200
300
400
500
600
700
800
900
2011 2012 2013 2014 2015 2016
Mil
lio
n k
g
Off-trade and on-trade PET supply
Off-trade On-trade Total

16
Figure 3. Projected annual PET supply. [15]
The data shows an upward trend as overall data points move in upward direction at the
national level. On other hand the data shows a systematic trend showing an overall per-
sistent and continuous rise in PET beverage sales. This could be attributed to upward
movement of population, income per capita, changes in product designs, additional prod-
uct lines and the like. The upward movement of beverage sales suggests large potential
profits and therefore beverage companies are expected to respond by tapping potential
investment opportunities in the long run. Along with this, supply for PET bottle materials
is expected to increase to maximize the potential for profits. However, there is need for
companies to understand the factors that may affect the value of the plastic bottles versus
aluminum or glass irrespective of general market conditions. For this, the company will
also need to study the market and technologies, competition, and financial conditions of
the company. However, higher prices may force consumers to reduce their demand,
hence, companies can choose to hold steady on their prices to sell higher quantities to
maintain the same profit margins. Moreover, consumer preferences can change due to a
wide range of reasons, including the average age of the consumer population, changes
in societal trends, seasonal cycles, or economic fluctuations. The success of the bever-
age manufacturer can anticipate these consumer tendencies and plan accordingly.
672 697 723 750778
807838
869901
935
128 132 136 143 148 153,35 159 165 171 178
800823
861892
926961
9971034
10721112
y = 29.13x + 636.96R² = 0.997 ρ = .000 SE = .822 DW = .455
y = 5.5324x + 120.97R² = 0.9979 ρ = .000 SE = 4.32 DW = .455
y = 34.66x + 757.95R² = 0.9979 ρ .000 SE = 4.15 DW = .455
0
200
400
600
800
1000
1200
2016 2017 2018 2019 2020 2021 2022 2023 2024 2025
Mil
lio
n k
g
Projected annual PET supply
Off-Trade in million Kg On-Trade in million Kg Total in million Kg

17
3.1.7 Population estimate per region, province, and city
Figure 4 are national figures and needed further extrapolation by disaggregating them by
population by region, province, and city. The table below shows the population estimate
of Misamis Oriental (region 10), Northern Mindanao, and Cagayan de Oro City from
2020 to 2025 [17].
Figure 4. Population estimate per region, province, and city. [15]
The population in the region is estimated to increase by 0.83 CAGR percent, 0.96 CAGR
percent increase in the province, and 0.96 percent CAGR in the city. In 2020 alone, the
population of the region shares about 4.61 percent of the country’s population, while the
province shares about 33.72 percent of the region’s population, and the city shares about
43.21 percent of the province population. These percentages can be used to estimate the
supply of PET aluminum and glass bottles per capita.
On the account that Cagayan de Oro City is a geopolitical component of Misamis Oriental
where the geographic spread is close and immediately accessible by land transportation
the supply could as well include the province as target market. Currently, there are only
two soft drink manufacturers in the area. On the other hand, even though consumption of
regular and diet soft drinks has been on the decline, carbonated soft drinks are still a top
revenue-generating beverage consumed. Soft drinks remain the number one beverage
consumed at restaurants and other commercial foodservice outlets with some 18 billion
servings ordered in the year in the US in 2016 [39]. Carbonated beverages are the second
5017051 5074563 5128964 5180245 5228550 5273604
1692002 1714414 1735638 1755659 1774536 1792167
731057 740741 749911 758561 766717 774335
0
1000000
2000000
3000000
4000000
5000000
6000000
2020 2021 2022 2023 2024 2025
No
. of
per
son
s
Population estimate per region, province, and city
Northern Mindanao Misamis Oriental Cagayan de Oro City

18
most consumed purchased beverage at home, which is evidenced by the significant shelf
space carbonated beverages capture at many supermarkets. On this account, there is
strong reason to believe that the increasing consumption and supply will continue in the
future.
3.1.8 Supply of PET per capita by province and city
The supply of PET bottles per capita per year 2.25 percent (CAGR) in the province and
2.07 percent in the city. This means that PET supply increases by .226 kilogram per years.
The data show goodness of fit (99.8%) and significant (ρ = .000).
Figure 5. Supply of PET per capita per annum. [17]
The study uses of per capita of PET bottle consumption or supply as an index of PET
growth is its usefulness in evaluating actual economic activities surrounding PET bottle
production. If per capita consumption surpasses population growth rate, then per capita
consumption of PET bottle will rise. Similarly, if both per capita consumption of PET
and population growth rate are the same, then PET as an industry remain constant. Hence
growth rate of population is an important indicator for the growth of PET bottles as an
industry. Moreover, if per capita consumption does not surpass population growth rate
then it must fall. Although, there other reasons for the increase in consumption per capita,
the data in Table 8 suggest that PET consumption per capita growth of 2.11 percent ex-
ceeds population growth rate of 1.35 percent [40]. For as long the consumption rate is
8.4
8.6
8.8
9.0
9.3
9.5
8.4
8.6
8.8
9.1
9.3
9.6
7,8
8,0
8,2
8,4
8,6
8,8
9,0
9,2
9,4
9,6
9,8
2020 2021 2022 2023 2024 2025
Kilo
gram
pe
r ca
pit
a
Supply of PET per capita
Misamis Oriental Cagayan de Oro

19
higher than population growth rate, the use of PET material will continue together with
potential technological improvement. This further suggest that there is a large potential
for large increase in the supply of PET in the future unless restricted either by exhaustion
of PET virgin materials or legal restriction on the use of PET materials as soft drink pack-
aging. Per capita analysis can also serve as benchmark of measuring the industry’s long
run economies of scale. The current scale shows that PET consumption per capita is fac-
ing a long run increasing return to scale, hence, doubling the inputs of production will
result in doubling the soft drink production and there doubling the needed packaging ma-
terial whether aluminum, glass, and PET in the long run.
3.1.9 Reasons and uses of PET bottles
Based on a 10-item survey on the reasons for the use of PET, aluminum, and glass as
packaging materials, results show that 60 percent, 50 percent, and 60 percent respectively
of the major reasons.
Table 4. Reasons and uses of PET, aluminum, and glass bottles.
Type of Bottle PET Aluminum Glass
Recyclability ✓ ✓ ✓ ✓
Cost-effective raw material ✓ ✓ ✓ ✓
Ideal packaging for beverage ✓ ✓ ✓ ✓
Varied packaging design possibilities ✓ ✓ ✓ ✓
Can create a customized solution ✓ ✓ ✓
Product protection ✓ ✓
Increasing customer preference
Ease of manufacturing ✓ ✓
Others, please specify
PET bottles are used for bottled water, carbonated drinks, and juices. The reasons for the
utilization of PET bottles include cost-effective raw materials available, ideal for pack-
aging beverage, varied design possibilities, can create a customized solution, ease of man-
ufacturing, and recyclability. PET bottle is generally cheap making it more affordable to
low-income consumers and being synthetic materials, it can be designed and manufac-
tured in a way that meets the purchasing power of consumers. It has a good shelf life it is
20
less than a glass or aluminum bottle. Plastic beverage bottles can be easily shaped for
pressurized products such as soft drinks. Also, it is very transparent, lightweight, refilla-
ble, and has a high safety factor if dropped. There are however limiting factors for plastic
bottles such as the collection of the recycled material, maintaining the same shape with
high internal pressure, which can cause human health concerns, a common material found
on beaches and oceans, non-biodegradable and non-renewable, low recycling rate, and
the like.
The reasons for the use of aluminum bottles include recyclability, cost-effective raw ma-
terial, and ideal for packaging beverage, varied packaging design possibilities, and ease
of manufacturing. Aluminum is 100 percent recyclable and can be recycled indefinitely
without loss of quality or durability, repurposed, a higher recycling rate of about 68 per-
cent, and less energy utilization in creating aluminum. Contrast, aluminum creates high
carbon footprint in smelting and refining, relatively expensive in energy utilization, and
pose some health risks. Glass bottles are used for their recyclability, cost-effective raw
material, ideal packaging for beverage, varied packaging design possibilities, can create
a customized solution, and product protection. Glass is preferred for its high recyclability,
reliability, high transparency, impervious to CO2 loss, abundance of raw material, and
long shelf life. In contrast, glass is heavier than aluminum and plastic it cost more to ship
and deliver, frangibility, expensive processing, requires more energy to very high tem-
peratures needed to manufacture glass. It results in higher CO2 emission,
Apparently, each type of soft drink bottle carries both advantages and disadvantages. In
such a case, the researcher reserves some judgment on this issue as it is difficult to quan-
titatively assess the relative advantage of each type of bottle. The researcher feels that as
technologies and innovation improving health safety, recyclability, cost-efficient, and
eco-friendly methods of packaging will be forthcoming for each type of bottle.
3.1.10 Supply chain
The supply chain adopted by the company is business to business (B2B) and retail stores.
This can be attributed to the fact that most beverages have a sufficiently long shelf life to
allow them to be stocked and sold through outlets other than large, high turnover retail
chains. Convenience stores can stock different brands and sell them at a premium to con-
sumers. These stores often operate outside the normal supermarket hours, catering to

21
consumers who accept or even seek the “single-serve” purchase, albeit with its higher
price. Vending machines use similar logic. The difference however is that machines func-
tion 24 hours and require little or no manual intervention. The incessant thirst of many
new consumers for new beverages combined with trends to source locally and naturally
opens doors for smaller producers in the bars and restaurants of their community. They
often have a stronger card to play here than larger producers looking for bulk orders,
although subsequent expansion may be another possibility.
3.1.11 Market share for PET, aluminum, and glass bottles
Table 10 revealed that the estimated market share for single-use PET bottles was 26 per-
cent, 18 percent for the recycled bottle, and 11% for reuse/refilled out of the total market.
For aluminum bottles, 17%, 11%, and 6% while 40%, 56%, and 63% share of the total
market.
Figure 6. Market share in the supply of PET, aluminum, and glass bottles.
In terms of market share (percentage captured revenues from the market), glass bottles
posted the highest percentage for virgin, recycled, and reuse/refilled. This could be at-
tributed to the reusability of glass materials compared to plastic, Glass bottles are nonpo-
rous and can be used continuously worry to change in taste. Based on the study, unlike
glass, plastic bottles have been shown to harbor an excessive number of bacteria [30] and
make glass bottles are the preferred container for storing soft drinks or liquids. Another
benefit of the glass bottle is the pure taste of liquids from glass bottles [31]. The scientist
26%
18%
11%17%17%
11%6%
15%
40%
56%
63%
20%
0%
10%
20%
30%
40%
50%
60%
70%
% Market shareSingle-use (Virgin)
% Market shareRecycled
% Market shareReuse/Refilled
Others
Market share for PET, aluminum, and glass bottles
PET bottles Aluminum bottles Glass bottles

22
has a link to this phenomenon since glass has the most inert substance used for packaging
and therefore gives the most unaltered drinking experience. Another property that makes
glass unique is its capability to be recycled endlessly in fact many companies will buy
recycled glass for melting down and repurposing into other products. When compared to
plastic, glass bottles are far more versatile than other containers while offering excep-
tional recycling properties. These properties account for the recyclability and reuse of
glass bottles with zero littering, unlike single-use plastic.
3.1.12 Identification of market for PET, aluminum, and glass bottles
Market identification covers the following: ensuring customer needs, target market, chan-
nels, running a test market, and support system. To ensure customers’ needs, the company
conducted product reviews and social media that competitors do not currently supply,
reviews of market research on the current trend and genuine customer needs, assessment
of competitors’ product ranges that the company can fill, and marketing programs aim to
target relevant and important audience. In terms of the target market, the participant com-
pany conducted reviews on selecting the target market which ensures the company’s fo-
cus resources on marketing priorities, uses communication channels such as salesforce,
customers’ newsletters, telesales, and email to announce a new product. Under channel,
the company strengthens the motivation of the sales force, retailers, and distributors for
the successful launching of a product. In the area of running a test market, the company
ensures running a test market before a product is launched to gather information on all
aspects of the product to minimize risk or failure. The company also chooses the target
market with demographic characteristics as well as price, retail performance, and cus-
tomer response to advertising, packaging, and sales promotion. Making use of the Support
system covers existing government rules and regulations supporting the recycling of PET,
aluminum, and glass bottles, and training of manpower before the launching of products.
3.1.13 Satisfaction with PET, aluminum, and glass bottle features
In terms of the company’s satisfaction with PET, aluminum, and glass bottles, Table 12
revealed the company is satisfied with PET, aluminum, and glass features as packaging
materials for beverages. These include features such as design, size, shape, and durability;

23
strong customer service support; ability to respond to customer delivery needs; cost com-
petitiveness of the product; and engagement with customer-specific needs and requests.
Table 5. Satisfaction with product features of PET, aluminum, and glass bottles.
3.1.14 Mode of payments and future market trend
The preferred mode of payments is either cash or cheque while the future market trend is
expected to increase five times the present volume. This trend is attributable to product
satisfaction and forms of packaging.
3.2 Demand Analysis
3.2.1 Market share of PET, aluminum, and glass bottle consolidation
Glass bottles posted the highest percentage rating in terms of market share (percentage of
revenues). Demand market shares revealed 56 %, 63%, and 70% for single-use virgin
material, recycled, and reuse, respectively. Supply market shares show 40%, 56%, and
63% respectively. PET bottles ranked second with a demand market share of 37%, 26%,
and 20% for single-use, recycled, and reuse materials respectively. PET supply market
shares indicate 20%, 18%, and 11% respectively. For aluminum, demand market shares
are 23%, 17%, and 13% respectively while supply shares indicate 17%, 11%, and 6%
respectively.
Product features PET Bottles Aluminum Bottles Glass Bottles
Design, size, shape, and
durability
Satisfied Satisfied Satisfied
Strong customer service
support
Satisfied Satisfied Satisfied
Ability to respond to cus-
tomer delivery needs
Satisfied Satisfied Satisfied
Cost competitiveness of
the product
Satisfied Satisfied Satisfied
Engagement with cus-
tomer-specific needs and
requests
Satisfied Satisfied Satisfied

24
Figure 7. Market share for demand and supply of PET, aluminum, and glass bottles.
Glass demand and supply market shares posted the highest percentages with an average
market gap of 10 percent. The market gap is the difference between demand and supply
for PET, aluminum, and glass bottles the consumers’ need that supply has not yet met.
Hence, for glass bottles, there is an opportunity to increase its customer base by penetrat-
ing the gap in the market and filling it. The gap also describes the uniqueness of the com-
pany’s beverage bottles that needing upgrades or improvement to sell in a new market
and increase its sales considerably. PET demand and supply market shares follow the
same direction but with a smaller percentage, next to glass bottle market shares. PET
posted a market gap of 12 percent. Aluminum bottles posted the lowest in rank in terms
of demand and supply market share but also following the same predicted direction with
a gap of around 7 percent. The findings suggest that the company should determine
whether it should exploit the gap on account that demand exists and had to be met by
applying marketing methods of achieving it and it is profitable. If these factors are pre-
sent, then there is a good chance that the company can increase its customer base and look
for alternative investment strategies.
37%
26% 26%18% 20%
11%
23%17% 17%
11% 13%6%
56%
40%
63%56%
70%63%
0%
10%
20%
30%
40%
50%
60%
70%
80%
Demand and supply market share for PET, aluminum, and glass bottles
PET bottles Aluminum bottles Glass bottles

25
3.2.2 Off-trade sales percentage for the demand for beverage
Ranked in descending order, bottled water ranked highest in demand in 2020 to 2021 with
an average percentage of 39.45 percent, followed by carbonates (36.85%), concentrates
(13%), juice (3.825%), sports and energy drink (3.74%), RTD tea (2.68%), and RTD cof-
fee (0.235%).
Figure 8. Forecast in volume percentage of beverage demand (2020-2021). [15]
Of the total forecast volume of beverage, bottled water ranked the highest followed by
carbonates and concentrates. The data in the Table reveals that bottled water, carbonates
(soft drink), and concentrates are likely to be the major sources of PET demand and sup-
ply in both the short-run and long run. These beverages shall be the major PET sources
the proposed project shall aim to collect, sort, and recycle PET bottles - three major bev-
erage products sold. Table 12 showed that bottled water sold 5,316.3 million liters in 2021
followed by carbonates with 4,993.3 million liters [15]. These products constitute roughly
76 percent in 2020 and 77 percent in 2021 of the total volume of beverage sold the rest
24 percent and 23 percent are distributed to other beverages [15].
3.2.3 Demand and supply consolidation
The figure below showed that the demand market hovers around 36.07 percent average
while supply hovers around 27.56 percent, hence a gap of 8.5 percent average. Both de-
mand and supply posted a percentage yearly increase of 3.1 compounded annual growth
rate.
39,40%36,50%
13,30%
3,85%0,24%
2,69% 3,68%
39,50%37,20%
12,70%
3,80% 0,23% 2,67% 3,80%
0,00%5,00%
10,00%15,00%20,00%25,00%30,00%35,00%40,00%45,00%
Off Trade Sales Percentage for the demand of beverage
2020 2021

26
Figure 9. Demand and supply consolidation of PET, aluminum, and glass bottles. [15,17]
Both demand and supply increase by 3.1 percent faster than the population growth of 1.35
percent. This suggests that demand and supply will rise in the long run. In a monopolistic
market, the entry of other firms with similar but differentiated products into the same
general market (like concentrates, juices, tea, sports, and energy drinks) will shift the
demand curve faced by a competing firm. As more firms enter the market, the quantity
demanded at a given price will decline, and the firm’s perceived demand curve will de-
cline. The shift in marginal revenue will change the profit-maximizing quantity that the
firm chooses to produce since marginal revenue will then equal marginal cost at a lower
quantity. However, this possibility is likely true when cross demand elasticity of demand
is high. In a study of elasticity for different types of beverages, the cross elasticity of soft
drinks is almost equal to unity [32]. This suggests that the overall price increase of soft
drinks will result in a proportionate increase in demand for other beverages. Similarly, a
decrease in soft drinks will result in a proportionate increase in the demand for the soft
drink. This high elasticity is attributed to the presence of substitutes making the demand
for soft drinks price-sensitive, spending on other products like fruits and vegetables, level
of income, and the like.
The supply elasticity of soft drinks is positive, that is, the higher the price of soft drinks,
the higher the price will be. The concept of elasticity helps in determining the demand of
the product if the changes are made in terms of the price of the product, in consumers’
income, and change in the price of other alternative products in the market. The elasticity
of demand shows how the demand for the company’s product rises at each level with the
changes occurring in three different terms. Soft drink manufacturers should be able to get
926960
9961033
10721112
847 879911 945
9811017
79 81 85 88 91 95
0
200
400
600
800
1000
1200
2020 2021 2022 2023 2024 2025
Tho
usa
nd
kg
Demand and Supply Consolidation
Demand in million Kg Supply in million Kg Market Gap

27
the idea of product supply to the market by knowing these terms to increase the revenue
for the company. A proper analysis done over the factors can help the company in under-
standing the market competition and to supply its product accordingly.
3.3 Technical Aspects
3.3.1 Deposit Return System
A deposit-refund system combines a tax on product consumption with a refund when the
product or its packaging is returned for recycling [18]. Deposit-refunds are used for bev-
erage containers, lead-acid batteries, motor oil, tires, various hazardous materials, elec-
tronics, and more. Also, researchers have shown that the approach can be used to address
many other environmental problems beyond waste disposal. By imposing an up-front fee
on consumption and subsidizing “green” inputs and mitigation activities, a deposit-refund
may be able to efficiently control pollution in much the same way as a Pigovian tax [19].
Theoretical models have shown that alternative waste disposal policies, such as virgin
materials taxes, advance disposal fees, recycled content standards, and recycling subsi-
dies are inferior to a deposit-refund. These results have been corroborated in calibrated
models of U.S. waste and recycling. Moreover, in theoretical models that consider joint
environmental problems and product design considerations, the deposit-refund continues
to have much to recommend it as a component of an overall socially optimal set of poli-
cies [20]. More empirical research into deposit-refund systems is needed, particularly the
upstream systems used for many products. In these systems, the processors, or collectors
of recyclables rather than consumers receive the refund. Upstream systems may have
lower transaction costs and better environmental outcomes than traditional downstream
systems.
In the nutshell, DRS works simply as a container deposit schemes work by adding a small
extra deposit on top of the price of a beverage, such as those in plastic and glass bottles
and aluminum cans, which is refunded to the consumer when they return the empty drink
container for recycling. Also known as bottle deposit schemes, deposit refund/return sys-
tems (DRS), or bottle bills, they are typically established through legislation passed by
state or national governments. Container deposit schemes for non-refillable beverage

28
containers have been around for several decades, and those for refillable containers for
centuries, with early inceptions, used particularly for glass collection.
Figure 10. Deposit Return Procedure. [20]
A deposit-based return system in practice is centrally administered. It involves three ma-
jor aspects; 1) how a deposit follows a can or bottle, 2) how recyclable material moves
around the system, and 3) how it is financed. The process begins with the manufacturer
or distributor who sold PET bottled products to the stores which pay the product price
plus the fully refundable deposit to the manufacturer/distributor. However, the manufac-
turer/distributor would not keep the refundable deposit to himself he has to forward it to
the system administrator which is a non-profit organization composed of retail and indus-
try stakeholders responsible for managing the deposit system. The consumer buys the
product from the stores (the bottle and the fully refundable deposit). The deposit amount
is always displayed separately from the beverage price in the store. The consumer then
takes the bottles to the store for the redemption of the deposit. In principle, every store
throughout the country would accept the consumer’s bottle through a reverse vending
machine or manually over the counter where the consumer and takes back the deposit in
full. Later, the system administrator arranges to pick up the bottles from the store for
counting, sorting, packing, and sale and pays back the deposit to the store. In addition to
the deposit, the system administrator pays an extra handling fee for each bottle collected
by the store. Hence, the loop is closed, and a zero-sum game is established. Unlike a tax,
a deposit fully redeemable by the consumer. Hence, there is no need for public discussion
about the negative financial effects of deposit. [21]

29
Figure 11. Deposit Return System. [21]
How does the empty bottle move around the system? The empty bottles arrive at the sys-
tem administrator counting and sorting center. Here the bottles are sorted and baled to-
gether with thousands of other bottles of the same color and quality. This bale is then sold
to a plastic recycler who further process the material. Labels and caps are removed from
the recycling. The bottles are then crushed, washed, and processed into recycled plastic.
In the production of new bottles, recycled plastic is then mixed with new plastic and made
into a new bottle preform. The preform is heated in the bottling plant and inflated into a
new bottle with labels and distribute to the manufacturer/distributor, and the cycle of the
bottle is finally completed.
Figure 12. Bottle movement in the Deposit Return System. [21]

30
So, who will finance all of this? Surprisingly, there is no required public money at all.
The system is set up and operated by the retail industry on a non-profit basis and finance
through three channels. The unredeemed deposits from bottles that are not returned to the
stores, the revenues earned from the collected materials, and the small administration fees
paid by the beverage manufacturers/distributors finance system. The system aims to op-
erate at the lowest cost possible for everyone involved.
Figure 13. Financing of the system. [21]
How would the system administrator know the number of unredeemed deposits? Does he
need to know what is sold to understand what comes back? The answer is in the bottle’s
barcode. The barcode carries information as to product brand, measurements, material
composition, and deposit value. [21]
Figure 14. Information in the barcode. [21]

31
3.3.2 Cost-benefit analysis of deposit-based return system
A compilation of 21 studies that examined the costs and benefits to municipalities of im-
plementing (or expanding) a DRS for beverage containers. It is noteworthy that, although
different in scope, location, author, and year, each study reported significant net cost sav-
ings to municipalities [22]. One of the key elements missing in most of these analyses is
the savings resulting from the reduced or avoided costs of collection, treatment, and dis-
posal by the municipal waste management system. The benefits associated with the im-
plementation of the container recycling program: 1) Savings in alternative container
treatment costs. Recovered beverage containers do not reach waste containers and thus
savings are achieved in alternative waste treatment costs; 2) Cleaner public spaces. Un-
fortunately, containers are often not disposed of properly, but simply left in public spaces,
at times even posing health risk (such as injury from broken glass bottles). The program
considerably reduces the number of containers thus disposed of. Furthermore, even con-
tainers disposed of this way are collected by collectors; 3) Reduction in landfill volumes.
Collection and recycling of containers significantly reduce the amount of waste sent to
landfill. The effect of the program is significant in this respect as beverage containers are
generally of large volume relative to other types of waste, and do not biodegrade (and
thus constitute an environmental nuisance for many years); 4) Positive externalities of the
utilization of recycled materials. Implementation of the program results in more recycled
material entering production processes, thus reducing pollution created by these pro-
cesses. For instance, the energy required to recycle aluminum is only 5% of that required
to create new aluminum [23]. In turn, these energy savings lead to reduced air pollution;
5) Job creation leading to economic growth. Implementation of the law has led to the
creation of hundreds of jobs – in areas such as collection, sorting, transport, and treatment
of empty containers [24]. For reasons explained below, however, we treat this aspect as
a potential additional benefit of the program and do not incorporate it into the main cost-
benefit analysis.
3.3.3 Simple process of reverse vending machine
In this section the step procedure of the Reverse Vending Machine (RVM). In the diagram
waste plastic materials acts as input and then check by several sensors. The first machine
checks through the sensors whether the plastic material is received, or made of Plastic, or

32
whether it is empty. According to that, the weight sensor weighs the received plastic item
and gives output to the user in form of coins as per the weight of the item [25]. The
operation of RVM involved three steps (input, process, and output) as shown in figure 6.
Figure 15. Reverse vending machine block diagram. [25]
The user can insert plastic of any shape in a Reverse Vending Machine. After inserting
the plastic, it is checked by three Sensors. It is first checked by a capacitive proximity
sensor, then by an infrared photoelectric sensor, and last checked by the strain gauge
weight sensor. After the three checks, the user then will get coins based on the weight of
the Plastic. Moreover, the capacitive proximity sensor is used for the detection of metallic
and non-metallic objects (plastic, tin, Aluminum, wood, etc.). It uses the variation of ca-
pacitance between objects and sensors. The infrared photoelectric sensor is used to detect
the presence of non-ideal things as an input i.e., water, non-water-based fluids, stones,
etc. This sensor uses standard visible LEDs that pass-through water and detect it using a
1450 nm wavelength. Lastly, the strain gauge weight sensor is used to determine the
weight of up to 1 Kg of items. It is in the form of a straight bar and translates pressure or
force into an electrical signal [25].
3.3.4 Flow diagram
The flow diagram of the Smart Plastic Recycle Machine. The flow starts by receiving the
input, which is the plastic bottle or any other plastic thing. The sensor then detects the
plastic. If the sensor does not detect any plastic, the flow comes to a stop. If the sensor
detects a plastic, the sensor sends the plastic to the next sensor for water-based liquid
detection after this weight sensor checks plastic weight and give different output accord-
ing to weight range. [26]

33
Figure 16. Reverse Vending Machine flow diagram. [26]
3.4 Financial Feasibility
3.4.1 Details of financial assumptions
• Only two beverage companies are existing in the city with a joined target market
of around 50,000 liters each with 25,000 liters production per annum are herein
treated as a single/joined business undertaking.
• PET bottles assume to take 75 percent of the total packaging materials.
• 1 kilogram of PET is 80 soda bottles each with 12.5 grams weight so that for 100
kilograms there are 6,400 bottles of beverage.
• The price of virgin PET per kilogram is Ᵽ1.00 and Ᵽ 0.30 for recycling.
• PET cost recovery is based on 1.50 cents mark-up per bottle.
• PET bottles are taken to have separate accounting in this study.
• Fixed cost is estimated at 1.2 million (40% of total assets).
• The companies’ credit sales are 15 to 30 days with an inventory of 20% of sales.

34
• Tax is assumed at 30% of net sales.
• The annual cost of goods sold is 20% of the total value.
• Depreciation is based on the straight-line method for 10 years.
• Operating cost is estimated at 20 % of net sales per annum.
• All financial figures are projected according to the movement of the inflation rate
of 2.5% per year.
3.4.2 Projected income statement
The joint companies will have a net income growth rate of 5.17 percent CAGR from 2021
to 2024 and are expected to double in 13.5 years. The companies’ gross margin (Net Sales
– Cost of goods sold) is positive in all years of operation, that is, 288,000; 292,200;
302,580; and 310,144.5. These are sales revenues the companies retain after incurring the
direct costs associated with producing the goods it sells, and the services it provides. The
higher the gross margin, the more capital a company retains on each peso of sales, which
it can then use to pay other costs or satisfy debt obligations. The net sales figure is simply
gross revenue, less the returns, allowances, and discounts. On the other hand, the compa-
nies’ net profit margin 1 (Net sales – Expenses)/Net Sales is 16.35%; 17.11%; 17.85%;
and 18.58% from the year 2021 to 2024, respectively. The profit ratios were based on the
assumption that the PET recycling enterprise is a new venture. The profit margin can be
improved by increasing sales and reducing costs. Theoretically, higher sales can be
achieved by either increasing the prices or increasing the volume of units sold, or both.
Table 6. Projected Income of PET bottles in the city.
2021 2022 2023 2024
Gross Sales of PET bottles at
1.50 (Ᵽ)
480,000 492,000 504,300 516,907.5
Less: Cost of Raw material
(direct cost)
96,000 98,400 100,860 103,381.5
Net Sales (Ᵽ) 384,000 393,600 403,440 413,526
Expenses:
Operating Cost (Ᵽ) 86,000 88,150 90,353.7 92,612.5
Depreciation(Ᵽ) 120,000 120,000 120,000 120,000

35
Tax at 30% of Net sales (Ᵽ) 115,200 118,080 121,032 124,057.8
Total Expense (Ᵽ) 321,200 326,230 331,385.7 336,670.3
Net Income Ᵽ62,800 Ᵽ67,370 Ᵽ72,054.3 Ᵽ76,855.7
3.4.3 Projected balance sheet
The companies’ current ratios (current asset/current liabilities) of 1.15; 1.158; 1.16; and
1.17 reflect the companies’ ability to meet their current liabilities that can be paid by their
current assets. Its debt-to-asset ratio is equal to 1 through the years since the companies
are not resorting to debt to finance its recycling plant. The companies can recoup their
investment by the pay-back period (Total Initial Investment)/average retained earnings
equivalent to 18.6 years liquidated mainly by the earnings of PET bottles alone.
Table 7. Projected balance sheet of PET bottles in the City.
2021 2022 2023 2024
Current Asset: Gross Sales
of PET bottles at 1.50 (Ᵽ)
480,000 492,000 504,300 516,907.5
Building, Machinery and
Equipment (Ᵽ)
1,200,000 1,080,000 960,000 840,000
Total Asset Ᵽ1,680,000 Ᵽ1,572,000 Ᵽ1,464,300 Ᵽ1,356,907.5
Total Liabilities
Current: Cost of Raw mate-
rial (direct cost) (Ᵽ)
96,000 98,400 100,860 103,381.5
Total Current Expenses (Ᵽ) 321,200 326,230 331,385.7 336,670.3
Retained Earnings (Ᵽ) 62,800 67,370 72,054.3 76,855.7
Fixed Asset: Bldg. Ma-
chinery & Equipment (Ᵽ)
1,200,000 1,080,000 960,000 840,000
Total Asset & Liabili-
ties/Equities
Ᵽ1,680,000 Ᵽ1,572,000 Ᵽ1,464,300 Ᵽ1,356,907.5

36
3.4.4 Projected cash flow Statement
Cash flow ratios compare the other elements of the DRS financial statements. A higher
level of cash flow indicates a better ability to withstand declines in operating perfor-
mance, as well as a better ability to pay current liabilities. It also gauges the liquidity of
the business which is important in evaluating the proposed DRS reported profits. The
increasing cash flow margin ratio (cash inflows/sales) of 13%, 13.69%, 14.28%, and
14.86% from 2021 to 2025 gives a reliable metric of cash generated by PET bottles alone
per unit of sales. The current liability coverage ratio (cash flow from operation/current
liabilities) of 1.49, 1.51, 1.52, and 1.53 from 2021 to 2025 indicates that for PET bottles
alone the proposed DRS is generating enough cash to pay for its current obligations and
further indicates that the PET bottle undertaking is not prone significant risk of bank-
ruptcy. The net cash inflow to net income of 1.0 from 2021 to 2025 indicates that the
proposed DRS is not engaging in any accounting trickery intended to inflate earnings
above cash flow.
Table 8. Projected cash flow statement of PET bottles in the City.
2021 2022 2023 2024
Inflows:
Current Asset: Gross Sales
of PET bottles at 1.50 (Ᵽ)
480,000 492,000 504,300 516,907.5
Gross Sales Ᵽ 480,000 Ᵽ 492,000 Ᵽ 504,300 Ᵽ 516,907.5
Outflows:
Current: Cost of Raw mate-
rial (direct cost)
96,000 98,400 100,860 103,381.5
Total Current Expenses 321,200 326,230 331,385.7 336,670.3
Net Inflows: 62,800 67,370 72,054.3 76,855.7
Beginning Balance Ᵽ 62,800 Ᵽ 130,170 Ᵽ 202,224.3 Ᵽ 279,080

37
3.5 Acceptability of MDRS
A survey on the acceptability of the Modified Deposit Return System was conducted. The
acceptability of DRS was solicited from college students in two major universities in one
city of Southern Philippines. The items of the questionnaire cover the circular flow from
collecting, sorting, and processing used PET, aluminum, and glass beverage bottles to recy-
cled/reused bottle products. Each question was measured through a Likert scale and was
interpreted using mean and standard deviation. The items were statistically validated using
the Cronbach alpha consistency criterion with consistency coefficients of 93 .5 percent. The
table shows that putting up a DRS in the city was generally acceptable. Specifically, the
participants consider DRS acceptable in terms of delivery of beverage products product
for sales in a retail/wholesale company and pays the deposit to the manufacturer or im-
porter of the beverage in the price of the product (3.947); return point and the processing
plant report the returned packages to the company (4.023); beverage manufacturers and
importers must pay membership fee to the deposit-based return system to be exempted
from packaging tax as an incentive for recycling (3.824); fees collected from the mem-
bers will cover the expenses of the return system (the result of i.e. logistics, the transpor-
tation of the packages in different stages of the recycling chain, the compensations paid
to the return points, and the processing of materials, among other things (4.017); deposit-
based return system should be managed or administered by a non-profit company (4.017);
consumer must identify a can or plastic bottle belonging to a deposit-based return system
of the company on the basis of the deposit marking on the package which also indicate
the value of the deposit (4.171); and reverse vending machine identifies a deposit bottle
or can by comparing its barcode and shape to the information in the reverse vending ma-
chines register (3.824). Moreover, the participants rated the following items completely:
the consumer pays the deposit when buying the product and receives it back when return-
ing the empty package to a returning point (4.216), and a decree should be implemented
on the recycling of different beverage packages through a deposit-based return system
which enables the efficient collection of packages for recycling (4.304).

38
Table 9. DRS acceptability mean score interpretation.
Acceptability of DRS Mean SD Interpreta-
tion
In DRS, the manufacturer or importer of the beverage de-
livers the product for sales in a retail/wholesale company
which pays the deposit to the manufacturer or importer of
the beverage in the price of the product
3.947
1.237
Acceptable
The consumer pays the deposit when buying the product
and receives it back when returning the empty package to
a returning point
4.216
1.185
Completely
Acceptable
The return point and the processing plant report the re-
turned packages to the company
4.023
1.116
Acceptable
The company pays the deposits to the return points per
the number of reported returned packages
4.140
1.118
Acceptable
A decree should be implemented on the recycling of dif-
ferent beverage packages through a deposit-based return
system which enables the efficient collection of packages
for recycling.
4.304
1.040
Completely
Acceptable
Beverage manufacturers and importers must pay a mem-
bership fee to the deposit-based return system to be ex-
empted from packaging tax as an incentive for recycling
3.824
1.199
Acceptable
The fees collected from the members will cover the ex-
penses of the return system (the result of i.e., logistics, the
transportation of the packages in different stages of the
recycling chain, the compensations paid to the return
points, and the processing of materials, among other
things).
4.017
1.095
Acceptable

39
The deposit-based return system should be managed or
administered by a non-profit company.
4.017
1.095
Acceptable
The return system should be managed/administered by
the government
3.721
1.204
Acceptable
The consumer identifies a can or plastic bottle belonging
to a deposit-based return system of the company based on
the deposit marking on the package which also indicates
the value of the deposit.
4.171
.982
Acceptable
The reverse vending machine identifies a deposit bottle
or can by comparing its barcode and shape to the infor-
mation in the reverse vending machine's register.
3.824
1.199
Acceptable
Overall Mean 4.019
1.134
Acceptable
40
4 CONCLUSION
The proposed DRS is a sound alternative that requires the collection of a monetary deposit
on beverage containers (refillable or non-refillable) at the point of sale and/or the payment
of refund value to the consumers. When the container is returned to an authorized re-
demption center or retailer, the deposit is partly or fully refunded to the redeemer (pre-
sumed to be the original purchaser). The system is effective especially when the govern-
ment may pass container deposit legislation to 1) encourage recycling and complement
existing problems of recycling programs, to reduce energy and material usage for con-
tainers, 2) to reduce PET beverage bottles along highways, in lakes, and rivers. 3) a rea-
sonable deposit provides an economic incentive to clean the environment and a significant
source of income to some poor individuals and non-profit civic organizations, and 3) to
extend the usable lifetime of taxpayer-funded landfills as deposits that are not redeemed
are often kept by distributors or bottlers to cover the costs of the system (including han-
dling fees paid to retailers or redemption centers to collect, sort, and handle the contain-
ers) or are turned over to the governmental entity involved to fund environmental pro-
grams. DRS is an effective initiative to restore and sustain the ecological balance and
before managing plastic bottle disposals effectively. It is a widely used initiative that en-
tails a series of financial refunds on smooth-drink, juice, milk, water, alcohol-beverage,
and another reusable packaging at the point of sale. When the bottle or container is re-
turned to an authorized redemption center or the unique vendor in a few jurisdictions, the
deposit is partly or fully refunded to the redeemer, presumed to be the unique purchaser.
The findings study revealed that the supply of PET bottles will double in 11.4 years such
that further schemes are needed to identify other potential problems and the conditions of
how and why legislation needs to be implemented.
On contrary, further developments are recommended to improve the next research case. So,
to speak, detection of whether the items are leading questions is an overdue undertaking
since the collection of data has already been completed and there is no way of redoing the
survey again given the time constraint. The detection of leading questions will be undertaken
in the next research case in the future. On the other hand, the study has no definite time
framework for the formulation of a contingency plan for the implementation of the pro-
posed project as it is foremost dependent on legislative action which also requires public
consultation. In addition, local legislative action, a national enabling law that must be

41
passed and approved by Congress. Besides, there are many support groups in support or
contrast to the proposed project hence requires for public consultation both at the city and
national level. Furthermore, the infrastructure for recycling is beyond the scope of the
study. The study is foremost concerned with the market, financial, technical, and broad
management aspects of the feasibility of the DRS. However, the recycling companies
should have been included as participants of the study to cover the complete chain of the
deposit-based return system and further justify its feasibility. Thus, it is recommended for
it to be included in a full-blown study in the future.
5 ACTION PLAN
The implementation of the proposed DRS consists of two phases: 1) initiation and 2)
implementation which includes organization and start of the operation. The initiation
phase covers the following: 1) presentation of DRS to the council committee on Ecology
and Environment and secure the needed scheduled of presentation to the City Council; 2)
followed by the presentation of DRS at the City Council with social media, radio, and TV
coverage; 3) securing city ordinance on the proposed DRS; 4) presentation of the pro-
posed DRS to PCFMI, PRA, and PARMS for their endorsement; 5) acceptability survey
of DRS by soft drink manufacturers, retailers, and plastic recyclers. The presentation in-
cludes the following important matters: 1) amount of deposit by manufacturer and retail-
ers, 2) product registration, 3) pledging security, 4) reporting of sales through the intranet,
5) and registration of membership and 6) deposit and recycling fee (see project imple-
mentation and evaluation chart).
Phase two covers organization and operation as follows:1) tiers and options for purchas-
ing Reverse Vending Machine, 2) information search, 3) evaluating purchase alternatives,
4) purchase decision and 5) delivery and installation. The proposed DRS will be presented
to the chairman of the committee on ecology and environment who will introduce a pro-
posed bill of city ordinance for adoption. This activity will be covered by radio and TV
media and will be further strengthened by social media. After the proposal shall have
been delivered by the council and ready for approval, the proposed DRS will be presented
to the PARMS. PCFMI, and PRA. With strong support from these associations, the re-
searcher will then begin the survey on the acceptability of the system by manufacturers
and retailers as to their benefits and responsibilities to wit: mechanics of the reverse

42
vending machine, administration, security contract, product registration, reporting of
sales, and other instruction. After the survey and results shall have been obtained, regis-
tration for membership will follow. Following the first phase will be the options for pur-
chasing the reverse vending machine (RVM) and information search. The gathered data
will be evaluated preceding the purchase decision. Lastly, when all the areas of concern
shall have been duly undertaken, delivery and installation will follow.
The researcher conducted armchair speculation on the timetable for implementation plan
using the critical path method (CPM) and project evaluation technique (PERT) which are
found in appendix 4 and 5, respectively. The process of implementing the proposed DRS
for the city is estimated to be completed within 19 months. The probability that the im-
plementation of the project within the 15th month is 97.26%. The beginning activity
(presentation of the proposed DRS to the chairman on a committee on ecology and envi-
ronment) is the only activity with a slack period of 2 months. The rest of the activities are
considered critical. Below is the PERT network and PERT CPM and implementation ac-
tivity table.
Figure 17. PERT network.

43
Table 10. Implementation activity.

44
(A) Presentation of DRS proposal to the city council’s committee on environment and
ecology
(B) Public Awareness Campaign on DRS with social media, radio, and TV news coverage
on the proposed DRS presented at the City Council
(C) Approval and Endorsement of City Government Officials accompanied by publicity
(D) Presentation of the proposed DRS to the Philippine Chamber of Food Manufacturers
Inc. (PCFMI) and endorsement
(E) Presentation of DRS to the Philippine Retailers Association in the Philippines (PRA)
(F) Presentation of the Philippine Alliance for Recycling and Materials Sustainability
(PARMS)
(G) Survey on Acceptability of the System by Manufacturers and Retailers as to their
benefits and responsibilities with the mechanics of the reverse vending machine, admin-
istration, security contract, product registration, reporting of sales, and other instruction.
(H) Registration of Membership
(I) Tiers and Options for Purchasing of Reverse Vending Machine
(J) Information Search
(K) Evaluating Purchase Alternatives
(L) Purchase Decision
(M) Delivery and Installation
Table 11. PERT CPM.

45
REFERENCES
[1] Hamilton, L 2019, Plastic and Climate. Available from: https://www.ciel.org/wp-
content/uploads/2019/05/Plastic-and-Climate-FINAL-2019.pdf Accessed 15.05.2020
[2] Ellen MacArthur Foundation 2016, The New Plastics Economy report offers blue-
print to design a circular future for plastics. Available from: http://www.worldstopex-
ports.com/plastic-item-exports-country/ Accessed 01.08.2020
[3] Belz, P. D.-M 2013, From passive consumers to sustainable entepreneurs. Available
from: https://www.tum.de/en/studinews/issue-032015/show/article/31228/ Accessed
01/07/2020
[4] Worldaerosols 2019, European recycled PET could soon be more expensive than
virgin PET. Available from: https://worldaerosols.com/news/european-recycled-pet-
could-soon-be-more-expensive-than-virgin-pet Accessed 01.06.2020
[5] Pledged System n.d., PALPA. Available from:
https://www.palpa.fi/juomapakkausten-kierratys/pantillinen-jarjestelma/#pantillisen-
palautusjarjestelman-hyotyja Accessed 11.06.2020
[6] Aquino, A, Deriquito, J, Festejo, M 2013, FFTC Agricultural Policy Flatform.
Available from: https://ap.fftc.org.tw/article/588 Accessed 1.07.2020
[7] MyProfile 2018, Howto. Available from: https://24howtowikies.blog-
spot.com/2018/06/how-to-find-percentage-error-in-maths.html Accessed 01.8.2020
[8] Mathematics, S. A 2013, SPM Additional Mathematics. Available from:
http://spmaddmaths.blog.onlinetuition.com.my/2013/10/7-1a-mean.html Accessed
01.8.2020
[9] Glen, S 2014, Statistics How To. Available from:
https://www.statisticshowto.com/cronbachs-alpha-spss/ Accessed 1.8.2020
[10] Golenko-Ginzburg, D 2003, PERT assumptions revisited, Omega, vol. 17, no. 4,
pp. 393-396 Available from:
https://www.sciencedirect.com/science/article/abs/pii/0305048389900534 Accessed
25.10.2020
[11] Fourie, D 2015, What is PERT and how we can use it. Available from:
https://www.linkedin.com/pulse/what-pert-how-can-we-use-dave-fourie-pmp-prince2-
#:~:text=PERT%20calculates%20a%20weighted%20average,Likely)%20%2B%20Pess
imistic)%2F6.&text=By%20using%20the%20simple%20formula,graph%20in%206%2
0equal%20blocks Accessed 25.10.2020
[12] DTI 2018, 2019 MSME Statistics. Available from:
https://www.dti.gov.ph/resources/msme-statistics/ Accessed 3.8.2020

46
[13] Workman, D 2020, Plastic Item Exports by Country. Available from:
http://www.worldstopexports.com/plastic-item-exports-country/ Accessed 10.09.2020
[14] Onstad, E 2019, Plastic bottles vs. aluminum cans: Who'll win the global water fight?
Available from: https://www.reuters.com/article/us-environment-plastic-aluminium-in-
sight-idUSKBN1WW0J5. Accessed 15.8.2020
[15] International, E 2019, Soft Drinks in the Philippines. Available from:
https://www.euromonitor.com/soft-drinks-in-the-philippines/report Accessed 3.8.2020
[16] GMA News 2018, Philippines 1 of 5 countries that produce half of world's plastic
waste UN report, Available from https://www.gmanetwork.com/news/life-
style/healthandwellness/655744/phl-1-of-5-countries-that-produce-half-of-world-s-plas-
tic-waste-un-report/story/ Accessed 25.08.2020
[17] PSA 2019, Population Projection Statistics. Retrieved from:
https://psa.gov.ph/statistics/census/projected-population Accessed 3.8.2020
[18] Walls, M 2011, Deposit-Refund Systems in Practice and Theory. Research Gate
Journal. SSRN Electronic Journal. DOI 10.2139/ssrn.1980142. Available from:
https://www.researchgate.net/publication/228203610_Deposit-Refund_Sys-
tems_in_Practice_and_Theory/citations Accessed 01.06.2020
[19] Kagan, J 2020, Pigovian Tax. Available
from:https://www.investopedia.com/terms/p/pigoviantax.asp Accessed 01.06.2020
[20] Deposit Return Schemes 2020, TOMRA. Retrieved from:
https://www.tomra.com/en-gb/collection/reverse-vending/about-deposit-return-schemes
Accessed 1.8.2020
[21] Deposit Return: How it Works 2020, Reloop. Available from:
https://www.reloopplatform.org/resources/videos/ Accessed 1.8.2020
[22] Reloop 2017, Deposit Return System: Studies Confirm Big Savings to Municipal
Budgets. Available from: https://www.reloopplatform.org/wp-content/up-
loads/2017/10/Fact-Sheet-Economic-Impacts-to-Municis-New.pdf Accessed 5.7.2020
[23] Ackerman, F 2013. Why do we recycle. Retrieve from:
https://islandpress.org/books/why-do-we-recycle Accessed 5.8.2020
[24] Ewadinger, M. & Mouw, S 2005. Survey findings, Recycling creates jobs and
boosts economy. Available from: https://www.researchgate.net/publica-
tion/294629508_Survey_findings_Recycling_creates_jobs_and_boosts_economy/cita-
tion/download Accessed 15.8.2020
[25] Sakshi Sharma, A. M 2014, Implementation of Reverse Vending Machine Based
on FPGA. International Journal of Emerging Technologies in Computational and
Applied Sciences, 265-267. Available from:
https://www.academia.edu/6367047/IJETCAS14_153 Accessed 3.8.2020

47
[26] Gaur, A, Mathuria, D and Pridyarshini, R 2018, A Simple Approach of an Auto-
mated Vending Machine. International Journal of Electronics, Electrical and Computa-
tional System IJEECS ISSN 2348-117X Volume 7, Issue 3 March 2018. Available
from: https://moam.info/a-simple-approach-to-design-reverse-vending-ma-
chine_5bbcbdf8097c47e51c8b4636.html Accessed 1.8.2020
[27] Hanks, G 2017. Three Factors That Impact Demand for Soft Drinks. Available
from: https://bizfluent.com/info-7742456-globalization-food-beverage-industry.html
Accessed: 3.12.2020
[28] OECD 2018, Improving Plastics Management, Available from
https://www.oecd.org/environment/waste/policy-highlights-improving-plastics-
management.pdf Accessed 10.06.2020
[29]Philippines, DOH n.d., Department of Health. Available from:
https://www.doh.gov.ph: https://www.doh.gov.ph/node/3840 Accessed
[30] The program, U. e. 2018, UN environment program. Available from:
https://www.unenvironment.org/resources/report/single-use-plastics-roadmap-
sustainability Accessed 10.06.2020
[31] Wolfgang, R 2018, How do container deposit schemes work? TOMRA Reverse
Vending Machine Recovery. Available from: https://newsroom.tomra.com/how-do-con-
tainer-deposit-schemes-work/.https://www.beveragedaily.com/Article/2009/09/21/PET-
bottles-greener-than-glass-or-aluminium-Study Accessed: 25.05.2020
[32] Morawski, C. 2019, Deposit Return Systems. Available from:
https://www.reloopplatform.org/resources/presentations-webinars/ Accessed 3.8.2020
[33] program, U. e. 2018, UN environment program. Available from
https://www.unenvironment.org/resources/report/single-use-plastics-roamap-
sustainability Accessed 3.8.2020
[34] Dewees, D.N., Hare, M.J 1998, Economic analysis of packaging waste reduction.
Canadian Public Policy 24 (4), pp. 453–470. Available from:
https://ideas.repec.org/a/cpp/issued/v24y1998i4p453-470.html Accessed 5.8.2020
[35] Lebreton, L., van der Zwet, J., Damsteeg, J. W., Slat, B., Andrady, A., & Reisser, J.
2017, River plastic emissions to the world's oceans. Nature communications, 8, 15611.
Available from: https://doi.org/10.1038/ncomms15611 Accessed 7.8.2020
[36] UN World Population Prospects 2020. World Population Review. Available from:
https://worldpopulationreview.com/countries/philippines-population Accessed: 1.8.2020
[37] Colchero, M.C.; Salgado, J.C.; Hernadndez-Avila, Unar Munguia, and Rivera-
Dommarco, J.A 2015. Price Elasticity of the Demand for Sugar Sweetened Beverages in
Mexico. Available from: https://www.sciencedirect.com/science/arti-
cle/pii/S1570677X15000611 Accessed: 3.12.2020

48
[38] Little knon facts about PET Plastics 2015, PETRA. Available from:
http://petresin.org/news_didyouknow.asp Accessed 01/7/2020
[39] Mubeena, S, S 2017. A Consumer Survey on Preferences of Soft Drinks in Different
Stages of Adolescence. Research and Reviews: Journal of Dairy Science and Technology,
Vol. 6, Issue 3. Available from: https://www.researchgate.net/publica-
tion/336669545_A_Consumer_Survey_on_Preferences_of_Soft_Drinks_in_Differ-
ent_Stages_of_Adolescence Accessed: 3.12.2020
[40] World Population Review 2020. Philippne Population Live. Available from:
https://worldpopulationreview.com/countries/philippines-population Accessed:
3.12.2020
[41] Treadmills Reviews 2019. A look Under the Cap: Water Bottle, Germs Revealed.
Available from: https://www.treadmillreviews.net/water-bottle-germs-revealed-2019/
Accessed: 3.12.2020
[42] Parson, J 2016. Why does Coca Cola taste better than a can? Science has the answer.
Available from: https://www.mirror.co.uk/news/technology-science/science/coca-cola-
taste-better-glass-7376374 Accessed: 3.12.2020

APPENDIX 1. SURVEY QUESTIONNAIRE (SUPPLY)
SURVEY QUESTIONNAIRE (Form 1 – Supply of Beverage Bottles in Cagayan de Oro City)
IMPORTANT NOTE. The items in this survey questionnaire are grouped into two parts:
supply and demand for PET, aluminum, and glass beverages bottles. This is of the fact
that your company supplies its demand. Hence, many of the items are the same however
have different cost accounting and should be treated separately. Please answer all the
items mainly within the perspective of demand and supply including supply for and de-
mand from other companies. Answer the items or sub-items that apply solely to your
company’s market in Cagayan de Oro City, Philippines.
A. Company Profile. Please specify the number of years of operation in the manu-
facturing of PET, aluminum, and glass beverage bottles.
• No. of years in operation. Please specify for each type of bottle.
PET bottles _______years
Aluminum bottles _______years
Glass bottles _______years
• Size of Beverage Bottle Operation. The size of your beverage bottle opera-
tion is classified according to the Department of Trade and Industry (DTI)
category of micro, small, and medium enterprises (MSME). Please check the
appropriate box. You can add additional line box/es for more information
Micro
Small
Medium
Large
CATEGORY OF MSME
Enterprise By Asset Size By number of employ-
ees
Micro Up to 3.000.000 1 – 9
Small 3.000.001 to 15,000,000 10 - 99
Medium 15,000,001 to
100,000,000
100 - 199
Large 100,000,001 and Above 200 and Above
Source: DTI, 2010

1/1(7)
B. SUPPLY ASPECT (For Supplier of PET, aluminum, glass beverage bottles
only)
1. Type of beverage packaging bottles your company manufactures. Please indicate
also if raw materials used are recycled, single-use, and reuse. Also, specify if the
source of raw materials is imported or local. Please check the appropriate box/es.
Type of Bottle/ Single use (Virgin) Recycled Reuse
Source of Raw
Material
Im-
ported
Local Im-
ported
Local Im-
ported
Lo-
cal
PET Bottles
Aluminum Bot-
tles
Glass Bottles
2. Of the three types of beverage bottles which one shares the largest revenue your
company manufacture? Please ranked from highest (1) – lowest (3) category.
PET_____________ Aluminum_______________ Glass_____________
3. What percentage does the total accounting cost of production to the revenue for
each type of beverage bottle your manufacture? Total accounting production
cost includes direct, indirect, fixed, variable, and operating cost. The information
obtains herein is very important in the study as it determines the financial feasi-
bility of the proposed project. Please specify the percentage of each accounting
cost of each type of beverage bottle. For your reference, the following costs are
operationally defined as follows:
Direct costs are related to producing a good or service. These include raw materials, la-
bor, and expense or distribution costs associated with producing a product. The cost can
easily be traced to a product, department, or project.
Indirect costs are expenses unrelated to producing a good or service. An indirect cost
cannot be easily traced to a product, department, activity, or project.
Fixed costs do not vary with the number of goods or services a company produces over
the short term.
Variable costs fluctuate as the level of production output changes, contrary to a fixed cost.
This type of cost varies depending on the number of products a company produces. A
variable cost increases as the production volume increases, and it falls as the production
volume decreases.
Operating costs are expenses associated with day-to-day business activities but are not
traced back to one product. Operating costs can be variable or fixed.
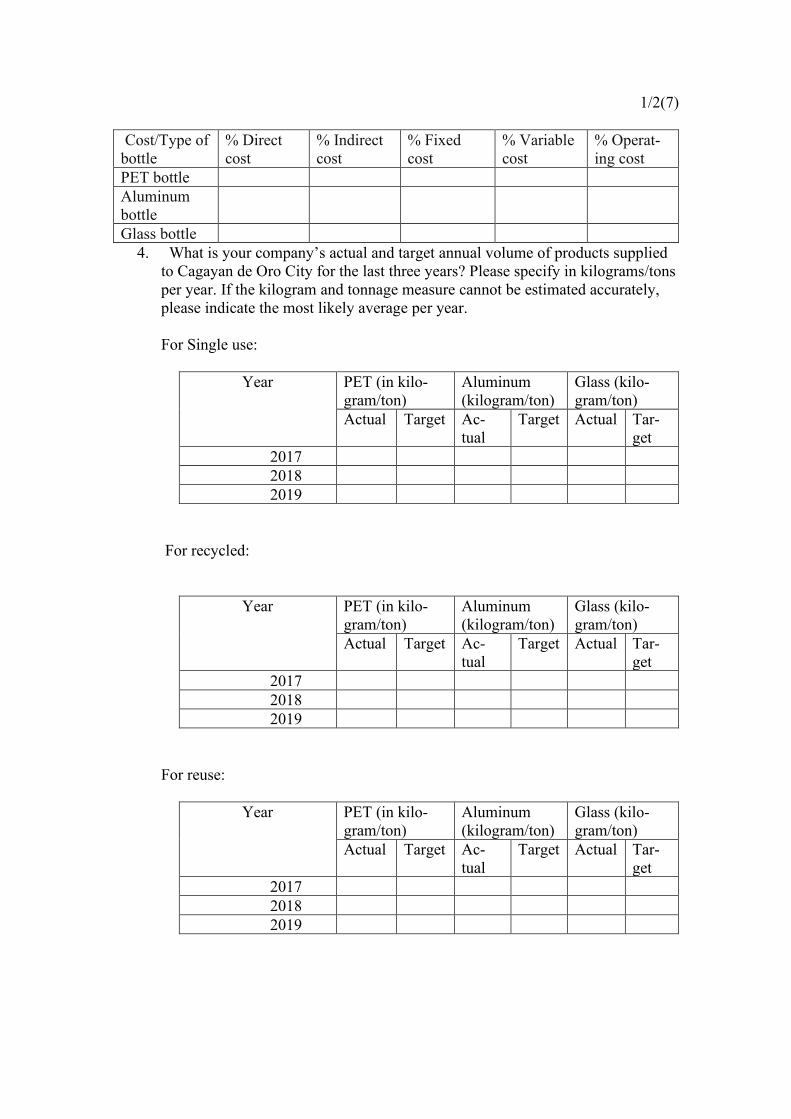
1/2(7)
Cost/Type of
bottle
% Direct
cost
% Indirect
cost
% Fixed
cost
% Variable
cost
% Operat-
ing cost
PET bottle
Aluminum
bottle
Glass bottle
4. What is your company’s actual and target annual volume of products supplied
to Cagayan de Oro City for the last three years? Please specify in kilograms/tons
per year. If the kilogram and tonnage measure cannot be estimated accurately,
please indicate the most likely average per year.
For Single use:
Year PET (in kilo-
gram/ton)
Aluminum
(kilogram/ton)
Glass (kilo-
gram/ton)
Actual Target Ac-
tual
Target Actual Tar-
get
2017
2018
2019
For recycled:
Year PET (in kilo-
gram/ton)
Aluminum
(kilogram/ton)
Glass (kilo-
gram/ton)
Actual Target Ac-
tual
Target Actual Tar-
get
2017
2018
2019
For reuse:
Year PET (in kilo-
gram/ton)
Aluminum
(kilogram/ton)
Glass (kilo-
gram/ton)
Actual Target Ac-
tual
Target Actual Tar-
get
2017
2018
2019

1/3(7)
5. What is/are the end-uses of your manufactured beverage PET, Aluminum, and
Glass bottles?
Bottled water
Carbonated soft drinks
Food bottles and jars
Non-food bottles and jars
Fruit juices
Beer
Others, please spec-
ify___________________________________________________
6. Please specify the reasons responsible for the behavior of your annual produc-
tion. For example, the reasons why PET, aluminum, or glass bottle production
shares a larger percentage than other raw materials (e.g. cost of raw materials,
regulations, ease of manufacturing, transportation, demand, regulations, and the
like). Please check the appropriate box or boxes.
Polyethylene Terephthalate (PET)
Cost-effective raw materials available
Ideal packaging for beverage
Varied packaging design possibilities
Can create a customized solution
Product protection
Increasing consumer preference
Ease of manufacturing
Recyclability
Others, please spec-
ify____________________________________________________
Aluminum
Recyclability
Cost-effective raw material
Ideal packaging for beverage
Varied packaging design possibilities
Can create a customized solution
Product protection
Increasing consumer preference
Ease of manufacturing
Others, please spec-
ify_____________________________________________________
__________

1/4(7)
Glass
Recyclability
Cost-effective raw material
Ideal packaging for beverage
Varied packaging design possibilities
Can create a customized solution
Product protection
Increasing consumer preference
Ease of manufacturing
Others, please spec-
ify_____________________________________________________
__________
7. In terms of the supply chain, what channel of distribution your company
adopted? Please check the appropriate box or boxes.
Business to Business (B2B) – company to company
Retail
Households
Others, please spec-
ify________________________________________________________
___________
8. What is your estimated percent market share of the entire supply market (100%)
for PET, aluminum, and glass bottles by the source of raw materials? Please
specify in percent.
Type of Bottles
and
Single-used (Vir-
gin)
Recycled Reuse
Raw materials % Market Share % Market Share % Market Share
PET bottles
Aluminum Bot-
tles
Glass Bottles
9. Indicate the ways your company has or will have identified your target market
for PET, aluminum, and glass bottles? Please appropriate box or boxes.
Customer Needs
Product reviews from social media that competitors do not currently sup-
ply
Reviews of market research on the current trends of genuine customer
needs
Assessment of competitors’ product ranges that the proposed project can
fill
Marketing programs aim to target relevant and important target audience

1/5(7)
Others, please spec-
ify_______________________________________________________
Target Market
Selecting a target market that ensures the company’s focus resources on
marketing priorities
Uses communication channels such as salesforce, customers newslet-
ters, telesales, or email to announce a new product
Advertising or public relations to create awareness of the product
Others, please spec-
ify_______________________________________________________
____________________
Channels
Motivating Salesforce. retailers, and distributors for the successful
launching of the project
Understanding real customers’ benefits of the new product
Provide guides and incentive programs to motivate and generate sales
Others, please spec-
ify_______________________________________________________
________
Running a Test Market
Running a test market before launching the product to gather infor-
mation on all aspects of the product to minimize the risk of failure
Choose the target market with demographic characteristics like the tar-
get market in terms of price, retail performance, and consumer response
to advertising, packaging, and sales promotion.
Others, please spec-
ify_______________________________________________________
_____________________
Support System
Existing government rules and regulations supporting the recycling of
PET, aluminum, and glass bottle-to-bottle materials
Tax incentives
Training of manpower during the construction and installation of the
project
Others, please spec-
ify_______________________________________________________________
_____________

1/6(7)
10. What are your major customers for PET, aluminum, and glass beverage bottles
in Cagayan de Oro City in terms of their satisfaction with PET, aluminum, and
glass bottles; mode of payments; satisfaction with product features, or marketing
program they want to?
10.1 Satisfaction for beverage bottle or container. Please check the appro-
priate box or boxes.
Bottle Very satisfied Satis-
fied
Somewhat
satisfied
Not satis-
fied
PET
Aluminum
Glass
10.2 Product features and marketing services (PET bottles).
Key Performance Indica-
tors
Very
satis-
fied
Satis-
fied
Some-
what sat-
isfied
Not
satis-
fied
Product design, size,
shapes, and durability
Strong customer service
support
Ability to respond to cus-
tomer delivery needs
Cost competitiveness of the
product per unit
Engagement with custom-
ers specific needs and re-
quests
10.3 Mode of payments from customers. Please check appropriate box or
boxes
Cash
Cheque
Mail Transfer/Telegraphic Transfer
Bill of Exchange
Promissory Note
Bank Draft
Others. Please specify__________

1/7(7)
11. Do you think your company will have more market for beverage bottles in the
future?
11.1 If your answer is yes, how many times larger will your market be
in the next five years? Please specify how many
times_____________
11.2 What do you think are the reasons responsible for the increase in
your market in the future? Please spec-
ify__________________________________________________
_____

APPENDIX 2. SURVEY QUESTIONNAIRE (DEMAND)
SURVEY QUESTIONNAIRE (Form 2 - Demand for Beverage Bottles in Cagayan de Oro City)
IMPORTANT NOTE. Answer only the items or sub-items that specifically applies
solely to your company’s sales coming from Cagayan de Oro City, Philippines.
1. Size of Beverage Bottled Product Manufacturing Department. The size of your
operation is classified according to the Department of Trade and Industry (DTI)
category of micro, small, and medium enterprises (MSME). Please check the ap-
propriate box. You can add additional line box/es for more information
Micro
Small
Medium
Large
CATEGORY OF MSME
Enterprise By Asset Size By number of employ-
ees
Micro Up to 3.000.000 1 – 9
Small 3.000.001 to 15,000,000 10 - 99
Medium 15,000,001 to
100,000,000
100 - 199
Large 100,000.001 and Above 200 and Above
Source: DTI, 2010
• Does your company have its PET, aluminum, and glass beverage bottle pro-
duction department? Please check the appropriate box or boxes below.
YES NO
• If yes, is the volume of production enough to supply the company’s demand
for PET, aluminum, and glass bottles? YES NO
A. Demand Aspect
1. Type of beverage packaging bottles your company consumed per annum. Please
indicate if raw materials used are recycled, single-use, and reuse. Also, indicate
if the supply for the bottles is imported or locally sourced. (Please check the ap-
propriate box).
Type of Bottle/ Single use (Virgin) Recycled Reuse
Source of Raw
Material
Im-
ported
Local Im-
ported
Local Im-
ported
Lo-
cal
PET Bottles
Aluminum Bot-
tles
Glass Bottles

2/1(7)
2. Of the three types of beverage bottles which one shares the largest revenue of
your company’s manufactured beverage? Please ranked from highest (1) – low-
est (3) category.
PET_____________ Aluminum_______________ Glass_____________
3. What reasons you can account for the behavior of your company’s choice of
beverage bottle packaging behavior?
Polyethylene Terephthalate (PET)
Cost-effective raw materials available
Ideal packaging for beverage
Varied packaging design possibilities
Can create a customized solution
Product protection
Increasing consumer preference
Ease of manufacturing
Recyclability
Others, please spec-
ify_____________________________________________________
____________
Aluminum
Recyclability
Cost-effective raw material
Ideal packaging for beverage
Varied packaging design possibilities
Can create a customized solution
Product protection
Increasing consumer preference
Ease of manufacturing
Others, please spec-
ify_____________________________________________________
____________
Glass
Recyclability
Cost-effective raw material
Ideal packaging for beverage
Varied packaging design possibilities
Can create a customized solution
Product protection
Increasing consumer preference
Ease of manufacturing

2/2(7)
Others, please spec-
ify_____________________________________________________
____________
4. What is your actual and target average annual demand for PET bottles, alumi-
num, and glass bottles (in kilogram/ton)?
For single-used (Virgin)
Year Demand for PET
bottles (in kilo-
gram/ton)
Demand for Alu-
minum bottles
(kilogram/ton)
Demand for
Glass bottles
(kilogram/ton)
Actual Target Actual Target Actual Tar-
get
2017
2018
2019
For recycled:
Year Demand for PET
bottles (in kilo-
gram/ton)
Demand for Alu-
minum bottles
(kilogram/ton)
Demand for
Glass bottles
(kilogram/ton)
Actual Target Actual Target Actual Target
2017
2018
2019
For reuse:
Year/De-
mand
Demand for PET
bottles (in kilo-
gram/ton)
Demand for Alu-
minum bottles (kil-
ogram/ton)
Demand for
Glass bottles
(kilogram/ton)
Actual Target Actual Target Ac-
tual
Target
2017
2018
2019

2/3(7)
5. What percentage does the total accounting cost of production to the revenue for
each type of bottled beverage your company manufacture? Total accounting pro-
duction cost includes direct, indirect, fixed, variable, and operating cost. The in-
formation obtains herein is very important in the study as it determines the fi-
nancial feasibility of the proposed project. Please specify the percentage of each
accounting cost of each type of beverage bottle. For your reference, the follow-
ing costs are operationally defined as follows:
Direct costs are related to producing a good or service. These include raw materials,
labor, and expense or distribution costs associated with producing a product. The cost
can easily be traced to a product, department, or project.
Indirect costs are expenses unrelated to producing a good or service. An indirect cost
cannot be easily traced to a product, department, activity, or project.
Fixed costs do not vary with the number of goods or services a company produces
over the short term.
Variable costs fluctuate as the level of production output changes, contrary to a fixed
cost. This type of cost varies depending on the number of products a company pro-
duces. A variable cost increases as the production volume increases, and it falls as the
production volume decreases.
Operating costs are expenses associated with day-to-day business activities but are
not traced back to one product. Operating costs can be variable or fixed.
Cost/Type
of bottle
% Direct
cost
% Indirect
cost
% Fixed
cost
% Variable
cost
% Operat-
ing cost
PET bottled
beverages
Aluminum
bottled bev-
erages
Glass bot-
tled bever-
ages
6. What do you use manufactured beverage PET, Aluminum, and Glass bottles for?
Please specify by checking the appropriate box or boxes.
6.1 For PET bottles
Bottled water
Carbonated soft drinks
Food bottles and jars
Non-food bottles and jars
Fruit juices

2/4(7)
Beer
Others, please spec-
ify___________________________________________________
6.2 For Aluminum containers
Bottled water
Carbonated soft drinks
Food bottles and jars
Non-food bottles and jars
Fruit juices
Beer
Others, please spec-
ify___________________________________________________
6.3 For Glass bottles
Bottled water
Carbonated soft drinks
Food bottles and jars
Non-food bottles and jars
Fruit juices
Beer
Others, please spec-
ify___________________________________________________
7. Please specify the reasons responsible for the behavior of your annual consump-
tion of PET, aluminum, and glass bottles? For example, the reasons why PET,
aluminum, or glass bottle production shares a larger percentage than other raw
materials (e.g. cost of raw materials, regulations, ease of manufacturing, trans-
portation, demand, regulations, and the like). Please check the appropriate box
or boxes.
Polyethylene Terephthalate (PET)
Cost-effective raw materials available
Ideal packaging for beverage
Varied packaging design possibilities
Can create a customized solution
Product protection
Increasing consumer preference
Ease of manufacturing
Recyclability
Others, please spec-
ify_____________________________________________________
____________

2/5(7)
Aluminum
Recyclability
Cost-effective raw material
Ideal packaging for beverage
Varied packaging design possibilities
Can create a customized solution
Product protection
Increasing consumer preference
Ease of manufacturing
Others, please spec-
ify_____________________________________________________
____________
Glass
Recyclability
Cost-effective raw material
Ideal packaging for beverage
Varied packaging design possibilities
Can create a customized solution
Product protection
Increasing consumer preference
Ease of manufacturing
Others, please spec-
ify_____________________________________________________
____________
8. In terms of the supply chain, what channel of distribution your company
adopted? Please check the appropriate box or boxes.
Business to Business (B2B) – company to company
Retail
Households
Others, please spec-
ify________________________________________________________
________________

2/6(7)
9. What is your estimated 3 –year average percent market share of the entire de-
mand market for beverages (100%) by type of bottle use and source of raw ma-
terials? Please specify in percent.
Type of Bottles
and
Single-use (Vir-
gin) Material
Recycled Mate-
rial
Reuse Material
Raw materials % Market Share % Market Share % Market Share
PET bottled bev-
erages
Aluminum Bot-
tled beverages
Glass Bottled
beverages
10. What are your major customers for PET, aluminum, and glass beverage bottled
beverages in Cagayan de Oro City in terms of their satisfaction with PET, alumi-
num, and glass bottled beverages; mode of payments; satisfaction with product
features or marketing program they want to?
10.1 Satisfaction for beverage bottle or container. Please check the appropriate
box or boxes.
Bottle Very satisfied Satis-
fied
Somewhat
satisfied
Not satis-
fied
PET
Aluminum
Glass
10.2 Mode of payments from customers. Please check appropriate box or boxes
Cash
Cheque
Mail Transfer/Telegraphic Transfer
Bill of Exchange
Promissory Note
Bank Draft
Others. Please specify__________
11. Do you think your company will have more markets for beverages in the future?
a. If your answer is yes, how many times larger will your market be in the
next five years? Please specify how many times_____________
b. What do you think are the reasons responsible for the increase in your
market in the future? Please spec-
ify________________________________________________________
_________________________________________________________

2/7(7)
12. Why do customers buy from your company’s bottled beverage/s? Please check
appropriate box below as 5 = strongly agree, 4 = Agree, 3 = Not sure, 2 = Disa-
gree, 1 = strongly disagree.
KPI Strongly
agree
Agree Unsure Disa-
gree
Strongly
disagree
Trust of the product
and services
Competitiveness of the
brand of the product
Respond to the ethics
and moral of delivering
quality products
Indirect or direct cus-
tomer need fulfillment
Provides economic and
social value to the cus-
tomers
13. What single aspect of your brand that stands out and makes clients trust you?
KPI Strongly
agree
Agree Unsure Disagree Strongly
disagree
High trust factor
Identify and build one
factor to another that
makes the company pref-
erable over competitors
Financial strength that
appeals to your brand
differently
The perception amongst
peers, consumers, and
society alike
Technology update and
application
Charging the right price
Constant and prudent
communication with cus-
tomers about the benefits
of brand improvement

APPENDIX 3. DRS ACCEPTABILITY QUESTIONNAIRE
Survey Questionnaire (Form 3 – Acceptability of DRS)
The items below describe how the deposit-based return system operates in many European
countries as demonstrated in figure 2. It is important to note that the Philippines does not
have a deposit-based return system. However, if the country should adopt one that is similar
or modified, the level of acceptability of the system can be determined by your ratings in
each item. Please rate each item by checking the appropriate box as:
5 = Completely acceptable (CA)
4 = Acceptable (C)
3 = Somewhat acceptable (SA)
2 = Unacceptable (U)
1 = Completely Unacceptable (CU)
Acceptability of DRS CA A SA U CU
In DRS, the manufacturer or importer of the beverage delivers
the product for sales in a retail/wholesale company which
pays the deposit to the manufacturer or importer of the bev-
erage in the price of the product
The consumer pays the deposit when buying the product and
receives it back when returning the empty package to a re-
turning point
The return point and the processing plant report the returned
packages to the company
The company pays the deposits to the return points following
the number of reported returned packages
A decree should be implemented on the recycling of different
beverage packages through a deposit-based return system
which enables the efficient collection of packages for recy-
cling.
Beverage manufacturers and importers must pay the mem-
bership fee to the deposit-based return system to be exempted
from packaging tax as an incentive for recycling
The fees collected from the members will cover the expenses
of the return system (the result of i.e. logistics, the transpor-
tation of the packages in different stages of the recycling
chain, the compensations paid to the return points, and the
processing of materials, among other things).
The deposit-based return system should be managed or ad-
ministered by a non-profit company.

The return system should be managed/administered by the
government
The consumer identifies a can or plastic bottle belonging to a
deposit-based return system of the company based on the de-
posit marking on the package which also indicates the value
of the deposit.
The reverse vending machine identifies a deposit bottle or
can by comparing its barcode and shape to the information in
the reverse vending machines register.

APPENDIX 4. Cronbach’s Alpha Result
Reliability Statistics
Cronbach's Al-
pha
Cronbach's Al-
pha Based on
Standardized
Items
N of Items
.935 .935 11
Item Statistics
Mean Std. Deviation N
Item1 3.9474 1.23794 171
Item2 4.2164 1.18568 171
Item3 4.0234 1.11647 171
Item4 4.1404 1.11838 171
Item5 4.3041 1.04089 171
Item6 3.8246 1.19985 171
Item7 4.0175 1.09262 171
Item8 4.0117 1.09538 171
Item9 3.7251 1.19824 171
Item10 4.1637 .98044 171
Item11 3.8246 1.19985 171
Item-Total Statistics
Scale Mean if
Item Deleted
Scale Variance
if Item Deleted
Corrected Item-
Total Correla-
tion
Squared Multi-
ple Correlation
Cronbach's Al-
pha if Item De-
leted
Item1 40.2515 76.378 .758 . .927
Item2 39.9825 79.041 .658 . .931
Item3 40.1754 78.004 .764 . .927
Item4 40.0585 79.538 .678 . .930
Item5 39.8947 79.295 .752 . .927
Item6 40.3743 76.765 .766 . .927
Item7 40.1813 77.479 .813 . .925
Item8 40.1871 77.577 .805 . .925
Item9 40.4737 80.686 .566 . .935
Item10 40.0351 81.481 .671 . .931
Item11 40.3743 76.765 .766 . .927


