40
A Finite State Machine Model of TCP Connections in the Transport Layer J. Treurniet and J.H. Lefebvre Defence R&D Canada √ Ottawa TECHNICAL MEMORANDUM DRDC Ottawa TM 2003-139 November 2003
A Finite State Machine Model of TCP Connections in the Transport Layer
J. Treurniet and J.H. Lefebvre
Defence R&D Canada √ Ottawa TECHNICAL MEMORANDUM
DRDC Ottawa TM 2003-139 November 2003

A Finite State Machine Model of TCP Connections inthe Transport Layer
J. Treurniet and J. H. Lefebvre
Defence R&D Canada – OttawaTechnical Memorandum
DRDC Ottawa TM 2003-139
November 2003

Her Majesty the Queen as represented by the Minister of National Defence, 2003
Sa majeste la reine, representee par le ministre de la Defense nationale, 2003
Abstract
Finite state machines can be used to detect anomalous behaviour in TCP traffic by describ-ing the progression of a connection through states as a result of events based on headerflags. The method was applied to real traffic to understand its realistic use and it was foundthat for the time period analysed here, on the order of 37% of TCP connections do notfollow the TCP protocol specifications. The majority of these are a result of malicious ac-tivity, and approximately 4% are due to benign anomalies such as unresponsive hosts andmisconfigurations. The method may be applied as a network security measure, as a networkmanagement tool or as a research tool for the study of TCP behaviour on the Internet.
Resume
Les modeles d’automate a etats finis peuvent servir a deceler les comportements anormauxdans le trafic TCP en decrivant la progression d’une connexion dans ses differents etats enfonction des evenements bases sur les indicateurs des en-tetes. La methode a ete appliqueeau trafic reel pour en comprendre l’utilisation realiste et on a constate que, pour la periodede l’examen, environ 37% des connexions TCP ne respectaient pas les specifications du pro-tocole TCP. La majeure partie de ces connexions decoulaient d’activites malicieuses, alorsque 4% etaient causees par des anomalies benignes, comme des hotes qui ne repondaientplus ou des erreurs de configuration. Cette methode peut etre appliquee comme mesure desecurite du reseau, comme outil de gestion du reseau ou comme outil de recherche pourl’etude du comportement du protocole TCP dans Internet.
DRDC Ottawa TM 2003-139 i

This page intentionally left blank.
ii DRDC Ottawa TM 2003-139
Executive summaryBackground
The protocols employed on computer networks are intended to be well-defined via Re-quest for Comments (RFC) documents [8]. In reality, there is enough freedom in the RFCspecifications of the protocols that they can vary widely from one implementation to thenext [2, 3, 4].
Here, we study the Transmission Control Protocol (TCP), which is the most prevalent pro-tocol on the Internet today [1]. TCP is a reliable protocol, and its behaviour follows apattern that is somewhat predictable: a three-way handshake is followed by data exchange,which is followed by a closing. The “flags” in the TCP header convey the commands thatcarry a connection through these stages. By defining the states of a Finite State Machine(FSM) [17] to reflect the stages of a connection and using the flags as the events that bringabout transitions among the states, we model a TCP connection as an FSM.
To use the model for strict anomaly detection [10], a failure state is introduced to indicatethe occurrence of a disallowed event or an attempted illegal transition. When the time-ordered flags of a TCP connection is input into the FSM, if the connection enters a failurestate or otherwise does not complete, the connection is flagged as anomalous. The state thatthe connection was in and the event that led to the failure can be stored to give an indicationof the reason that the failure occurred. The TCP FSM can be used to detect some networkmanagement issues and network security events, and it can also be used as a research toolto study the behaviour of TCP on the Internet.
Principal Results
Traffic for a 24 hour period in August 2000 was input into the TCP FSM to test the realisticuse of the algorithm. Two large-scale scans were easily identified. Some slow scans werefound by examining the periodicity of anomalies coming from the same source address.The FSM model’s reporting method makes it obvious whether a response was made to ascan packet. Side-effects of filtering rules were identified.
Backscatter from scans and denial of service attacks on other networks appeared in ourdata, as did unresponsive hosts. The effect of network delays could also be seen, and wassometimes disruptive. Some connections were abandoned, verifying accounts from theInternet community that some web connections get stuck in a half-closed state [26]. Otherconnections that appeared to be abandoned were a side-effect of a possible NAT-relatedproblem: IP addresses and/or ports were being changed during a connection. Other casesof a malfunctioning of a TCP implementation were observed.
Significance of Results and Future Work
The FSM representation of TCP connections provides a means of identifying packet flowson a network that do not conform to the expected behaviour of the protocol. The results
DRDC Ottawa TM 2003-139 iii
show that the concept is viable and encourages investigation of the algorithm as an strictanomaly detection Intrusion Detection System (IDS).
We would like to extend the model to include traffic generation, i.e. inclusion of anomaliesin generated traffic data. The model may also provide a basis for a Markov-based statis-tical anomaly detection algorithm, where the probability of each connection’s validity iscalculated. Analysis of the evolution of TCP over time is another application of interest.
J. Treurniet and J. H. Lefebvre; 2003; A Finite State Machine Model of TCP Connections inthe Transport Layer; DRDC Ottawa TM 2003-139; Defence R&D Canada – Ottawa.
iv DRDC Ottawa TM 2003-139

SommaireRenseignements generaux
On veut que les protocoles utilises dans des reseaux informatiques soient bien definis al’aide d’appels de commentaires (RFC) [8]. En fait, il y a suffisamment de jeu dans lesspecifications des protocoles dans les RFC qu’elles peuvent varier considerablement d’uneimplantation a une autre [2, 3, 4].
Ici, nous etudions le protocole TCP (Transmission Control Protocol), qui est actuellementle protocole le plus repandu dans Internet [1]. Le protocole TCP est fiable et son compor-tement est assez previsible : une poignee de main a trois, suivie d’un echange de donnees,puis d’une fermeture. Les ” indicateurs ” de l’en-tete du protocole TCP contiennent lescommandes qui sont utilisees au cours des trois etapes de la connexion. Nous avons pumodeliser une connexion TCP sous forme d’automate a etats finis (FSM) en definissant lesetats d’un FSM [17] de sorte qu’ils correspondent aux etapes d’une connexion et en utili-sant les indicateurs comme s’il s’agissait des evenements qui entraınent les transitions entreles differents etats.
Pour utiliser le modele strictement comme detecteur d’anomalies [10], on introduit un etatde defaillance pour indiquer l’occurrence d’un evenement interdit ou une tentative de tran-sition illegale. Lorsque les indicateurs d’une connexion TCP, tries par ordre chronologique,sont entres dans le FSM, ce dernier indique que la connexion est anormale si une defaillancese produit ou si la connexion n’est pas completee pour une raison ou une autre. L’etatdans lequel se trouvait la connexion et l’evenement qui a entraıne la defaillance peuventetre stockes pour donner une indication de la raison pour laquelle la defaillance s’est pro-duite. Le FSM TCP peut etre utilise pour deceler des problemes de gestion de reseau etdes evenements de securite du reseau. Il peut aussi etre utilise comme outil de recherchepermettant d’etudier le comportement du protocole TCP dans Internet.
Resultats principaux
Le trafic genere pendant une periode de 24 heures en aout 2000 a ete introduit dans le FSMTCP pour tester l’utilisation reelle de l’algorithme. Il a ete facile d’identifier deux tentativesde scannage de ports a grande echelle. On a egalement decouvert des tentatives de scannagelent en examinant la periodicite d’anomalies provenant de la meme adresse source. Gracea la methode de rapport du modele FSM, les reponses aux paquets de scannage sont bienevidentes. On a aussi identifie les effets secondaires des regles de filtrage.
Nos donnees permettaient de voir la retrodiffusion du scannage de ports et d’attaques en-traınant un refus de service dans d’autres reseaux, ainsi que des hotes qui ne repondaientpas. De, plus, il etait possible de voir les effets des delais dans le reseau, qui, parfois,causaient des perturbations. Certaines connexions ont ete abandonnees, ce qui permettaitde verifier les rapports d’utilisateurs d’Internet selon lesquels il arrive que des connexionsrestent figees dans un etat semi-ferme [26]. D’autres connexions qui ont semble etre aban-donnees etaient un effet secondaire d’un probleme possible de NAT : des adresses IP et/ou
DRDC Ottawa TM 2003-139 v

des ports etaient changes au cours d’une connexion. On a aussi observe d’autres cas demauvais fonctionnement d’une implantation TCP.
Importance des resultats et travail qui reste a faire
La representation FSM des connexions TCP permet d’identifier les acheminements de pa-quets dans un reseau qui ne sont pas conformes au comportement prevu du protocole. Lesresultats montrent que le concept est viable et il encourage l’examen de l’algorithme utilisestrictement comme logiciel de detection des intrusions (IDS).
Nous aimerions etendre le modele de facon a inclure la generation du trafic, c.-a-d. l’inclu-sion des anomalies dans les donnees sur le trafic genere. Le modele pourrait aussi servirde base a un algorithme de detection des anomalies statistiques fonde sur les principes deMarkov, ou la probabilite de la validite de chaque connexion est calculee. L’analyse del’evolution a plus long terme du protocole TCP est une autre application qui pourrait etreinteressante.
J. Treurniet and J. H. Lefebvre; 2003; A Finite State Machine Model of TCP Connections inthe Transport Layer; DRDC Ottawa TM 2003-139; R & D pour la defense Canada – Ottawa.
vi DRDC Ottawa TM 2003-139
Table of contents
Abstract . . . . . . . . . . . . . . . . . . . . . . . . . . . . . . . . . . . . . . . . . i
Resume . . . . . . . . . . . . . . . . . . . . . . . . . . . . . . . . . . . . . . . . . i
Executive summary . . . . . . . . . . . . . . . . . . . . . . . . . . . . . . . . . . . iii
Sommaire . . . . . . . . . . . . . . . . . . . . . . . . . . . . . . . . . . . . . . . . v
Table of contents . . . . . . . . . . . . . . . . . . . . . . . . . . . . . . . . . . . . vii
List of figures . . . . . . . . . . . . . . . . . . . . . . . . . . . . . . . . . . . . . . ix
List of tables . . . . . . . . . . . . . . . . . . . . . . . . . . . . . . . . . . . . . . . ix
1 Introduction . . . . . . . . . . . . . . . . . . . . . . . . . . . . . . . . . . . 1
2 Theory . . . . . . . . . . . . . . . . . . . . . . . . . . . . . . . . . . . . . 1
2.1 Transmission Control Protocol . . . . . . . . . . . . . . . . . . . . 2
2.2 TCP Finite State Machine Model . . . . . . . . . . . . . . . . . . . 3
2.3 Detection of Anomalies . . . . . . . . . . . . . . . . . . . . . . . . 6
3 Implementation of the Algorithm . . . . . . . . . . . . . . . . . . . . . . . 6
4 Results and Discussion . . . . . . . . . . . . . . . . . . . . . . . . . . . . . 8
4.1 Network Management . . . . . . . . . . . . . . . . . . . . . . . . . 8
4.1.1 Unresponsive and non-existant hosts . . . . . . . . . . . . . 8
4.1.2 Delays . . . . . . . . . . . . . . . . . . . . . . . . . . . . . 8
4.1.3 Abandoned connections . . . . . . . . . . . . . . . . . . . 11
4.1.4 Malfunctioning TCP . . . . . . . . . . . . . . . . . . . . . 11
4.1.5 Backscatter effects . . . . . . . . . . . . . . . . . . . . . . 12
4.2 Security . . . . . . . . . . . . . . . . . . . . . . . . . . . . . . . . 12
4.2.1 TCP connect and half-open scans . . . . . . . . . . . . . . 13
4.2.2 Stealth scans and inverse mapping . . . . . . . . . . . . . . 14
4.2.3 Aggregating scanning events . . . . . . . . . . . . . . . . . 14
DRDC Ottawa TM 2003-139 vii
4.2.4 Role of the Firewall . . . . . . . . . . . . . . . . . . . . . . 15
4.2.5 Other threats . . . . . . . . . . . . . . . . . . . . . . . . . 16
4.3 Research . . . . . . . . . . . . . . . . . . . . . . . . . . . . . . . . 16
4.4 False Positives . . . . . . . . . . . . . . . . . . . . . . . . . . . . . 17
5 Conclusions and Future Work . . . . . . . . . . . . . . . . . . . . . . . . . 18
References . . . . . . . . . . . . . . . . . . . . . . . . . . . . . . . . . . . . . . . . 19
viii DRDC Ottawa TM 2003-139
List of figures
1 Diagram of a “textbook” TCP connection. . . . . . . . . . . . . . . . . . . . 2
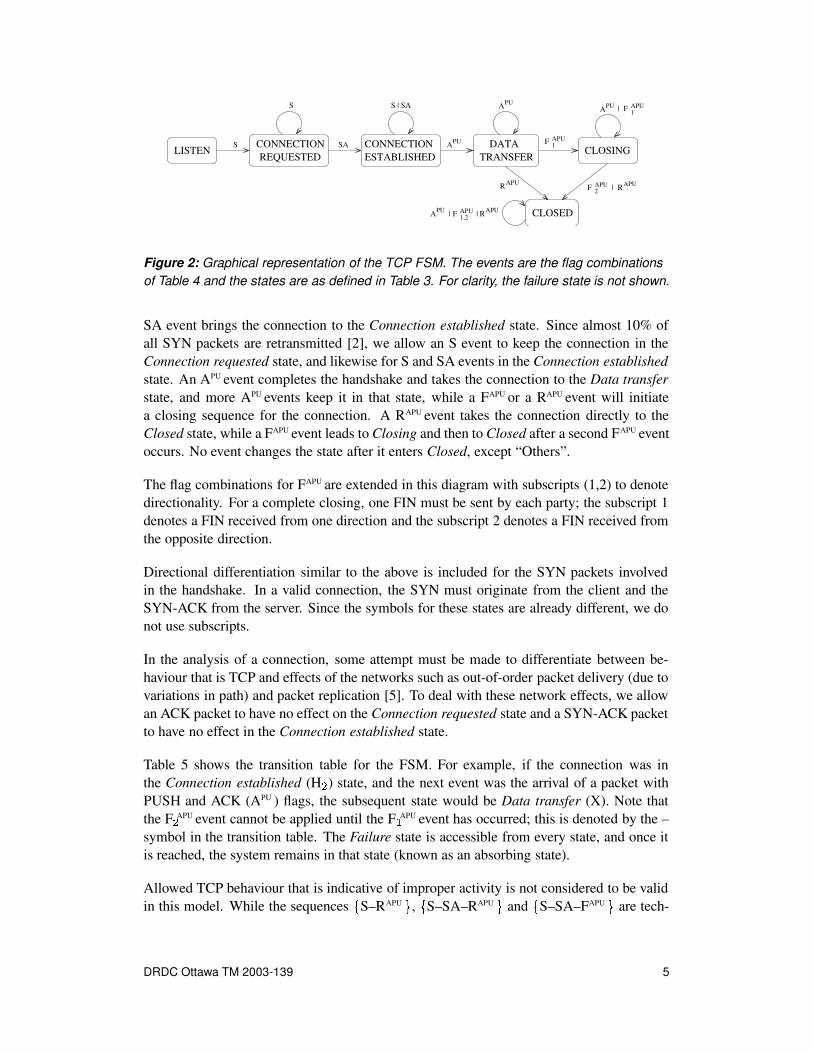
2 Graphical representation of the TCP FSM. The events are the flagcombinations of Table 4 and the states are as defined in Table 3. For clarity,the failure state is not shown. . . . . . . . . . . . . . . . . . . . . . . . . . . 5
3 Graphical representation of the program output in Table 13. . . . . . . . . . 15
List of tables
1 The TCP flag bits and their meanings. . . . . . . . . . . . . . . . . . . . . . 2
2 Timeouts used to define the end of a connection. . . . . . . . . . . . . . . . 3
3 The states of the TCP FSM. . . . . . . . . . . . . . . . . . . . . . . . . . . 4
4 The TCP flag combinations used to define events in the FSM. . . . . . . . . 4
5 The transition table for the TCP FSM. The states are as defined in Table 3and the flag combinations are as defined in Table 4. . . . . . . . . . . . . . 6
6 The packets sent by the QueSO tool and the anomaly types that will detecteach. . . . . . . . . . . . . . . . . . . . . . . . . . . . . . . . . . . . . . . 7
7 Examples of the anomalies that could be associated with each failure type. . 9
8 The anomalies found in the August 21, 2000 data for 24 hours starting atmidnight. Columns 4 and 5 show the data with the obvious large-scale SYNand bad flag scans removed. . . . . . . . . . . . . . . . . . . . . . . . . . . 10
9 A trace showing delayed handshake responses in a connection, which doesnot affect the progression of the connection. . . . . . . . . . . . . . . . . . . 10
10 A trace showing a detrimental effect of network delays. . . . . . . . . . . . 11
11 A trace showing a sudden change in one of the ports and one of the IPs in aconnection. This trace resulted in an L
�APU anomaly and a
C � � timeout anomaly. . . . . . . . . . . . . . . . . . . . . . . . . . . . . . 11
12 A trace showing an example detected as anomaly type H � � FAPU . . . . . . . 12
13 Partial output of mine.m for a slow SYN scan. Anomaly type 2 is H � �timeout. See text for bin set (time between anomalies). . . . . . . . . . . . . 15
DRDC Ottawa TM 2003-139 ix

14 The tcpdump output of the traffic data comprising the slow SYN scan(sanitized). The time between successive anomalies generates the bin valuesin Table 13. . . . . . . . . . . . . . . . . . . . . . . . . . . . . . . . . . . 16
x DRDC Ottawa TM 2003-139

1 Introduction
The Transmission Control Protocol (TCP), which is the dominant protocol in use on theInternet today [1], contains a wide variety of inconsistencies in its implementation [2, 3, 4].Research and analysis of Internet traffic has been performed in an attempt to understandwhat is really happening on the Internet [3, 5, 6, 7], as opposed to what is expected to occurbased on the TCP Request For Comments (RFC) specifications [8].
Since its inception, the Internet has become widely available and we have become depen-dent on computers and networks. Network scans are often the first steps in an attack, thedetection of which is easy to achieve if they are temporally fast, but more challenging ifthey are temporally slow. Work is underway to detect these scans by detecting anomalouspackets and using clustering techniques to correlate the events [9], but traditional anomalydetection methods are known to suffer from a high degree of false positives.
“Strict anomaly detection” defines a set of permitted events and detects activity which rep-resents exceptions to those events [10]. This idea is also discussed as “protocol anomalydetection” [11, 12]. In intrusion detection systems, protocol anomaly detection has beenimplemented at the application layer (see e.g. [13, 14, 15]). In the present work, strictanomaly detection is performed on TCP at the transport layer. We model a TCP connectionas a Finite State Machine by defining the set of states that are necessary to describe theprogression of a connection and the set of allowed events that bring on transitions betweenthese states. Disallowed events and transitions are reported as anomalous.
A snapshot of TCP connection anomalies can impart information important to networkmanagement, such as unresponsive hosts and behaviours that lead to resource consumption,and to network security, particularly in the area of intrusion detection for scanning activity.Researchers interested in the behaviour of TCP on the Internet (e.g. [16]) can see howoften and in what sense the Internet experiences anomalies in TCP implementations. Thoseinvolved in TCP traffic simulation/generation may wish to include traffic with these typesof anomalies if the desired result is to reflect the actual use of the TCP protocol. The appealof the model is in its simplicity and its utility in a wide range of applications.
2 Theory
The exchange of TCP packets between two hosts on the same ports forms the basis of aTCP connection. Since the exchange of packets follows a pattern defined by a finite set ofrules, it is described well by a Finite State Machine (FSM) model [17].
This section explains the relevant details of the TCP protocol, and describes how we repre-sent a TCP connection as an FSM, using the TCP flags as the attribute of packets that bringabout transitions from one state to the next.
DRDC Ottawa TM 2003-139 1
2.1 Transmission Control Protocol
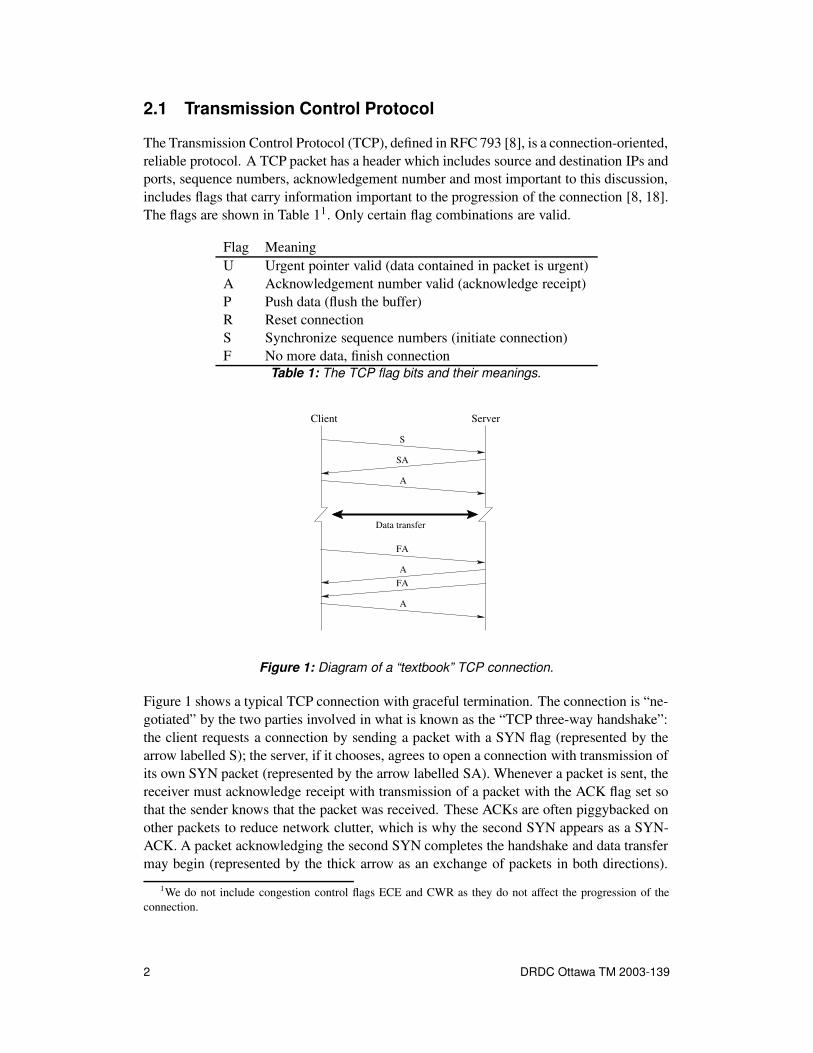
The Transmission Control Protocol (TCP), defined in RFC 793 [8], is a connection-oriented,reliable protocol. A TCP packet has a header which includes source and destination IPs andports, sequence numbers, acknowledgement number and most important to this discussion,includes flags that carry information important to the progression of the connection [8, 18].The flags are shown in Table 11. Only certain flag combinations are valid.
Flag MeaningU Urgent pointer valid (data contained in packet is urgent)A Acknowledgement number valid (acknowledge receipt)P Push data (flush the buffer)R Reset connectionS Synchronize sequence numbers (initiate connection)F No more data, finish connection
Table 1: The TCP flag bits and their meanings.
Client Server
S
SA
A
Data transfer
FA
AFA
A
Figure 1: Diagram of a “textbook” TCP connection.
Figure 1 shows a typical TCP connection with graceful termination. The connection is “ne-gotiated” by the two parties involved in what is known as the “TCP three-way handshake”:the client requests a connection by sending a packet with a SYN flag (represented by thearrow labelled S); the server, if it chooses, agrees to open a connection with transmission ofits own SYN packet (represented by the arrow labelled SA). Whenever a packet is sent, thereceiver must acknowledge receipt with transmission of a packet with the ACK flag set sothat the sender knows that the packet was received. These ACKs are often piggybacked onother packets to reduce network clutter, which is why the second SYN appears as a SYN-ACK. A packet acknowledging the second SYN completes the handshake and data transfermay begin (represented by the thick arrow as an exchange of packets in both directions).
1We do not include congestion control flags ECE and CWR as they do not affect the progression of theconnection.
2 DRDC Ottawa TM 2003-139

On closing, either the client or the server may request that the connection be ended withtransmission of a FIN packet, and the other agrees to close the connection with transmis-sion of its own FIN packet. In an ungraceful termination, the connection is “torn down” bytransmission of a reset (R) from either the client or the server.
In practice, stages of a connection are only allowed to exist for a set amount of time, to freeup resources that aren’t being used. Table 2 shows the timeouts for a connection chosenfor this model [18]. Most Berkeley-derived systems set a time limit of 75 seconds on theestablishment of a new connection. The keepalive timer is a feature available in manyTCP implementations. It is the amount of time that passes before a TCP will send a probeto an inactive connection, and is given in [18] as 2 hours. Many Berkeley-derived TCPimplementations prevent an infinite wait for the arrival of the second FIN in a gracefultermination by using a timeout of 10 minutes and 75 seconds. TIME WAIT is definedas twice the maximum amount of time a packet may exist in the network before beingdiscarded. This value, the only timeout defined as part of the protocol, is given in [8] as 4minutes, but may be as low as 1 minute depending on the TCP implementation [18].
Timeout TimeEstablishment 75 secondsKeepalive 2 hoursWaiting for second FIN 10 minutes 75 secondsTIME WAIT 4 minutes
Table 2: Timeouts used to define the end of a connection.
2.2 TCP Finite State Machine Model
In simple terms, an FSM progresses a system through a sequence of states via transitionsfrom one state to the next. Transitions occur in response to events [17]. The traditional statetransition diagram for TCP is a graphical representation of two separate but related finitestate machines, one for the client and one for the server. We have simplified the traditionalTCP state transition diagram to remove the differentiation of client and server.
The overall state of the connection is what is considered in this model. We define sevenstates for this model. The Listen state is the imaginary starting point for all connections. Toestablish the connection, the connection must complete the handshake by passing throughtwo states, Connection requested and Connection established, at which point the connec-tion may enter the Data transfer state. If the connection is terminated gracefully, it mustnegotiate the closing and pass through the two states Closing and Closed. If it is terminatedabruptly, it may skip Closing and proceed directly to Closed. We introduce one furtherstate, Failure, to represent that the connection has strayed from the protocol specificationby attempting to access a state out of order or by introducing an illegal event. The statesused in the TCP FSM model are summarised in Table 3.
A TCP connection progresses from state to state based on the information contained in theheaders of the packets exchanged. An event in this FSM of a TCP connection is interpreted
DRDC Ottawa TM 2003-139 3

State Symbol DescriptionListen L All connections must start in a Listen state.Connection requested H � When the first SYN is sent, the connection is
in the Connection requested state (Handshake,stage 1).
Connection established H � When the SYN is acknowledged, the connec-tion enters the Connection established state(Handshake, stage 2).
Data Transfer X When the handshake is complete and until theclosing begins, the connection is in a Datatransfer state.
Closing C � If the connection is terminated gracefully, theClosing state is entered when one side has senta FIN packet.
Closed C � If the connection is terminated via a RSTpacket or the second FIN packet, the connec-tion enters the Closed state and stays there.
Failure � If an event or transition that is not allowed oc-curs, the connection enters the Failure stateand stays there.
Table 3: The states of the TCP FSM.
as the combination of TCP flags in an arriving packet. We group the flags into categories asshown in Table 4 such that the flag combinations in a group cause the same state transition.We introduce the event label “Others” to handle the potential presence of bad flag combi-nations, e.g. the SF combination requests both to begin and end a connection. Such packetsare either “crafted” or appear as a result of corruption of the packet.
Event label Flag set Event descriptionS � S � Request to open connection.SA � SA � Agree to open connection.APU � A, PA, AU, PAU � Acknowledgement of receipt.FAPU � F, FA, FP, FU, FPA, Request to close connection.
FPU, FAU, FPAU �RAPU � R, RA, RP, RU, RPA, Tear down connection.
RPU, RAU, RPAU �Others The set of all remaining Bad flags.
flag combinationsTable 4: The TCP flag combinations used to define events in the FSM.
Graphically, the progression of a connection exhibiting normal, expected behaviour as itis commonly seen on the Internet is represented in Figure 2. All connections begin in theListen state. With an S event, the connection enters the Connection requested state, and an
4 DRDC Ottawa TM 2003-139
LISTENDATA
TRANSFERCLOSING
CLOSED
APUAPU
RAPURAPU
APU RAPU
APU
F APU1,2
S
|
||
CONNECTIONESTABLISHED
CONNECTIONREQUESTED
SA
S |
F APU2
F APU1
F APU1
S | SA
Figure 2: Graphical representation of the TCP FSM. The events are the flag combinationsof Table 4 and the states are as defined in Table 3. For clarity, the failure state is not shown.
SA event brings the connection to the Connection established state. Since almost 10% ofall SYN packets are retransmitted [2], we allow an S event to keep the connection in theConnection requested state, and likewise for S and SA events in the Connection establishedstate. An APU event completes the handshake and takes the connection to the Data transferstate, and more APU events keep it in that state, while a FAPU or a RAPU event will initiatea closing sequence for the connection. A RAPU event takes the connection directly to theClosed state, while a FAPU event leads to Closing and then to Closed after a second FAPU eventoccurs. No event changes the state after it enters Closed, except “Others”.
The flag combinations for FAPU are extended in this diagram with subscripts (1,2) to denotedirectionality. For a complete closing, one FIN must be sent by each party; the subscript 1denotes a FIN received from one direction and the subscript 2 denotes a FIN received fromthe opposite direction.
Directional differentiation similar to the above is included for the SYN packets involvedin the handshake. In a valid connection, the SYN must originate from the client and theSYN-ACK from the server. Since the symbols for these states are already different, we donot use subscripts.
In the analysis of a connection, some attempt must be made to differentiate between be-haviour that is TCP and effects of the networks such as out-of-order packet delivery (due tovariations in path) and packet replication [5]. To deal with these network effects, we allowan ACK packet to have no effect on the Connection requested state and a SYN-ACK packetto have no effect in the Connection established state.
Table 5 shows the transition table for the FSM. For example, if the connection was inthe Connection established (H � ) state, and the next event was the arrival of a packet withPUSH and ACK (APU ) flags, the subsequent state would be Data transfer (X). Note thatthe F � APU event cannot be applied until the F � APU event has occurred; this is denoted by the –symbol in the transition table. The Failure state is accessible from every state, and once itis reached, the system remains in that state (known as an absorbing state).
Allowed TCP behaviour that is indicative of improper activity is not considered to be validin this model. While the sequences � S–RAPU � , � S–SA–RAPU � and � S–SA–FAPU � are tech-
DRDC Ottawa TM 2003-139 5
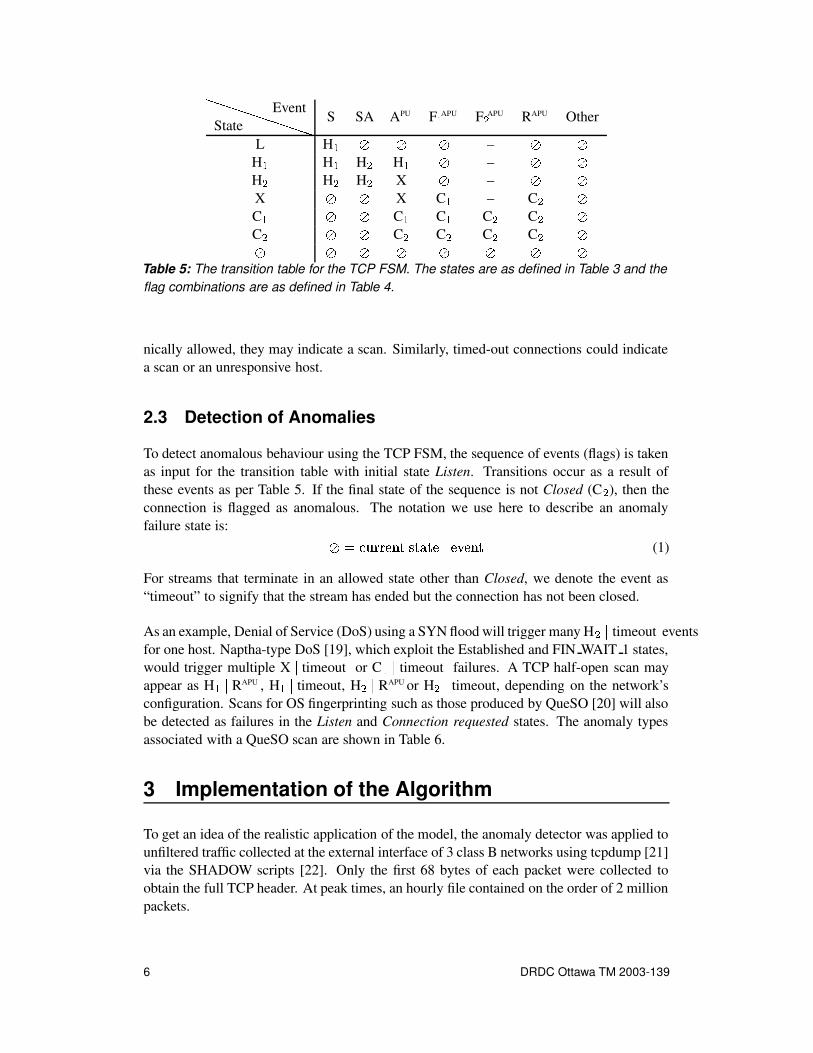
� � � � � � � � �StateEvent
S SA APU F � APU F � APU RAPU Other
L H � � � � – � �H � H � H � H � � – � �H � H � H � X � – � �X � � X C � – C � �C � � � C � C � C � C � �C � � � C � C � C � C � �� � � � � � � �
Table 5: The transition table for the TCP FSM. The states are as defined in Table 3 and theflag combinations are as defined in Table 4.
nically allowed, they may indicate a scan. Similarly, timed-out connections could indicatea scan or an unresponsive host.
2.3 Detection of Anomalies
To detect anomalous behaviour using the TCP FSM, the sequence of events (flags) is takenas input for the transition table with initial state Listen. Transitions occur as a result ofthese events as per Table 5. If the final state of the sequence is not Closed (C � ), then theconnection is flagged as anomalous. The notation we use here to describe an anomalyfailure state is:
������ � ���������������� � ��������� (1)
For streams that terminate in an allowed state other than Closed, we denote the event as“timeout” to signify that the stream has ended but the connection has not been closed.
As an example, Denial of Service (DoS) using a SYN flood will trigger many H � � timeout eventsfor one host. Naptha-type DoS [19], which exploit the Established and FIN WAIT 1 states,would trigger multiple X
�timeout or C � � timeout failures. A TCP half-open scan may
appear as H � � RAPU , H � � timeout, H � � RAPU or H � � timeout, depending on the network’sconfiguration. Scans for OS fingerprinting such as those produced by QueSO [20] will alsobe detected as failures in the Listen and Connection requested states. The anomaly typesassociated with a QueSO scan are shown in Table 6.
3 Implementation of the Algorithm
To get an idea of the realistic application of the model, the anomaly detector was applied tounfiltered traffic collected at the external interface of 3 class B networks using tcpdump [21]via the SHADOW scripts [22]. Only the first 68 bytes of each packet were collected toobtain the full TCP header. At peak times, an hourly file contained on the order of 2 millionpackets.
6 DRDC Ottawa TM 2003-139

Packet flags Anomaly typeSYN H � � � RAPU , timeout �SYN+ACK L
�SA
FIN L�FAPU
FIN+ACK L�FAPU
SYN+FIN bad flagsPSH L
�APU
SYN+1+2 H � � � RAPU , timeout �Table 6: The packets sent by the QueSO tool and the anomaly types that will detect each.
The TCP FSM algorithm was written in MATLAB, using as libraries a suite of MATLABfunctions developed at DRDC Ottawa for the analysis of network traffic data [23]. In prac-tice, each packet was read sequentially from the raw traffic file. Each socket pair (port-IPpair) was assigned a stream holding the complete trace for that socket. When the connec-tion was deemed complete by timeout (as per Table 2), the stream was removed. If theconnection was not in the Closed state, it was output as an anomaly.
Since the timeout values in Table 2 are not always consistent for all TCP implementations,a new connection could begin before a old connection was removed. To account for thesepossibilities, if a SYN packet arrived after the handshake had been completed and it was areplayed packet, it was ignored. If it was not a replay, the current connection state was out-put, the stream was cleared and a new stream was started for the new connection. Thereforefailures associated with SYNs appearing in the Data transfer, Closing or Closed states donot appear in the results of the analysis.
Note that in the first two and last two hours of analysis there will be “false positives” in thesense that failures will occur due to the truncation of the traffic data, i.e. streams that startor end in the middle of a connection. Consequently, one must extend the time period underexamination by 2 hours at the beginning and at the end.
The SHADOW IDS runs a script to stop logging at the end of an hour, then runs a scriptto start a new log. This results in 2–3 seconds of dropped packets at the beginning ofeach hour. To account for the effect of the dropped packets at the beginning of each hour,anomalies were not reported under the following conditions:
� H � , H � , X, C ��� � timeout: If the last packet in the connection is within 75 seconds of thehour start.
L� � SA, A, F, R � : If the first packet in the connection is within 75 seconds of the hour start.
� H � , H ��� � � F, R � : If the first and last packets encompass the hour start within 5 minutes.
On average, this removed approximately 7% of the anomalies, mainly affecting the propor-tion of X
�timeout, L
�APU , and H � � FAPU . This may introduce some false negatives, but
the effect is expected to be negligible.
DRDC Ottawa TM 2003-139 7
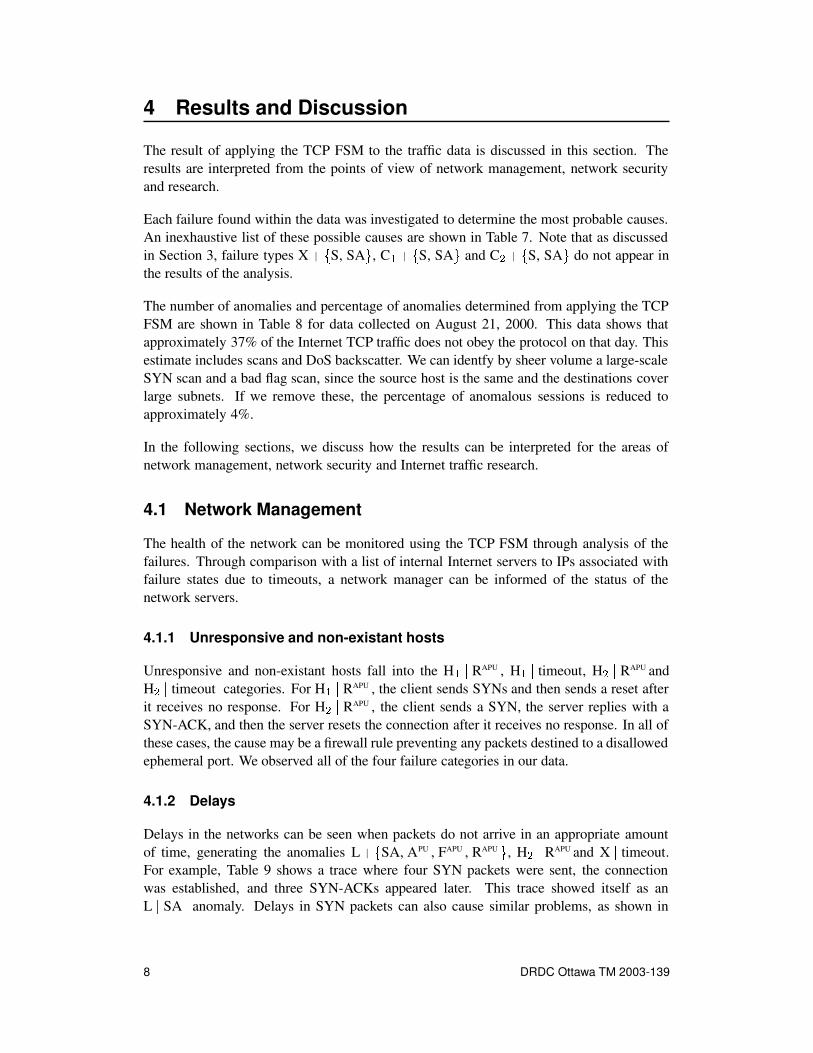
4 Results and Discussion
The result of applying the TCP FSM to the traffic data is discussed in this section. Theresults are interpreted from the points of view of network management, network securityand research.
Each failure found within the data was investigated to determine the most probable causes.An inexhaustive list of these possible causes are shown in Table 7. Note that as discussedin Section 3, failure types X | � S, SA � , C � | � S, SA � and C � | � S, SA � do not appear inthe results of the analysis.
The number of anomalies and percentage of anomalies determined from applying the TCPFSM are shown in Table 8 for data collected on August 21, 2000. This data shows thatapproximately 37% of the Internet TCP traffic does not obey the protocol on that day. Thisestimate includes scans and DoS backscatter. We can identfy by sheer volume a large-scaleSYN scan and a bad flag scan, since the source host is the same and the destinations coverlarge subnets. If we remove these, the percentage of anomalous sessions is reduced toapproximately 4%.
In the following sections, we discuss how the results can be interpreted for the areas ofnetwork management, network security and Internet traffic research.
4.1 Network Management
The health of the network can be monitored using the TCP FSM through analysis of thefailures. Through comparison with a list of internal Internet servers to IPs associated withfailure states due to timeouts, a network manager can be informed of the status of thenetwork servers.
4.1.1 Unresponsive and non-existant hosts
Unresponsive and non-existant hosts fall into the H � � RAPU , H � � timeout, H � � RAPU andH � � timeout categories. For H � � RAPU , the client sends SYNs and then sends a reset afterit receives no response. For H � � RAPU , the client sends a SYN, the server replies with aSYN-ACK, and then the server resets the connection after it receives no response. In all ofthese cases, the cause may be a firewall rule preventing any packets destined to a disallowedephemeral port. We observed all of the four failure categories in our data.
4.1.2 Delays
Delays in the networks can be seen when packets do not arrive in an appropriate amountof time, generating the anomalies L | � SA, APU , FAPU , RAPU � , H � � RAPU and X
�timeout.
For example, Table 9 shows a trace where four SYN packets were sent, the connectionwas established, and three SYN-ACKs appeared later. This trace showed itself as anL�SA anomaly. Delays in SYN packets can also cause similar problems, as shown in
8 DRDC Ottawa TM 2003-139

Failure Anomaly Description(s)L � SA SYN-ACK scan �
Backscatter from DoS or scan with spoofed source Delayed SASpurious change in IP and/or port
L � APU ACK scanSpurious changes in IP and/or portDelayed ACK (timeout)
L � FAPU FIN scan Delayed FINSpurious change in IP and/or port
L � RAPU RST scan Backscatter from DoS or scan with spoofed sourceDelayed RST Spurious change in IP and/or port
H !"� FAPU Malfunctioning TCP or applicationH !"� RAPU TCP connect or half-open scan, port closed
Benign attempted connection to closed portDoS #Client gives up on unresponsive or nonexistant host
H !"� timeout TCP connect or half-open scan with no responseDoS Unresponsive or nonexistant host
H $%� FAPU TCP connect scan, port openClosing piggybacked on handshake
H $%� RAPU TCP half-open scan, port openUnresponsive host - server sends R after timeoutDoS Firewall blocks ephemeral ports, SA never receivedDelayed SYN
H $ � timeout Unresponsive hostFirewall blocks ephemeral ports, SA never receivedDoS
X � timeout Abandoned connectionClient does not receive SA (delays, lost packets)
C ! � timeout Abandoned connectionBad Flags Scan
Redundant flags (FIN and RST)Packet corruption
Table 7: Examples of the anomalies that could be associated with each failure type.
# Not seen in real traffic data.&Possibly seen in real traffic data.
DRDC Ottawa TM 2003-139 9
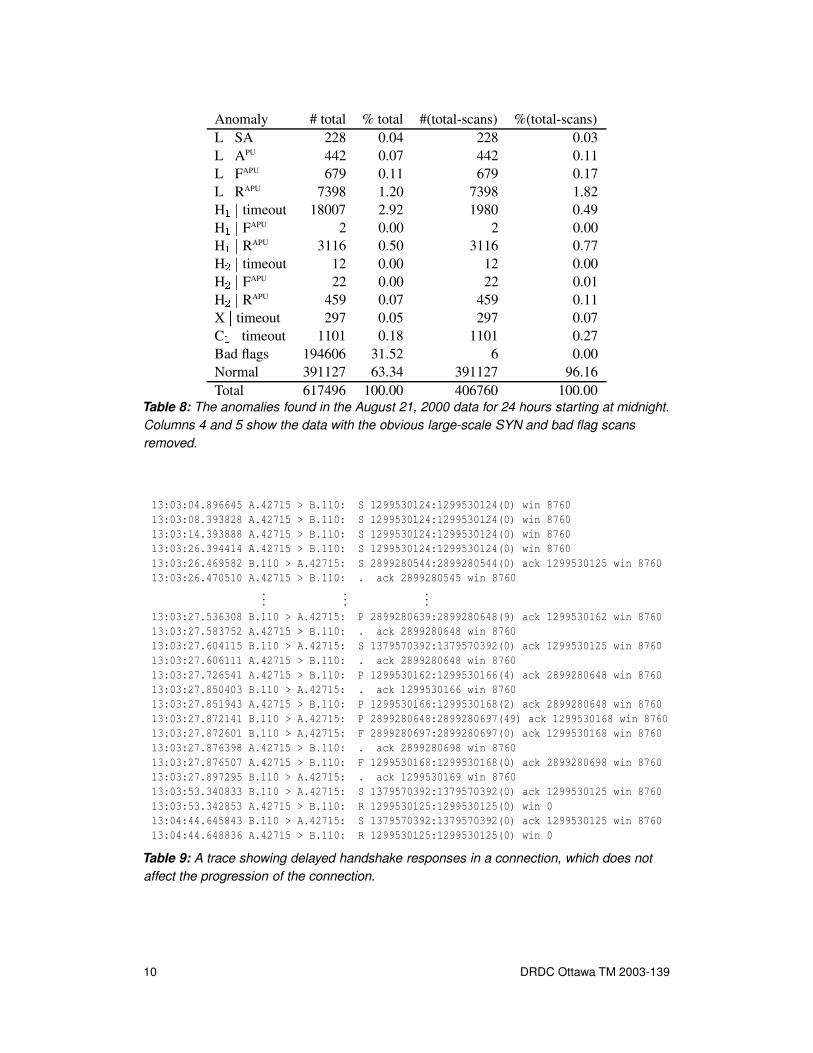
Anomaly # total % total #(total-scans) %(total-scans)L�SA 228 0.04 228 0.03
L�APU 442 0.07 442 0.11
L�FAPU 679 0.11 679 0.17
L�RAPU 7398 1.20 7398 1.82
H � � timeout 18007 2.92 1980 0.49H � � FAPU 2 0.00 2 0.00H � � RAPU 3116 0.50 3116 0.77H � � timeout 12 0.00 12 0.00H � � FAPU 22 0.00 22 0.01H � � RAPU 459 0.07 459 0.11X�timeout 297 0.05 297 0.07
C � � timeout 1101 0.18 1101 0.27Bad flags 194606 31.52 6 0.00Normal 391127 63.34 391127 96.16Total 617496 100.00 406760 100.00
Table 8: The anomalies found in the August 21, 2000 data for 24 hours starting at midnight.Columns 4 and 5 show the data with the obvious large-scale SYN and bad flag scansremoved.
13:03:04.896645 A.42715 > B.110: S 1299530124:1299530124(0) win 876013:03:08.393828 A.42715 > B.110: S 1299530124:1299530124(0) win 876013:03:14.393888 A.42715 > B.110: S 1299530124:1299530124(0) win 876013:03:26.394414 A.42715 > B.110: S 1299530124:1299530124(0) win 876013:03:26.469582 B.110 > A.42715: S 2899280544:2899280544(0) ack 1299530125 win 876013:03:26.470510 A.42715 > B.110: . ack 2899280545 win 8760
......
...13:03:27.536308 B.110 > A.42715: P 2899280639:2899280648(9) ack 1299530162 win 876013:03:27.583752 A.42715 > B.110: . ack 2899280648 win 876013:03:27.604115 B.110 > A.42715: S 1379570392:1379570392(0) ack 1299530125 win 876013:03:27.606111 A.42715 > B.110: . ack 2899280648 win 876013:03:27.726541 A.42715 > B.110: P 1299530162:1299530166(4) ack 2899280648 win 876013:03:27.850403 B.110 > A.42715: . ack 1299530166 win 876013:03:27.851943 A.42715 > B.110: P 1299530166:1299530168(2) ack 2899280648 win 876013:03:27.872141 B.110 > A.42715: P 2899280648:2899280697(49) ack 1299530168 win 876013:03:27.872601 B.110 > A.42715: F 2899280697:2899280697(0) ack 1299530168 win 876013:03:27.876398 A.42715 > B.110: . ack 2899280698 win 876013:03:27.876507 A.42715 > B.110: F 1299530168:1299530168(0) ack 2899280698 win 876013:03:27.897295 B.110 > A.42715: . ack 1299530169 win 876013:03:53.340833 B.110 > A.42715: S 1379570392:1379570392(0) ack 1299530125 win 876013:03:53.342853 A.42715 > B.110: R 1299530125:1299530125(0) win 013:04:44.645843 B.110 > A.42715: S 1379570392:1379570392(0) ack 1299530125 win 876013:04:44.648836 A.42715 > B.110: R 1299530125:1299530125(0) win 0
Table 9: A trace showing delayed handshake responses in a connection, which does notaffect the progression of the connection.
10 DRDC Ottawa TM 2003-139

Table 10. In this case, four identical SYN packets are sent, one is answered with a SYN-ACK to establish a connection, but another is answered with a reset. Since the sequencenumbers of the SYN packets were identical, the connection was torn down. This traceappeared as an H � � RAPU anomaly.
02:36:07.560182 A.1511 > B.25: S 416064000:416064000(0) win 3276802:36:11.434188 A.1511 > B.25: S 416064000:416064000(0) win 3276802:36:21.474896 A.1511 > B.25: S 416064000:416064000(0) win 3276802:36:45.576086 A.1511 > B.25: S 416064000:416064000(0) win 3276802:36:45.673741 B.25 > A.1511: S 3033524924:3033524924(0) ack 416064001 win 1752002:36:45.675492 B.25 > A.1511: R 3033524925:3033524925(0) ack 416064001 win 1752002:36:45.682636 A.1511 > B.25: . ack 3033524925 win 3276802:36:45.780013 B.25 > A.1511: R 3033524925:3033524925(0) win 0
Table 10: A trace showing a detrimental effect of network delays.
4.1.3 Abandoned connections
Abandoned connections fall into the X�timeout and C � � timeout categories. Some con-
nections are legitimately abandoned, however other connections that appear to have beenabandoned are a result of misbehaviours, which can be seen to be related to the otheranomalies. For example, the trace shown in Table 11 triggers both a C � � timeout and anL�APU failure. This trace was caused by a spurious change in the port and IP of a connec-
tion. The sequence numbers lead to the conclusion that this is in fact the same connection.A possible cause is a malfunctioning NAT device.
09:01:38.350627 A.38005 > x.y.z.23.80: S 2773978047:2773978047(0) win 876009:01:41.842543 A.38005 > x.y.z.23.80: S 2773978047:2773978047(0) win 876009:01:42.068782 x.y.z.23.80 > A.38005: S 675782083:675782083(0) ack 2773978048 win 876009:01:42.071801 A.38005 > x.y.z.23.80: . ack 675782084 win 876009:01:42.076422 A.38005 > x.y.z.23.80: P 2773978048:2773978303(255) ack 675782084 win 876009:01:42.077198 A.38005 > x.y.z.23.80: P 2773978303:2773978463(160) ack 675782084 win 876009:01:42.334801 x.y.z.23.80 > A.38005: . ack 2773978463 win 834509:01:44.722807 A.38005 > x.y.z.23.80: F 2773978463:2773978463(0) ack 675782084 win 876009:01:44.840595 x.y.z.23.80 > A.38005: . ack 2773978464 win 834509:01:47.346971 x.y.z.13.80 > A.4363: P 675782084:675782369(285) ack 2773978464 win 876009:01:47.347015 x.y.z.13.80 > A.4363: F 675782369:675782369(0) ack 2773978464 win 876009:01:47.348160 A.4363 > x.y.z.13.80: R 2773978464:2773978464(0) win 009:01:47.348227 A.4363 > x.y.z.13.80: R 2773978464:2773978464(0) win 0
Table 11: A trace showing a sudden change in one of the ports and one of the IPs in aconnection. This trace resulted in an L
�APU anomaly and a C � � timeout anomaly.
4.1.4 Malfunctioning TCP
An example of a malfunctioning TCP or application (anomaly H � � FAPU ) is shown in Ta-ble 12. Here, host A sends a connection request to host B, and host B acknowledges receipt
DRDC Ottawa TM 2003-139 11

of the packet but does not send its own SYN packet to complete the connection establish-ment. Host B then attempts to gracefully close a connection that has not been establishedwith the FIN-ACK packets. The cause of the behaviour is unclear.
12:31:20.965783 A.37569 > B.80: S 4117960417:4117960417(0) win 876012:31:24.513149 A.37569 > B.80: S 4117960417:4117960417(0) win 876012:31:24.807301 B.80 > A.37569: . ack 4117960418 win 1638412:31:30.513687 A.37569 > B.80: S 4117960417:4117960417(0) win 876012:31:30.878542 B.80 > A.37569: . ack 4117960418 win 1638412:31:42.613337 A.37569 > B.80: S 4117960417:4117960417(0) win 876012:31:43.008129 B.80 > A.37569: . ack 4117960418 win 1638412:31:51.290266 B.80 > A.37569: F 3854453158:3854453158(0) ack 4117960418 win 1638412:31:51.290268 B.80 > A.37569: F 3854453158:3854453158(0) ack 4117960418 win 1638412:31:52.417395 B.80 > A.37569: F 3854453158:3854453158(0) ack 4117960418 win 1638412:31:53.983493 B.80 > A.37569: F 3854453158:3854453158(0) ack 4117960418 win 1638412:31:57.045194 B.80 > A.37569: F 3854453158:3854453158(0) ack 4117960418 win 1638412:32:03.033479 B.80 > A.37569: F 3854453158:3854453158(0) ack 4117960418 win 1638412:32:06.628788 A.37569 > B.80: S 4117960417:4117960417(0) win 876012:32:06.907044 B.80 > A.37569: F 3854453158:3854453158(0) ack 4117960418 win 1638412:32:18.585312 B.80 > A.37569: F 3854453158:3854453158(0) ack 4117960418 win 16384
Table 12: A trace showing an example detected as anomaly type H � � FAPU .
4.1.5 Backscatter effects
When performing a DoS, the attacker will always spoof the source IP of the packets sent toaddresses other than his own to redirect the responses. When performing a network scan,an attacker may attempt to hide his identity among a large number of other addresses byrepeating the scan with spoofed source addresses.
Such methods will appear as anomalies L�SA or L
�RAPU [24], and have no effect other
than bandwidth consumption. Our results show a relatively high number of anomalies ofthis type, implying that the target IP range is often used as a spoofed source in DoS or scans.Backscatter was seen in the data as L
�RAPU but not as L
�SA.
4.2 Security
Anomalies in TCP flag sequences can be indicators of malicious activity. In our data set,scans were the only threats identified by the FSM that targeted the experimental network.The types of scans identifed with the FSM were TCP connect scans, half-open scans, andstealth scans.
Scanning techniques are used in the reconnaissance stage of a network attack to gather in-formation about the network and eventually exploit vulnerable systems. In particular, theattacker is looking for opened ports and wants to identify operating systems and applica-tions. The most popular scanning techniques involve active probing, whereby an attackersends a crafted packet and depending on the response, obtains a better understanding of the
12 DRDC Ottawa TM 2003-139
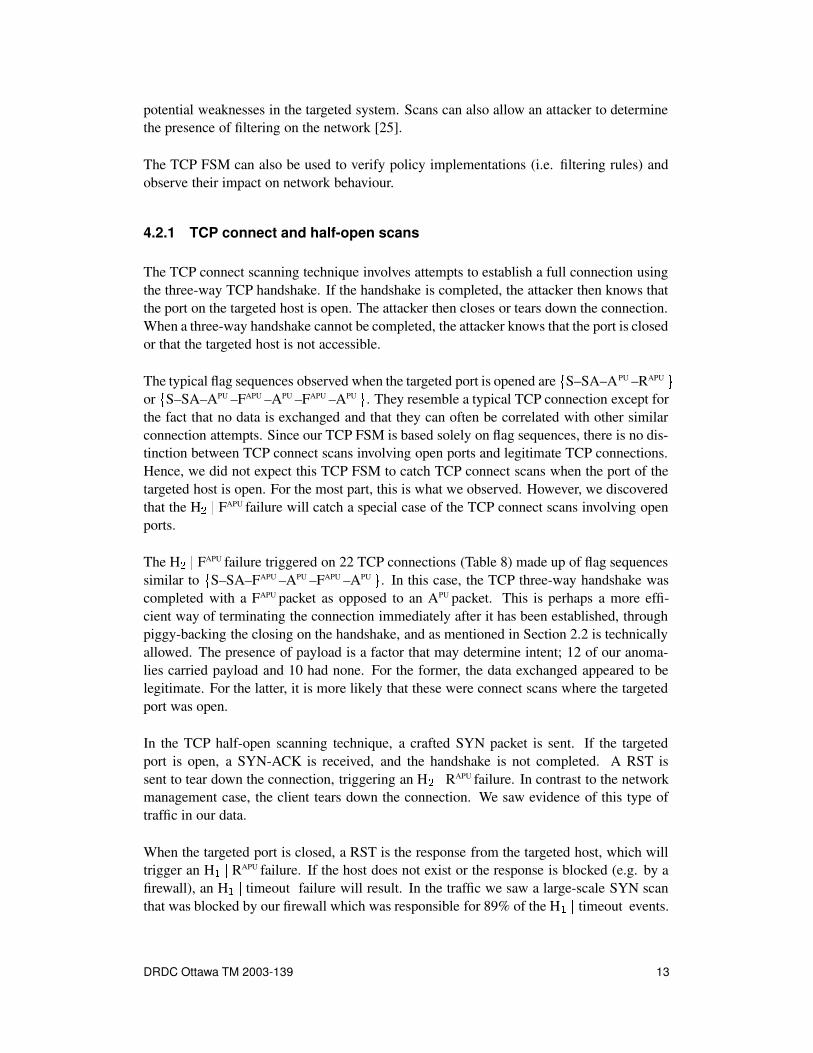
potential weaknesses in the targeted system. Scans can also allow an attacker to determinethe presence of filtering on the network [25].
The TCP FSM can also be used to verify policy implementations (i.e. filtering rules) andobserve their impact on network behaviour.
4.2.1 TCP connect and half-open scans
The TCP connect scanning technique involves attempts to establish a full connection usingthe three-way TCP handshake. If the handshake is completed, the attacker then knows thatthe port on the targeted host is open. The attacker then closes or tears down the connection.When a three-way handshake cannot be completed, the attacker knows that the port is closedor that the targeted host is not accessible.
The typical flag sequences observed when the targeted port is opened are � S–SA–APU –RAPU �or � S–SA–APU –FAPU –APU –FAPU –APU � . They resemble a typical TCP connection except forthe fact that no data is exchanged and that they can often be correlated with other similarconnection attempts. Since our TCP FSM is based solely on flag sequences, there is no dis-tinction between TCP connect scans involving open ports and legitimate TCP connections.Hence, we did not expect this TCP FSM to catch TCP connect scans when the port of thetargeted host is open. For the most part, this is what we observed. However, we discoveredthat the H � � FAPU failure will catch a special case of the TCP connect scans involving openports.
The H � � FAPU failure triggered on 22 TCP connections (Table 8) made up of flag sequencessimilar to � S–SA–FAPU –APU –FAPU –APU � . In this case, the TCP three-way handshake wascompleted with a FAPU packet as opposed to an APU packet. This is perhaps a more effi-cient way of terminating the connection immediately after it has been established, throughpiggy-backing the closing on the handshake, and as mentioned in Section 2.2 is technicallyallowed. The presence of payload is a factor that may determine intent; 12 of our anoma-lies carried payload and 10 had none. For the former, the data exchanged appeared to belegitimate. For the latter, it is more likely that these were connect scans where the targetedport was open.
In the TCP half-open scanning technique, a crafted SYN packet is sent. If the targetedport is open, a SYN-ACK is received, and the handshake is not completed. A RST issent to tear down the connection, triggering an H � � RAPU failure. In contrast to the networkmanagement case, the client tears down the connection. We saw evidence of this type oftraffic in our data.
When the targeted port is closed, a RST is the response from the targeted host, which willtrigger an H � � RAPU failure. If the host does not exist or the response is blocked (e.g. by afirewall), an H � � timeout failure will result. In the traffic we saw a large-scale SYN scanthat was blocked by our firewall which was responsible for 89% of the H � � timeout events.
DRDC Ottawa TM 2003-139 13

4.2.2 Stealth scans and inverse mapping
Stealth scans are scans that gather information about targeted sites while attempting toevade detection by firewalls and IDS. For example, some firewalls will be configured toblock incoming packets with only the SYN flag set, hence a SYN-FIN packet will passthrough undetected. In the TCP FSM, a SYN-FIN packet will trigger a bad flag failure. Infact, a large-scale SYN-FIN scan was detected in our traffic data and was responsible for194600 bad flag failures.
We also detected a slow ACK scan, which is usually used to map out firewall rules. Inparticular, it can help determine whether a firewall is stateful or just a simple packet filterthat blocks incoming SYN packets. In this scan, an ACK packet is sent (triggering anL�APU failure). If a RST comes back, the port is classified as “unfiltered”. If nothing
comes back (or if an ICMP destination unreachable is returned), the port is classified as“filtered”.
Inverse mapping is a stealth scanning technique that makes use of crafted packets, includingSYN-ACK, FIN, XMAS (FIN, PUSH and URG flags) and NULL (no flags set) flag com-binations. RFC 793 [8] defines the required behaviour of TCP in response to these types ofpackets: if the targeted port is closed, any of the above packets will produce a RST; if thetargeted port is open, there will be no response by the targeted host. If the targeted host doesnot exist or is unreachable, there will also be no TCP response. The above scans will triggerL�SA, L
�FAPU and bad flag failures. RST scans are other inverse mapping techniques. The
RST scan sends RST packets to a broad range of IPs, triggering L�RAPU failures. Routers
will report any non-existant IPs through ICMP messages and there will be no response fromexisting hosts. We did not detect this type of activity in our traffic data.
4.2.3 Aggregating scanning events
Table 8 shows large-scale SYN and bad flag scans as H � � timeout and bad flag failures.These scans were performed very quickly and were readily identifiable, however scanningcan be done more subtly by extending them over a longer period of time. Many IDS rely onthe frequency of packet arrival to determine the presence of a scan (e.g. Snort [13] detects ascan if ' packets arrive in ( seconds), which overlooks slow (quiet) scans. Some automatedscanning tools allow the user to specify how fast or slow the scan should occur, and sendpackets at periodic intervals [25]. It is also easy to write a simple scanner that randomizestime intervals between probes.
To mine the data for either fast or slow scans, one week of traffic data was analysed. Wefocussed on the anomaly types that may indicate scanning activity: L
� � SA, APU , FAPU ,RAPU � , H � � � RAPU , timeout � , H � | � FAPU , RAPU � or bad flags. To find slow scans, theelapsed time between successive anomalies for each source IP in the anomaly set was cal-culated, and a histogram of the time differences was created to identify periodicity in thescanning attempts. The bin sizes were chosen to catch both short- and longer-term scans,with intervals defined by the set � 0, 1 min, 10 min, 1 hr, 5 hr, 12 hr, 1 day, 2 days, 5days � . For example, Table 13 shows the partial output of a program written to mine for
14 DRDC Ottawa TM 2003-139
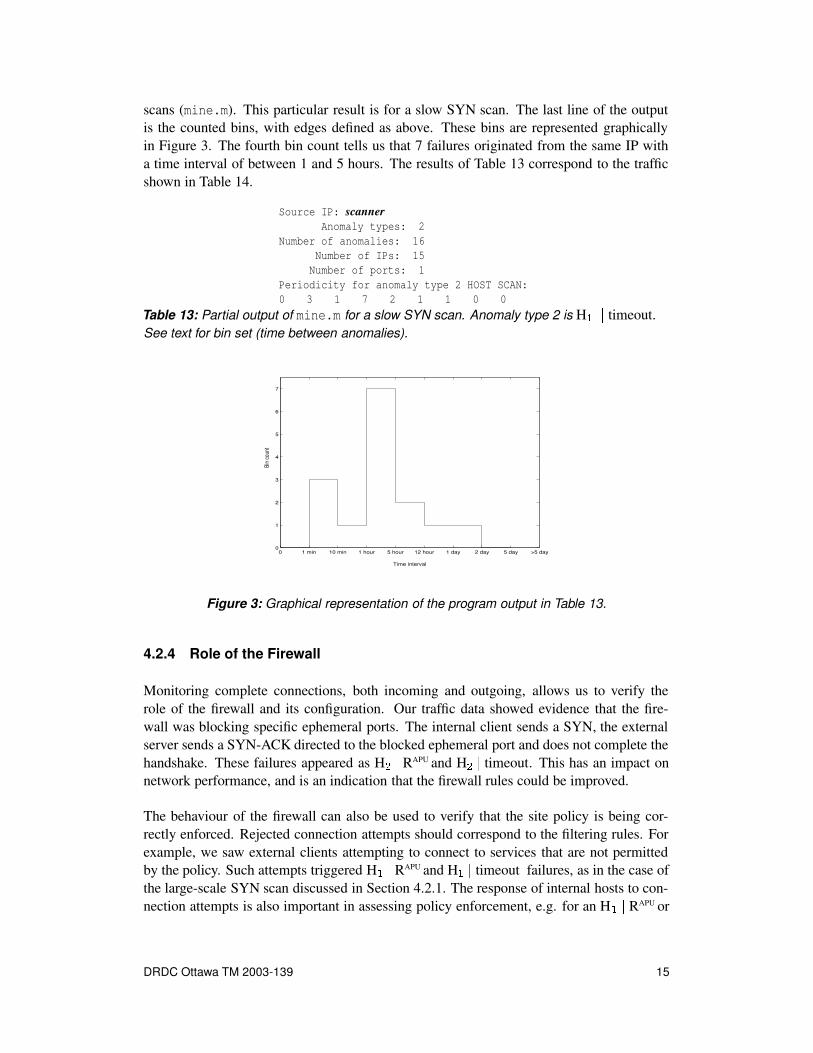
scans (mine.m). This particular result is for a slow SYN scan. The last line of the outputis the counted bins, with edges defined as above. These bins are represented graphicallyin Figure 3. The fourth bin count tells us that 7 failures originated from the same IP witha time interval of between 1 and 5 hours. The results of Table 13 correspond to the trafficshown in Table 14.
Source IP: scannerAnomaly types: 2
Number of anomalies: 16Number of IPs: 15Number of ports: 1
Periodicity for anomaly type 2 HOST SCAN:0 3 1 7 2 1 1 0 0
Table 13: Partial output of mine.m for a slow SYN scan. Anomaly type 2 is H � �timeout.
See text for bin set (time between anomalies).
0 1 min 10 min 1 hour 5 hour 12 hour 1 day 2 day 5 day >5 day0
1
2
3
4
5
6
7
Time interval
Bin
coun
t
Figure 3: Graphical representation of the program output in Table 13.
4.2.4 Role of the Firewall
Monitoring complete connections, both incoming and outgoing, allows us to verify therole of the firewall and its configuration. Our traffic data showed evidence that the fire-wall was blocking specific ephemeral ports. The internal client sends a SYN, the externalserver sends a SYN-ACK directed to the blocked ephemeral port and does not complete thehandshake. These failures appeared as H � � RAPU and H � � timeout. This has an impact onnetwork performance, and is an indication that the firewall rules could be improved.
The behaviour of the firewall can also be used to verify that the site policy is being cor-rectly enforced. Rejected connection attempts should correspond to the filtering rules. Forexample, we saw external clients attempting to connect to services that are not permittedby the policy. Such attempts triggered H � � RAPU and H � � timeout failures, as in the case ofthe large-scale SYN scan discussed in Section 4.2.1. The response of internal hosts to con-nection attempts is also important in assessing policy enforcement, e.g. for an H � � RAPU or
DRDC Ottawa TM 2003-139 15

08/18/2000 10:30:00.729317 scanner.4907 > my.net.78.26.8008/18/2000 13:16:38.240864 scanner.3238 > my.net.98.56.8008/20/2000 08:24:52.872996 scanner.3307 > my.net.22.186.8008/20/2000 08:30:42.234438 scanner.3766 > my.net.15.112.8008/20/2000 09:45:44.229834 scanner.2047 > my.net.7.188.8008/20/2000 09:48:14.606899 scanner.2265 > my.net.130.171.8008/20/2000 12:48:43.979432 scanner.1232 > my.net.216.199.8008/21/2000 09:02:34.802720 scanner.2356 > my.net.23.92.8008/21/2000 15:02:37.838110 scanner.4264 > my.net.9.59.8008/21/2000 22:00:21.167523 scanner.2860 > my.net.22.194.8008/21/2000 22:01:44.118879 scanner.2970 > my.net.113.177.8008/22/2000 01:44:50.597606 scanner.1600 > my.net.113.177.8008/22/2000 06:01:03.933332 scanner.2974 > my.net.244.159.8008/22/2000 07:19:32.872888 scanner.1444 > my.net.233.237.8008/22/2000 07:51:12.299813 scanner.4062 > my.net.227.250.8008/22/2000 12:07:32.988795 scanner.1318 > my.net.214.68.80
Table 14: The tcpdump output of the traffic data comprising the slow SYN scan (sanitized).The time between successive anomalies generates the bin values in Table 13.
H � � timeout shows that a response was made whereas H � � timeout shows that no responsewas made.
4.2.5 Other threats
While the only detected threats directed towards our network were scans, we anticipate thatother threats will be triggered by the TCP FSM model. For example, in a SYN-flood DoSattack, a client floods the targeted host with SYN packets on an open port at a rate whichquickly consumes all of the victim’s resources. The victim responds with SYN-ACK andwaits for the ACK to complete the three-way TCP handshake. At some point, there are toomany connections waiting to be established and the victim can no longer accept connectionattempts, and if possible, simply send RSTs. Intuitively, this type of traffic should triggerH � � RAPU , H � � timeout, H � � RAPU and H � � timeout failures. While it was not our objectiveto see how well this FSM would work as an anomaly-based IDS, it would be interesting todo a complete test with a labelled dataset of exploits.
4.3 Research
The evolution of Internet use is an interesting trend to capture. Were we to repeat ourcalculations for current Internet usage, we could compare characteristics such as the numberof connections that time out in the FIN WAIT 2 (C � ) state (C � � timeout). These anomaliesmay occur as a result of poorly implemented TCP or in web client applications [26], or theymay be caused by a sudden change in port or IP, as discussed in Section 4.1.3. Our resultsfrom August 21, 2000 show that although the majority of these anomalies occur on HTTPports, ftp, pop and imap, among others, are also present. Further investigation may tellus whether the problem lies with the OS implementation of TCP, or with the applicationsusing it.
16 DRDC Ottawa TM 2003-139
4.4 False Positives
By definition, all anomalies found using strict anomaly detection are anomalous and there-fore there is no false positive rate to consider [10]. However, if we interpret false positivesas more of a level of interest, we can discuss how, depending on the point of view of theuser, the failure events of interest differ. For example, an H � � timeout anomaly that is partof a scan is of great concern to one involved in network security, but is of less importanceto a network manager. If the anomaly stemmed from a link outage, it becomes of greaterconcern to the network manager. For researchers interested in determining whether theTCP protocol is strictly being followed, all events are of interest. Minor modifications tothe model can yield different results; for example the frequency of reset terminated connec-tions is important to some [27, 28], and could be obtained by interpreting a reset packet asa failure and counting the failures of that type.
It is difficult to determine the intent of the user who sends a SYN and receives a RST inresponse (failure H � � RAPU ). An attacker would use this information with the intent offinding and exploiting a vulnerable system. In the benign case, some error is made and theclient discovers that the targeted port is not listening. For the H � � FAPU failure, the intentmay be a TCP connect scan, a legitimate packet with data piggybacked on the FIN packetor an application that just had nothing to say.
Very long sessions appear as anomalies in our traffic analysis, observed as L�APU and
X�timeout failures. Such sessions have a greater chance of having the handshake oc-
cur before listening started, or the closing occur after listening stopped. The period of timewhere the SHADOW scripts stop and start are also an experimental complication and apotential source of false positives (Section 3).
In the process of analyzing the anomalous TCP connections, we found evidence of packetsbeing dropped by the sniffer. In these cases, the traces showed TCP connections that wereunimpaired by the lack of critical events (flag transitions). For example, in one case, aTCP connection was established without the exchange of a SYN-ACK packet, triggeringa H � � FAPU failure, while data was exchanged and the connection closed normally. Thisimplies that the SYN-ACK packet was missed by the sniffer. Hence some of the anomalousTCP connections were caused by this artefact in the dataset. They were not reported inTables 7 or 8 since they were not related to a network management or security issue.
Other potential experimental complications include additions, resequencing (in which thepacket sniffer alters the ordering of the packets, possibly due to 2 streams in the sniffer, oneoutgoing, one incoming) and timing [2]. There is also a vantage point complication whichmay arise from the location of the packet sniffer on the network. We collected our data ata point outside of the firewall, and as a result for failure H � � timeout, we cannot be surewhether the response to the SYN was blocked or the SYN itself was blocked.
DRDC Ottawa TM 2003-139 17

5 Conclusions and Future Work
The finite state machine representation of TCP connections provides a means of examiningpacket flows on a network that do not conform to the protocol. The model, based entirely onTCP flag transitions, has been shown to successfully detect TCP-based scanning activity,delays, outages, misconfigurations and other unexpected TCP behaviour. It also allows usto examine TCP’s real behaviour on the Internet.
We have shown that slow scans can be identified through mining of the data. Existingcorrelation engines such as Spice [9] could be used to correlate the events found throughapplication of this model. An important advantage to detecting scans with the TCP FSMmethod is that the failure type identifies whether a response was made.
A successful full connect scan cannot be detected with this method because the flag patternobeys the protocol specification. There are properties of the full connect scan that can beused in this case; since data is not sent by the client in this scan, and the session remains inthe Data transfer state for only a short time, program modification to track these propertiesshould address this problem. Alternatively, the model could be modified to allow a transi-tion from the Connection established state to the Closing state via a FIN-PSH-ACK packet,since the PSH bit implies that data is being carried.
It is important that future empirical results using the TCP FSM do not suffer from droppedpackets. False positives that occur as a result of dropped packets from hourly data sets canbe rectified by real-time detection.
For trend analysis, the data must be averaged over a longer timescale or over a wide varietyof networks, as capturing one day on one network can lead to biased results due to scanningactivity or repeated connection attempts to one host.
Traffic generators that simulate TCP [29, 30] are mainly based on the RFC specifications.Those who generate traffic may wish to include an option for TCP traffic that is not officiallyallowed but is nevertheless present on the Internet. Using the proportionalities of anomaliesfound by implementing the TCP FSM, one can introduce failures using a Markov chain [31]approach. As well as a mechanism for traffic generation, Markov models may provide thecapability of assigning a probability that a connection is valid. This may be the basis of astatistical anomaly detection engine.
The TCP FSM cannot be used alone as an intrusion detection system since it does notconsider other factors such as content, however in conjunction with misuse detectors it mayprovide a more complete picture of what is happening on the network.
While it was not our objective to see how well this FSM would work as an anomaly-basedIDS, it would be interesting to do a complete test with a labelled dataset of exploits. Ournext step is to test the method more extensively using a set of attack traffic data, work thatis currently in progress at DRDC.
18 DRDC Ottawa TM 2003-139

References
1. Williamson, Carey (2001). Internet Traffic Measurement. IEEE Internet Computing,5(6), 70–74.
2. Paxson, V. (1997). Automated Packet Trace Analysis of TCP Implementations. InSteenstrup, M., (Ed.), Proceedings of the ACM SIGCOMM ’97 Conference onApplications, Technologies, Architectures, and Protocols for ComputerCommunications, pp. 167–179. Cannes, France: ACM Press.
3. Padhye, J. and Floyd, S. (2001). On Inferring TCP Behavior. In Proceedings of theACM SIGCOMM ’01 Conference on Applications, Technologies, Architectures, andProtocols for Computer Communications, pp. 287–298. San Diego, California, UnitedStates: ACM Press.
4. Guha, B. and Mukherjee, B. (1997). Network security via reverse engineering of TCPcode: Vulnerability analysis and proposed solutions. IEEE Network, 11(4), 40–49.
5. Paxson, V. (1997). End-to-End Internet Packet Dynamics. In Steenstrup, M., (Ed.),Proceedings of the ACM SIGCOMM ’97 conference on Applications, Technologies,Architectures, and Protocols for Computer Communication, pp. 139–154. Cannes,France: ACM Press.
6. Paxson, V. and Floyd, S. (1997). Why We Don’t Know How to Simulate the Internet.In Proceedings of the 29th Conference on Winter Simulation, pp. 1037–1044. Atlanta,Georgia, United States: ACM Press.
7. Smith, F. D., Hernandez-Campos, F., Jeffay, K., and Ott, D. (2001). What TCP/IPProtocol Headers Can Tell Us About the Web. In Vernon, M., (Ed.), Proceedings ofthe 2001 ACM SIGMETRICS International Conference on Measurement andModeling of Computer Systems, pp. 245–256. ACM Press.
8. Postel, J. (1981). RFC 793: Transmission Control Protocol. (Online).http://www.rfc-editor.org/rfc/rfc793.txt.
9. Staniford, S., Hoagland, J., and McAlerney, J. (2002). Practical Automated Detectionof Stealthy Portscans. Journal of Computer Security, 10(1/2), 105–136.
10. Sasha/Beetle (2000). A Strict Anomoly Detection Model for IDS. Phrack, 10(56).
11. Das, K. (2002). Protocol Anomaly Detection for Network-based Intrusion Detection(Online). SANS Institute. http://www.sans.org/rr/intrusion/anomaly.php(Jan. 2003).
12. Lemonnier, E. (2001). Protocol Anomaly Detection in Network-based IDSs (Online).E. Lemonnier.http://erwan.lemonnier.free.fr/exjobb/report/protocol anomaly detection.pdf(Jan. 2003).
DRDC Ottawa TM 2003-139 19
13. Roesch, Martin (2003). Snort (Online). Martin Roesch. http://www.snort.org(Sept. 2003).
14. Enterprise Protection (Online). Internet Security Systems Inc..http://www.iss.net/products services/enterprise protection/rsnetwork/guard.php(Apr. 2003).
15. Hernacki, B. (2003). Symantec Intrusion Detection Systems: Defining ProtocolAnomaly Detection (Online). Symantec Corp.. http://www.symantec.com (Apr.2003).
16. End-to-end Interest Maillist (Online). Postel Center for Experimental Networking.http://www.postel.org/end-to-end/index.html (Mar. 2003).
17. Hennie, F. (1968). Finite-State Models for Logical Machines, John Wiley & Sons.
18. Stevens, W. Richard (1994). TCP/IP Illustrated, Volume 1: The Protocols,Indianapolis, IN: Addison Wesley.
19. Smith, N. J. (Feb. 2001). Choking on Naptha: TCP/IP Network Denial of ServiceVulnerabilities (Online). SANS Institute.http://www.giac.org/practical/Nicholas J Smith GCIH.html (Jan. 2003).
20. Jordi Murgo ([email protected]). Index of /pub/tools/unix/scanners/queso(Online). CERIAS Security Archive.http://ftp.cerias.purdue.edu/pub/tools/unix/scanners/queso (Sept.2003).
21. Jacobson, V., Leres, C., and McCanne, S. (Dec. 2002). TCPdump (Online). LawrenceBerkeley National Laboratory. http://www.tcpdump.org (Jan. 2003).
22. Naval Surface Warfare Center – Dahlgren Lab (2001). NSWC SHADOW Index(Online). U.S. Navy. http://www.nswc.navy.mil/ISSEC/CID (Jan. 2003).
23. Gregoire, M. and Lefebvre, J. H. (in preparation). The Network Traffic AnalysisToolbox. Technical Report. DRDC Ottawa.
24. Moore, D., Voelker, G. M., and Savage, S. (2001). Inferring Internet Denial-of-ServiceActivity. In Proceedings of the 10th USENIX Security Symposium, pp. 9–22.Washington, DC, United States: USENIX Association.
25. Fyodor (Feb. 2003). NMAP (Online). Insecure.org.http://www.insecure.org/nmap (Apr. 2003).
26. Apache HTTP Server Documentation Project. Connections in FIN WAIT 2 andApache (Online). Apache HTTP Server Version 2.0.http://httpd.apache.org/docs-2.0/misc/fin wait 2.html (Mar. 2003).
27. End-to-end Interest Maillist. Frequency of RST terminated connections (Online). USCInformation Sciences Institute.ftp://ftp.isi.edu/end2end/end2end-interest-1997.mail (Mar. 2003).
20 DRDC Ottawa TM 2003-139

28. Floyd, S. (2002). Inappropriate TCP Resets Considered Harmful. (work in progress).draft-floyd-tcp-reset-03.txt.
29. McKenney, P.E., Lee, D.Y., and Denny, B.A. (Jan. 2002). TG Traffic Generator(Online). SRI International and USC/ISI PCEN.http://www.postel.org/tg/tg2002.pdf (Sept. 2003).
30. Lui, H. (Apr. 2000). SSFNET TCP Simulation Analysis by tcpanaly (Online). SSFResearch Network. http://www.ssfnet.org/Papers/tcpanaly.pdf (Mar. 2003).
31. Ross, S. (1988). A First Course in Probability, New York, NY: Macmillan PublishingCompany.
DRDC Ottawa TM 2003-139 21

UNCLASSIFIED SECURITY CLASSIFICATION OF FORM
(highest classification of Title, Abstract, Keywords)
DOCUMENT CONTROL DATA (Security classification of title, body of abstract and indexing annotation must be entered when the overall document is classified)
1. ORIGINATOR (the name and address of the organization preparing the document. Organizations for whom the document was prepared, e.g. Establishment sponsoring a contractor’s report, or tasking agency, are entered in section 8.)
Defence R&D Canada - Ottawa Department of National Defence Ottawa, ON Canada K1A 0Z4
2. SECURITY CLASSIFICATION (overall security classification of the document,
including special warning terms if applicable) UNCLASSIFIED
3. TITLE (the complete document title as indicated on the title page. Its classification should be indicated by the appropriate abbreviation (S,C or U) in parentheses after the title.)
A Finite State Machine Model of TCP Connections in the Transport Layer (U)
4. AUTHORS (Last name, first name, middle initial)
Treurniet, Joanne R. and Lefebvre, Julie H.
5. DATE OF PUBLICATION (month and year of publication of document)
October 2003
6a. NO. OF PAGES (total containing information. Include Annexes, Appendices, etc.)
36
6b. NO. OF REFS (total cited in document)
31
7. DESCRIPTIVE NOTES (the category of the document, e.g. technical report, technical note or memorandum. If appropriate, enter the type of report, e.g. interim, progress, summary, annual or final. Give the inclusive dates when a specific reporting period is covered.)
Technical Memorandum
8. SPONSORING ACTIVITY (the name of the department project office or laboratory sponsoring the research and development. Include the address.)
DRDC Ottawa NIO section
9a. PROJECT OR GRANT NO. (if appropriate, the applicable research and development project or grant number under which the document was written. Please specify whether project or grant)
15bf26
9b. CONTRACT NO. (if appropriate, the applicable number under which the document was written)
10a. ORIGINATOR’S DOCUMENT NUMBER (the official document number by which the document is identified by the originating activity. This number must be unique to this document.)
DRDC Ottawa TM 2003-139
10b. OTHER DOCUMENT NOS. (Any other numbers which may be assigned this document either by the originator or by the sponsor)
11. DOCUMENT AVAILABILITY (any limitations on further dissemination of the document, other than those imposed by security classification) ( x ) Unlimited distribution ( ) Distribution limited to defence departments and defence contractors; further distribution only as approved ( ) Distribution limited to defence departments and Canadian defence contractors; further distribution only as approved ( ) Distribution limited to government departments and agencies; further distribution only as approved ( ) Distribution limited to defence departments; further distribution only as approved ( ) Other (please specify):
12. DOCUMENT ANNOUNCEMENT (any limitation to the bibliographic announcement of this document. This will normally correspond to
the Document Availability (11). However, where further distribution (beyond the audience specified in 11) is possible, a wider announcement audience may be selected.)
Full unlimited announcement
UNCLASSIFIED
SECURITY CLASSIFICATION OF FORM DDCCDD0033 22//0066//8877
UNCLASSIFIED SECURITY CLASSIFICATION OF FORM
13. ABSTRACT ( a brief and factual summary of the document. It may also appear elsewhere in the body of the document itself. It is highly desirable that the abstract of classified documents be unclassified. Each paragraph of the abstract shall begin with an indication of the security classification of the information in the paragraph (unless the document itself is unclassified) represented as (S), (C), or (U). It is not necessary to include here abstracts in both official languages unless the text is bilingual).
Finite state machines can be used to detect anomalous behaviour in TCP traffic by describing the progression of a connection through states as a result of events based on header flags. The method was applied to real traffic to understand its realistic use and it was found that for the time period analysed here, on the order of 37% of TCP connections do not follow the TCP protocol specifications. The majority of these are a result of malicious activity, and approximately 4% are due to benign anomalies such as unresponsive hosts and misconfigurations. The method may be applied as a network security measure, as a network management tool or as a research tool for the study of TCP behaviour on the Internet.
14. KEYWORDS, DESCRIPTORS or IDENTIFIERS (technically meaningful terms or short phrases that characterize a document and could be helpful in cataloguing the document. They should be selected so that no security classification is required. Identifiers such as equipment model designation, trade name, military project code name, geographic location may also be included. If possible keywords should be selected from a published thesaurus. e.g. Thesaurus of Engineering and Scientific Terms (TEST) and that thesaurus-identified. If it is not possible to select indexing terms which are Unclassified, the classification of each should be indicated as with the title.)
Finite State Machine, FSM, anomaly detection, intrusion detection, TCP, network security, network management
UNCLASSIFIED
SECURITY CLASSIFICATION OF FORM

Defence R&D Canada
Canada’s leader in defenceand national security R&D
Chef de file au Canada en R & Dpour la défense et la sécurité nationale
R & D pour la défense Canada
www.drdc-rddc.gc.ca


