Page 1
1
A Five-Year Climatology of Elevated Severe Convective Storms in the United States East of the Rocky Mountains
Katherine L. Horgan
National Weather Center Research Experiences for Undergraduates (NWC REU), Norman, OK and North Carolina
State University, Raleigh, NC
4013 Grand Manor Ct. Apartment 302
Raleigh, NC 27612 804-240-3052
[email protected]
David M. Schultz Cooperative Institute for Mesoscale Meteorological Studies, University of Oklahoma, and NOAA/National Severe Storms
Laboratory, Norman, Oklahoma
Robert H. Johns Norman, Oklahoma
Stephen F. Corfidi
NOAA/Storm Prediction Center, Norman, Oklahoma
John E. Hales NOAA/Storm Prediction Center, Norman, Oklahoma
Page 2
2
Abstract
A five-year climatology of elevated severe convective storms was constructed for the
calendar years 1983 – 1987 from east of the Rocky Mountains to the Atlantic coast. Of
the 1689 surface boundaries examined, 129 (8%) were associated with elevated severe
storm events. Of the 1066 severe reports associated with the 129 elevated severe storm
events, 624 (58%) were hail reports, 396 (37%) were wind reports, and 46 (4%) were
tornado reports. A maximum of elevated severe storm events occurred in May with a
secondary maximum in September. Elevated severe storm events vary geographically
throughout the year with a maximum along the Gulf coast in winter to a High Plains
maximum in spring and summer. The diurnal maximum of elevated severe storm events
occurred at 2100 UTC, which coincided with the diurnal maximum of hail reports. The
wind reports had no pronounced diurnal maximum. Elevated severe storm wind-only
events occur roughly five times a year and are difficult to forecast. To examine the
conditions associated with events that produced severe winds only, five cases were
examined in more detail. These cases consisted of three environments (Type A, B, and
C). Type A events were characterized by strongly forced elevated squall lines. Type B
events were elevated isolated cellular events, whereas Type C events were elevated
northwest flow events. Several questions remain unanswered about elevated severe
storm wind-only events such as: Does the strength or depth of the inversion matter? What
factors affect the transfer of momentum down to the surface?
Page 3
3
1. Introduction
Deep convection can be either surface based or elevated. Surface-based deep
convection ingests parcels of air from near the surface whereas elevated convection
ingests parcels of air from above a frontal surface or surface-based radiational inversion.
The first detailed study of elevated thunderstorms in the United States was Colman’s
(1990a) climatology. Colman (1990a) found that elevated deep convection typically
occurs north of a surface warm front in an environment of strong baroclinicity, large
vertical wind shear, and warm air advection. His climatology also showed that nearly all
winter-season storms are elevated, and a smaller proportion of warm season storms are
also elevated.
Sometimes elevated convection produces severe weather in the form of large hail,
strong winds, and/or tornadoes (Johns and Doswell 1992). Grant (1995) conducted a
preliminary study on elevated severe convection where he examined eleven cases over a
two-year period to understand these events. He found convective instability above the
shallow, but strong, inversion in the proximity soundings for each event. Grant (1995)
also noted that the majority of events were large hail-producing storms.
In addition to the work by Colman (1990a) and Grant (1995), several studies have
also been performed on specific events of elevated severe convective storms (Schmidt
and Cotton 1989; Bernardet and Cotton 1998; Banacos and Schultz 2005). However, to
date, an in-depth study does not exist that examines when, where, and how often these
elevated convective events produce severe weather. The purpose of this study is to extend
previous investigations by creating a five-year climatology. Several cases from that
Page 4
4
climatology will also be evaluated to assess whether any guidance about forecasting these
types of events exists.
Section 2 details the methodology used to obtain the climatology. The results of
the five-year climatology are presented in Section 3. Section 4 presents three
environments in which elevated severe storm wind-only events can occur. Section 5
discusses several remaining questions about elevated severe wind events. Section 6
presents the conclusions of this paper.
2. Data and methodology
Severe weather associated with deep convection is defined by the National Weather
Service as hail 0.75 in. (1.9 cm) or greater in diameter, wind gusts of at least 50 kt (26 m
s-1), or tornadoes (e.g., Johns and Doswell 1992). Significant severe weather is defined
by Hales (1988) as hail 2 in. or greater (5.1 cm) in diameter, wind gusts of at least 65 kt
(33 m s-1), or tornadoes with F2 intensity or greater. To assess the environments and
conditions that cause elevated convection that produces severe weather, a climatology
was generated containing all possible elevated severe storm events from the front range
of the Rockies eastward to the Atlantic coast and to the northern and southern borders of
the United States for the calendar years 1983–1987. These calendar years were chosen for
the climatology for two main reasons. First, the years were selected to maximize the
number of National Meteorological Center [NMC, now known as the National Centers
for Environmental Prediction (NCEP)] manually analyzed 3-h surface maps archived on
microfilm at the Storm Prediction Center (SPC). The use of these maps avoided the
perceived degradation in the quality of the surface analyses in more recent years from the
Page 5
5
switch to automated isobar analysis (e.g., Bosart 1989). Second, several studies have
documented the dramatic increase in severe reports for wind (Weiss et al. 2002), hail
(Doswell et al. 2005), and tornadoes (Verbout et al. 2005) over the past 50 years.
Therefore, by using severe reports from the 1980s, the inflation in the number of severe
reports, many of which are marginal, is less likely.
Identifying elevated severe weather events consisted of two steps. The first step in
constructing the climatology was to examine the daily 1200 UTC surface maps in the
weekly National Oceanic and Atmospheric Administration (NOAA) publication Daily
Weather Maps for any boundaries. In this case, a boundary was defined as any analyzed
front on the daily 1200 UTC surface map. If a surface boundary was found, the National
Climatic Data Center’s (NCDC) Storm Data was examined to determine whether any
severe reports occurred on the cold side of the surface boundary. Of the 1826 days
during the five-year period, 1689 (91%) had surface boundaries east of the Rockies. Of
these 1689 surface boundaries, 394 (23%) had potential elevated severe storm events
associated with them. The second step was to take the 394 potential elevated severe
storm events and examine them in greater detail.
Two more detailed criteria were examined to check if the event was indeed elevated.
The first criterion was that the severe reports were at least 1° latitude (111 km) on the
cold side of the surface boundary. The criterion was used to ensure that the reports were
sufficiently far north of the surface boundary to be elevated. The criterion was examined
by using the NMC’s 3-h manually analyzed surface maps to determine the location of the
boundary at the time the severe reports occurred. The second criterion was to examine
proximity soundings for possible lower-tropospheric stable layers. If the report was on
Page 6
6
the cold side of the boundary and the proximity sounding possessed a low-level stable
layer, this case was considered a probable elevated severe event. The event was also
given a subjective ranking from 1 to 10 on both the confidence it was elevated and the
availability of appropriate proximity soundings. Of the 394 potential elevated severe
storm events, 129 (33%) of them were considered elevated severe storm events in the
climatology. Thus, of the 1689 days with surface boundaries, 8% were defined as
elevated severe storm events.
Proximity soundings were then reexamined for each case. The proximity sounding
had to be on the cold side of the boundary, no more than 3° latitude (333 km) away from
the reports, and within 3 hours of the initial report. If the initial report was more than 3
hours from sounding times, both of the soundings which surrounded the time of the initial
report were examined. This sounding time problem was most problematic for the 1800
UTC cases in which the 1200 UTC sounding showed a pronounced inversion, but the
0000 UTC sounding showed no inversion. It was difficult to determine when the
convection became surface based for these cases, so these were not given a high
confidence level on the subjective ranking.
3. Results
This five-year climatology resulted in 129 elevated severe storm events with 1066
severe reports. Each case had an average of 3 severe reports associated with it. 624
(59%) of the severe reports were hail reports; 396 (37%) were wind reports, and 46 (4%)
were tornadoes (Fig. 1). Of the 1066 severe reports, 73 (7%) were significant severe
reports. Of the 624 hail reports, 58 (9%) were significant severe reports, whereas only 10
Page 7
7
(3%) of the 396 wind reports were significant severe reports. Of the 46 tornado reports, 5
(10%) were significant severe reports.
Elevated severe storm events occurred most often across the Great Plains and
states just to the east. Nebraska had 19 elevated severe storm events, five more than any
other state. The coast of the New England, Florida, and Illinois all tallied zero elevated
severe storm events. Elevated severe storm events varied greatly during the year from
the Gulf Coast to the Ohio Valley to the High Plains (Fig. 2). During the winter, the
elevated severe storm events were concentrated along the Gulf coastal region. In the
spring, elevated severe activity occurred along the western Gulf coastal states and in the
Mississippi valley. During summer, the maximum of elevated severe occurred in the
High Plains. In the fall, the variation is much greater, a maximum of elevated severe
occurred in September in the High Plains, but elevated severe storm events concentrated
near the Gulf Coast in October and November.
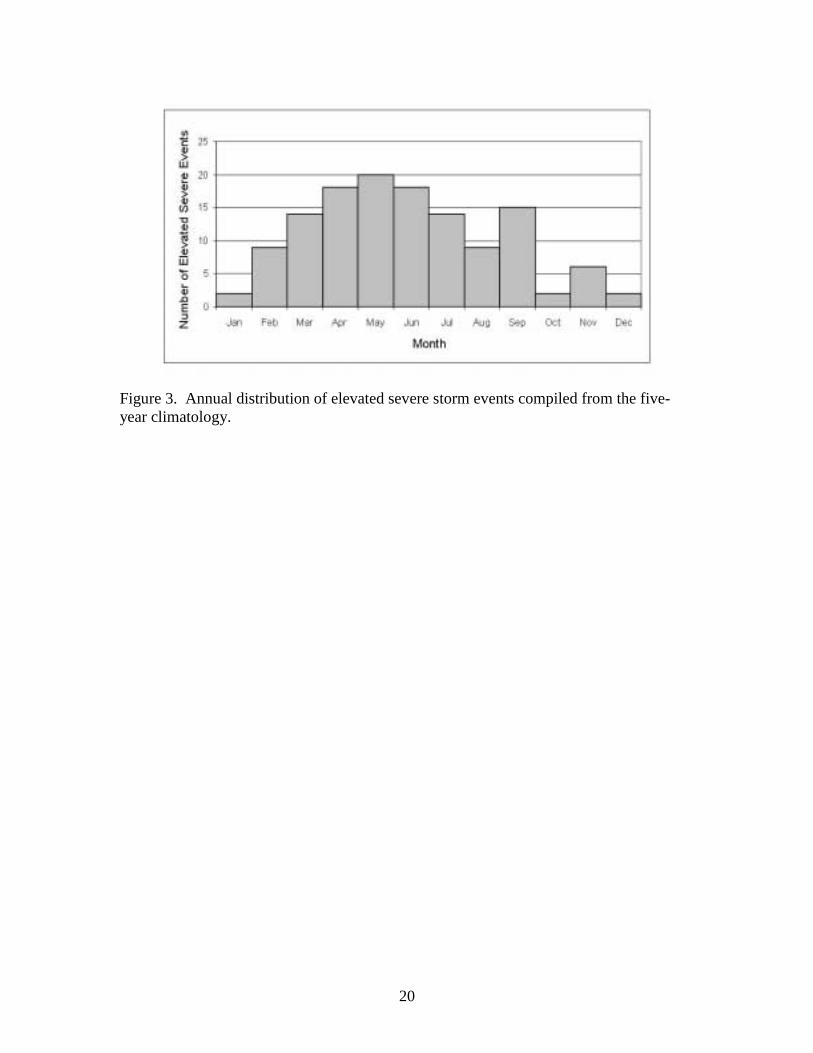
The 129 elevated severe storm events had a springtime maximum in May with a
secondary maximum in September (Fig. 3). This distribution looked nearly identical to
Colman’s (1990a) five-year climatology of elevated thunderstorms. Therefore, elevated
severe storm events may be closely tied to elevated thunderstorms. The wind-only events
had a maximum in February with a second maximum in July, whereas the hail events had
a similar distribution to the total of all elevated severe storm events with the same May
and September maxima respectively. Twice as many hail-only events existed as
compared to wind-only, which explains the similarity between the total distribution and
the hail-only distribution.
Page 8
8
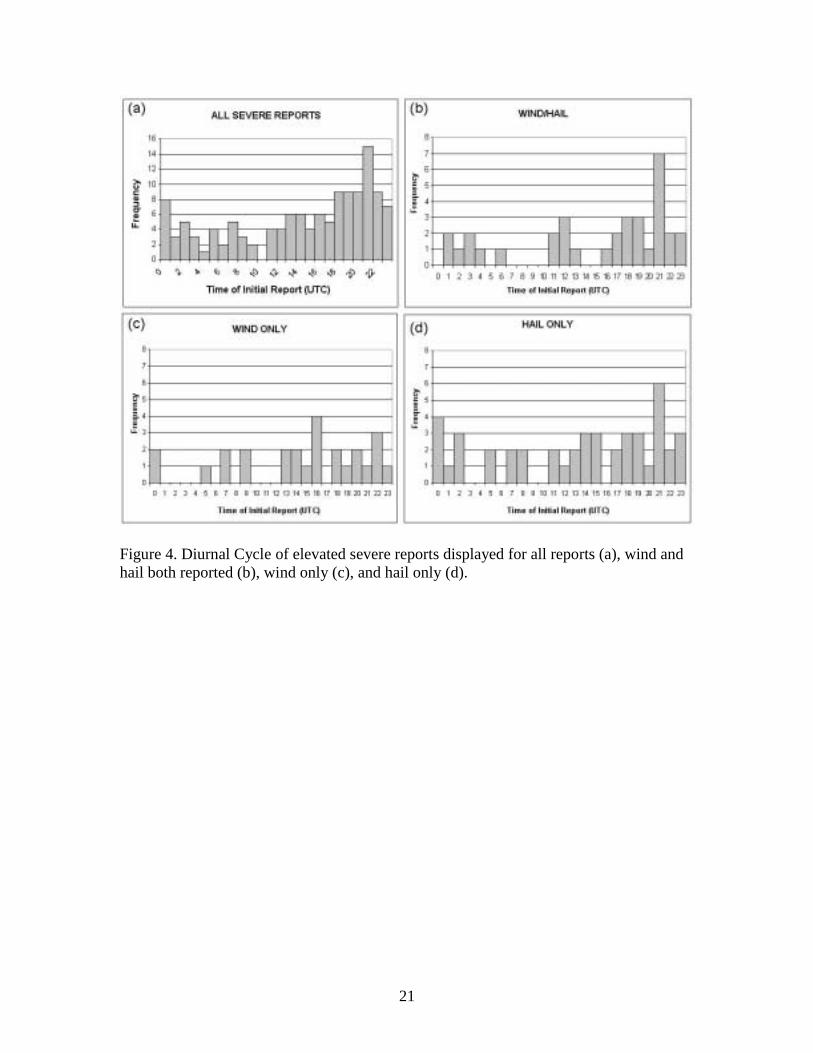
Elevated severe storm events have diurnal as well as seasonal variations (Fig. 4).
Of the 129 elevated severe storm events, the 34 (26%) wind/hail events and the 16 (12%)
wind/hail/tornado events both had a maximum at 2100 UTC. The 45 (35%) hail-only
events also had a maximum at 2100 UTC. The 26 (20%) wind-only events had a diurnal
maximum around 1600 UTC. The total distribution of initial elevated severe reports had
a maximum at 2100 UTC, which coincided with the events with hail reports (hail-only,
wind/hail, wind/hail/tornadoes).
4. Three environments conducive for elevated severe storm wind-only events
Elevated severe storms that produce wind-only events occur roughly 5 times a
year and are difficult to forecast. Five events that were rated with high confidence levels
(7 or greater) and just had wind-only reports associated with them were studied. They
fall into three categories: Type A, B, and C. Type A events are characterized by strongly
forced elevated squall lines. All three of the events discussed in this category occurred in
the southeast. Cold-air damming is also present in two of the three cases. Low-latitude
cyclones and strong forcing are the main characteristics of this category. Type B events
are characterized by elevated isolated cells. Type C events are characterized by elevated
northwest flow events, similar to the northwest flow events discussed in Johns (1984).
Due to our limited five-year dataset, other types of environments conducive to elevated
severe storm wind-only events may exist.
Page 9
9
a. Type A
Three of the five events fall into this category. They all occur in the southeast in
the winter and have strong dynamics associated with them. Each event is associated
with an elevated squall line. All of the events show a warm sector airmass with Most
Unstable Convective Available Potential Energy (MUCAPE) values of 1000 J/kg or
greater. The warm sector also has dry air at mid-levels, a key ingredient for strong winds
at the surface. Dry air at mid-levels allows for evaporational cooling to occur, which can
enhance strong downdraft potential.
The first event was on 20 Nov 1986 across northern Georgia (Figure 5). A strong
upper-level trough was centered over the Mississippi valley. At the surface, an east-west
oriented stationary front was in place over southern Alabama and Georgia. Cold-air
damming was in place east of the Appalachians with temperatures north of the stationary
front in the 40s (5-10°C). The 1200 UTC Centreville, Alabama (CKL) sounding showed
that just above the surface, a 50 to 100 mb inversion was in place. Above this frontal
inversion, 500 J/kg of MUCAPE was present with winds of 50 knots or more above 700
mb. Dry air, a key downdraft ingredient, was also present at mid-levels in the CKL
sounding. South of the surface stationary front, warm sector MUCAPE values were
around 2000 J/kg. Composite manually digitized radar maps (not shown) showed that a
squall line formed in the early morning hours. This elevated squall line left 18 severe
wind damage reports across northern Georgia.
The second event in this category occurred on 28 Dec 1983 across northern
Georgia and northwestern South Carolina (Figure 6). Again a strong upper-level trough
was in place, centered over the Great Plains. An east-west oriented front was also in
Page 10
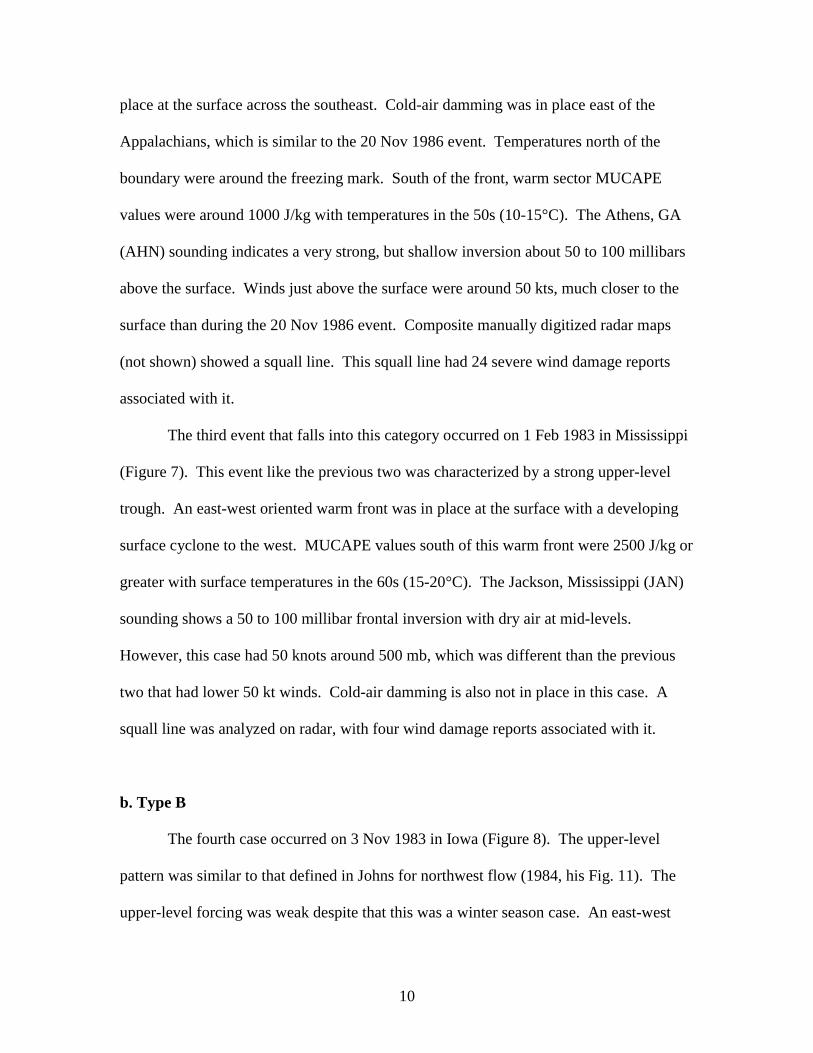
10
place at the surface across the southeast. Cold-air damming was in place east of the
Appalachians, which is similar to the 20 Nov 1986 event. Temperatures north of the
boundary were around the freezing mark. South of the front, warm sector MUCAPE
values were around 1000 J/kg with temperatures in the 50s (10-15°C). The Athens, GA
(AHN) sounding indicates a very strong, but shallow inversion about 50 to 100 millibars
above the surface. Winds just above the surface were around 50 kts, much closer to the
surface than during the 20 Nov 1986 event. Composite manually digitized radar maps
(not shown) showed a squall line. This squall line had 24 severe wind damage reports
associated with it.
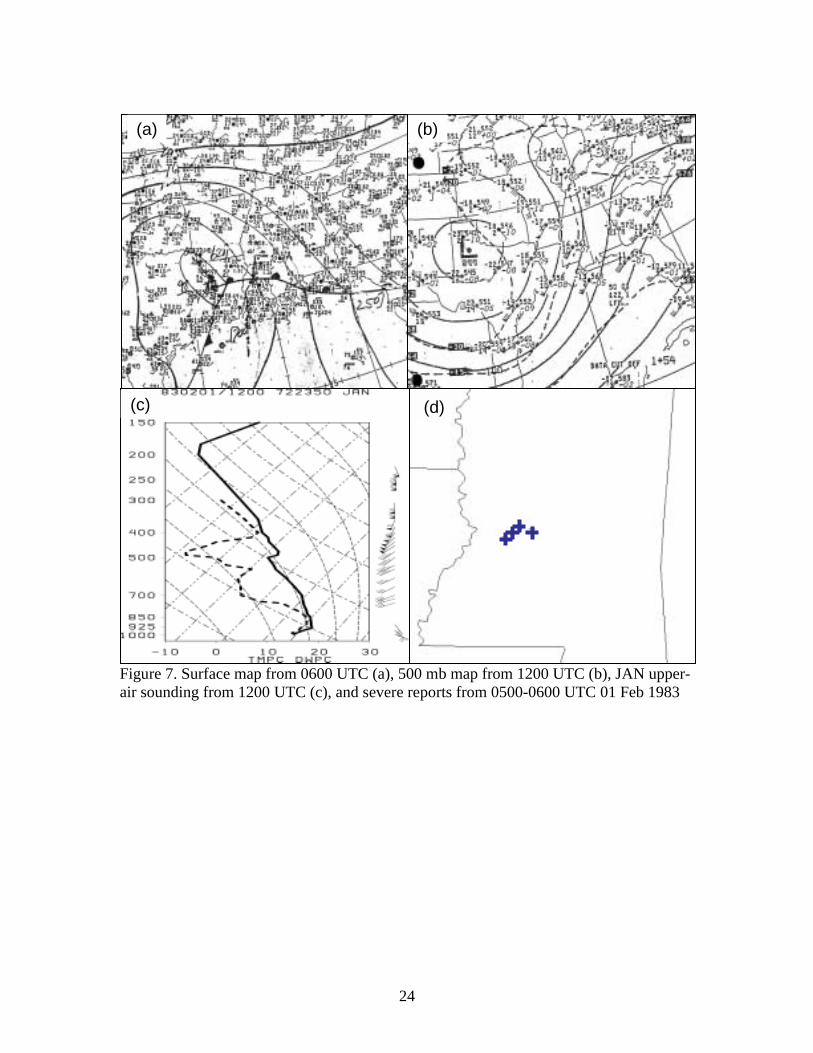
The third event that falls into this category occurred on 1 Feb 1983 in Mississippi
(Figure 7). This event like the previous two was characterized by a strong upper-level
trough. An east-west oriented warm front was in place at the surface with a developing
surface cyclone to the west. MUCAPE values south of this warm front were 2500 J/kg or
greater with surface temperatures in the 60s (15-20°C). The Jackson, Mississippi (JAN)
sounding shows a 50 to 100 millibar frontal inversion with dry air at mid-levels.
However, this case had 50 knots around 500 mb, which was different than the previous
two that had lower 50 kt winds. Cold-air damming is also not in place in this case. A
squall line was analyzed on radar, with four wind damage reports associated with it.
b. Type B
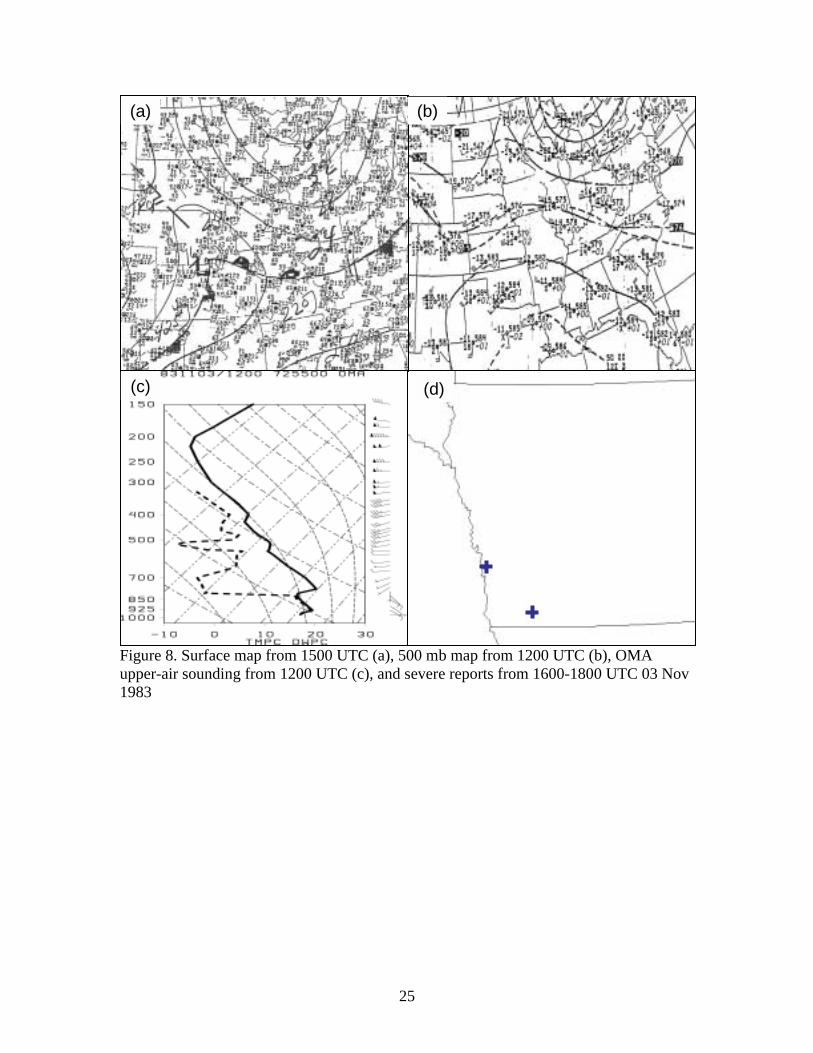
The fourth case occurred on 3 Nov 1983 in Iowa (Figure 8). The upper-level
pattern was similar to that defined in Johns for northwest flow (1984, his Fig. 11). The
upper-level forcing was weak despite that this was a winter season case. An east-west
Page 11
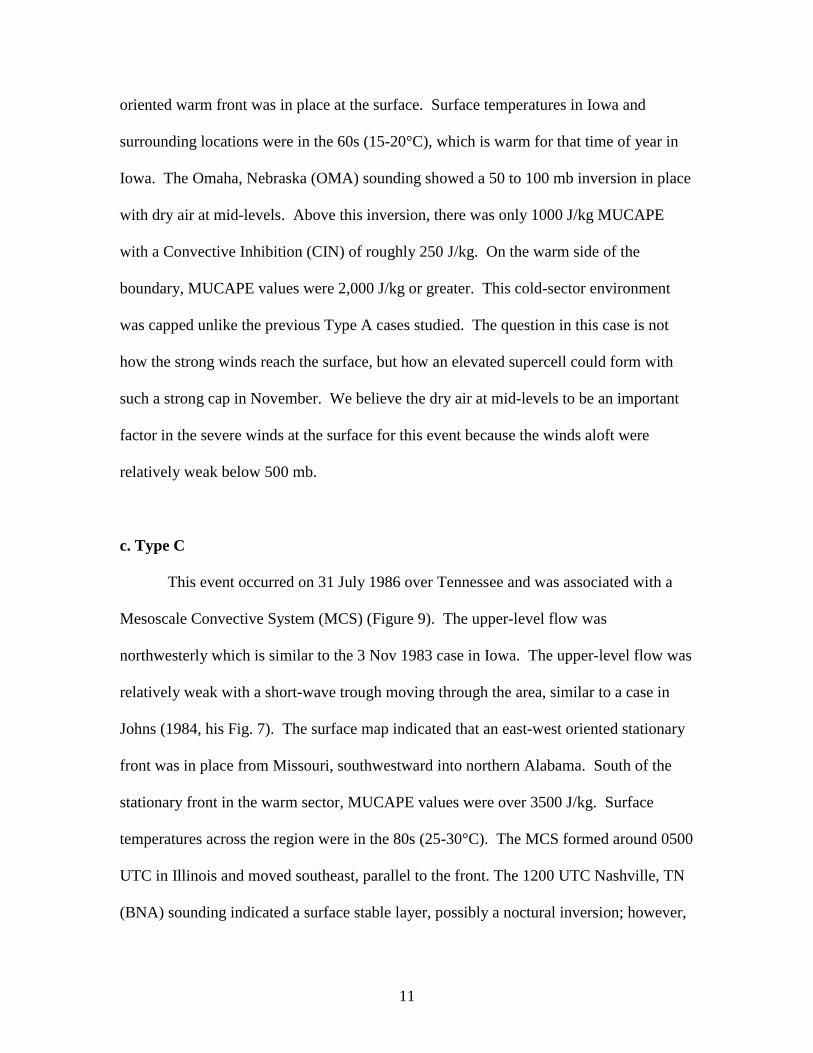
11
oriented warm front was in place at the surface. Surface temperatures in Iowa and
surrounding locations were in the 60s (15-20°C), which is warm for that time of year in
Iowa. The Omaha, Nebraska (OMA) sounding showed a 50 to 100 mb inversion in place
with dry air at mid-levels. Above this inversion, there was only 1000 J/kg MUCAPE
with a Convective Inhibition (CIN) of roughly 250 J/kg. On the warm side of the
boundary, MUCAPE values were 2,000 J/kg or greater. This cold-sector environment
was capped unlike the previous Type A cases studied. The question in this case is not
how the strong winds reach the surface, but how an elevated supercell could form with
such a strong cap in November. We believe the dry air at mid-levels to be an important
factor in the severe winds at the surface for this event because the winds aloft were
relatively weak below 500 mb.
c. Type C
This event occurred on 31 July 1986 over Tennessee and was associated with a
Mesoscale Convective System (MCS) (Figure 9). The upper-level flow was
northwesterly which is similar to the 3 Nov 1983 case in Iowa. The upper-level flow was
relatively weak with a short-wave trough moving through the area, similar to a case in
Johns (1984, his Fig. 7). The surface map indicated that an east-west oriented stationary
front was in place from Missouri, southwestward into northern Alabama. South of the
stationary front in the warm sector, MUCAPE values were over 3500 J/kg. Surface
temperatures across the region were in the 80s (25-30°C). The MCS formed around 0500
UTC in Illinois and moved southeast, parallel to the front. The 1200 UTC Nashville, TN
(BNA) sounding indicated a surface stable layer, possibly a noctural inversion; however,
Page 12
12
at some point the MCS did become surface-based as evident by the 0000 UTC BNA
sounding (not shown). Determining at what time the MCS was elevated versus surface-
based was difficult due to the lack of upper-air data around the event time. The strongest
part of the inversion present at 1200 UTC had a depth of 50 millibars or less. Composite
radar images indicate that the system was a MCS (not shown). There were four severe
reports associated with this event from 1400-1600 UTC. This event serves as a
comparison to the other four events because of prior research that has been done enabling
forecasters to better understand this kind of elevated severe convection.
5. Discussion
After constructing the climatology and examining the five high-confidence wind
only cases, several questions remain unanswered.
Does the strength or depth of the inversion matter? Results are inconclusive. The
five wind cases examined showed depths of less than 50 to around 100 millibars. If the
inversion is stronger than 100 millibars, does that keep the winds from penetrating to the
surface?
What factors affect the transfer of strong momentum down to the surface? If the
supercell or squall line can initiate and start the downdraft processes, is it possible that a
strong downdraft will have ample kinetic energy to penetrate the inversion? If a gravity
wave moved through this environment on the cold side of the boundary, would it cause
large enough undulations in the inversion that only a small amount of momentum would
be able to penetrate? Are there other factors that also affect transfer of the strong
momentum to the surface?
Page 13
13
6. Conclusion
During this five-year climatology of the 1826 possible days, 1689 (91%) of them
had surface boundaries. Of these 1689 surface boundaries, 129 (8%) elevated severe
storm events were found. The 129 elevated severe storm events had 1066 total severe
reports associated with them. The 1066 total severe reports were distributed as follows:
624 (58%) hail reports, 396 (37%) wind reports, and 46 (4%) tornado reports.
Elevated severe convection has an annual maximum around May with a
secondary maximum in September. The geographic distribution of elevated severe
convection followed the typical severe convection pattern from the Plains in the spring
(Mar-May), to the High Plains in the summer (Jun-Aug), across the United States in the
fall (Sep-Nov), and finally along the Gulf Coast in the winter (Dec-Feb). The diurnal
maximum of elevated severe storm events occurred around 2100 UTC, which coincided
with the hail-only diurnal maximum. The wind-only events showed no pronounced
diurnal maximum. Of the 129 elevated severe storm events, 20 of them produced severe
winds only. This subset of events is difficult to forecast.
To investigate the conditions that are conducive to elevated severe convection that
produces severe wind reports only, five events were examined in greater detail. Three
environments were found to be associated with these five events: Type A, B, and C.
Type A events were characterized by strongly forced elevated squall lines, Type B by
elevated isolated cellular events, and Type C by elevated northwest flow events. Type A
events had strong forcing associated with them while Type B and C events had weak
upper-level flow. Gravity waves or other factors may have affected the inversion in Type
A events, making it possible for strong downdrafts to penetrate to the surface. Type A
Page 14
14
events also were multi-cellular as were Type C, whereas Type B was from a single cell.
Type C events lacked strong forcing aloft, but had a much weaker inversion.
Using these similarities, numerical modeling of elevated severe convective storms
may reveal the key to penetrating the inversion. The strength of the inversion, the depth
of the inversion, the strength of the downdraft, another unknown factor, or a combination
of these may be the cause of these events. A more extensive climatology of elevated
severe storm events is also needed and would reveal the distributions of the types of
severe storm events (hail, wind, and tornado) as well as their variability. Numerical
modeling and a longer climatology are the next steps we believe are necessary to
investigate the forecasting problem of elevated severe convective storms.
Acknowledgements: This study was funded by NSF Grant # 0097651 for the National Weather Center
Research Experiences for Undergraduates (NWC REU). The author is especially grateful
to John Hart for his computer software (NSHARP and SeverePlot) help and Doug Rhue
for his microfilm support. The author also wishes to thank Daphne Zaras for the NWC
REU program that made this study possible.
Page 15
15
REFERENCES Banacos, P. C., and D. M. Schultz, 2005: The use of moisture flux convergence in
forecasting convective initiation: Historical and operational perspectives. Wea.
Forecasting, 20, 351-366.
Bernardet, L. R. and W. R. Cotton, 1998: Multiscale evolution of a derecho-producing
mesoscale convective system. Mon. Wea. Rev., 126, 2991-3015.
Bosart, L. F., 1989: Automation: Has its time really come? Wea. Forecasting, 4, 271-272.
Colman, B. R., 1990a: Thunderstorms above frontal surfaces in environments without
positive CAPE. Part I. A climatology. Mon. Wea. Rev., 118, 1103-1122.
––––––––, 1990b: Thunderstorms above frontal surfaces in environments without
positive CAPE. Part II. Organization and instability mechanisms. Mon. Wea. Rev., 118,
1123-1144.
Doswell, C. A. III, H. E. Brooks, and M. P. Kay, 2005: Climatological estimates of daily
local nontornadics thunderstorm probability for the United States. Wea. Forecasting, in
press.
Grant, B. N., 1995. Elevated cold-sector severe thunderstorms: A preliminary study. Natl.
Wea. Dig., 19, 25-31.
Page 16
16
Hales, J. E., Jr., 1988: Improving the watch/warning program through use of significant
event data. Preprints, 15th Conf. on Severe Local Storms, Baltimore, MD, Amer. Meteor.
Soc., 165-168.
Johns, R. H., 1982: A synoptic climatology of northwest flow severe weather outbreaks.
Part I: Nature and significance. Mon. Wea. Rev., 110, 1653-1663.
––––––––,1984: A synoptic climatology of northwest flow severe weather outbreaks. Part
II. Meteorological parameters and synoptic patterns. Mon. Wea. Rev., 112, 449-464.
––––––––, and C. A. Doswell III, 1992: Severe local storms forecasting. Wea.
Forecasting, 7, 588-612.
Schmidt, J. M., and W. R. Cotton, 1989: A High Plains squall line associated with severe
surface winds. J. Atmos. Sci., 46, 281-302.
Verbout, S. M., L. M. Leslie, H. E. Brooks, and S. L. Bruening, 2005: Leveling the field
for tornado reports through time: Inflation-adjustment of annual tornado reports and
objective identification of extreme tornado reports. Wea. Forecasting, submitted.
[Available at http://www.cimms.ou.edu/~schultz/papers/verboutetal05.pdf]
Page 17
17
Weiss, S.J., J.A. Hart and P.R. Janish, 2002: An examination of severe thunderstorm
wind report climatology: 1970-1999. Preprints, 21st Conf. on Severe Local Storms, San
Antonio, TX, Amer. Meteor. Soc., 446-449.
Page 18
18
Figure 1. Histogram detailing the distribution of severe reports for the 129 elevated severe storm events in the climatology. The striped part of each bar indicates significant reports.
Page 19
19
Figure 2. Seasonal distribution of elevated severe storm events. Shades of gray indicate the number of events in the state during the season. Seasons are defined as: spring (Mar-May), summer (Jun-Aug), fall (Sep-Nov), and winter (Dec-Feb).
Page 20
20
Figure 3. Annual distribution of elevated severe storm events compiled from the five-year climatology.
Page 21
21
Figure 4. Diurnal Cycle of elevated severe reports displayed for all reports (a), wind and hail both reported (b), wind only (c), and hail only (d).
Page 22
22
Figure 5. Surface map from 1200 UTC (a), 500 mb map from 1200 UTC (b), CKL upper-air sounding from 1200 UTC (c), and severe reports from 1300-1700 UTC 20 Nov 1986.
(c) (d)
(b) (a)
Page 23
23
Figure 6. Surface map from 1200 UTC (a), 500 mb map from 1200 UTC (b), AHN upper-air sounding from 1200 UTC (c), and severe reports from 1300-1600 UTC 28 Dec 1983
(c) (d)
(b) (a)
Page 24
24
Figure 7. Surface map from 0600 UTC (a), 500 mb map from 1200 UTC (b), JAN upper-air sounding from 1200 UTC (c), and severe reports from 0500-0600 UTC 01 Feb 1983
(c) (d)
(b) (a)
Page 25
25
Figure 8. Surface map from 1500 UTC (a), 500 mb map from 1200 UTC (b), OMA upper-air sounding from 1200 UTC (c), and severe reports from 1600-1800 UTC 03 Nov 1983
(c) (d)
(b) (a)
Page 26
26
Figure 9. Surface map from 1500 UTC (a), 500 mb map from 1200 UTC(b), BNA upper-air sounding from 1200 UTC (c), and severe reports from 1400 to 1600 UTC 31 Jul 1986.
(c) (d)
(b) (a)