A Flexible Computer Program for Evaluation of Emission Spectrometric Data*?$ Geoffrey Thompson and Kay Paine Woods Hole Oceanographic Institution, Woods Hole, Massachusetts 02543 and Frank T. Manheim u. s. Geological Survey, Woods Hole, Massachusetts 02543 (Received 14 November 1968; revision received 31 January 1969) We have designed a single program, for use with a direct-reading spectrometer, to include the following functions for a variety of sample types, excitation methods, and analytical concentration ranges: (1) Background correction by linear relation of background at analytical lines to back- ground at other wavelengths; (2) Use of background, internal standard and analytical channels interchangeably; (3) Use of either standard dilution or variable composition standards; (4) Standard curve fitting by least squares regression. Curves as high as 6th order can be fitted in order to utilize shoulder and toe areas of these analytical curves without distorting straight-line segments. INDEX HEADINGS: Computer program; Emission spectrometry; Direct-reading. INTRODUCTION A direct-reading emission spectrometer was recently set up at the Woods Hole Oceanographic Institution for the purpose of studying the elemental composition of a variety of materials, including marine waters, sediments, igneous rocks, and organisms. The spec- trometer is a Jarrell-Ash "Atomeounter," employing a 1.5-m modified Paschen-Runge grating mount and sequential, digitized readout, permitting the photo- multiplier output of a selection of 22 out of a present total of 43 analytical channels to be recorded after each exposure. We have found that, for general research, as con- trasted with quality control applications, careful background correction is necessary to provide maxi= mum sensitivity and accuracy. Practical considera- tions limit the number of available lines and require the use of nonlinear portions of analytical curves. i~[oreover, we have found that no one internal stan- dard, set of stadards, or method of background correc- tion is applicable to all analytical lines or operating con- ditions. Thus, the calculations required for analytical interpretation may be more complex than can be ac- complished by simple electronic manipulations of spectrometer readout or by relatively inexpensive, spectrometer-associated computers2 '~ To relieve the tedium and bottleneck provided by manual calculations, we have devised a program which * Presented, in part, to the Pittsburgh Conference on Analytical Chemistry and Applied Spectroscopy, March 1968. 1" Publication approved by the Director, U. S. Geological Survey. Work was supported by the U. S. Atomic Energy Commission under contracts AT(30-1)-2174 and AT(30-1)-3010 with the Woods Hole Oceanographic Institution and by the U. S. Geological Survey under contract GS 8358. This is contribution No. 2277 from the Woods Hole Oceanographic Institution. provides the necessary flexibility to process the digitized output of the spectrometer on an external computer. The program, written in MSD Tape Fortran II, is available on request from the authors at the Institution (Woods Hole Oceanographic Insti- tution Technical Report 68-26, unpublished manu- script). Other computerized computations of spectro- chemical data have been described3-~; we believe the program described here outlines one approach towards achieving flexibility and accurate background correc- tions. We do not claim this to be the ultimate or necessarily the best method of computerizing spectro- analytical data, although we do believe that it may be useful to those laboratories and analysts dealing with a variety of analytical problems. The purpose of the present paper is to outline briefly the program, discuss the problems encountered in devising the program, and comment on our method of coping with them. I. OPERATING PROCEDURE (1) The sample is excited (by high voltage ac spark or dc arc in our spectrochemicM procedures). Digitized photomultiplier outputs are subsequently logged manually on data sheets (Table I). Standards, samples, and background monitors are run in random order, though gathered together in logical sequence on the data sheets. Replicate analyses are placed together, and standards are grouped in rising or falling concen- tration order. Blanks run for background monitoring (discussed later) are also grouped separately. Each excitation is assigned its consecutive run number. The purpose of grouping is to facilitate visual checking of replicates to detect aberrations which may require re-runs or instrument calibrations, and exclusion of certain standards from subsequent card punching. 264 Volume23, Number 3, 1969 APPLIED SPECTROSCOPY
Transcript
A Flexible Computer Program for Evaluation of Emission Spectrometric Data*?$
u. s. Geological Survey, Woods Hole, Massachusetts 02543
(Received 14 November 1968; revision received 31 January 1969)
We have designed a single program, for use with a direct-reading spectrometer, to include the following functions for a variety of sample types, excitation methods, and analytical concentration ranges: (1) Background correction by linear relation of background at analytical lines to back- ground at other wavelengths; (2) Use of background, internal standard and analytical channels interchangeably; (3) Use of either standard dilution or variable composition standards; (4) Standard curve fitting by least squares regression. Curves as high as 6th order can be fitted in order to utilize shoulder and toe areas of these analytical curves without distorting straight-line segments. INDEX HEADINGS: Computer program; Emission spectrometry; Direct-reading.
INTRODUCTION
A direct-reading emission spect rometer was recently set up at the Woods Hole Oceanographic Ins t i tu t ion for the purpose of s tudying the elemental composit ion of a va r ie ty of materials, including marine waters, sediments, igneous rocks, and organisms. The spec- t rometer is a Jar re l l -Ash "Atomeoun te r , " employing a 1.5-m modified Paschen-Runge grat ing mount and sequential, digitized readout, permi t t ing the photo- multiplier ou tpu t of a selection of 22 out of a present to ta l of 43 analyt ical channels to be recorded af ter each exposure.
We have found that , for general research, as con- t ras ted with qual i ty control applications, careful background correction is necessary to provide maxi= m u m sensi t ivi ty and accuracy. Pract ical considera- tions limit the number of available lines and require the use of nonlinear portions of analyt ical curves. i~[oreover, we have found tha t no one internal s tan- dard, set of s tadards, or method of background correc- t ion is applicable to all analytical lines or operat ing con- ditions. Thus, the calculations required for analyt ical in terpre ta t ion may be more complex than can be ac- complished by simple electronic manipulat ions of spect rometer readout or by relat ively inexpensive, spectrometer-associated computers2 '~
To relieve the tedium and bot t leneck provided by manual calculations, we have devised a p rogram which
* Presented, in part, to the Pittsburgh Conference on Analytical Chemistry and Applied Spectroscopy, March 1968.
1" Publication approved by the Director, U. S. Geological Survey. Work was supported by the U. S. Atomic Energy Commission under contracts AT(30-1)-2174 and AT(30-1)-3010 with the Woods Hole Oceanographic Institution and by the U. S. Geological Survey under contract GS 8358. This is contribution No. 2277 from the Woods Hole Oceanographic Institution.
provides the necessary flexibility to process the digitized ou tpu t of the spec t rometer on an external computer . The program, wri t ten in M S D Tape For t ran I I , is available on request f rom the au thors at the Ins t i tu t ion (Woods Hole Oceanographic Ins t i - tu t ion Technical Repor t 68-26, unpublished manu- script). Other computer ized computa t ions of spectro- chemical da ta have been described3-~; we believe the p rogram described here outlines one approach towards achieving flexibility and accurate background correc- tions. We do not claim this to be the u l t imate or necessarily the best method of computer izing spectro- analytical data, a l though we do believe tha t it m a y be useful to those laboratories and analysts dealing with a var ie ty of analytical problems. The purpose of the present paper is to outline briefly the program, discuss the problems encountered in devising the program, and comment on our method of coping with them.
I. OPERATING PROCEDURE
(1) The sample is excited (by high voltage ac spark or dc arc in our spectrochemicM procedures). Digit ized photomult ipl ier outputs are subsequent ly logged manual ly on da ta sheets (Table I). Standards, samples, and background monitors are run in r andom order, though gathered together in logical sequence on the da ta sheets. Replicate analyses are placed together, and s tandards are grouped in rising or falling concen- t ra t ion order. Blanks run for background monitor ing (discussed later) are also grouped separately. Each excitation is assigned its consecutive run number. The purpose of grouping is to facil i tate visual checking of replicates to detect aberrat ions which m a y require re-runs or ins t rument calibrations, and exclusion of certain s tandards from subsequent card punching.
264 Volume 23, Number 3, 1969 APPLIED SPECTROSCOPY
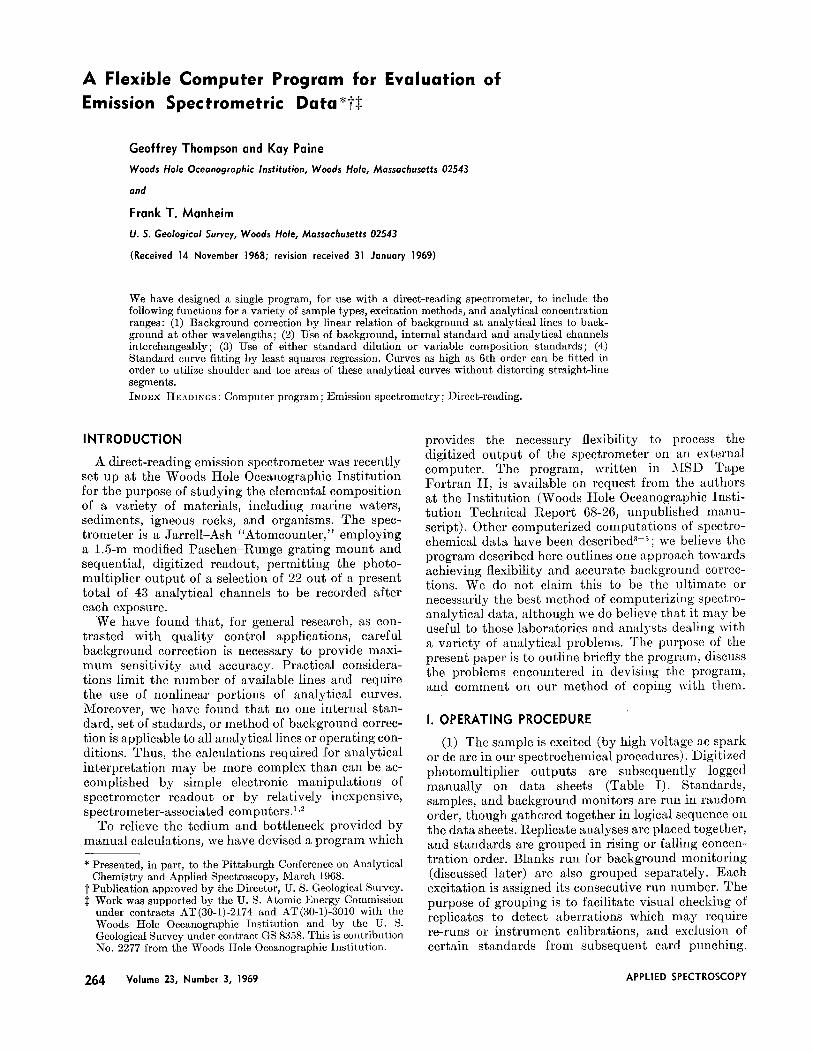
Tab le I. Example of Direct-Reader Data Sheet Input, (Dilution option used.)
Taken from Test Case Data in Section V of the Fortran Program.
cois. on Card 17.1 co]s. on Card 17.2 {cols, I-4 of Card 17.1 repeated in Cols. I=4 of 17.2)
etc. up to Run 47 all the sample charges STD-I is used to denote Standards with appropriate dilution option. If dilution option not used Standards may be designated in any
manner with appropriate weight factor for each. Similarly for Buffer and Sample designation i f dilution option used dilution factor 1 used; i f not then weight factor used,
Randomness in sequence of excitation is desirable to cause minor systematic changes in apparent spectral output (such as may be caused by temperature varia- tion, photomultiplier fatigue, or electronic drifts) to appear as data scatter rather than undetected system- atic error in analyses.
(2) The logged channel counts are punched on to IBM cards which identify sample number, dilution, or other essential information. If the number of channel entries exceeds the column entries on the cards, additional cards are used.
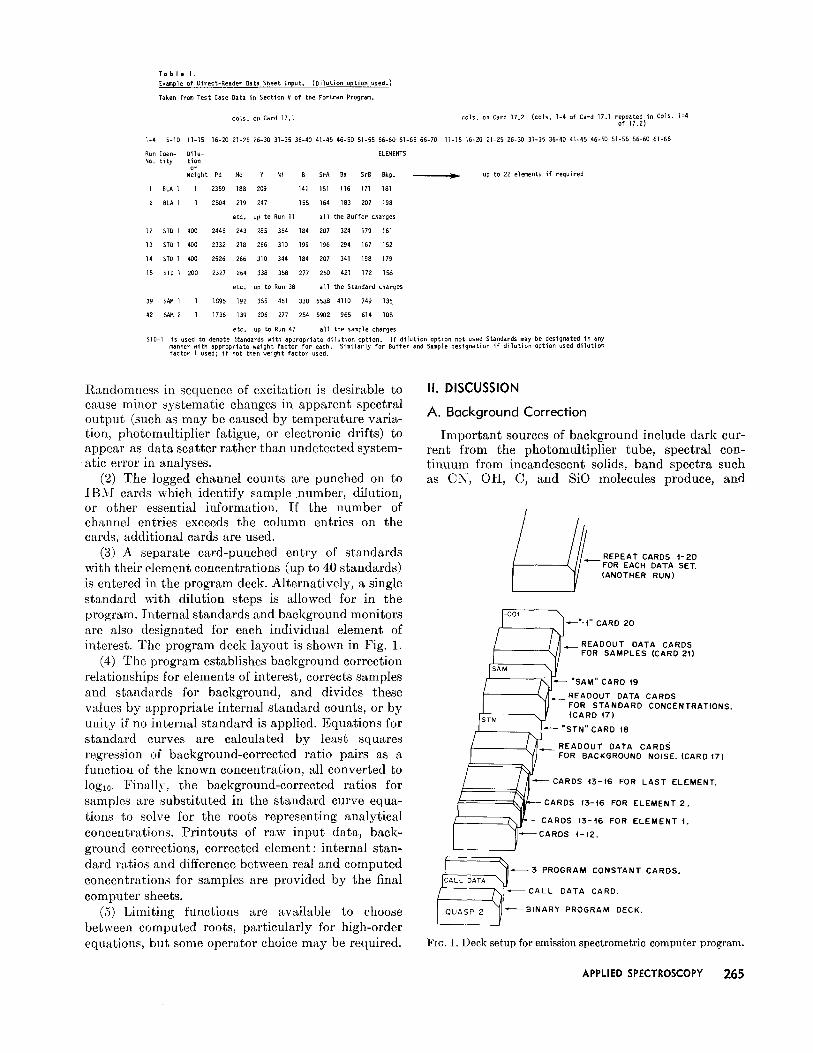
(3) A separate card-punched entry of standards with their element concentrations (up to 40 standards) is entered in the program deck. Alternatively, a single standard with dilution steps is allowed for in the program. Internal standards and background monitors are also designated for each individual element of interest. The program deck layout is shown in Fig. 1.
(4) The program establishes background correction relationships for elements of interest, corrects samples and standards for background, and divides these values by appropriate internal standard counts, or by unity if no internal standard is applied. Equations for standard curves are calculated by least squares regression of background-corrected ratio pairs as a function of the known concentration, all converted to log~0. Finally, the background-corrected ratios for samples are substituted in the standard curve equa- tions to soh, e for the roots representing analytical concentrations. Printouts of raw input data, back- ground corrections, corrected element: internal stan- dard ratios and difference between real and computed concentrations for samples are provided by the final computer sheets.
(5) Limiting functions are available to choose between computed roots, particularly for high-order equations, but some operator choice may be required.
II. DISCUSSION
A. Background Correction
Important sources of background include dark cur- rent from the photomultiplier tube, spectral con- tinuum from incandescent solids, band spectra such as CN, OH, C, and SiO molecules produce, and
/ I REPEAT CARDS t-20 SET.
l_oo,
I SAM
(
~"-4" CARD 20
READOUT DATA CARDS FOR SAMPLES (CARD 21)
"SAM" CARD t9 READOUT DATA CARDS ;g2RS;;,DARD CONCENTRAT,ONS.
I STN ~ J ~ "STN" CARD t8
I { ~ R E A D O U T DATA CARDS FOR BACKGROOND NO,SE (CARD,7)
--CAROS FOR LAST ELEMENT. f'N/
- - aN , - - -CARDS 15-16 FOR ELEMENT 2 .
] ~ - ~ C A R D S 15-.16 FOR ELEMENT I .
I V ~c 5 PROGRAM CONSTANT CARDS.
ALL DATA
I CALL DATA CARD.
QUASP 2 BINARY PROGRAM DECK.
FiG. 1. Deck setup for emission spectrometric computer program.
APPLIED SPECTROSCOPY 265
o o _z
o
o o c N
0 0 0
0
3 4 8 t I N T E N S I T Y 2 3 8 8 ~NTENSITY
o
o o
o
% o o
o o
3 4 S t I N T E N S I T Y 2 3 8 8 N T E N S i T Y
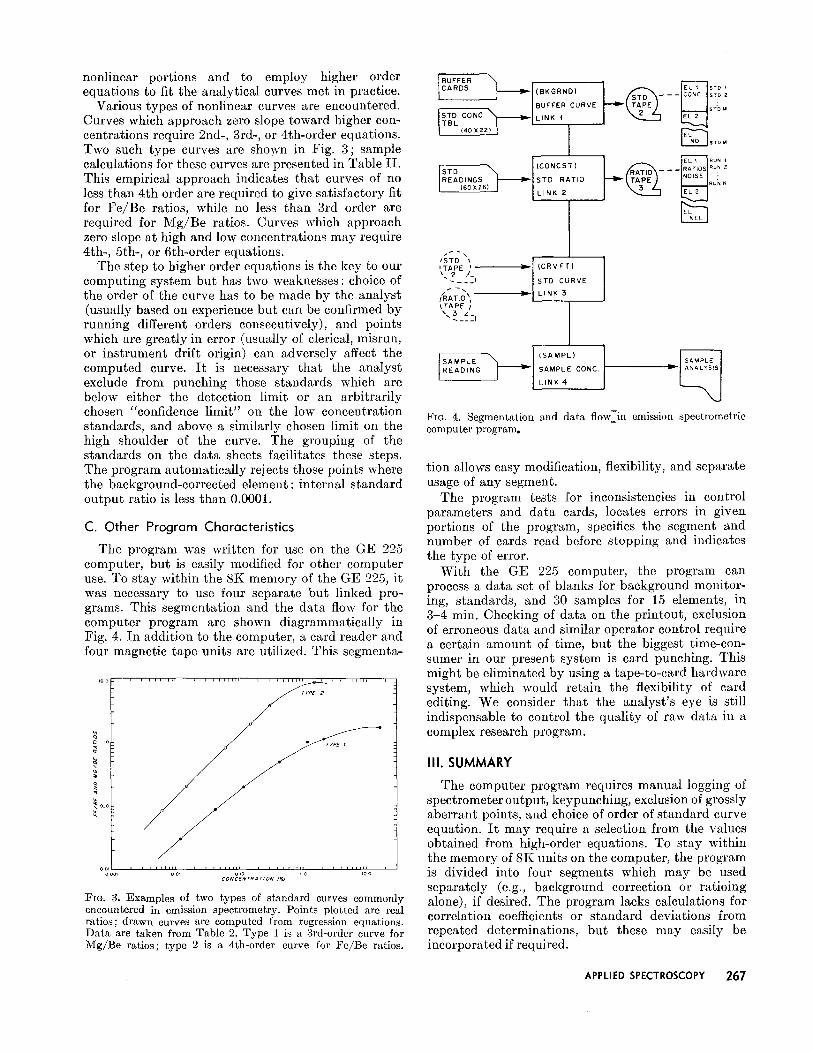
Fro. 2. Relationship between background at Zr 2139 and Cd 2288 wavelength positions and background at 3481 and 2388 wave- length positions.
internal reflections from such forms of spectral emis- sion. Dark current for a given photomultiplier tube is relatively constant, but spectral background is vari- able throughout the spectral range and cannot be measured simultaneously at given line positions of elements of interest during an excitation of sample or standard.
In the absence of being able to measure background directly on either side of each chosen line, we have chosen to measure background by establishing the relationship between background at the line position of the elements of interest and background at other wavelengths (background monitors). To do this, we have employed "blanks," i.e., charges of matrices similar to the samples and standards actually involved bu t lacking the elements of interest. For major
• element analysis, where the matrix itself is to be analyzed, we employ a preliminary li thium borate fusion at 1000°C to convert both samples and stan- dards to a homogeneous li thium glass, and subse- quent ly excite in pellet form with a high voltage ac spark. Successful background correction has been achieved if blanks using one of several types of pure matr ix material, such as CaC03, Si02, or Fe20~ show no systematic deviations in background ratio. Should specific influences be found, they must be removed by usual techniques, e.g., addition of buffering com- pounds or greater dilutions. Apar t from specifically chosen spectral positions as background monitors, line positions of elements, which are below detection under the given conditions and free from other interferences, may be used.
Choice of background correction position is facili- ta ted by matching spectral regions (particularly where band spectra may interfere), grating order, choice of filtering media in f ront of exit slits, and proport ion of
dark current to total background. Photomultipliers sensitive to infrared lines such a K 7600 and Rb 7800 display very high dark currents at room temperatures. Nevertheless, we have been able to determine K in solution to 0.0002%, and Rb to 10 ppm in solids even though background may have been 5 to l0 times as high as signal. Constancy of dark current and good background correcting monitors are the key to such corrections. I t is possible, with this computer program, to check background at the wavelength of each element of interest against a number of background monitoring positions and to select tha t position showing the best relationship. Figure 2 illustrates variat ion in background relationships between differ- ent wavelength positions.
Background correction is useful even if the relation- ship between wavelength positions is poor and does not appear to offer much improvement of analytical precision. Occasional "ex t reme" backgrounds (low or high) are brought into reasonable analytical ranges, whereas wi thout such correction these excitations might produce unusually large error. Further , straight- ening the analytical curve by removal of background permits the slope in an accurately established par t of the curve to assist in determining the curve near the lower limit of detection where statistical scat ter is greater. Curve fitting by the computer is also made more accurate thereby. To maintain flexibility, the program also offers the options of no correction, or of constant background correction, determined by averaging a series of blank excitations.
B. Analytical Curves
Straight-line segments of curves apply only to limited concentrat ion ranges. Although under ideal conditions only straight-line segments of curves would be utilized, it has proved impractical to limit ourselves to such ranges in view of the large number of elements and wide range of concentrations encompassed by our research programs. Thus, we have chosen to utilize
Table II. Standard curve input data and computed output ratios for different order curves.
Output Input Fe/Be 1st order 2nd order 3rd order 4th order
nonlinear portions and to employ higher order equations to fit the analytical curves met in practice.
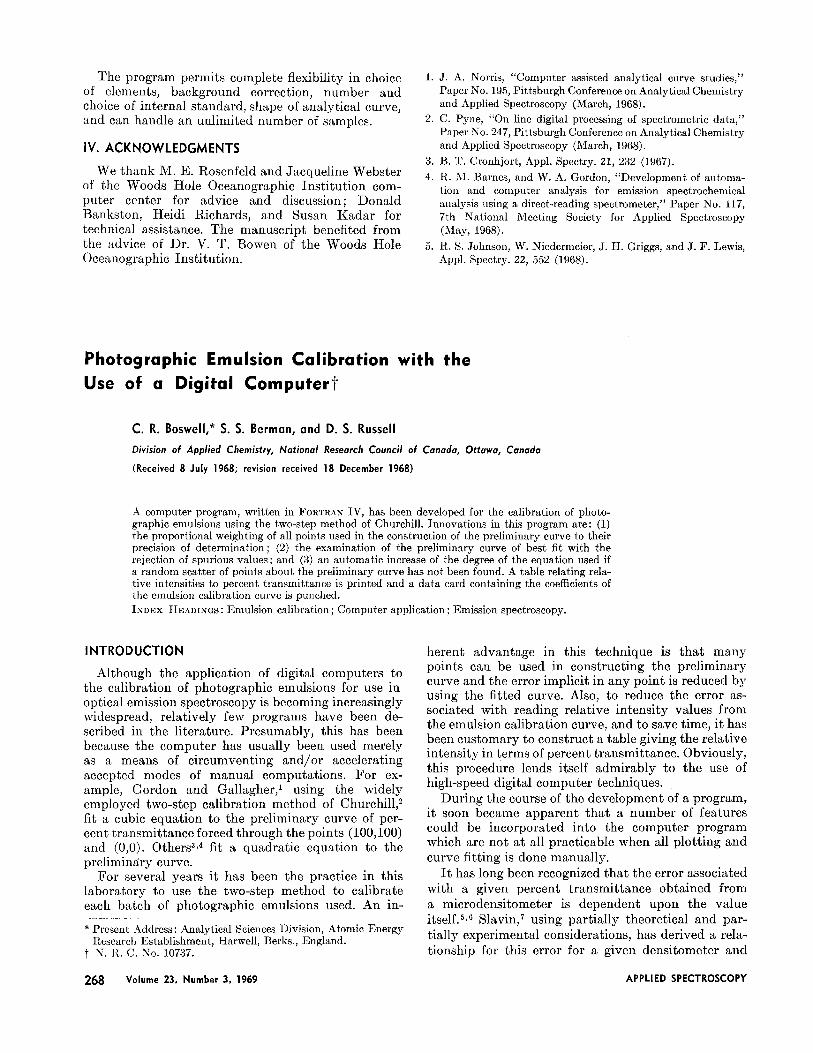
Various types of nonlinear curves are encountered. Curves which approach zero slope toward higher con- centrations require 2nd-, 3rd-, or 4th-order equations. Two such type curves are shown in Fig. 3; sample calculations for these curves are presented in Table II . This empirical approach indicates tha t curves of no less than 4th order are required to give satisfactory fit for F e / B e ratios, while no less than 3rd order are required for Mg /Be ratios. Curves which approach zero slope at high and low concentrations may require 4th-, 5th-, or 6th-order equations.
The step to higher order equations is the key to our computing system but has two weaknesses: choice of the order of the curve has to be made by the analyst (usually based on experience but can be confirmed by running different orders consecutively), and points which are greatly in error (usually of clerical, misrun, or ins t rument drift origin) can adversely affect the computed curve. I t is necessary tha t the analyst exclude from punching those standards which are below either the detection limit or an arbitrari ly chosen "confidence l imit" on the low concentrat ion standards, and above a similarly chosen limit on the high shoulder of the curve. The grouping of the standards on the data sheets facilitates these steps. The program automatical ly rejects those points where the background-corrected element: internal s tandard output ratio is less than 0.0001.
C. Other Program Characteristics
The program was writ ten for use on the GE 225 computer, but is easily modified for other computer use. To stay within the 8K memory of the GE 225, it was necessary to use four separate bu t linked pro- grams. This segmentation and the data flow for the computer program are shown diagrammatically in Fig. 4. In addition to the computer, a card reader and four magnetic tape units are utilized. This segmenta-
m o , , , , l , , , i , i L i i l l l , L i i ~ , ~ , , , . . _ . . e _ L * , l l , , i h i
TYPE 2
\
~olo
o ooi o m o io , o w o CONCENTR,4 T/ON (Y~J
Fro. 3. Examples of two types of standard curves commonly encountered in emission spectrometry. Points plotted are real ratios; drawn curves are computed from regression equations. Data are taken from Table 2. Type 1 is a 3rd-order curve for Mg/Be ratios; type 2 is a 4th-order curve for Fe/Be ratios.
I ~ 'R~S" ~ - - - - p . l (BK GRND )
ISUFPER CURVE T B L ~ I .~ ILINK t
(CONCST)
STD RATIO LINK 2
- - - STD 2 STiD
I ~ S TO Ill
RUN Z
RU~ N
/STD x ITAPE i ~ (CRV FT) "~2 Z-
. . . . i STD CURVE /~ ~,, ~ LINK 3 /RATIO
~TAPE / I . . . . I
R E A D I N G ~ (SAMPL) SAMPLE CONC. LINK 4
.FIG. 4. Segmentation and data flow:in emission spectrometric computer program.
tion allows easy modification, flexibility, and separate usage of any segment.
The program tests for inconsistencies in control parameters and data cards, locates errors in given portions of the program, specifies the segment and number of cards read before stopping and indicates the type of error.
With the GE 225 computer, the program can process a data set of blanks for background monitor- ing, standards, and 30 samples for 15 elements, in 3-4 min. Checking of data on the printout , exclusion of erroneous data and similar operator control require a certain amount of time, but the biggest t ime-con- sumer in our present system is card punching. This might be eliminated by using a tape-to-card hardware system, which would retain the flexibility of card editing. We consider tha t the analyst 's eye is still indispensable to control the qual i ty of raw data in a complex research program.
III. SUMMARY
The computer program requires manual logging of spectrometer output , keypunching, exclusion of grossly aberrant points, and choice of order of s tandard curve equation. I t may require a selection from the values obtained from high-order equations. To s tay within the memory of 8K units on the computer, the program is divided into four segments which may be used separately (e.g., background correction or ratioing alone), if desired. The program lacks calculations for correlation coefficients or s tandard deviations from repeated determinations, but these may easily be incorporated if required.
APPLIED SPECTROSCOPY 267
The program permits complete flexibility in choice of elements, background correction, number and choice of internal standard, shape of analytical curve, and can handle an unlimited number of samples.
IV. A C K N O W L E D G M E N T S
We thank M. E. Rosenfeld and Jacqueline Webster of the Woods Hole Oceanographic Inst i tut ion com- puter center for advice and discussion; Donald Bankston, Heidi Richards, and Susan Kadar for technical assistance. The manuscript benefited from the advice of Dr. V. T. Bowen of the Woods Hole Oceanographic Insti tution.
1. J. A. Norris, "Computer assisted analytical curve studies," Paper No. 195, Pittsburgh Conference on Analytical Chemistry and Applied Spectroscopy (March, 1968).
2. C. Pyne, "On line digital processing of spectrometric data," Paper No. 247, Pittsburgh Conference on Analytical Chemistlw and Applied Spectroscopy (March, 1968).
3. B. T. Cronhjort, Appl. Spectry. 21, 232 (1967). 4. R. 5[. Barnes, and W. A. Gordon, "Development of automa-
tion and computer analysis for emission spectrochemical analysis using a direct-reading spectrometer," Paper No. 117, 7th National Meeting Society for Applied Spectroscopy (May, 1968).
5. R. S. Johnson, W. Niedermeier, J. H. Griggs, and J. F. Lewis, Appl. Spectry. 22, 552 (1968).
Photographic Emulsion Calibration with the Use of a Digital Computert
C. R. Boswell,* S. S. Berman, and D. S. Russell
Division of Applied Chemistry, National Research Council of Canada, Ottawa, Canada
(Received 8 July 1968; revision received 18 December 1968)
A computer program, written in FORTRAN IV, has been developed for the calibration of photo- graphic emulsions using the two-step method of Churchill. Innovations in this program are: (1) the proportional weighting of all points used in the construction of the preliminary curve to their precision of determination; (2) the examination of the preliminary curve of best fit with the rejection of spurious values; and (3) an automatic increase of the degree of the equation used if a random scatter of points about the preliminary curve has not been found. A table relating rela- tive intensities to percent transmittance is printed and a data card containing the coefficients of the emulsion calibration curve is punched. INDEX HEADINGS: Emulsion calibration; Computer application; Emission spectroscopy.
I N T R O D U C T I O N
Although the application of digital computers to the calibration of photographic emulsions for use in optical emission spectroscopy is becoming increasingly widespread, relatively few programs have been de- scribed in the literature. Presumably, this has been because the computer has usually been used merely as a means of circumventing and /o r accelerating accepted modes of manual computations. For ex- ample, Gordon and Gallagher, 1 using the widely employed two-step calibration method of Churchill, ~ fit a cubic equation to the preliminary curve of per- cent t ransmit tance forced through the points (100,100) and (0,0). Others 3,4 fit a quadratic equation to the preliminary curve.
For several years it has been the practice in this laboratory to use the two-step method to calibrate each batch of photographic emulsions used. An in-
* Present Address : Analytical Sciences Division, Atomic Energy Research Establishment, Harwell, Berks., England. N. R. C. No. 10737.
herent advantage in this technique is tha t many points can be used in constructing the preliminary curve and the error implicit in any point is reduced by using the fitted curve. Also, to reduce the error as- sociated with reading relative intensity values from the emulsion calibration curve, and to save time, it has been customary to construct a table giving the relative intensity in terms of percent transmittance. Obviously, this procedure lends itself admirably to the use of high-speed digital computer techniques.
During the course of the development of a program, it soon became apparent tha t a number of features could be incorporated into the computer program which are not at all practicable when all plotting and curve fitting is done manually.
I t has long been recognized tha t the error associated with a given percent t ransmit tance obtained from a microdensitometer is dependent upon the value itself. 5,6 Slavin, 7 using partially theoretical and par- tially experimental considerations, has derived a rela- tionship for this error for a given densitometer and
268 Volume 23, Number 3, 1969 APPLIED SPECTROSCOPY