DOI https://doi.org/10.18690/978-961-286-385-9.39 ISBN 978-961-286-385-9 A FOLLOW-UP ON THE CHANGES IN THE USE INTENTION OF DIGITAL WELLNESS TECHNOLOGIES AND ITS ANTECEDENTS OVER TIME: THE USE OF PHYSICAL ACTIVITY LOGGER APPLICATIONS AMONG YOUNG ELDERLY IN FINLAND Keywords: digital wellness technologies, physical activity logger applications, young elderly, follow-up, UTAUT2, partial least squares MARKUS MAKKONEN, 1,2 TUOMAS KARI 1,2 & LAURI FRANK 3 1 Institute for Advanced Management Systems Research, Turku, Finland; e-mail: [email protected], [email protected]2 University of Jyvaskyla, Jyvaskyla, Finland; e-mail: [email protected], [email protected]3 University of Jyvaskyla, Faculty of Information Technology, Jyvaskyla, Finland; e-mail: [email protected]Abstract This study aims to further promote the understanding of the antecedents of the acceptance and use of digital wellness technologies among elderly people through a follow-up to our two prior studies, one which examines the potential longer-term temporal changes in the use intention of digital wellness technologies and its antecedents in the case of the young elderly segment and physical activity logger applications. We base this examination theoretically on UTAUT2 and empirically on survey data that is collected from 92 Finnish young elderly users of a physical activity logger application in three subsequent time points and analysed with partial least squares structural equation modelling (PLS-SEM). We find that the initial strong decline in the scores of the antecedent constructs and use intention becomes weaker as the construct scores stabilise over time, whereas especially the effects of performance expectancy and effort expectancy on use intention remain relatively unstable.
Transcript
DOI https://doi.org/10.18690/978-961-286-385-9.39 ISBN 978-961-286-385-9
A FOLLOW-UP ON THE CHANGES IN THE USE
INTENTION OF DIGITAL WELLNESS
TECHNOLOGIES AND ITS ANTECEDENTS OVER
TIME: THE USE OF PHYSICAL ACTIVITY
LOGGER APPLICATIONS AMONG YOUNG
ELDERLY IN FINLAND
Keywords: digital wellness technologies, physical activity logger applications, young elderly, follow-up, UTAUT2, partial least squares
MARKUS MAKKONEN,1,2 TUOMAS KARI1,2 & LAURI FRANK3
1 Institute for Advanced Management Systems Research, Turku, Finland; e-mail: [email protected], [email protected] 2 University of Jyvaskyla, Jyvaskyla, Finland; e-mail: [email protected], [email protected] 3 University of Jyvaskyla, Faculty of Information Technology, Jyvaskyla, Finland; e-mail: [email protected] Abstract This study aims to further promote the understanding of the antecedents of the acceptance and use of digital wellness technologies among elderly people through a follow-up to our two prior studies, one which examines the potential longer-term temporal changes in the use intention of digital wellness technologies and its antecedents in the case of the young elderly segment and physical activity logger applications. We base this examination theoretically on UTAUT2 and empirically on survey data that is collected from 92 Finnish young elderly users of a physical activity logger application in three subsequent time points and analysed with partial least squares structural equation modelling (PLS-SEM). We find that the initial strong decline in the scores of the antecedent constructs and use intention becomes weaker as the construct scores stabilise over time, whereas especially the effects of performance expectancy and effort expectancy on use intention remain relatively unstable.
552 34TH BLED ECONFERENCE DIGITAL SUPPORT FROM CRISIS TO PROGRESSIVE CHANGE
1 Introduction Physical inactivity has become an increasingly prevalent problem among elderly people (Sun, Norman & While, 2013), thus raising a call for new and innovative ways to promote their levels of physical activity. One potential way to do this are different types of digital wellness technologies, such as smartphone and smartwatch applications, which have been found very promising in terms of promoting the levels of physical activity not only among young but also among elderly people (e.g., McGarrigle & Todd, 2020). In addition to elderly people in general, their potential has been highlighted especially in the more specific segment of young elderly, which consists of people aged approximately 60–75 years (e.g., Carlsson & Walden, 2016). However, there is a lack of prior studies that have examined the antecedents of the acceptance and use of digital wellness technologies among elderly people, particularly from a longitudinal perspective of how their use evolves after the initial acceptance. These kinds of longitudinal studies can be considered highly important in the context of digital wellness technologies because, as it is suggested in theories like the lived informatics model of personal informatics (Epstein, Ping, Fogarty & Munson, 2015), the use of these technologies, especially those aimed at self-tracking, is often characterised by “lapses” in their use. This suggests that the intention to use the technologies and its antecedents do not remain constant but change over time. However, in prior information systems (IS) literature, such temporal changes have not been studied from the perspective of technology acceptance and use. The objective of this study is to address this gap in prior research by studying how the use intention of digital wellness technologies and its antecedents among elderly people potentially change over time. We examine this research question in the case of the young elderly segment and one common type of digital wellness technology: physical activity logger applications. By physical activity logger applications, we refer to mobile applications that enable users to keep track of their physical activities in everyday life as well as view different types of reports about them. As the theoretical foundation for conceptualising the antecedents of the intention to use physical activity logger applications and formulating the research model for examining the potential temporal changes in use intention and its antecedents, we use UTAUT2 by Venkatesh, Thong, and Xu (2012), which is one of the most comprehensive and established IS theories for explaining technology acceptance and use in consumer contexts, such as the one of this study. In turn, as the empirical data for the
M. Makkonen, T. Kari & L. Frank: A Follow-Up on the Changes in the Use Intention of Digital Wellness Technologies and Its Antecedents Over Time: The Use of Physical Activity Logger Applications Among Young Elderly in Finland
553
examination, we use survey data that is collected from 92 Finnish young elderly users of a physical activity logger application in three subsequent time points and analysed with partial least squares structural equation modelling (PLS-SEM). The study was conducted as part of our broader DigitalWells research program, which focuses on young elderly in Finland and in which the participants are provided for free both a physical activity logger application to keep track of their daily physical activities as well as the training and support for setting up and using it. The study is a follow-up to our two prior studies (Makkonen, Kari & Frank, 2020, 2021), in which we initially proposed and tested our research model for explaining the acceptance and use of digital wellness technologies in the case of young elderly and physical activity logger applications as well as examined the potential changes in use intention and its antecedents between about four months and about 12 months of use. Here, this time span is extended to about 18 months, thus enabling the examination of even longer-term changes. After this introductory section, we describe in more detail the research model and the research methodology of the study in Sections 2 and 3. This is followed by reporting of the research results in Section 4. The results are discussed in more detail in Section 5 before concluding the paper with a brief discussion about the limitations of the study and some potential paths of future research in Section 6.
2 Research Model As already mentioned above, the research model of the study is based on UTAUT2 by Venkatesh et al. (2012), which is an extension of the unified theory of acceptance and use of technology (UTAUT) by Venkatesh, Morris, Davis, and Davis (2003) from organisational to consumer contexts. UTAUT2 has been applied to explain technology acceptance and use in numerous IS contexts, including also the context of mobile health and fitness applications and devices (e.g., Yuan, Ma, Kanthawala & Peng, 2015; Duarte & Pinho, 2019; Talukder, Chiong, Bao & Malik, 2019; Dhiman, Arora, Dogra & Gupta, 2020; Beh, Ganesan, Iranmanesh & Foroughi, 2021) and the context of elderly users (e.g., Macedo, 2017). However, none of these prior studies have combined the two contexts by examining, for example, the acceptance and use of physical activity logger applications among young elderly, as it is done in this study. In UTAUT2, the behavioural intention (BI) to use a particular technology is
554 34TH BLED ECONFERENCE DIGITAL SUPPORT FROM CRISIS TO PROGRESSIVE CHANGE
hypothesised to be positively affected by seven antecedents (Venkatesh et al., 2012): performance expectancy (PE – i.e., the degree to which using a technology will provide benefits to consumers in performing certain activities), effort expectancy (EE – i.e., the degree of ease associated with consumers’ use of technology), social influence (SI – i.e., the extent to which consumers perceive that important others believe they should use a particular technology), facilitating conditions (FC – i.e., consumers’ perceptions of the resources and support available to perform a behaviour), hedonic motivation (HM – i.e., the fun or pleasure derived from using a technology), price value (PV – i.e., the consumers’ cognitive trade-off between the perceived benefits of the technology and the monetary cost for using it), and habit (HT – i.e., the extent to which people tend to perform behaviours automatically because of learning). In addition, UTAUT2 hypothesises three moderators for the effects of these seven antecedents on use intention: age, gender, and experience. However, due to the limited sample size of this study, these moderators are omitted from the research model. In addition, we omit two of the seven antecedents: facilitating conditions and price value. These were considered irrelevant in the present study because the application was free for all the participants and they all had the same resource requirements for taking part in the research program (e.g., owning a smartphone on which the application can be installed) as well as were given the same training and support for setting up and using the application, thus assumably resulting in very low variance in their perceptions of these issues. Finally, as in many studies on technology acceptance and use, the research model also concentrates on explaining only use intention and not actual use behaviour (UB). The final research model of the study, with the omitted constructs and effects presented as dashed, is illustrated in Figure 1.
M. Makkonen, T. Kari & L. Frank: A Follow-Up on the Changes in the Use Intention of Digital Wellness Technologies and Its Antecedents Over Time: The Use of Physical Activity Logger Applications Among Young Elderly in Finland
555
Figure 1: Research model (the dashed constructs and effects are omitted in this study)
3 Methodology The data for the study was collected from the participants of our research program in three subsequent surveys. These were conducted in autumn 2019 after about four months of using the application, in summer 2020 after about 12 months of using the application, and in winter 2021 after about 18 months of using the application. In the remainder of this paper, these three time points, respectively, are referred to as T1, T2, and T3. The first survey was administered as a pen-and-paper survey in face-to-face group meetings with the participants, whereas the second and third survey were both administered as online surveys due to the ongoing COVID-19 pandemic. Because Finland has two official languages, the participants had the option to respond to the surveys in either Finnish or Swedish. In the surveys, each construct of the research model was measured reflectively by three indicators. All the indicators were adapted from the study by Venkatesh et al. (2012) and their wordings in English are reported in Table 1. The measurement scale was a seven-point Likert scale ranging from one (strongly disagree) to seven (strongly agree). Because we wanted to avoid forced responses, the participants also had the option not to respond to a particular item, which resulted in a missing value.
556 34TH BLED ECONFERENCE DIGITAL SUPPORT FROM CRISIS TO PROGRESSIVE CHANGE
Table 1: Indicator wordings Indicator Wording PE1 I find the app useful in achieving my daily exercise goals. PE2 Using the app helps me achieve my exercise goals more quickly. PE3 Using the app increases my efficiency in achieving my exercise goals. EE1 Learning how to use the app to achieve my exercise goals is easy for me. EE2 I find using the app to achieve my exercise goals easy. EE3 It is easy for me to become skilful at using the app to achieve my exercise goals. SI1 People who are important to me think that I should use the app to achieve my
exercise goals. SI2 People who influence my behaviour think that I should use the app to achieve
my exercise goals. SI3 People whose opinions I value prefer that I use the app to achieve my exercise
goals. HM1 Using the app to achieve my exercise goals is fun. HM2 Using the app to achieve my exercise goals is enjoyable. HM3 Using the app to achieve my exercise goals is entertaining. HT1 The use of the app to achieve my exercise goals has become a habit for me. HT2 I am addicted to using the app to achieve my exercise goals. HT3 I must use the app to achieve my exercise goals. BI1 I intend to continue using the app to achieve my exercise goals. BI2 I will always try to use the app to achieve my exercise goals. BI3 I plan to use the app regularly to achieve my exercise goals.
Due to the limited sample size of this study, the collected data was analysed with variance-based structural equation modelling (VB-SEM), more specifically partial least squares structural equation modelling (PLS-SEM). As a statistical software for PLS-SEM, we used SmartPLS 3.3.3 by Ringle, Wende, and Becker (2015). We also followed carefully the previously published guidelines for conducting PLS-SEM in IS research given by Hair, Hollingsworth, Randolph, and Chong (2017). For example, in accordance with the given guidelines, we used mode A as the indicator weighting mode of the constructs, path weighting as the weighting scheme, +1 as the initial weights, and < 10-7 as the stop criterion in model estimation, whereas the statistical significance of the model estimates was tested by using bootstrapping with 5,000 subsamples. As the threshold for statistical significance, we used p < 0.05. The potential missing values were handled by using mean replacement.
M. Makkonen, T. Kari & L. Frank: A Follow-Up on the Changes in the Use Intention of Digital Wellness Technologies and Its Antecedents Over Time: The Use of Physical Activity Logger Applications Among Young Elderly in Finland
557
The estimated model consisted of three submodels, which were otherwise identical and formulated based on the research model illustrated in Figure 1, but which were estimated by using the data collected at T1, T2, and T3, respectively. The three submodels were also connected by so-called carry-over effects (cf. Roemer, 2016), which were used to examine how the scores of a specific construct at a previous time point (i.e., T1 or T2) affect the scores of that same construct at a subsequent time point (i.e., T2 or T3). After estimating the model and evaluating the reliability and validity of its three submodels at both construct and indicator levels, the potential changes in the estimated construct scores and effect sizes from T1 to T2 and from T2 to T3 were examined. This examination followed the procedure proposed by Roemer (2016) for evolution models with panel data (also referred to as model type A.1 in her paper). First, the statistical significance of the changes in the means of the estimated unstandardised construct scores from T1 to T2 and from T2 to T3 were tested by using the parametric Student’s paired samples t-test. Its results were additionally confirmed by using the nonparametric Wilcoxon (1945) signed-rank test if the compared means were not found to be normally distributed as suggested by the Shapiro-Wilk (1965) test. Second, the estimated size of each effect at a previous time point (i.e., T1 or T2) was compared against the 95% bias-corrected and accelerated (BCa) confidence interval (cf. Hair, Hult, Ringle & Sarstedt, 2017) of the estimated size of that same effect at a subsequent time point (i.e., T2 or T3). If the estimate at the previous time point did not fall within the confidence interval of the estimate at the subsequent time point, then the change in the effect size could be considered statistically significant.
4 Results In total, 115 participants provided valid responses to the survey at T1, of which 99 participants did so also at T2 (a drop-out rate of 13.9%), and of which 92 participants did so also at T3 (a drop-out rate of 7.1%). The descriptive statistics of these three samples in terms of the gender, age, and response language of the participants as well as a subjective assessment of their level of physical activity are reported in Table 2. As can be seen, the drop-outs did not result in any considerable changes in the sample profiles. As the sample for this particular study, we used the last-mentioned sample of 92 participants who had provided valid responses to the survey at all the three time points. Of them, about two-thirds were women and over nine out of ten
558 34TH BLED ECONFERENCE DIGITAL SUPPORT FROM CRISIS TO PROGRESSIVE CHANGE
assessed their level of physical activity as moderate or higher. Their age ranged from 49 to 79 years, with a mean of 69.1 years and a standard deviation of 4.7 years. Although some of the participants were slightly younger or older than our target young elderly segment consisting of people aged approximately 60–75 years, we decided not to omit these people from the study due to our limited sample size.
Age Under 60 years 3 2.6 2 2.0 2 2.2 60–64 years 11 9.6 10 10.1 8 8.7 65–69 years 44 38.3 39 39.4 38 41.3 70–74 years 39 33.9 35 35.4 32 34.8 75 years or over 18 15.7 13 13.1 12 13.0
Language Finnish 69 60.0 63 63.6 60 65.2 Swedish 46 40.0 36 36.4 32 34.8
Level of physical activity Very high 1 0.9 1 1.0 1 1.1 High 18 15.7 16 16.2 15 16.3 Moderate 84 73.0 73 73.7 68 73.9 Low 4 3.5 3 3.0 3 3.3 Very low 8 7.0 6 6.1 5 5.4 Totally passive 0 0.0 0 0.0 0 0.0
4.1 Model Estimation The estimation results of the three submodels in terms of the standardised size and statistical significance of the effects of the antecedent constructs on use intention at T1, T2, and T3 are reported in Table 3. As the reported values show, at all the three time points, the effects of hedonic motivation and habit were found to be positive and statistically significant, whereas the effect of social influence was found to be statistically not significant. In contrast, performance expectancy was found to have a positive and statistically significant effect at T1 and T3, but a statistically not significant effect at T2, whereas effort expectancy was found to have a positive and statistically significant effect at T2, but a statistically not significant effect at T1 and
M. Makkonen, T. Kari & L. Frank: A Follow-Up on the Changes in the Use Intention of Digital Wellness Technologies and Its Antecedents Over Time: The Use of Physical Activity Logger Applications Among Young Elderly in Finland
559
T3. In terms of explanatory power, the proportion of explained variance (R2) in use intention was 72.7% at T1, 77.3% at T2 and 83.2% at T3.
Table 3: Effects on use intention (*** = p < 0.001, ** = p < 0.01, * = p < 0.05)
T1 T2 T3 Size 95% CI Size 95% CI Size 95% CI
PE → BI 0.348** [0.140, 0.567] 0.091 [-0.129, 0.324] 0.337** [0.143, 0.565] EE → BI 0.064 [-0.092, 0.225] 0.324*** [0.177, 0.493] 0.077 [-0.083, 0.278] SI → BI 0.025 [-0.109, 0.146] 0.091 [-0.041, 0.207] -0.047 [-0.202, 0.078] HM → BI 0.247** [0.069, 0.420] 0.243** [0.085, 0.399] 0.267* [0.019, 0.519] HT → BI 0.308** [0.102, 0.509] 0.272* [0.069, 0.497] 0.227** [0.060, 0.382]
Table 4: Carry-over effects (*** = p < 0.001, ** = p < 0.01, * = p < 0.05)
T1 → T2 T2 → T3 Size R2 by T1 at T2 Size R2 by T2 at T3
PE → PE 0.453*** 0.205 0.707*** 0.500 EE → EE 0.295* 0.087 0.624*** 0.389 SI → SI 0.534*** 0.285 0.600*** 0.360 HM → HM 0.466*** 0.217 0.801*** 0.641 HT → HT 0.466*** 0.217 0.763*** 0.582 BI → BI 0.107* 0.045 0.146 0.110
In turn, Table 4 reports the standardised size and statistical significance of the carry-over effects between the constructs of the three submodels as well as the proportion of explained variance (R2) in the scores of a specific construct at a subsequent time point by the scores of that same construct at a previous time point. As the reported values show, all the carry-over effects except for the one concerning use intention between T2 and T3 were found to be statistically significant. All the carry-over effects also seemed to be considerably stronger between T2 and T3 in comparison to T1 and T2, meaning that the construct scores provided by the participants became more stable over time. The only slight exceptions to this were the carry-over effects concerning social influence and use intention, which remained approximately equally strong between T1 and T2 as well as T2 and T3.
560 34TH BLED ECONFERENCE DIGITAL SUPPORT FROM CRISIS TO PROGRESSIVE CHANGE
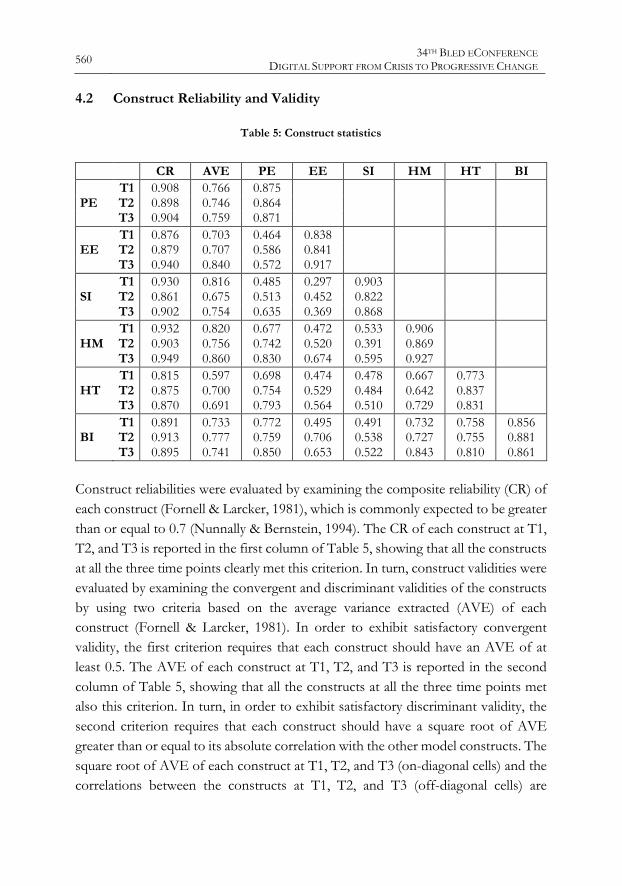
4.2 Construct Reliability and Validity
Table 5: Construct statistics CR AVE PE EE SI HM HT BI T1 0.908 0.766 0.875 PE T2 0.898 0.746 0.864 T3 0.904 0.759 0.871 T1 0.876 0.703 0.464 0.838 EE T2 0.879 0.707 0.586 0.841 T3 0.940 0.840 0.572 0.917 T1 0.930 0.816 0.485 0.297 0.903 SI T2 0.861 0.675 0.513 0.452 0.822 T3 0.902 0.754 0.635 0.369 0.868 T1 0.932 0.820 0.677 0.472 0.533 0.906 HM T2 0.903 0.756 0.742 0.520 0.391 0.869 T3 0.949 0.860 0.830 0.674 0.595 0.927 T1 0.815 0.597 0.698 0.474 0.478 0.667 0.773 HT T2 0.875 0.700 0.754 0.529 0.484 0.642 0.837 T3 0.870 0.691 0.793 0.564 0.510 0.729 0.831 T1 0.891 0.733 0.772 0.495 0.491 0.732 0.758 0.856 BI T2 0.913 0.777 0.759 0.706 0.538 0.727 0.755 0.881 T3 0.895 0.741 0.850 0.653 0.522 0.843 0.810 0.861
Construct reliabilities were evaluated by examining the composite reliability (CR) of each construct (Fornell & Larcker, 1981), which is commonly expected to be greater than or equal to 0.7 (Nunnally & Bernstein, 1994). The CR of each construct at T1, T2, and T3 is reported in the first column of Table 5, showing that all the constructs at all the three time points clearly met this criterion. In turn, construct validities were evaluated by examining the convergent and discriminant validities of the constructs by using two criteria based on the average variance extracted (AVE) of each construct (Fornell & Larcker, 1981). In order to exhibit satisfactory convergent validity, the first criterion requires that each construct should have an AVE of at least 0.5. The AVE of each construct at T1, T2, and T3 is reported in the second column of Table 5, showing that all the constructs at all the three time points met also this criterion. In turn, in order to exhibit satisfactory discriminant validity, the second criterion requires that each construct should have a square root of AVE greater than or equal to its absolute correlation with the other model constructs. The square root of AVE of each construct at T1, T2, and T3 (on-diagonal cells) and the correlations between the constructs at T1, T2, and T3 (off-diagonal cells) are
M. Makkonen, T. Kari & L. Frank: A Follow-Up on the Changes in the Use Intention of Digital Wellness Technologies and Its Antecedents Over Time: The Use of Physical Activity Logger Applications Among Young Elderly in Finland
561
reported in the remaining columns of Table 5, showing that also this criterion was met by all the constructs at all the three time points. 4.3 Indicator Reliability and Validity
Table 6: Indicator statistics (*** = all loadings have p < 0.001)
T1 T2 T3 Mean SD NA λ*** Mean SD NA λ*** Mean SD NA λ***
Indicator reliabilities and validities were evaluated by using the standardised loading (λ) of each indicator, which are reported at T1, T2, and T3 in Table 6 together with the mean and standard deviation (SD) of the indicator scores as well as the percentage of missing values (NA). In the typical case where each indicator loads on only one construct, its standardised loading is commonly expected to be statistically significant and greater than or equal to 0.707 (Fornell & Larcker, 1981). As the reported values show, all the indicators at all the three time points met this criterion.
562 34TH BLED ECONFERENCE DIGITAL SUPPORT FROM CRISIS TO PROGRESSIVE CHANGE
4.4 Changes in Construct Scores
Table 7: Construct scores and the changes in construct scores
T1 T2 T3 ΔT1→T2 ΔT2→T3 Mean SD Mean SD Mean SD Mean SD Mean SD
In terms of the changes in construct scores, Table 7 reports the means and standard deviations (SD) of the estimated unstandardised construct scores at T1, T2, and T3 as well as the means and standard deviations (SD) of the changes in them from T1 to T2 and from T2 to T3. As can be seen, the participants had relatively high scores in the case of all the constructs at all the three time points, but the scores seemed to decline over time, more drastically from T1 to T2 and less drastically from T2 to T3. The statistical significance of these changes was tested by using both parametric and nonparametric testing because most of the compared construct mean scores were not found to be normally distributed. The results of these tests are reported in Table 8, showing that from T1 to T2, the changes in the construct mean scores were found to be statistically significant in the case of all the antecedent constructs except potentially for performance expectancy, in the case of which the statistical significance of the change suggested by parametric testing could not be confirmed
M. Makkonen, T. Kari & L. Frank: A Follow-Up on the Changes in the Use Intention of Digital Wellness Technologies and Its Antecedents Over Time: The Use of Physical Activity Logger Applications Among Young Elderly in Finland
563
by nonparametric testing. In contrast, from T2 to T3, the changes in the construct mean scores were found to be statistically significant only in the case of habit. 4.5 Changes in Effect Sizes In terms of the changes in effect sizes, Table 3 additionally reports the 95% confidence interval (CI) of the estimated size of each effect at T1, T2, and T3. As can be seen, the estimated size of the effects of performance expectancy and effort expectancy at T1 and T2, respectively, did not fall within the 95% CI of the estimated size of the same effects at T2 and T3, respectively, thus suggesting that the changes in the size of these effects from T1 to T2 and from T2 to T3 were statistically significant. More specifically, the effect of performance expectancy seemed to become weaker from T1 to T2 and stronger from T2 to T3, whereas the effect of effort expectancy seemed to become stronger from T1 to T2 and weaker from T2 to T3. In addition, the estimated size of the effect of social influence at T2 did not fall within the 95% CI of the estimated size of the same effect at T3, but this effect remained statistically not significant at both these two time points.
5 Discussion and Conclusions In this study, we examined the potential longer-term temporal changes in the use intention of digital wellness technologies and its antecedents in the case of the young elderly segment and physical activity logger applications. In comparison to our two prior studies (Makkonen et al., 2020, 2021), we made three main findings. First, we found that our research model continued to perform very well in explaining use intention also after about 18 months of using the application by being able to explain about 83% of its variance at T3 as well as having acceptable reliability and validity at both construct and indicator levels. Thus, it seems to be well suited also for longitudinal study settings in which the time span extends well beyond one year. Second, we found that the strong decline in the scores of the antecedent constructs and use intention from T1 to T2 became weaker in the case of most of the constructs from T2 to T3, which was also supported by the finding concerning the stabilisation of the construct scores over time. The only exception to this was habit, the scores of which continued to decline about as strongly between T2 and T3 as between T1 and T2, although its scores also became more stable over time. This initially strong but then increasingly weaker decline in the construct scores is most likely explained
564 34TH BLED ECONFERENCE DIGITAL SUPPORT FROM CRISIS TO PROGRESSIVE CHANGE
by a novelty effect that causes a particular digital wellness technology to be first perceived very favourably by its potential users but these perceptions to converge towards realism as the use progresses, first more quickly, as also the hype concerning the technology is higher, but then more slowly. Third, we found that the effects of social influence, hedonic motivation, and habit on use intention continued to remain very stable between T2 and T3, as they did also between T1 and T2, whereas more instability could be observed in the effects of performance expectancy and effort expectancy. That is, whereas the effect of performance expectancy become weaker and the effect of effort expectancy stronger from T1 to T2, these changes were now reversed, with the effect of performance expectancy once again becoming stronger and the effect of effort expectancy weaker. What is actually causing this instability, as well as whether it is driven more by internal changes in the users themselves or external changes in their environment, requires more in-depth examinations. However, all in all, the aforementioned temporal changes in both the effects of the antecedent constructs on use intention and the scores of the antecedent constructs themselves would seem to provide some much-needed theoretical explanations for the “lapses” in the use of personal informatics or self-tracking technologies, such as physical activity logger applications, which have been suggested in theories like the lived informatics model of personal informatics (Epstein et al., 2015). In turn, from a more practical perspective, the findings of the study highlight the need for the providers of various digital wellness technology products and services to actively adapt their offerings to the aforementioned temporal changes as well as to continuously promote the novelty of their offerings through approaches like gamification (e.g., Kari, Piippo, Frank, Makkonen & Moilanen, 2016) and exergaming (e.g., Kari, 2014; Kari & Makkonen, 2014) in order to prevent the perceptions of the users from becoming less favourable as the initial novelty effect fades out.
6 Limitations and Future Research Like our two prior studies, this study can be considered to have three main limitations. First, the study focused on the specific case of physical activity logger applications and the Finnish young elderly segment, which is why future studies are called for to examine the generalisability of its findings to other types of digital wellness technologies and to the elderly population in general. Second, the research setting of the study does not fully correspond to the real-life market environment in
M. Makkonen, T. Kari & L. Frank: A Follow-Up on the Changes in the Use Intention of Digital Wellness Technologies and Its Antecedents Over Time: The Use of Physical Activity Logger Applications Among Young Elderly in Finland
565
which consumers make decisions on technology acceptance and use. For example, the participants were provided for free both the application as well as the training and support for setting up and using it, without which factors like facilitating conditions and price value may also have played an important role as antecedents of use intention. Third, there were some participants who left the research program already before T1 or between T1 and T2 or T2 and T3, and, thus, had to be omitted from the study. Some of them may have been individuals who would have reported very low scores in terms of use intention and its antecedents and whose omission, consequently, may have introduced some bias in the data. In future studies, we aim to address these aforementioned limitations and to augment the preliminary results of this study by refining our research model as well as collecting data from more participants and over a longer period of time as our research program progresses. References Beh, P. K., Ganesan, Y., Iranmanesh, M., & Foroughi, B. (2021). Using smartwatches for fitness and
health monitoring: The UTAUT2 combined with threat appraisal as moderators. Behaviour & Information Technology, 40(3), 282–299. doi:10.1080/0144929X.2019.1685597
Carlsson, C., & Walden, P. (2016). Digital wellness services for young elderly – A missed opportunity for mobile services. Journal of Theoretical and Applied Electronic Commerce Research, 11(3), 20–34. doi:10.4067/S0718-18762016000300003
Dhiman, N., Arora, N., Dogra, N., & Gupta, A. (2020). Consumer adoption of smartphone fitness apps: An extended UTAUT2 perspective. Journal of Indian Business Research, 12(3), 363–388. doi:10.1108/JIBR-05-2018-0158
Duarte, P., & Pinho, J. C. (2019). A mixed methods UTAUT2-based approach to assess mobile health adoption. Journal of Business Research, 102, 140–150. doi:10.1016/j.jbusres.2019.05.022
Epstein, D. A., Ping, A., Fogarty, J., & Munson, S. A. (2015). A lived informatics model of personal informatics. In Proceedings of the 2015 ACM International Joint Conference on Pervasive and Ubiquitous Computing (pp. 731–742). New York, NY: ACM. doi:10.1145/2750858.2804250
Fornell, C., & Larcker, D. F. (1981). Evaluating structural equation models with unobservable variables and measurement error. Journal of Marketing Research, 18(1), 39–50. doi:10.2307/3151312
Hair, J., Hollingsworth, C. L., Randolph, A. B., & Chong, A. Y. L. (2017). An updated and expanded assessment of PLS-SEM in information systems research. Industrial Management & Data Systems, 117(3), 442–458. doi:10.1108/IMDS-04-2016-0130
Hair, J. F., Jr., Hult, G. T. M., Ringle, C. M., & Sarstedt, M. (2017). A Primer on Partial Least Squares Structural Equation Modeling (PLS-SEM) (2nd ed.). Thousand Oaks, CA: Sage.
Kari, T. (2014). Can exergaming promote physical fitness and physical activity: A systematic review of systematic reviews. International Journal of Gaming and Computer-Mediated Simulations, 6(4), 59–77. doi:10.4018/ijgcms.2014100105
Kari, T., & Makkonen, M. (2014). Explaining the usage intentions of exergames. In B. Tan, E. Karahanna & A. Srinivasan (Eds.), Proceedings of the 35th International Conference on Information Systems. Atlanta, GA: Association for Information Systems.
Kari, T., Piippo, J., Frank, L., Makkonen, M., & Moilanen, P. (2016). To gamify or not to gamify? Gamification in exercise applications and its role in impacting exercise motivation. In J.
566 34TH BLED ECONFERENCE DIGITAL SUPPORT FROM CRISIS TO PROGRESSIVE CHANGE
Versendaal, C. Kittl, A. Pucihar & M. Kljajić Borštnar (Eds.), Proceedings of the 29th Bled eConference (pp. 393–405). Kranj, Slovenia: Moderna organizacija.
Macedo, I. M. (2017). Predicting the acceptance and use of information and communication technology by older adults: An empirical examination of the revised UTAUT2. Computers in Human Behavior, 75, 935–948. doi:10.1016/j.chb.2017.06.013
Makkonen, M., Kari, T., & Frank, L. (2020). Applying UTAUT2 to explain the use of physical activity logger applications among young elderly. In A. Pucihar, M. Kljajić Borštnar, R. Bons, H. Cripps, A. Sheombar & D. Vidmar (Eds.), Proceedings of the 33rd Bled eConference (pp. 567–582). Maribor, Slovenia: University of Maribor Press.
Makkonen, M., Kari, T., & Frank, L. (2021). Changes in the use intention of digital wellness technologies and its antecedents over time: The use of physical activity logger applications among young elderly in Finland. In Proceedings of the 54th Hawaii International Conference on System Sciences (pp. 1202–1211). Honolulu, HI: University of Hawai’i at Mānoa. doi:10.24251/HICSS.2021.147
McGarrigle, L., & Todd, C. (2020). Promotion of physical activity in older people using mHealth and eHealth technologies: Rapid review of reviews. Journal of Medical Internet Research, 22(12), article e22201. doi:10.2196/22201
Nunnally, J. C., & Bernstein, I. H. (1994). Psychometric Theory (3rd ed.). New York, NY: McGraw-Hill.
Ringle, C. M., Wende, S., & Becker, J.-M. (2015). SmartPLS 3. Bönningstedt, Germany: SmartPLS GmbH. Retrieved from https://www.smartpls.com
Roemer, E. (2016). A tutorial on the use of PLS path modeling in longitudinal studies. Industrial Management & Data Systems, 116(9), 1901–1921. doi:10.1108/IMDS-07-2015-0317
Shapiro, S. S., & Wilk, M. B. (1965). An analysis of variance test for normality (complete samples). Biometrika, 52(3–4), 591–611. doi:10.2307/2333709
Sun, F., Norman, I. J., & While, A. E. (2013). Physical activity in older people: A systematic review. BMC Public Health, 13, article 449. doi:10.1186/1471-2458-13-449
Talukder, M. S., Chiong, R., Bao, Y., & Malik, B. H. (2019). Acceptance and use predictors of fitness wearable technology and intention to recommend: An empirical study. Industrial Management & Data Systems, 119(1), 170–188. doi:10.1108/IMDS-01-2018-0009
Venkatesh, V., Morris, M. G., Davis, G. B., & Davis, F. D. (2003). User acceptance of information technology: Toward a unified view. MIS Quarterly, 27(3), 425–478. doi:10.2307/30036540
Venkatesh, V., Thong, J. Y. L., & Xu, X. (2012). Consumer acceptance and use of information technology: Extending the unified theory of acceptance and use of technology. MIS Quarterly, 36(1), 157–178. doi:10.2307/41410412
Wilcoxon, F. (1945). Individual comparisons by ranking methods. Biometrics Bulletin, 1(6), 80–83. doi:10.2307/3001968
Yuan, S., Ma, W., Kanthawala, S., & Peng, W. (2015). Keep using my health apps: Discover users’ perception of health and fitness apps with the UTAUT2 model. Telemedicine and e-Health, 21(9), 735–741. doi:10.1089/tmj.2014.0148