Page 1
1
A Lifestyle Segmentation Study of US Food Shoppers to
Examine Organic and Local Food Consumption
Cong Nie and Lydia Zepeda
Professor Lydia Zepeda: [email protected] tel: 1-608-262-9487
Cong Nie, M.S.: [email protected]
University of Wisconsin-Madison
Department of Consumer Science
1305 Linden Dr.
Madison, WI 53706 USA
Acknowledgements:
This project was supported by the National Research Initiative of the Cooperative State
Research, Education and Extension Service, USDA, Grant #2002–01772 and is
gratefully acknowledged. The authors would like to thank all those who participated in
the survey.
Page 2
2
A Lifestyle Segmentation Study of US Food Shoppers to
Examine Organic and Local Food Consumption
Survey data of US food shoppers are used to test whether consumer segments interested
in sustainable food consumption also have more environmental concerns, knowledge
and practices than other food shopper segments. Segmentation is also used to examine
correlations with health concerns and practices, and demographic characteristics.
Key words: local food, market segmentation, organic food
Page 3
3
Introduction
One of the fastest growing food trends today is the consumption of sustainable
food; buying organic and local foods are dominant and growing. According to USDA
(Shaffer & Cox, 2008) statistics, as of 2008, there were 4,685 farmers' markets across
50 states, showing a 150% growth from 1994. The volume of organic food business is
even larger: $23 billion dollars were spent on organic food in 2008 (Organic Trade
Association, 2008). This is about 3% of total US food consumption. NPD Group (2009)
forecasts that the organic food market is likely to grow 40% in the next decade.
The popularity of sustainable foods reflects more than meeting basic needs; it is
an expression of identity and worldviews (Senauer, 2001). In other words, we are
consuming the values that food provides. Food values are expressed throughout the
entire food consumption process: purchase, preparation, consumption and clean-up. For
sustainable foods, naturalness and healthiness are the two main associated values (Lusk
& Briggeman, 2009).
Consumer segmentation is useful to understand the attitudes and motivations of
specific consumers rather than learning how an “average” consumer thinks and behaves.
This paper segments food consumers based on their lifestyle, which is a mixture of
habits, conventional ways of doing things and reasoned behavior. There are several
advantages of lifestyle segmentation; compared to demographic segmentation, it reflects
consumers’ psychological profiles, such as values and attitudes, so that the motivation
of a behavior can be captured (Demby, 1974). Unlike product-specific attitudes or
preference, lifestyle is concerned with more general and more observable characteristics
of consumers, which helps practitioners develop communication strategies (Wells,
1975).
The food-related lifestyle (FRL) model proposed by Grunert, Brunsø and Bisp
(1993) is adapted to the data available for this study to classify consumers into different
market segments. According to FRL, there are five components of lifestyle, which can
be used to explain food purchase categories: ways of shopping, product attributes, meal
preparation, usage situation, and desired consequences. Analysis of food-related
lifestyle segmentation provides insights regarding who are current and potential
sustainable food shoppers, and what motivates them to shop for such food products. It is
also important to understand each consumer segment’s socioeconomic and demographic
Page 4
4
profiles to select appropriate media to access the target population. The segments are
used to test whether consumer segments showing more interests in sustainable food
consumption have more environmental concerns, knowledge, and practices than non-
sustainable food shoppers. Food-related lifestyle choices are also used to test whether
they are associated with health concerns and practices. Specifically, this study will
address the following research questions using US survey data:
1. Can food-related lifestyle factors distinguish American households into identifiable
consumer groups? What are the characteristics of each lifestyle group?
2. Are sustainable food consumption behaviors different among lifestyle groups?
3. Are food choices related to consumers’ health practices?
4. Are food choices related to consumers’ environmental concerns, knowledge and
behaviors?
5. Which socioeconomic and demographic factors are associated with a particular
consumer segments?
Conceptual Model
Following theories of sociological models (e.g. Attitude-Behavior-Context
theory, Guagnano, Stern, & Dietz, 1995) it is hypothesized that both personal and
contextual factors can explain different food-related lifestyle choices. Personal factors
include environment-related determinants, as well as health-related determinants. Both
factors are chosen because of our interest in understanding their roles in forming one’s
food-related lifestyle (FRL). More specifically, we want to examine whether high
ecological (Kollmuss & Agyeman, 2002) and health-related (Baker, Thompson, &
Engelken, 2004) concerns are associated with certain lifestyles that value organic and
local food consumption. Contextual factors include socioeconomic and demographic
variables, as well as community characteristics.
“Organic” is one of the food attributes specified in the FRL model (Grunert et
al., 1993). Although “shop local” is not a consideration in the original FRL survey
instrument to classify food consumers’ lifestyle choices, several subsequent FRL studies
(e.g., Laaksonen, Laaksonen & Leipämaa, 2005) indicate the “shop local” factor to be
an important supplement to FRL. The dominant sources of local food in the US are
from Community Supported Agriculture (CSA), farmers’ markets, farm stands, and
Page 5
5
local food co-operatives. Based on the FRL literature discussed above, we hypothesize
that consumer segments that are more likely to purchase sustainable food, similar to the
“adventurous” and ”rational” consumer segments commonly found in FRL literature,
have one or more of the following characteristics: they seek special consequences out of
meals (desired consequences); they value health, nutrition, and freshness, but not
necessarily cost (product attributes); they shop at specialty stores (ways of shopping);
and cook often (meal preparations). Likewise, consumers who are not involved in
sustainable consumption might be more price conscious and/or prepare meals less
frequently.
Data
Data from a 2003 nationwide food consumer survey (n= 956) are used in cluster
analysis to identify food-related lifestyle groups (See Zepeda & Li, 2006 and 2007 for a
full description of the data; see also Table 1 and Appendix 1 below for variable
descriptions). This is an important time period in the US because in October 2002, the
US Department of Agriculture (USDA) adopted a national organic standard in
production and labeling (USDA, 2003). Since then, retail availability of organic
products has expanded from natural food markets to conventional supermarkets. In
2006, the sales of organic food in conventional markets surpassed that in natural food
markets for the first time (Organic Trade Association, 2007). Meanwhile, local food
movements have grown in tandem with popular media promoting eating local food.
These events and trends make 2003 an important and interesting time point to observe
consumers’ food-related lifestyles.
Lifestyle segments are obtained from variables organized into four domains of
the FRL theoretical framework: ways of shopping, product attributes, meal preparation
and desired consequence (Grunert et al., 1993). "Usage situation" is excluded because
an empirical study (Nijmeijer, Worsley, & Astil, 2004) showed it was relatively less
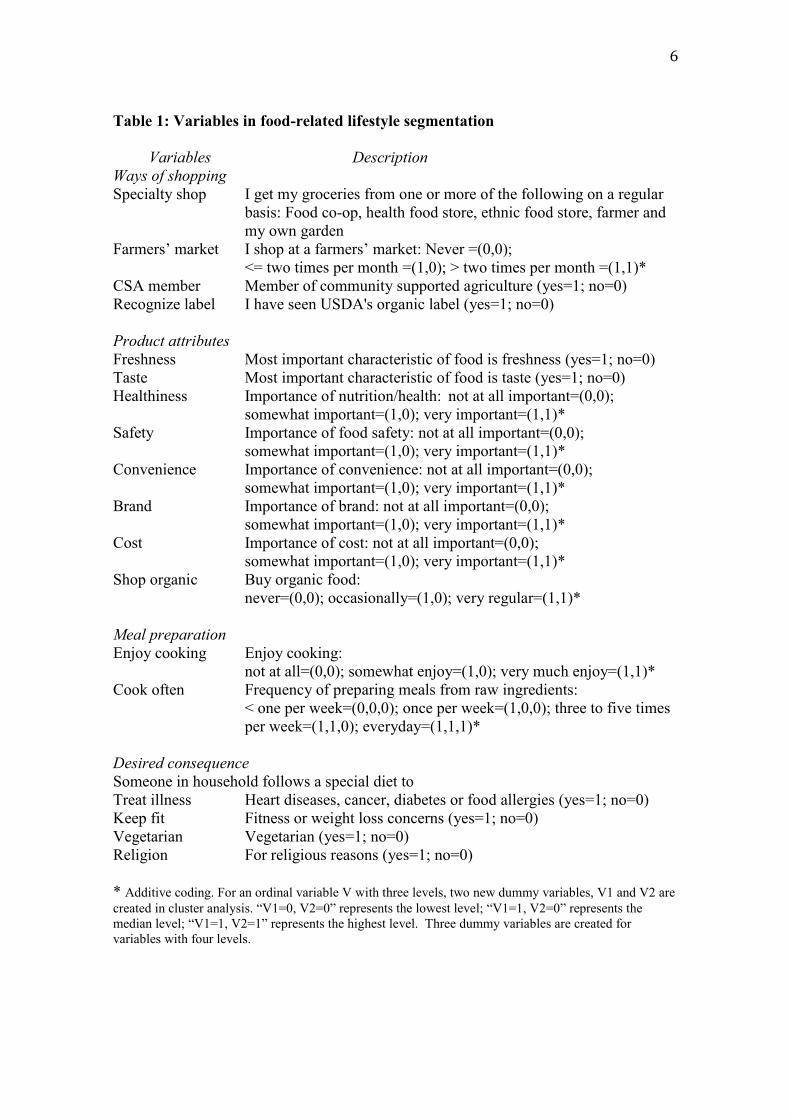
important in determining FRL, and these data are not available in our dataset. Table 1
contains the variables used to segment US food shoppers. Other variables in the survey
are listed in Appendix 1.
Page 6
6
Table 1: Variables in food-related lifestyle segmentation
Variables Description
Ways of shopping
Specialty shop I get my groceries from one or more of the following on a regular
basis: Food co-op, health food store, ethnic food store, farmer and
my own garden
Farmers’ market I shop at a farmers’ market: Never =(0,0);
<= two times per month =(1,0); > two times per month =(1,1)*
CSA member Member of community supported agriculture (yes=1; no=0)
Recognize label I have seen USDA's organic label (yes=1; no=0)
Product attributes
Freshness Most important characteristic of food is freshness (yes=1; no=0)
Taste Most important characteristic of food is taste (yes=1; no=0)
Healthiness Importance of nutrition/health: not at all important=(0,0);
somewhat important=(1,0); very important=(1,1)*
Safety Importance of food safety: not at all important=(0,0);
somewhat important=(1,0); very important=(1,1)*
Convenience Importance of convenience: not at all important=(0,0);
somewhat important=(1,0); very important=(1,1)*
Brand Importance of brand: not at all important=(0,0);
somewhat important=(1,0); very important=(1,1)*
Cost Importance of cost: not at all important=(0,0);
somewhat important=(1,0); very important=(1,1)*
Shop organic Buy organic food:
never=(0,0); occasionally=(1,0); very regular=(1,1)*
Meal preparation
Enjoy cooking Enjoy cooking:
not at all=(0,0); somewhat enjoy=(1,0); very much enjoy=(1,1)*
Cook often Frequency of preparing meals from raw ingredients:
< one per week=(0,0,0); once per week=(1,0,0); three to five times
per week=(1,1,0); everyday=(1,1,1)*
Desired consequence
Someone in household follows a special diet to
Treat illness Heart diseases, cancer, diabetes or food allergies (yes=1; no=0)
Keep fit Fitness or weight loss concerns (yes=1; no=0)
Vegetarian Vegetarian (yes=1; no=0)
Religion For religious reasons (yes=1; no=0)
* Additive coding. For an ordinal variable V with three levels, two new dummy variables, V1 and V2 are
created in cluster analysis. “V1=0, V2=0” represents the lowest level; “V1=1, V2=0” represents the
median level; “V1=1, V2=1” represents the highest level. Three dummy variables are created for
variables with four levels.
Page 7
7
Results
The clustering method used in this analysis is the “k-means” (Hartingan &
Wong, 1979), a popular iterative partitioning method. Four food-related lifestyle
clusters are found in our sample. Stability and reliability tests are conducted to validate
the optimal number of segments. The resulting four consumer segments are given the
names “practical consumer,” “food enthusiast,” “indifferent consumer” and
“convenience seeker.” We do not use the names commonly seen in FRL literature
because the clusters are not directly comparable given the differences in the survey
instruments used.
Table 2: Lifestyle profiles of the four clusters
Practical Food Indifferent Convenience Total
Consumer Enthusiast Consumer Seeker
29.23% 24.06% 17.85% 28.85% 100%
Ways of shopping
Specialty shop** 59.73% 82.80% 13.77% 30.04% 48.51%
Farmers’ market**
>2X/mo 18.14% 31.72% 5.80% 9.87% 16.82%
<2X/mo 65.93% 58.06% 34.06% 56.05% 55.50%
Never 15.93% 10.22% 60.14% 34.08% 27.68%
CSA member 1.33%a 2.69%
a 1.45%
a 2.24%
a 1.94%
Label Recog** 33.19% 51.61% 17.39%a 22.42%
a 31.69%
Product attributes
Freshness** 0.00%a 98.92%
b 0.00%
a 94.17%
b 50.97%
Taste** 96.46%a 0.00%
b 96.38%
a 0.00%
b 45.41%
Importance of Healthiness**
Very 81.86%aA
87.10%a 36.96% 73.09%
A 72.57%
Somewhat 16.37% 11.29% 55.07% 24.67% 24.45%
Not at all 1.77% 1.61% 7.97% 2.24% 2.98%
Importance of Safety**
Very 85.40%A 93.01%
a 65.22% 87.44%
Aa 84.22%
Somewhat 11.50% 4.30% 22.46% 8.97% 10.99%
Not at all 3.10% 2.69% 12.32% 3.59% 4.79%
Importance of Convenience**
Very 22.57%a 19.35%
a 44.93% 32.29% 28.59%
Somewhat 63.27% 61.30% 47.10% 60.98% 59.25%
Not at all 14.16% 19.35% 7.97% 6.73% 12.16%
Importance of Brand
Very 8.41%Aa
11.83%ab
11.59%Ab
13.45%b 11.25%
Somewhat 49.55% 51.61% 57.98% 55.16% 53.17%
Not at all 42.04% 36.56% 30.43% 31.39% 35.58%
Page 8
8
Importance of Cost
Very 52.21%a 47.31%
a 47.83%
a 52.47%
a 50.32%
Somewhat 43.37% 46.78% 43.47% 42.60% 43.99%
Not at all 4.42% 5.91% 8.70% 4.93% 5.69%
Shop organic**
Regularly 10.18% 16.13% 2.90%a 1.79%
a 7.89%
Occasional 55.75% 65.05% 28.98% 39.47% 48.51%
Never 34.07% 18.82% 68.12% 58.74% 43.60%
Meal preparation
Enjoy cooking**
Very much 54.42% 70.97% 13.77% 24.66% 42.56%
Somewhat 39.83% 24.73% 62.32% 62.34% 46.70%
Not at all 5.75% 4.30% 23.91% 13.00% 10.74%
Cooking**
Everyday 40.27% 54.30% 2.90% 9.87% 28.20%
3-5x/week 52.21% 40.32% 29.71% 53.36% 45.67%
1x/week 6.64% 4.84% 24.64% 19.28% 13.06%
<1x/week 0.88% 0.54% 42.75% 17.49% 13.07%
Desired consequences
Treat illness** 29.20% 50.54% 10.87%a 15.70%
a 27.17%
Keep fit** 32.30% 69.35% 15.22%a 17.94%
a 34.02%
Vegetarian** 1.77%ab
4.30%aA
0.72%bA
0.45%b 1.81%
Religion** 2.65%Aa
10.75% 0.00%Ab
2.24%ab
4.01%
Note: **The chi-square test shows the variable distribution is different across lifestyle segments,
significance level=0.05. When no subscript is present (such as farmers’ market), all four segments are
different pair-wise at 5% level. For categorical variables with several levels (such as farmers’ market,
healthiness), the subscript will only appear in the first row. When the same uppercase letter is present for
two segments, the segments are significantly different at 10% level but not 5% level. When the same
lowercase letter is present for two segments then their lifestyles are NOT significantly different in terms
of that factor. If the same lowercase letter appears in three or four of the segments (such as CSA
member), it means that no difference is found between each pair of the three or four segments.
We are able to conclude that each of the four consumer segments displays a
statistically different frequency in terms of farmers’ market shopping and organic food
shopping (Table 2). There is no statistical difference in terms of frequency of CSA
participation, in part because of the extremely low CSA membership across all
segments.
In terms of the segment names, “food enthusiasts” correspond roughly to
adventurous consumers; they visit farmers’ markets and buy organic food most
frequently. “Practical consumers” correspond roughly to rational consumers. They are
"practical" because while the taste and healthiness of food are very important to them,
so is cost, and they cook frequently. They are less likely than “food enthusiasts” but
Page 9
9
more likely than “indifferent consumers” and “convenience seekers” to buy sustainable
foods. Like “indifferent consumers,” “convenience seekers” are not active in organic
food shopping, however they shop at farmers’ markets more frequently than “indifferent
consumers.” “Indifferent consumers” are the least involved in any kind of sustainable
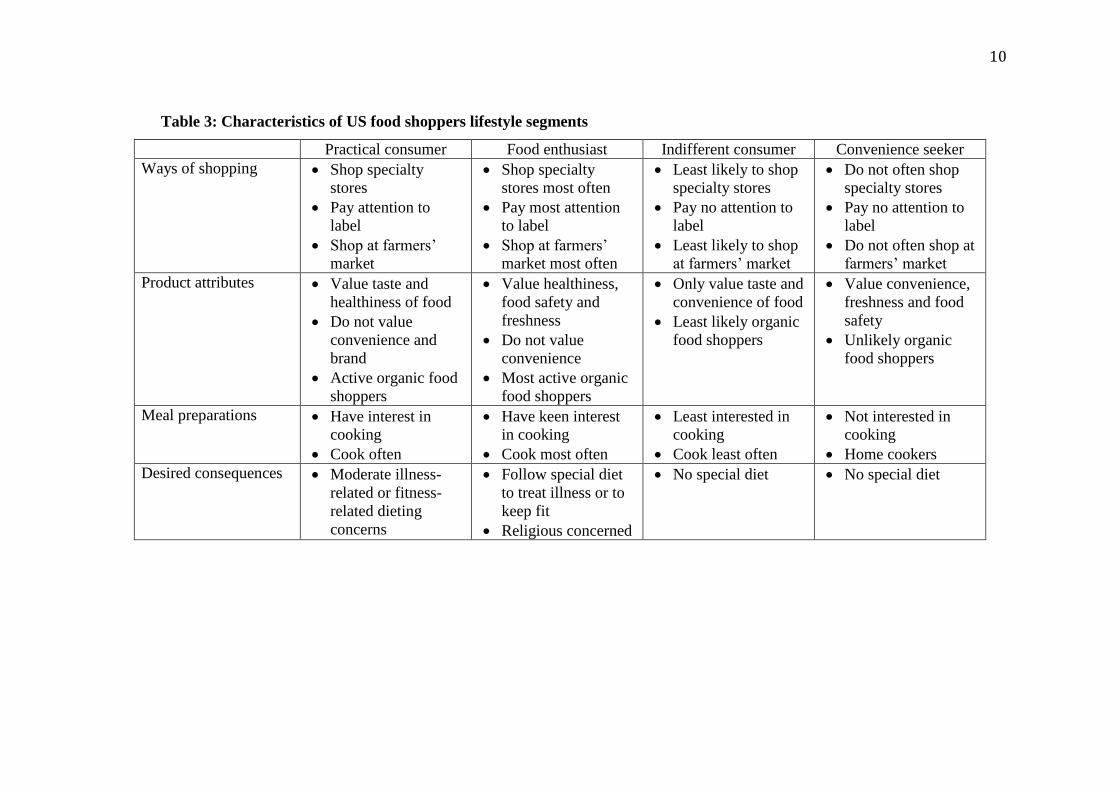
food shopping. The characteristics of US food shoppers lifestyle segments are
summarized in Table 3.
We also examine each segment’s demographic characteristics as well as their
health practices, environmental concerns, sustainable food knowledge and pro-
environmental behavior (Table 4). All four clusters show significant differences in age,
quintile of household income, race, gender, education and community characteristics.
Consumers with different lifestyles also have distinct expressions over three
environment-related factors and health practices.
“Practical consumers” are 29.23% of the population. Although there is no
significant difference between the four consumer segments in terms of cost and brand,
“practical consumers” consider brands and costs to be least important of the four
groups. “Practical consumers” highly value the taste of food products. Overall, they are
not as involved in food activities as “food enthusiasts,” but they are more concerned and
more active than “indifferent consumers” and “convenience seekers” in food shopping,
preparation and consumption.
They value the healthiness and safety of food but do not value convenience as
much as others do. 18% of them shop regularly at farmers’ markets. They are more
likely than average to buy organic food: 10% of them are regular organic food shoppers
and 56% of them are occasional organic food shoppers. “Practical consumers” like
cooking; more than 92% of them cook at least three times per week from raw
ingredients. 29% of “practical consumers” follow a special diet because of health
concerns, 32% of them follow a special diet because of weight loss or fitness concerns.
Regarding demographic characteristics, “practical consumers” are more likely
than average population to be middle-aged, white, be in the high-income quintile and
have more children living in the household. They are more likely than average to live in
the West and have access to a farmers’ market in the neighborhood.
Page 10
10
Table 3: Characteristics of US food shoppers lifestyle segments
Practical consumer Food enthusiast Indifferent consumer Convenience seeker
Ways of shopping Shop specialty
stores
Pay attention to
label
Shop at farmers’
market
Shop specialty
stores most often
Pay most attention
to label
Shop at farmers’
market most often
Least likely to shop
specialty stores
Pay no attention to
label
Least likely to shop
at farmers’ market
Do not often shop
specialty stores
Pay no attention to
label
Do not often shop at
farmers’ market
Product attributes Value taste and
healthiness of food
Do not value
convenience and
brand
Active organic food
shoppers
Value healthiness,
food safety and
freshness
Do not value
convenience
Most active organic
food shoppers
Only value taste and
convenience of food
Least likely organic
food shoppers
Value convenience,
freshness and food
safety
Unlikely organic
food shoppers
Meal preparations Have interest in
cooking
Cook often
Have keen interest
in cooking
Cook most often
Least interested in
cooking
Cook least often
Not interested in
cooking
Home cookers
Desired consequences Moderate illness-
related or fitness-
related dieting
concerns
Follow special diet
to treat illness or to
keep fit
Religious concerned
No special diet No special diet
Page 11
11
Regarding their health-related lifestyles, and above average (24%) of “practical
consumers” go to a fitness club. They are more knowledgeable than the average person
about alternative agriculture. A higher than average percent of them (8%) are actively
involved in environmental protection, even their concerns regarding environmental
issues are just about average.
“Practical consumers” are active sustainable food shoppers. It is possible that
their higher income makes higher-priced organic food more accessible to them. Going
to specialty shops and having a farmers’ market nearby can also increase their chance of
trying alternative food products.
“Food enthusiasts” are 24.06 % of the population and are enthusiastic about
shopping, preparing and consuming foods. 83% of these consumers visit specialty shops
on a regular basis, which is significantly higher than all three other consumer groups.
They visit farmers’ markets most frequently: 32% of “food enthusiasts” go there more
than twice per month. A relatively high percent of them (3%, as compared to an average
of 2%) are CSA members. “Food enthusiasts” pay the most attention to label
information.
“Food enthusiasts” are a group of consumers who highly value healthiness,
safety and freshness of foods. People who consider these three food characteristics to be
“very important” are 87%, 93% and 99%, respectively. In comparison, these
percentages of the whole sample are 73%, 84% and 51%, respectively. “Food
enthusiasts” tend to be the most frequent home cookers of all the four consumer groups.
54% of them cook at least once a day, while only 28% of the general population cook as
often. This finding is correlated with the fact that 81% of “food enthusiasts” do not
consider the convenience of food to be very important. Most “food enthusiasts” (71%)
enjoy cooking very much.
“Food enthusiasts” have keen interest in shopping for organic food. 16% of them
are regular organic shoppers and 65% of them shop for organic food occasionally. One
of most distinguishable difference between “food enthusiasts” and others is, a much
higher percentage of these people following a special diet, either because of health
concerns (51%), fitness or weight loss (69%), religions concerns (4%), or because they
are vegetarian (11%).
Page 12
12
Table 4: Demographic profiles by cluster
Practical Food Indifferent Convenience
Consumer Enthusiast Consumer Seeker Total
29.23% 24.06% 17.85% 28.85% 100%
Environment and Health Related
E-concerns** 2.70% 3.15% 2.03% 2.59% 2.66%
E-knowledge** 4.14%a 4.17%
a 3.99%
aA 3.70%
A 3.99%
E-friendly** 7.52%a 8.06%
a 5.80%
aA 2.24%
A 5.82%
Fitness club** 23.89%a 35.48% 22.46%
a 21.08%
a 25.61%
Family composition (No. of)
Adults 1.95ab
2.07aA
1.88b 1.91
bA 1.95
Children <5 yrs 0.29a 0.23
a 0.20
a 0.25
a 0.25
Children 6-17 yrs* 0.61AB
0.45Aa
0.43Ba
0.40a 0.48
Average Age 47.58a 47.60
a 47.70
a 48.57
a 47.89
Age composition**
Less than 25 2.21%a 5.38%
a 5.80%
ab 6.28%
b 4.79%
25-34 15.04% 12.90% 15.22% 20.63% 16.17%
35-44 27.88% 25.27% 24.64% 14.80% 22.90%
45-54 25.66% 27.96% 24.64% 21.08% 24.71%
55-64 16.37% 15.59% 11.59% 17.49% 15.65%
More than 65 12.83% 12.90% 18.12% 19.73% 15.78%
Female** 62.83%Aa
72.04%Ab
52.17% 68.16%ab
64.68%
Income**
< $15,000 8.85%a 6.45%
ab 8.70%
aA 12.56%
bA 9.31%
$15,000-$29,999 10.18% 18.28% 13.77% 21.52% 16.04%
$30,000-$44,999 17.70% 20.43% 14.49% 17.04% 17.59%
$45,000-$75,000 31.86% 26.34% 31.88% 28.25% 29.50%
>$75,000 31.42% 28.49% 31.16% 20.63% 27.55%
Education**
<High school 3.10%ABa
6.99%Ab
2.90%BCb
4.48%Ca
4.40%
High school 25.22% 19.35% 22.46% 29.15% 24.45%
Technical degree 8.85% 8.06% 9.42% 13.45% 10.09%
Some college 17.70% 19.35% 25.36% 19.73% 20.05%
4-year college 17.70% 25.81% 22.46% 15.70% 19.92%
Graduate school l6.19% 3.23% 0.72% 4.93% 4.14%
Graduate degree 21.24% 17.20% 16.67% 12.56% 16.95%
Race**
White 88.05%aA
74.19% 94.20%a 81.17%
A 83.83%
African American 3.54% 7.53% 4.35% 9.87% 6.47%
Hispanic 3.10% 8.60% 0.72% 4.93% 4.53%
Asian 1.33% 4.30% 0.00% 0.90% 1.68%
Native American 0.88% 0.54% 0.00% 1.35% 0.78%
Other 3.10% 4.84% 0.72% 1.79% 2.72%
Community characteristics
Northeast** 16.37%aA
20.43%a 18.84%
b 20.18%
Ab 18.89%
Midwest 26.55% 20.43% 37.68% 26.91% 27.17%
South 32.74% 31.72% 28.99% 38.12% 33.38%
Page 13
13
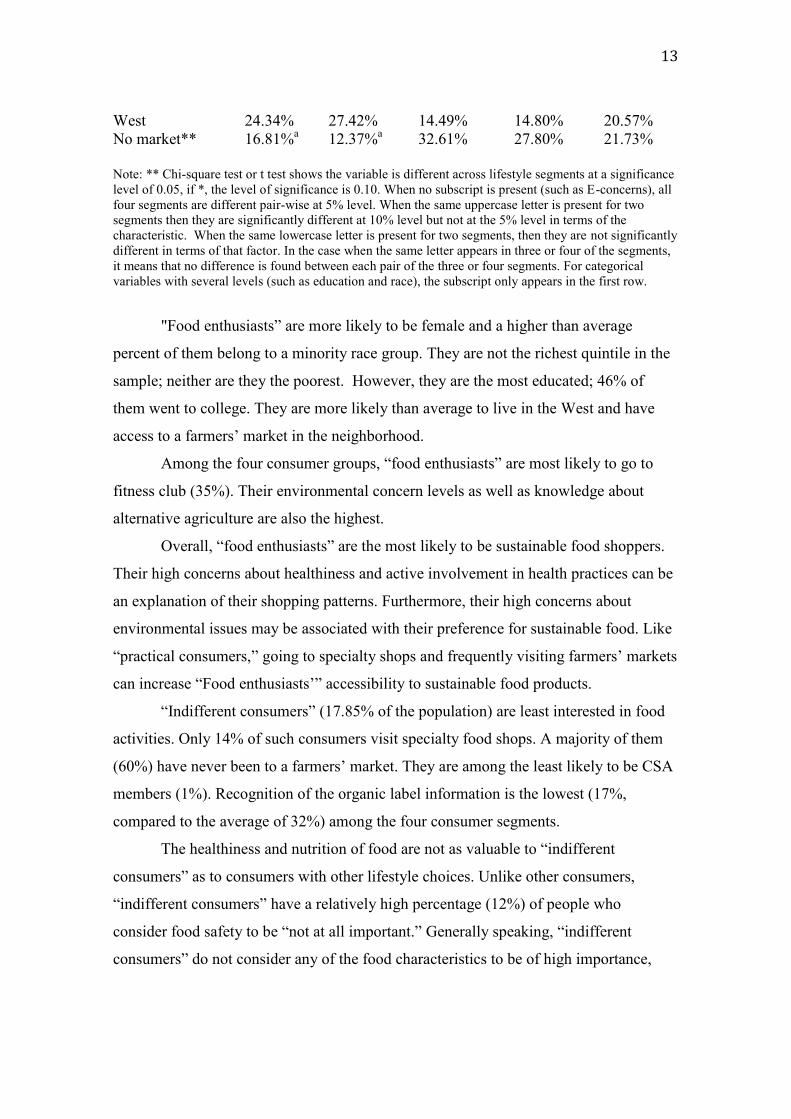
West 24.34% 27.42% 14.49% 14.80% 20.57%
No market** 16.81%a 12.37%
a 32.61% 27.80% 21.73%
Note: ** Chi-square test or t test shows the variable is different across lifestyle segments at a significance
level of 0.05, if *, the level of significance is 0.10. When no subscript is present (such as E-concerns), all
four segments are different pair-wise at 5% level. When the same uppercase letter is present for two
segments then they are significantly different at 10% level but not at the 5% level in terms of the
characteristic. When the same lowercase letter is present for two segments, then they are not significantly
different in terms of that factor. In the case when the same letter appears in three or four of the segments,
it means that no difference is found between each pair of the three or four segments. For categorical
variables with several levels (such as education and race), the subscript only appears in the first row.
"Food enthusiasts” are more likely to be female and a higher than average
percent of them belong to a minority race group. They are not the richest quintile in the
sample; neither are they the poorest. However, they are the most educated; 46% of
them went to college. They are more likely than average to live in the West and have
access to a farmers’ market in the neighborhood.
Among the four consumer groups, “food enthusiasts” are most likely to go to
fitness club (35%). Their environmental concern levels as well as knowledge about
alternative agriculture are also the highest.
Overall, “food enthusiasts” are the most likely to be sustainable food shoppers.
Their high concerns about healthiness and active involvement in health practices can be
an explanation of their shopping patterns. Furthermore, their high concerns about
environmental issues may be associated with their preference for sustainable food. Like
“practical consumers,” going to specialty shops and frequently visiting farmers’ markets
can increase “Food enthusiasts’” accessibility to sustainable food products.
“Indifferent consumers” (17.85% of the population) are least interested in food
activities. Only 14% of such consumers visit specialty food shops. A majority of them
(60%) have never been to a farmers’ market. They are among the least likely to be CSA
members (1%). Recognition of the organic label information is the lowest (17%,
compared to the average of 32%) among the four consumer segments.
The healthiness and nutrition of food are not as valuable to “indifferent
consumers” as to consumers with other lifestyle choices. Unlike other consumers,
“indifferent consumers” have a relatively high percentage (12%) of people who
consider food safety to be “not at all important.” Generally speaking, “indifferent
consumers” do not consider any of the food characteristics to be of high importance,
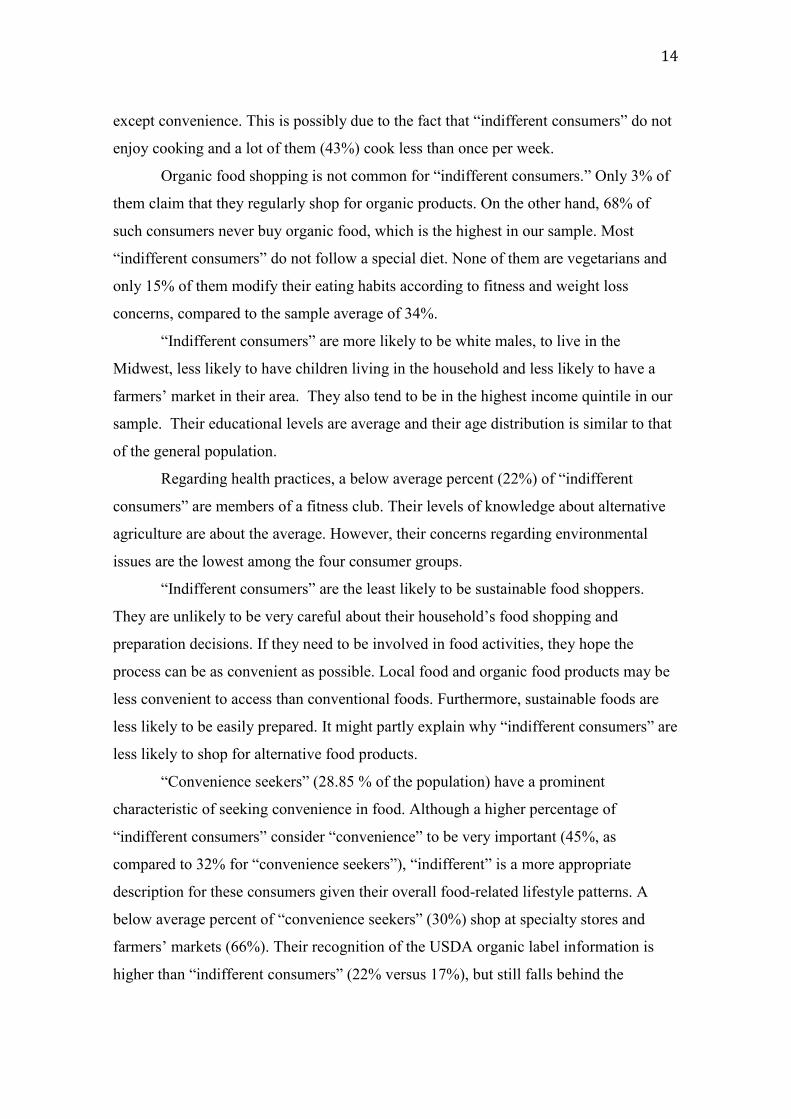
Page 14
14
except convenience. This is possibly due to the fact that “indifferent consumers” do not
enjoy cooking and a lot of them (43%) cook less than once per week.
Organic food shopping is not common for “indifferent consumers.” Only 3% of
them claim that they regularly shop for organic products. On the other hand, 68% of
such consumers never buy organic food, which is the highest in our sample. Most
“indifferent consumers” do not follow a special diet. None of them are vegetarians and
only 15% of them modify their eating habits according to fitness and weight loss
concerns, compared to the sample average of 34%.
“Indifferent consumers” are more likely to be white males, to live in the
Midwest, less likely to have children living in the household and less likely to have a
farmers’ market in their area. They also tend to be in the highest income quintile in our
sample. Their educational levels are average and their age distribution is similar to that
of the general population.
Regarding health practices, a below average percent (22%) of “indifferent
consumers” are members of a fitness club. Their levels of knowledge about alternative
agriculture are about the average. However, their concerns regarding environmental
issues are the lowest among the four consumer groups.
“Indifferent consumers” are the least likely to be sustainable food shoppers.
They are unlikely to be very careful about their household’s food shopping and
preparation decisions. If they need to be involved in food activities, they hope the
process can be as convenient as possible. Local food and organic food products may be
less convenient to access than conventional foods. Furthermore, sustainable foods are
less likely to be easily prepared. It might partly explain why “indifferent consumers” are
less likely to shop for alternative food products.
“Convenience seekers” (28.85 % of the population) have a prominent
characteristic of seeking convenience in food. Although a higher percentage of
“indifferent consumers” consider “convenience” to be very important (45%, as
compared to 32% for “convenience seekers”), “indifferent” is a more appropriate
description for these consumers given their overall food-related lifestyle patterns. A
below average percent of “convenience seekers” (30%) shop at specialty stores and
farmers’ markets (66%). Their recognition of the USDA organic label information is
higher than “indifferent consumers” (22% versus 17%), but still falls behind the
Page 15
15
population average of 32%. They value freshness of food products. Their concerns for
healthiness, food safety and cost are slightly above the population averages. They have
the most people who care a lot about brand (13%) and cost (52%).
“Convenience seekers” are least likely to be regular organic food shoppers. Less
than 2% of them belong to this category, compared to the sample mean of 8%.
Nevertheless, occasional organic food shopping behaviors are more common for
“convenience seekers” than for “indifferent consumers” (39% versus 29%). Cooking is
not a very enjoyable task for “convenience seekers.” However this does not implies that
they do not cook often: 63% of them cook more than three meals a week from raw
ingredients. Most of the “convenience seekers” do not desire special consequences out
of their meals, meaning a lower than average percentage of them follow a special diet
due to health concerns (16%), fitness and weight loss (18%), religion (<1%) or being
vegetarians (2%).
A relatively high percentage of “convenience seekers” belong to the lower two
income quintiles, and they have the lowest proportion completing college. They are
more likely than average to be either younger than 35 or older than 55. They are also
less likely to have a farmers’ market in their area. The racial distribution of
"convenience seekers" is about average and they are more likely to live in the South.
“Convenience seekers” have the lowest knowledge level about sustainable foods among
the four consumer groups. They are least likely to be members of an environmental
group (2%) or belong to a fitness club (21%).
In sum, the lifestyle of “convenience seekers” seems to be influenced by their
relatively low income level. It is not likely that they can afford the lifestyle of being
regular organic food shoppers. The lack of knowledge about such products may also
contribute to the fact that “convenience seekers” are not active in local food and organic
food shopping. On the other hand, just like “indifferent consumers,” “convenience
seekers” may be less likely to be interested in sustainable food products since
convenience is usually not an attribute of such products.
Summary and Implications
In answer to question (1), we were able to identify four consumer lifestyle
segments in our sample. They are different in their ways of shopping, product attributes,
Page 16
16
meal preparation and desired consequences. “Practical consumers” comprise 29% of
sample households, are frequent home cookers and cooking is an enjoyable task for
them. While convenience is not an attribute of food they value highly, they do place a
high value on taste and are cost-conscious. “Food enthusiasts,” at 24% of the sample,
are very enthusiastic about shopping, preparing, and consuming foods. Healthiness,
freshness and safety of food are very important to them. A significantly higher than
average proportion of them follow a special diet because of health, fitness, weight loss,
religion, or being vegetarians. They are the segment that cooks most frequently at home.
“Indifferent consumers” are the smallest consumer group (18%) in the sample. They are
the least involved in any food activities. Functional product characteristics such as
healthiness and freshness are not important to them. This can be related to the fact that
they do not have many desired consequences for meals. The only food characteristic
they care about is convenience. “Convenience seekers” comprise 29% of the sample.
Characteristics of food such as healthiness and safety are somewhat important to them,
but they highly value the convenience of food products.
In response to question (2), consumers belonging to different lifestyle segments
do show different levels of involvement in sustainable food consumption, specifically
shopping at farmers' markets and purchasing organic food. “Food enthusiasts,”
“practical consumers,” “convenience seekers,” and “indifferent consumers” are ranked
from highest to lowest in terms of sustainable food shopping. Both “food enthusiasts”
and “practical consumers” are active organic and local food shoppers. Although more
than half of “convenience seekers” have bought local and organic food products, it is
very unlikely that they will be regular shoppers of sustainable foods. The majority of
“indifferent consumers” have never bought organic or local products.
In response to question (3), health practices are what significantly distinguish
“food enthusiasts,” the most active sustainable food shoppers, from other consumers. It
is not surprising since these consumers emphasize healthiness as a food attribute.
In response to question (4), the level of sustainable food knowledge and the
participation in environmentally friendly activities are both associated with the
likelihood of being a sustainable food shopper. Environmental concerns are highest
among “food enthusiasts” and lowest among “indifferent consumers.” The consumers
showing the least sustainable food knowledge and participation in environmental groups
Page 17
17
are “convenience seekers.” Since “convenience seekers” place some importance on the
functional characteristics of sustainable food, such as freshness and healthiness, it is
likely that lack of knowledge contributes to this attitude and there is a behavior gap for
“convenience seekers.” This implies a potential response to efforts spent on educating
these consumers about the benefits of sustainable food products on their health.
As to question (5), the demographic characteristics that predict the lifestyle
choice of “practical consumers” are: having more children living in the household,
middle age, white, and high income. They are more likely to live in the West and to
have access to a farmers’ market in their neighborhood. “Food enthusiasts” are more
likely than the average population to be female, minority, and to be a middle-income
household. Like “practical consumers,” they can easily access to farmers’ markets in
their neighborhood. “Indifferent consumers” are more likely than other consumers to be
white, male, and they tend to have fewer children living in the household. They usually
live in a community with no farmers’ market nearby. “Convenience seekers” are more
likely than average consumers to be either younger than 35 years old or older than 55
years old. They are less likely to live in the West and they tend to have no farmers’
market in their neighborhood.
The cluster analysis provides insights to target strategies that would appeal to
the different consumer segments. As an example, the ideal food for the largest group
(29%), “practical consumers,” is one that tastes good and has high nutrition levels, yet is
not too pricey. Since these consumers are likely to have children in the family, products
with features especially designed for children would be popular. Furthermore, the
product can emphasize how it will bring fun and pleasure to cooking.
Overall, for “food enthusiasts,” functional characteristics of food such as
healthiness and freshness are a central issue. Marketers can appeal to “food enthusiasts”
by strengthening the link between healthiness and organic/local food products. In
addition, ethnic food with health and ecological benefits can be developed for “food
enthusiasts,” since a higher than average proportion of them are minorities.
Furthermore, products that can be associated with fitness, such as an organic low-
calorie energy bar, may be popular among “food enthusiasts,” given their more active
lifestyle.
Page 18
18
To “indifferent consumers,” food marketers can mainly emphasize the
convenience of their products. The low priority they place on the health of their families
raises some concerns since convenience foods are often high in fat and lack necessary
nutrients. To mitigate this, education programs on meal preparation and food nutrition
could be targeted to “indifferent consumers,” a considerable proportion of whom are
white males.
“Convenience seekers,” like “indifferent consumers,” are looking for food
products that can be quickly and easily prepared. However, there are more possibilities
of product differentiation for “convenience seekers” than for “indifferent consumers,”
given their higher concerns for food safety and health. Marketers may also want to take
into account the food habits of both the older and younger generations when developing
new products, since these groups are more likely to be "convenience seekers."
For US state governments that want to boost local agriculture and improve
environmental sustainability by promoting local products, a challenge at hand is to
promote awareness of how one’s food decisions impact the environment and the local
economy. Based on the results of this study, “convenience seekers” and “indifferent
consumers” may not have high levels of environmental concerns or knowledge about
sustainable agriculture. Providing them with relevant information may influence their
opinions on alternative agriculture and advise them to be more thoughtful about food
choices. Public health practitioners may find the food-related lifestyle information
helpful, too. It provides insights as to whom they should provide healthy-eating
education and strategies for the types of information to emphasize.
Conceptually, the results are consistent with Guagnano et al. (1995) Attitude-
Behavior Context theory. The results emphasize the importance of personal
characteristics in shaping attitudes that in turn affect knowledge and behaviors
regarding sustainable food choices. In particular, they point to the importance of
lifestyle over other characteristics and provide marketers and policy-makers with
strategies to communicate with the different segments to promote sustainable foods.
The results also provide strategies to shape the context to promote sustainable foods for
the different groups, e.g. in terms of which groups will respond to access and pricing.
In terms of limitations and future work, it would be desirable to collect data that
was directly comparable to Grunert et al.'s FRL model (1993). Also of interest, would
Page 19
19
be to collect new data to examine the impact of greater availability of organic foods in
mainstream US retail outlets, as well as to examine the effects of popular media and
culture in promoting local foods in the US. The data could be used to test a structural
model of the relative importance of attitudes and context in shaping behaviors. Also of
interest would be to collect data that would permit direct comparisons of lifestyle
segments across nations.
References
Baker, S., Thompson, K.E., & Engelken J. (2004). Mapping the values driving organic
food choice. European Journal of Marketing, 38(8), 995–1012.
Demby, E. (1974). Psychographics and from Where it Came. Life Style and
Psychographics, 9-30. Chicago, IL: American Marketing Association.
Grunert, K.G.. Brunsø K., & Bisp. S. (1993). Food-related life-style: development of a
cross-culturally valid instrument for market surveillance. Arahus, Denmark:
Arahus School of Business.
Guagnano, G.A., Stern, P.C., & Dietz, T. (1995) Influences on attitude-behavior
relationships: A natural experiment with curbside recycling. Environment and
Behavior, 27, 699–718.
Hartigan J. A., & Wong M. A. (1979). A k-means clustering algorithm. Applied
Statistics. 28(1), 100-108.
Kollmus, A., & Agyeman, J. (2002). Mind the gap: Why do people act environmentally
and what are the barriers to pro-environmental behavior? Environmental
Education Research, 8(3), 239-260.
Laaksonen, P., Laaksonen, M. & Leipämaa, H. (2002). Consumers` Orientation to Food
and Eating: A Modification and Application to the Food-related Lifestyle
Instrument of Brunso, Grunert & Bisp. Vaasa, Finland: University of Vaasa.
Lusk, J., & Briggeman, B. (2009). Food Values, American Journal of Agricultural
Economics, 91(1), 184-196.
Nijmeijer, M., Worsley, A., & Astil, B. (2004). An exploration of the relationships
between lifestyle and vegetable consumption. British Food Journal, 106 (7),
520-533.
Page 20
20
NPD Group. (2009). NPD Reports "Better for You" Foods to Grow Significantly Over
the Next Decade. Port Washington, NY: The NPD Group, Inc. Retrieved
November 10, 2009, http://www.npd.com/press/releases/press_090707a.html
Organic Trade Association. (2008). Organic Industry Overview. Green Field, MA:
Organic Trade Association. Retrieved December 2, 2008,
http://www.ota.com/pics/documents/Mini%20fact%201-08%20confirming.pdf
Organic Trade Association. (2007). U.S. organic food sales up 22%, hit $17 billion in
2006. Green Field, MA: Organic Trade Association. Retrieved December 2,
2009, http://www.organicconsumers.org/articles/article_5109.cfm
Senauer, B. (2001). The food consumer in the 21st century new research perspectives.
St. Paul, MN: The Retail Food Industry Center, University of Minnesota.
Shaffer, J., & Cox, B. (2008). Number of Farmers Markets Continues to Rise in U.S.
Washington, DC: USDA. Retrieved December 12, 2008,
http://www.ams.usda.gov/AMSv1.0/getfile?dDocName=STELPRDC5072472&
acct=frmrdirmkt
U.S. Department of Agriculture. (2003). The National Organic Program. Retrieved
Nov. 23, 2009, http://www.ams.usda.gov/nop
Wells, W. D. (1975). Psychographics: A critical review. Journal of Marketing, 12(2),
196-213.
Zepeda, L., & Li, J. (2006). Who buys local food? Journal of Food Distribution
Research, 37(3): 1-11.
Zepeda, L., & Li, J. (2007). Characteristics of organic food shoppers. Journal of
Agriculture and Applied Economics, 39(1): 17-28.
Page 21
21
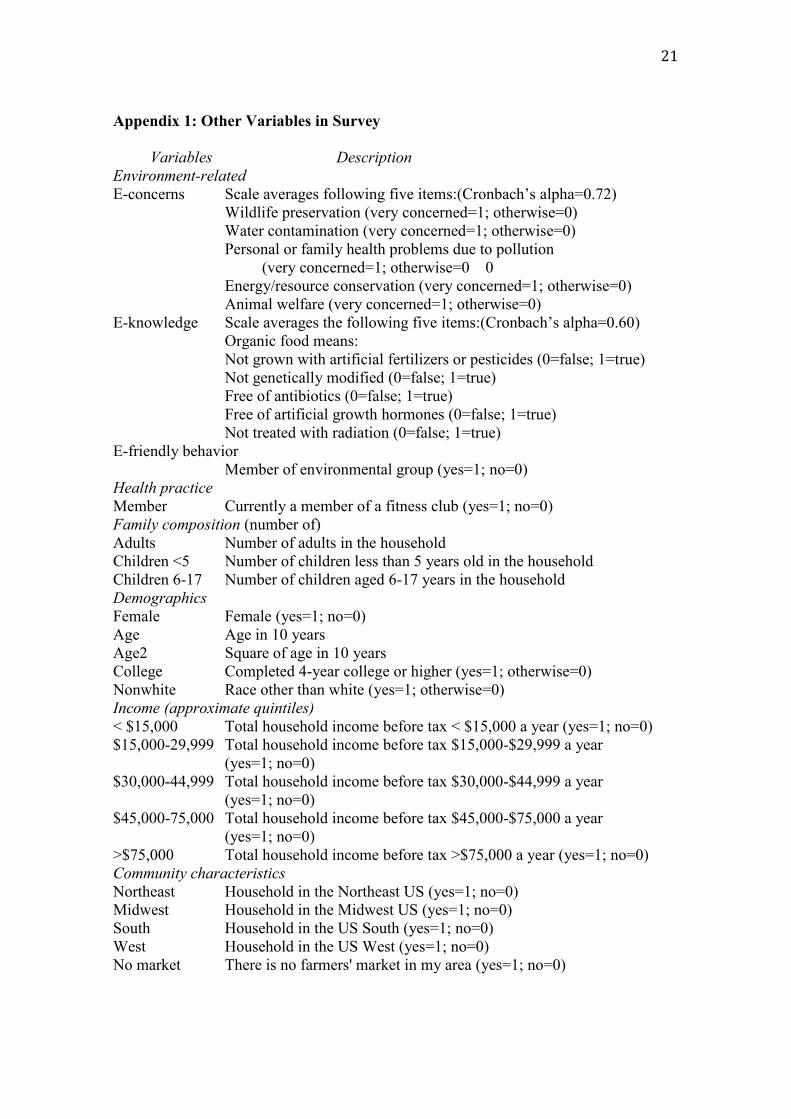
Appendix 1: Other Variables in Survey
Variables Description
Environment-related
E-concerns Scale averages following five items:(Cronbach’s alpha=0.72)
Wildlife preservation (very concerned=1; otherwise=0)
Water contamination (very concerned=1; otherwise=0)
Personal or family health problems due to pollution
(very concerned=1; otherwise=0 0
Energy/resource conservation (very concerned=1; otherwise=0)
Animal welfare (very concerned=1; otherwise=0)
E-knowledge Scale averages the following five items:(Cronbach’s alpha=0.60)
Organic food means:
Not grown with artificial fertilizers or pesticides (0=false; 1=true)
Not genetically modified (0=false; 1=true)
Free of antibiotics (0=false; 1=true)
Free of artificial growth hormones (0=false; 1=true)
Not treated with radiation (0=false; 1=true)
E-friendly behavior
Member of environmental group (yes=1; no=0)
Health practice
Member Currently a member of a fitness club (yes=1; no=0)
Family composition (number of)
Adults Number of adults in the household
Children <5 Number of children less than 5 years old in the household
Children 6-17 Number of children aged 6-17 years in the household
Demographics
Female Female (yes=1; no=0)
Age Age in 10 years
Age2 Square of age in 10 years
College Completed 4-year college or higher (yes=1; otherwise=0)
Nonwhite Race other than white (yes=1; otherwise=0)
Income (approximate quintiles)
< $15,000 Total household income before tax < $15,000 a year (yes=1; no=0)
$15,000-29,999 Total household income before tax $15,000-$29,999 a year
(yes=1; no=0)
$30,000-44,999 Total household income before tax $30,000-$44,999 a year
(yes=1; no=0)
$45,000-75,000 Total household income before tax $45,000-$75,000 a year
(yes=1; no=0)
>$75,000 Total household income before tax >$75,000 a year (yes=1; no=0)
Community characteristics
Northeast Household in the Northeast US (yes=1; no=0)
Midwest Household in the Midwest US (yes=1; no=0)
South Household in the US South (yes=1; no=0)
West Household in the US West (yes=1; no=0)
No market There is no farmers' market in my area (yes=1; no=0)