U.S. Department of the Interior U.S. Geological Survey Circular 1303 Toxic Substances Hydrology Program Prepared in cooperation with the Strategic Environmental Research and Development Program A Framework for Assessing the Sustainability of Monitored Natural Attenuation
Transcript
U.S. Department of the InteriorU.S. Geological Survey
Circular 1303
Toxic Substances Hydrology Program
Prepared in cooperation with the Strategic Environmental Research and Development Program
A Framework for Assessing the Sustainability of Monitored Natural Attenuation
Cover: Cyclic biodegradation of chlorinated ethenes (adapted from figure 4).
A Framework for Assessing the Sustainability of Monitored Natural Attenuation
By Francis H. Chapelle, John Novak, John Parker, Bruce G. Campbell, and Mark A. Widdowson
Prepared in cooperation with the Strategic Environmental Research and Development Program
Circular 1303
U.S. Department of the InteriorU.S. Geological Survey
U.S. Department of the InteriorDIRK KEMPTHORNE, Secretary
U.S. Geological SurveyMark D. Myers, Director
U.S. Geological Survey, Reston, Virginia: 2007
For product and ordering information: World Wide Web: http://www.usgs.gov/pubprod Telephone: 1-888-ASK-USGS
For more information on the USGS—the Federal source for science about the Earth, its natural and living resources, natural hazards, and the environment: World Wide Web: http://www.usgs.gov Telephone: 1-888-ASK-USGS
Any use of trade, product, or firm names is for descriptive purposes only and does not imply endorsement by the U.S. Government.
Although this report is in the public domain, permission must be secured from the individual copyright owners to reproduce any copyrighted materials contained within this report.
Suggested citation:Chapelle, F.H., Novak, John, Parker, John, Campbell, B.G., and Widdowson, M.A., 2007, A framework for assessing the sustainability of monitored natural attenuation: U.S. Geological Survey Circular 1303, 35 p.
Library of Congress Cataloging-in-Publication Data
A framework for assessing the sustainability of monitored natural attenuation / by Francis H. Chapelle ... [et al.]. p. cm. -- (Circular ; 1303) Includes bibliographical references and index. ISBN 978-1-4113-1774-1 1. Hazardous wastes--Natural attenuation--Evaluation. 2. Hazardous waste site remediation--Evaluation. 3. In situ remediation-- Evaluation. 4. Groundwater--Pollution. I. Chapelle, Frank. TD1052.F73 2007 628.5--dc22 2007007476
Foreword
Natural attenuation, a series of naturally occurring processes that transform potentially dan-gerous environmental contaminants into innocuous byproducts, occurs to some degree in all hydrologic systems. The efficiency of natural attenuation, however, varies widely for different hydrologic environments and for different environmental contaminants. Monitored Natural Attenuation (MNA) is the regulatory term for the use of these naturally occurring processes to help manage human-generated wastes. Good environmental stewardship requires, however, that MNA be applied in a technically sound manner that reliably protects humans and wildlife from chemical contaminants.
Several years ago, the Strategic Environmental Research and Development Program (SERDP), a cooperative program of the Department of Defense, the Department of Energy, and the Envi-ronmental Protection Agency, initiated research designed to improve the scientific basis for evaluating MNA. Because MNA is often considered as a part of remediation systems that need to operate for decades or centuries, methods for understanding the long-term sustainability of MNA were of particular priority. SERDP, in partnership with the U.S. Geological Survey, Virginia Polytechnic Institute and State University, and Oak Ridge National Laboratory, initiated a project to assess the long-term sustainability of MNA. This report summarizes some of the findings of that study.
The results of this joint study highlight opportunities and potential dangers associated with applying MNA to contaminants such as chlorinated solvents. The principal opportunity is that microorganisms capable of cycling chlorinated solvents to innocuous byproducts (carbon dioxide and chloride) are ubiquitous and are present in all hydrologic systems. This, in turn, shows that MNA can be a useful tool for managing chlorinated solvents that have been released to the environment. The potential danger is that chemical energy, principally in the form of organic matter, is required to drive these degradation processes to completion—a requirement that is not met in some hydrologic systems.
This report outlines methodology for assessing the efficiency and sustainability of MNA. As such, it provides environmental managers a sound scientific basis for identifying sites where MNA is sustainable and an appropriate part of overall site remediation. Just as importantly, it also helps identify those sites where MNA may not be sustainable and not appropriate for site remediation. The principal mission of SERDP is to provide Federal facilities managers and regulators with sound, scientifically based information for implementing cost-effective environ-mental remediation. This report advances that mission.
Robert M. Hirsch
U.S. Geological Survey, Associate Director for Water
Bradley Smith Strategic Environmental Research and Development Program, Executive Director
iii
Contents
Foreword ........................................................................................................................................................iiiAbstract ...........................................................................................................................................................1Introduction.....................................................................................................................................................1Biological Cycles and the Nature of Sustainability ..................................................................................2
DDT—An Incomplete Waste-Substrate Cycle ................................................................................3Chlorinated Ethenes in an Oxygenated Aquifer—An Incomplete
Waste-Substrate Cycle ..........................................................................................................4Chlorinated Ethenes in an Anoxic Aquifer—A Completed Waste-Substrate Cycle..................5
Mass Balance, Energy Balance, and the Sustainability of Natural Attenuation ................................6Mass and Energy Balance ..................................................................................................................7Mass Balance in Contaminated Ground-Water Systems ..............................................................8Energy Balance in Contaminated Ground-Water Systems ............................................................8
Quantifying Mass and Energy Balance ......................................................................................................9An Empirical Approach to Mass and Energy Balance ...................................................................9A Deterministic Approach to Mass and Energy Balance ............................................................10Conceptual Model of the Kings Bay Site ........................................................................................11Constructing the Deterministic Model ............................................................................................13Constraining the Mass-Balance Model ..........................................................................................14
Rates of Ground-Water Flow ...................................................................................................14Areal Recharge to the Semiconfined Aquifer .......................................................................16Mass Balance of NAPL .............................................................................................................16Mass Balance of Electron Donors and Acceptors ..............................................................17Mass Balance of Dissolved Chlorinated Ethenes ................................................................17
Assessing the Sustainability of Natural Attenuation ....................................................................17NAPL Dissolution and Time of Remediation ..........................................................................19NAPL Removal and Time of Remediation ..............................................................................19Dissolved Oxygen/Dissolved Organic Carbon Flux: Short-Term Sustainability ...............19Available Organic Carbon and Dissolved Organic Carbon Flux:
Long-Term Sustainability .............................................................................................20Short-Term and Long-Term Sustainability .............................................................................22Electron Acceptor Depletion and Sustainability ..................................................................22
Conclusions...................................................................................................................................................24References ....................................................................................................................................................24Appendix 1. Description of the Deterministic Model .........................................................................27Appendix 2. Parameters Used to Simulate the Kings Bay Site .........................................................29
v
Figures 1–4. Diagrams showing— 1. The carbon cycle ...................................................................................................................2 2. Role of biochemical pathways such as glycolosis and the citric acid cycle
in the carbon cycle ................................................................................................................3 3. DDT as an example of an incomplete waste-substrate cycle .......................................4 4. Biochemical cycling of chlorinated ethenes ....................................................................5 5. Photograph showing the organic-matter-rich semiconfining bed overlying the
semiconfined aquifer ...................................................................................................................6 6–9. Diagrams showing— 6. Effect of mass and energy balance on the sustainability of natural attenuation .......7 7. Interaction between a contaminant source area, a dissolved plume,
and natural attenuation ........................................................................................................8 8. Ways in which energy flow in ground-water systems affects the
transformation of chlorinated ethenes ..............................................................................9 9. The empirical approach to describing the mass balance of a system
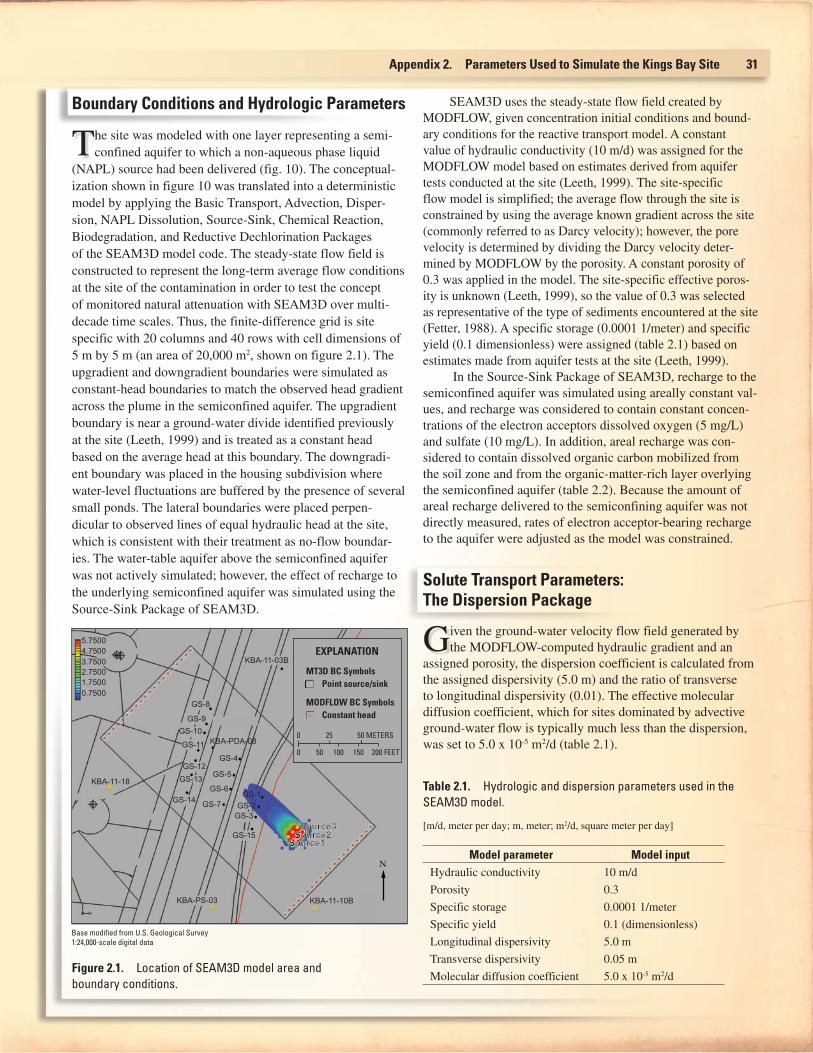
depends on site-specific monitoring data .......................................................................10 10. Conceptual model of the Kings Bay site in southeastern Georgia .....................................12 11. Map showing concentrations of vinyl chloride in the Kings Bay, Georgia,
plume, November 1998 ...............................................................................................................13 12–14. Graphs showing— 12. Concentrations of chlorinated ethenes along the flowpath
of the Kings Bay plume .......................................................................................................13 13. Concentrations of redox indicator parameters along the flowpath
of the Kings Bay plume .......................................................................................................14 14. Concentration changes of sulfate and chlorinated ethenes
over time at well KBA-11-13A from 1998 through 2004 .................................................15 15–18. Maps showing— 15. Observed chloride concentrations in ground water at the
Kings Bay site, November 1998 .........................................................................................16 16. Simulated and observed 1998 concentrations of chlorinated ethenes ......................18 17. The simulated and measured 2004 concentrations of chlorinated
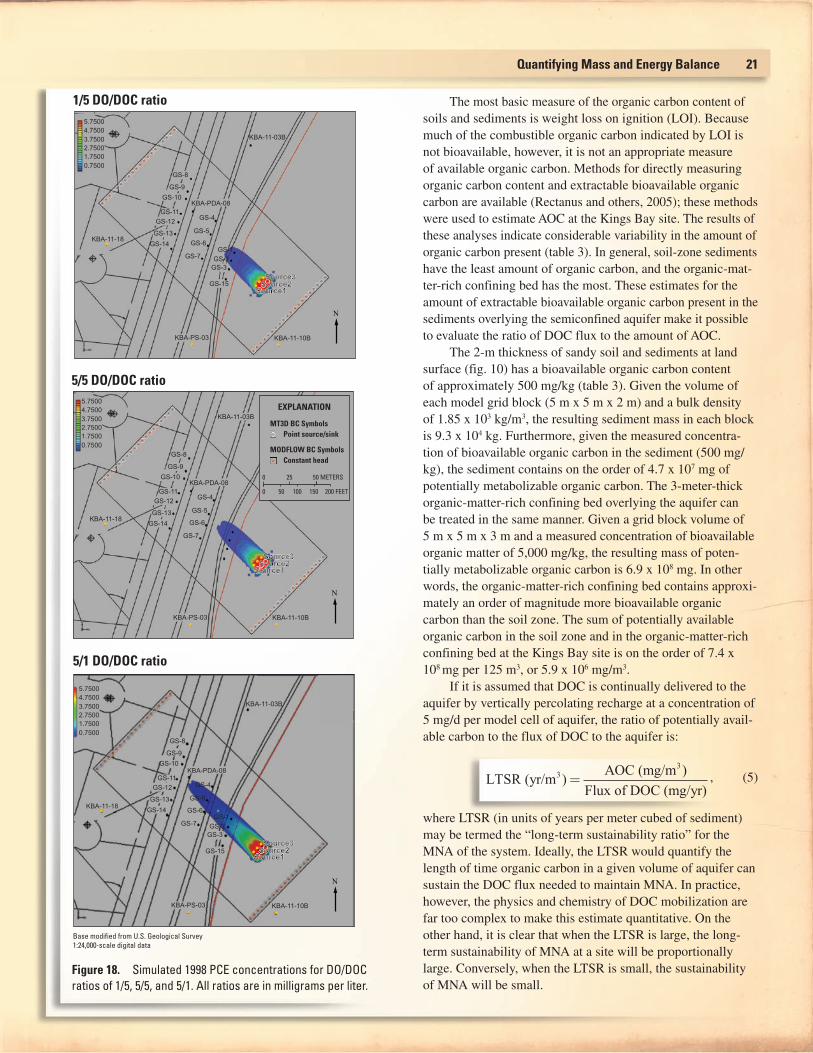
ethenes following source-area removal in 1998 ............................................................20 18. Simulated 1998 PCE concentrations for DO/DOC ratios of 1/5, 5/5, and 5/1 ...............21 19. Diagram showing the short- and long-term components of the sustainability
of monitored natural attenuation .............................................................................................22 20. Maps showing simulated 2050 VC concentrations for DO/DOC ratios
of 1/5, 5/5, and 5/1 .......................................................................................................................23
Tables 1. Observed sensitivity of simulated chloride concentrations to a
non-aqueous phase liquid (NAPL) mass .................................................................................16 2. Estimated times of remediation for different non-aqueous
phase liquid (NAPL) masses .....................................................................................................19 3. Organic carbon content of Kings Bay sediments..................................................................23
vi
Conversion FactorsInch/Pound to Metric
Multiply By To obtain
Lengthfoot (ft) 0.3048 meter (m)
mile (mi) 1.609 kilometer (km)
Volumegallon (gal) 3.785 liter (L)
gallon (gal) 0.003785 cubic meter (m3)
Flow ratefoot per second (ft/s) 0.3048 meter per second (m/s)
foot per day (ft/d) 0.3048 meter per day (m/d)
foot per year (ft/yr) 0.3048 meter per year (m/yr)
cubic foot per second (ft3/s) 0.02832 cubic meter per second (m3/s)
Metric to Inch/Pound
Multiply By To obtain
Lengthmeter (m) 3.281 foot (ft)
Areasquare meter (m2) 0.0002471 acre
Volumecubic meter (m3) 264.2 gallon (gal)
liter (L) 61.02 cubic inch (in3)
cubic meter (m3) 35.31 cubic foot (ft3)
Flow ratemeter per day (m/d) 3.281 foot per day (ft/d)
Massgram (g) 0.03527 ounce, avoirdupois (oz)
kilogram (kg) 2.205 pound avoirdupois (lb)
Densitygram per cubic centimeter (g/cm3) 62.4220 pound per cubic foot (lb/ft3)
Hydraulic conductivitymeter per day (m/d) 3.281 foot per day (ft/d)
Temperature in degrees Celsius (°C) may be converted to degrees Fahrenheit (°F) as follows:
°F=(1.8×°C)+32
Temperature in degrees Fahrenheit (°F) may be converted to degrees Celsius (°C) as follows:
°C=(°F-32)/1.8
vii
Abbreviations and Acronyms
AOC Available organic carbonAr AdvectionATP Adenosine triphosphateBr BiodegradationCH4 MethaneCH2O Organic carbon(CH2O)6 GlucoseCl ChlorideCN NAPL mass in grams of NAPL per gram of sedimentCO2 Carbon dioxideDCE DichloroetheneDDD DichlorodiphenyldichloroethaneDDE DichlorodiphenyldichloroetheneDDT DichlorodiphenyltrichloroethaneDO Dissolved oxygenDOC Dissolved organic carbonDr DispersionEA Electron acceptorsFe(II) Ferrous ironFe(III) Ferric ironH2O WaterLOI Weight loss on ignitionLTSR Long-term sustainability ratiomg/L Milligrams per litermM/L Millimoles per literMn(IV) Solid-phase manganeseMNA Monitored natural attenuationμg/L Micrograms per literNAC Natural attenuation capacityNAPL Non-aqueous phase liquidnM/L Nanomoles per literNO3 NitrateO2 Molecular oxygenPCE PerchloroethenePr Plant transpirationSEAM3D 3-dimensional sequential electron acceptor modelSO4 SulfateSr SorptionSTSR Short-term sustainability ratioTCE TrichloroetheneTOR Time of remediationVC Vinyl chlorideVr Volatilization
viii
Abstract
The sustainability of monitored natural attenuation (MNA) over time depends upon (1) the presence of chemical/
biochemical processes that transform wastes to innocu-ous byproducts, and (2) the availability of energy to drive these processes to completion. The presence or absence of contaminant-transforming chemical/biochemical processes can be determined by observing contaminant mass loss over time and space (mass balance). The energy available to drive these processes to completion can be assessed by measuring the pool of metabolizable organic carbon available in a system, and by tracing the flow of this energy to available electron acceptors (energy balance). For the special case of chlori-nated ethenes in ground-water systems, for which a variety of contaminant-transforming biochemical processes exist, natural attenuation is sustainable when the pool of bioavailable organic carbon is large relative to the carbon flux needed to drive biodegradation to completion.
These principles are illustrated by assessing the sustain-ability of MNA at a chlorinated ethene-contaminated site in Kings Bay, Georgia. Approximately 1,000 kilograms of per-chloroethene (PCE) was released to a municipal landfill in the 1978–1980 timeframe, and the resulting plume of chlorinated ethenes migrated toward a nearby housing development. A numerical model, built using the sequential electron acceptor model code (SEAM3D), was used to quantify mass and energy balance in this system. The model considered the dissolution of non-aqueous phase liquid (NAPL) as the source of the PCE, and was designed to trace energy flow from dissolved organic carbon to available electron acceptors in the sequence oxy-gen > chlorinated ethenes > ferric iron > sulfate > carbon diox-ide. The model was constrained by (1) comparing simulated and measured rates of ground-water flow, (2) reproducing the observed distribution of electron-accepting processes in the aquifer, (3) comparing observed and measured concentrations of chlorinated ethenes, and (4) reproducing the observed pro-duction and subsequent dilution of dissolved chloride, a final degradation product of chloroethene biodegradation.
Simulations using the constrained model indicated that an average flux of 5 milligrams per liter per day of organic carbon (CH
2O) per model cell (25 square meters) is required
to support the short-term sustainability of MNA. Because this flux is small relative to the pool of renewable organic carbon (about 4.7 x 10⁷ milligrams [mg] per model cell) present in the soil zone and nonrenewable carbon (about 6.9 x 10⁸ mg per model cell) in an organic-matter-rich sediment layer overlying the aquifer, the long-term sustainability of MNA is similarly large. This study illustrates that the short- and long-term sus-tainability of MNA can be assessed by:
Estimating the time required for contaminants to dissolve/disperse/degrade under ambient hydrologic conditions (time of remediation).
Quantifying the organic carbon flux to the system needed to consume competing electron acceptors (oxygen) and direct electron flow toward chloroethene degradation (short-term sustainability).
Comparing the required flux of organic carbon to the pool of renewable and nonrenewable organic carbon given the estimated time of remediation (long-term sustainability).
These are general principles that can be used to assess the sustainability of MNA in any hydrologic system.
Introduction
Monitored natural attenuation (MNA) is defined as the use of naturally occurring contaminant degradation, disper-
sion, and immobilization processes to reach site-specific remediation goals (Wiedemeier and others, 1996; U.S. Environ-mental Protection Agency, 1998, 1999). In current engineering practice, the effectiveness of MNA is evaluated on a site-by-site basis by considering three lines of evidence: (1) historical moni-toring data showing decreasing concentrations and/or contami-nant mass over time, (2) geochemical data showing that site conditions favor contaminant transformation or immobilization, or (3) site-specific laboratory studies documenting ongoing bio-degradation processes (U.S. Environmental Protection Agency, 1998). Various field and laboratory methods for assessing these three lines of evidence have been developed and are cur-rently in use (Wiedemeier and others, 1999).
1.
2.
3.
A Framework for Assessing the Sustainability of Monitored Natural Attenuation
By Francis H. Chapelle,1 John Novak,2 John Parker,3 Bruce G. Campbell,1 and Mark A. Widdowson2
1 U.S. Geological Survey.
2 Virginia Polytechnic Institute and State University.
3 U.S. Department of Energy.
For most sites, the effectiveness of chlorinated ethene natural attenuation is typically assessed over relatively short periods of time, often only a few months or years. When MNA becomes part of a long-term remediation strategy, however, it must be assumed that processes observed during site assess-ment will remain intact over the system’s operational lifetime. This operational lifetime depends on the length of time that contaminants are released from source areas to ground water (National Research Council, 2000), a period of time that may encompass decades or even centuries. This, in turn, raises an important question. Will the natural attenuation processes observed during site assessment continue with the same effi-ciency in the future? In other words, will MNA be sustainable throughout the operational life of the remediation system?
A variety of circumstances affect the sustainability of MNA for chlorinated ethenes (Newell and Aziz, 2004), and thus, its sustainability can be expected to vary from site to site. In spite of this variability, the sustainability of MNA at any particular site should reflect the same set of general principles. The purpose of this report is to identify these general prin-ciples, arrange them into a framework suitable for assessing the sustainability of MNA, and illustrate these principles using a field example. This framework, in turn, leads directly to methods for characterizing and quantifying the sustainability of MNA that can be applied at any site.
Biological Cycles and the Nature of Sustainability
Life on Earth has been sustained for approximately 3.4 billion years. In considering the concept of sustain-
ability, therefore, it is useful to begin with those characteristics of living systems that have made them sustainable for such long periods of time.
One characteristic of life systems is their cyclic nature. The use of carbon by living organisms, for example, is based on the alternate reduction of carbon dioxide (CO
2) and water
(H2O) to organic carbon (CH
2O) with the release of molecular
oxygen (O2) as a waste product. This oxygen, in turn, becomes
a substrate for heterotrophic organisms that oxidize organic carbon back to carbon dioxide. Thus, the waste product (oxy-gen) of one biochemical process (photosynthesis) becomes the substrate (oxygen) for another biochemical process (heterotro-phic metabolism). When the waste from one process becomes the substrate for another process, the result may be termed a waste-substrate cycle. Continuous, ongoing waste-substrate cycles, which are analogous to the action of a mechanical engine, are driven by the energy of the sun (fig. 1).
But while the overall stoichiometry of the carbon cycle is simple,
CO2 + H
2O CH
2O + O
2 CO
2 + H
2O , (1)
the underlying biochemistry is enormously complex. Thou-sands of biochemical pathways are involved in the produc-tion of organic matter from carbon dioxide and solar energy. Similarly, there are just as many biochemical pathways that transform organic carbon back to carbon dioxide in order to complete the cycle.
Two well-known examples of heterotrophic biochemical pathways are glycolosis and the citric acid cycle (fig. 2). Gly-colosis begins with the simple sugar glucose (CH
2O)
6, which is
sequentially fermented to pyruvate and carbon dioxide, yield-ing chemical energy in the form of adenosine triphosphate (ATP). At least nine enzymatically catalyzed steps are involved in glycolosis. Pyruvate formed by glycolosis can then enter the citric acid cycle, again undergoing numerous intermediate steps, with the final production of additional chemical energy (ATP) and CO
2. The combination of glycolosis and the citric
acid cycle results in the complete mineralization of glucose to carbon dioxide, and the conversion of chemical energy stored in glucose to ATP. Numerous biochemical pathways, of which glycolosis and the citric acid cycle are just two examples, have evolved over geologic time. In the absence of these enzymati-cally catalyzed biochemical processes, oxygen and organic carbon can coexist together indefinitely at room temperature and not be converted to carbon dioxide.
Figure 1. The carbon cycle.
� A Framework for Assessing the Sustainability of Monitored Natural Attenuation
The carbon cycle in its present form, which has been sustained since the advent of biochemical photosynthesis 2.2 billion years ago, illustrates two important characteristics of sustainable biological systems. The first is that biochemical mechanisms must be in place (glycolosis, the citric acid cycle) to transform the various carbon substrates that are available. This is not a trivial requirement. All of these biochemical processes took long periods of time to evolve. The presence of biochemical mechanisms to perform certain functions, therefore, is not a given. Those that are present have evolved and developed over time, and they typically fill a particular available ecological niche.
The second characteristic of these biochemical path-ways is that energy must be available to drive the processes. Biochemical pathways perform work in which organic molecules are assembled or disassembled, and work requires the utilization of energy. In the case of photosynthesis, it is the continuous delivery of solar energy that drives the carbon-oxygen cycle. Importantly, however, chemical energy stored in reduced carbon compounds also is available to drive bio-chemical pathways such as glycolosis and the citric acid cycle (fig. 2) that serve to complete the carbon cycle. These consid-erations suggest a working definition of sustainability:
A sustainable biological process is cyclic in nature, is based on existing biochemical mechanisms, and has a source of energy available to drive it over time.
This broad definition can be applied to the natural attenu-ation of human-generated contaminants. If particular contami-nants (chlorinated ethenes) are actively transformed to innocu-ous products (carbon dioxide and chloride) by biochemical processes that are present in natural systems (reductive dechlo-rination, oxidation), and if energy (organic carbon) is available to drive these processes to completion, then the natural attenu-ation of chlorinated ethenes is inherently sustainable.
The converse of this definition also is true and is equally important. If biochemical processes are not present to trans-form contaminants, or if the available energy is not sufficient to complete this transformation, then the natural attenuation of chlorinated ethenes is inherently unsustainable. These defi-nitions of sustainable and nonsustainable natural attenuation are central to this report.
DDT—An Incomplete Waste-Substrate Cycle
In 1962, Rachel Carson published the book “Silent Spring” that described environmental damage caused by the unregulated use of pesticides such as DDT. This book, which marks the beginning of the modern environmental movement, showed how DDT was entering the food chain by agricultural spraying and was accumulating to harmful levels in some organisms. One example was the bioaccumulation of DDT in birds near the top of the food chain. In the case of bald eagles, DDT contributed to the production of fragile eggshells that tended to break during incubation of the eggs. This, in turn, nearly led to the extinction of bald eagles in the continental United States. If the use of DDT continued, Carson argued, then more bird species would be adversely affected and humans would be faced with the prospect of springtime in which there were no singing birds—a silent spring. Because “Silent Spring” has been so influential in the modern environ-mental movement, because DDT is a chlorinated compound, and because DDT was the first human-produced chemical to be banned for environmental reasons in the United States, it is useful to consider DDT in the context of natural attenuation and sustainability.
Dichlorodiphenyltrichloroethane (DDT) was originally developed during World War II as a treatment for body lice on humans. The bacterium Rickettsia prowazekii is part of the normal flora of the common body louse, and causes the disease typhus in humans. During World War II, unsanitary conditions led to the proliferation of lice in human popula-tions, and millions of people were threatened by typhus. DDT in powdered form is highly toxic to body lice and other insects. Because it is virtually insoluble in water, however, DDT can be applied externally to the skin in controlled amounts that are not toxic to humans. The introduction of DDT as a de-lousing agent in 1943 and later its use to con-trol malaria-spreading mosquitoes is estimated to have saved as many as 500 million human lives (National Academy of Science, 1970).
Figure �. Role of biochemical pathways such as glycolosis and the citric acid cycle in the carbon cycle.
Biological Cycles and the Nature of Sustainability �
The later use of DDT as an agricultural pesticide, however, a practice that began in the late 1940s, initiated the adverse environmental effects described by Rachel Carson and others. Specifically, DDT was not observed to degrade once it was released into the environment, and it accumulated in soils and aquatic sediments. In addition, fat-soluble DDT also tended to bioaccumulate as it was passed up the food chain, eventually reaching levels that could be harmful to birds and mammals. These adverse effects led to bans on DDT use, first in Sweden (1970) and then in the United States (1972).
One way to consider the observed behavior of DDT in the environment is in the context of sustainable natural attenua-tion. Even though DDT has not been used in the United States in 35 years, it remains a common contaminant of aquatic sedi-ments (Van Metre and Mahler, 2004). The reason DDT per-sists in the environment has to do with its chemical structure. The combination of two linked chlorinated phenols with a chlorinated ethane is a chemical structure not commonly found in nature. Consequently, biochemical mechanisms capable of cycling DDT to carbon dioxide and chloride have not evolved in natural ecosystems. Soil and sediment microorganisms are able to partially dechlorinate DDT to dichlorodiphenyldichlo-roethene (DDE) and then to dichlorodiphenyldichloroethane (DDD). But this process attacks only the chlorinated ethane portion of the DDT molecule and happens only under highly reducing conditions. Under the aerobic conditions charac-teristic of many agricultural soils, biochemical mechanisms are not present to transform DDT to innocuous products such as carbon dioxide and chloride (fig. 3). Consequently, DDT, DDE, and DDD commonly accumulate in the environment, in some cases reaching toxic levels. Because of the lack of DDT-transforming biochemical pathways, the natural attenuation of DDT in aerobic soils is by definition unsustainable.
The lack of sustainable DDT natural attenuation is due to the lack of specific chemical/biochemical mechanisms avail-able for transforming the waste. Equally important, however, is the case where transforming biochemical mechanisms are present, but where sufficient energy to complete the cycle is not available. An example of this behavior is given by highly chlorinated ethenes such as perchloroethene (PCE) and tri-chloroethene (TCE).
Chlorinated Ethenes in an Oxygenated Aquifer—An Incomplete Waste-Substrate Cycle
In the late 1970s, an unusually large number of children living in Woburn, Massachusetts, developed childhood leuke-mia, and several of these children eventually died. Painstaking investigation finally showed that the incidence of leukemia was associated with drinking water produced from two munic-ipal wells drilled into the underlying buried-valley aquifer (Harr, 1995). Analysis of the well water showed that it was contaminated by PCE and TCE. While both of these chemi-cals had been used for years as solvents and for dry cleaning,
few Americans had ever heard of them. Furthermore, the fact that these contaminants had migrated to Woburn’s municipal wells led many people to the logical assumption that PCE and TCE, like DDT, did not biodegrade in the environment. After all, PCE and TCE, like DDT, did not occur naturally in the environment and were manufactured exclusively by human chemical technology. Why would naturally occurring micro-organisms have the enzymatic capability to degrade chemicals like PCE and TCE?
But as the extent of ground-water contamination by chlorinated ethenes gradually was recognized in the early 1980s, it became apparent that other chlorinated ethenes such as dichloroethene (DCE) and vinyl chloride (VC) were often present in contaminated water. In many cases, these com-pounds were not present in the original contaminants, sug-gesting that DCE and VC were degradation products of PCE and TCE. Subsequent research established that PCE and TCE were subject to a variety of biodegradation processes includ-ing aerobic cometabolism (Wilson and Wilson, 1985) and anaerobic reductive dechlorination (Vogel and others, 1987). Later, it was also discovered that DCE and VC, the byproducts of reductive dechlorination, also were subject to both aerobic (Hartmans, 1995) and anoxic mineralization (Bradley and Chapelle, 1996).
Human-generated chemical wastes
Biochemical reduction
No biochemicalpathway
Incompletewaste–substratecycle
pc
Figure �. DDT as an example of an incomplete waste-substrate cycle.
� A Framework for Assessing the Sustainability of Monitored Natural Attenuation
Numerous naturally occurring biochemical pathways are now recognized to exist, and these pathways are capable of completely transforming chlorinated ethenes to innocuous byproducts such as carbon dioxide and chloride (fig. 4). Fur-thermore, these biochemical pathways appear to have evolved so that microorganisms can utilize natural chlorinated organic compounds that are ubiquitous in aquatic environments (Grim-vall, 1995; Bradley, 2000, 2003). While these naturally occur-ring biochemical pathways are not fully transferable to all human-produced chlorinated compounds (such as DDT), they are transferable to chlorinated ethenes. Thus, the first require-ment for a completed waste-substrate cycle—biochemical processes capable of transforming chlorinated ethenes to innocuous byproducts—has been met.
Establishing a waste-substrate cycle that is inherently sustainable, however, also requires the availability of energy. In the case of chlorinated ethenes such as PCE and TCE, this energy must be present in the form of organic carbon. Organic carbon acts as an electron donor in the metabolism of PCE and TCE, degrading microorganisms such as Dehalococcoides (DiStefano and others, 1991), in which PCE and TCE act as electron acceptors (fig. 4). The establishment of completed, sustainable waste-substrate pathways, therefore, requires the presence of sufficient chemical energy in the form of organic matter to drive the reductive dechlorination of PCE and TCE. When sufficient organic matter is available, chlorinated ethenes are subject to a completed waste-substrate cycle. Conversely, when sufficient organic matter is not available, the waste-substrate cycle cannot be completed, and chlorinated ethenes will persist.
This explains the persistence of PCE and TCE in the aquifer underlying Woburn, Massachusetts, and the subsequent transport of these chemicals to the municipal wells. The under-lying buried-valley aquifer consists of sands and gravels that were deposited by retreating glaciers at the end of the ice ages about 15,000 years ago. Partly because of the cold climatic conditions that prevailed at that time, and partly because the sediments have been extensively reworked by flowing water, these sands and gravels contain little natural organic carbon. The amount of available organic carbon present in this glacial aquifer, and thus the energy that is available, is not sufficient to drive reductive dechlorination. The most obvious indication of this is that ground water in the glacial outwash aquifer con-tains relatively high concentrations of dissolved oxygen. Thus, the flux of dissolved oxygen into the aquifer with recharging ground water exceeds oxygen consumption by carbon-utilizing heterotrophic bacteria. This, in turn, diverts available chemical energy away from chlororespiration resulting in the observed accumulation of PCE and TCE. Even though contaminant-transforming biochemical mechanisms may be present, the waste-substrate cycle for PCE and TCE is not completed in oxygenated systems because of the lack of available energy.
Chlorinated Ethenes in an Anoxic Aquifer— A Completed Waste-Substrate Cycle
Cases of environmental contamination such as Woburn, Massachusetts, where an incomplete waste-substrate cycle results in the exposure of humans to contaminants, are those that most often lead to adverse health affects in humans. Many other hydrologic systems, however, do contain sufficient organic matter to complete the waste-substrate cycle for PCE and TCE.
An example of this behavior was described at the Kings Bay Naval Submarine Base in southeastern Georgia (Chapelle and Bradley, 1998). This particular aquifer was deposited in a temperate marine environment that supported abundant photosynthesis, resulting in the deposition of large amounts of organic carbon. As is common in marginal marine sedi-ments, however, the distribution of this sedimentary organic carbon varies depending upon the sedimentary depositional environment. Beach sands, for example, typically are organic-matter poor since the action of wind and surf tends to remove sedimentary organic matter from them. Back-bay deposits, on the other hand, which are deposited in relatively quiet
Human-generated chemical wastes
Biochemical reduction
Biochemicalreduction
Biochemicaloxidation
Completewaste–substrate
cycle
Figure �. Biochemical cycling of chlorinated ethenes.
Biological Cycles and the Nature of Sustainability �
lagoons between barrier islands (beaches) and the mainland, commonly contain large amounts of organic matter. As these sedimentary units are deposited by prograding shorelines, organic-matter-poor barrier island sands are typically overlain by organic-matter-rich back-bay sediments. A photograph of an outcrop of the organic-matter-rich semiconfining bed, taken 2 miles from the Kings Bay site, is shown in figure 5. As rain-water percolates through the organic-matter-rich sediments and recharges the underlying beach-sand aquifer, dissolved oxygen is consumed. In addition, sedimentary organic matter can be partially dissolved and transported to the aquifer. The presence of dissolved organic matter and the absence of oxygen result in conditions favorable to reductive dechlorination and leads to efficient biodegradation of PCE at the Kings Bay site.
The Kings Bay site is an example of a system where the availability of energy in the form of sedimentary organic car-bon is sufficient to drive the chlorinated ethene waste-substrate cycle to completion (fig. 4). This completed waste-substrate cycle stands in marked contrast to organic-matter-poor systems such as Woburn, Massachusetts, where the amount of available organic matter is insufficient to drive the waste-substrate cycle to completion.
Figure �. Photograph of the organic-matter-rich semiconfining bed overlying the semiconfined aquifer.
Mass Balance, Energy Balance, and the Sustainability of Natural Attenuation
The different biodegradation patterns exhibited by chlo-rinated ethenes at the Woburn, Massachusetts, and the
Kings Bay, Georgia, sites illustrate how the sustainability of natural attenuation processes can differ in ground-water systems. In both systems, microorganisms with the capability of degrading chlorinated ethenes were present, although prob-ably in differing abundances. At one site (Woburn) the lack of energy to drive reductive dechlorination caused the preserva-tion and accumulation of TCE and PCE in ground water. In the other system (Kings Bay), sufficient energy was available to drive reductive dechlorination, and thus, natural attenuation has been sustained for at least 30 years. This, in turn, helped to restrict the migration of environmental contaminants and contributed to overall site remediation (Chapelle, Bradley, and Casey, 2005). Clearly, it is useful to distinguish hydrologic systems characterized by sustainable or unsustainable natural attenuation for chlorinated ethenes. Methods for making such distinctions can be derived from the twin principles of mass and energy balance.
� A Framework for Assessing the Sustainability of Monitored Natural Attenuation
Mass and Energy Balance
Some of the ways in which mass and energy balance affect the sustainability of MNA are illustrated in figure 6. The reality is that human activities lead to the production of wastes, and these wastes may be released to the environ-ment. Once released, wastes typically partition between soils, surface-water, and ground-water systems where they are subject to chemical and/or biochemical processes that (in some cases) transform these wastes to innocuous byproducts. If the rate of transformation equals or exceeds the rates of waste loading, then the natural attenuation processes have met the short-term criterion of sustainability (presence of chemi-cal/biochemical processes capable of detoxifying chemi-cal wastes). Conversely, if the rate of contaminant loading exceeds transformation rates, then the natural attenuation processes are by definition unsustainable. These different outcomes can be recognized by the degree of accumulation
or non-accumulation of wastes in the environment. Thus, the short-term requirement for sustainable natural attenuation can be recognized by mass balance considerations.
The sustainability of natural attenuation processes, however, does not end here. In addition to having chemi-cal/biochemical processes that transform wastes to innocuous byproducts, sufficient energy must be available in the system to drive these processes to completion. For the case of chlo-rinated ethenes, this energy must be provided by an external source of carbon. Furthermore, the energy provided by the organic carbon must not be diverted by competing biochemi-cal processes (such as oxygen-based respiration) away from contaminant-degrading processes. For petroleum hydrocar-bons, the waste itself provides the source of energy driving degradation. In this case, a supply of electron acceptors must be available to facilitate energy flow. In both cases, however, the long-term requirement for sustainable natural attenuation can be recognized by energy balance considerations (fig. 6).
Short-termuss tainability
Long-termuss tainability
Human activity
Chemical wastes released to environment
Figure �. Effect of mass and energy balance on the sustainability of natural attenuation.
Mass Balance, Energy Balance, and the Sustainability of Natural Attenuation �
Defining the sustainability of MNA in terms of mass bal-ance (short-term) and energy balance (long-term) immediately suggests ways for assessing the sustainability of MNA in dif-ferent hydrologic systems. First, documenting the accumulation or non-accumulation of particular wastes (is the contaminant plume stable, shrinking, or enlarging) in a hydrologic system addresses short-term sustainability. Secondly, it suggests that evaluating energy sources available to drive waste transforma-tion processes for the length of time required to fully transform contaminants addresses long-term sustainability.
Mass Balance in Contaminated Ground-Water Systems
The efficiency of natural attenuation can be defined in terms of a balance between the delivery to, and removal of, contaminants from ground-water systems by naturally occur-ring processes. This is most readily illustrated by considering the classic interaction between a contaminant source area, a dissolved plume emanating from the source area, and the attenuation of that plume (fig. 7). In most systems, contaminant mass in source areas is present in a variety of forms that include non-aqueous phase liquids (NAPL), chemically sorbed mass, or contaminant mass that has diffused into low-permeability clays, shales, or other rocks. Regardless of how it is stored, however, the con-taminant mass tends to dissolve from these sources, enters aqueous solu-tion, and forms plumes. The sum of the processes contributing dissolved contaminant mass to water (NAPL dissolution, desorption, diffusion) represents the contaminant load-ing component of the mass balance. Once formed, contaminant masses in plumes are subject to transport and natural attenuation processes that include advection (Ar), dispersion (Dr), biodegradation (Br), sorption (Sr), volatilization (Vr), and plant transpiration (Pr) processes. The sum of these dispersive and removal processes represents the natural attenuation capacity component of the mass balance.
This conceptualization illustrates how the balance between contami-nant loading and natural attenuation capacity determines the size of plumes, and thus their environmental impact. It may seem intuitively obvi-ous that low contaminant loading
will lead to the development of a small plume; however, high contaminant loading combined with a high natural attenua-tion capacity also can result in a relatively small plume. Thus, the overall size of a plume does not necessarily distinguish between cases of small contaminant loading and cases of large natural attenuation capacity. When a site is sufficiently well-instrumented so that the contaminant loading and natural attenuation capacity can be assessed by direct observation, these differences become evident.
Energy Balance in Contaminated Ground-Water Systems
The efficiency of natural attenuation processes also depends upon the energy balance of ground-water systems. Reductive dechlorination requires the transfer of electrons from electron donors such as organic carbon, to chlorinated ethenes or other chlorinated organic compounds. If sources of electrons are lacking in a system, or if available electrons
Figure �. Interaction between a contaminant source area, a dissolved plume, and natural attenuation.
� A Framework for Assessing the Sustainability of Monitored Natural Attenuation
are diverted away from chlorinated ethene reduction, natural attenuation will not be sustainable.
Examples of ways that energy flow in ground-water systems affects the transformation of chlorinated ethenes are illustrated in figure 8. As organic matter oxidizes, electrons are transferred to available electron acceptors such as oxygen, nitrate, chlorinated ethenes, manganese [Mn(IV)], ferric iron [Fe(III)], sulfate, or carbon dioxide. Because the electronega-tivity of these compounds differs, their efficiency as electron acceptors differs as well. Dissolved oxygen typically is the most efficient electron acceptor present in the environment, so microorganisms gain more energy coupling organic-matter oxidation to oxygen reduction than other electron acceptors. If oxygen is available, ambient microorganisms will preferen-tially use oxygen.
Once oxygen is consumed, a condition that is common in subsurface environments isolated from the atmosphere, nitrate is the next most efficient electron acceptor commonly available. Nitrate is followed, in succession, by solid man-ganese oxides, solid ferric oxyhydroxides, dissolved sulfate, and finally carbon dioxide (fig. 8). Highly chlorinated ethenes such as PCE and TCE, which contain highly electronegative chlorine, also are potential electron acceptors in contaminated ground-water systems. This chlororespiration produces DCE, VC, and ethene as daughter products.
The ecological succession of electron-accepting processes (fig. 8) channels the flow of electrons, and thus the flow of energy, in predictable ways. For example, if excess dissolved oxygen is available in an aquifer, oxygen will sequester much of the electron flow from organic-matter degradation, effec-tively short-circuiting reductive dechlorination and leaving
PCE and TCE largely untransformed. Conversely, if Fe(III), sulfate, or carbon dioxide are the predominant electron accep-tors present, PCE and TCE can intercept a portion of the overall electron flow. This, in turn, transforms PCE and TCE to DCE, VC, or ethene. The potential for transformation of PCE and TCE, therefore, depends both on a source of electron donors capable of supporting microbial metabolism, and condi-tions that allow chlorinated ethenes to intercept part of the overall electron flow. In other words, the sustainable transfor-mation of chlorinated ethenes depends upon the energy balance of the system.
Quantifying Mass and Energy Balance
There are two philosophically distinct, but equally use-ful, approaches to quantifying mass and energy balance
in ground-water systems. The first approach is empirical in nature and uses monitoring data to directly calculate the mass loading of contaminants to a system and the system’s natu-ral attenuation capacity. Similarly, the energy flow through a ground-water system can be empirically determined by evaluating the succession of electron-accepting processes. The second approach is deterministic in nature, quantifying mass and energy balance in terms of equations that describe the physics and biochemistry of a system. Both approaches have advantages and disadvantages. In practice, it is often useful to combine these approaches in order to address site-specific questions. These approaches can be illustrated using the Kings Bay site in Georgia as an example.
An Empirical Approach to Mass and Energy Balance
The empirical approach to contaminant mass balance (Chapelle, Campbell, and others, 2005) is illustrated in fig-ure 9. Given a well-characterized plume, the flux of contami-nants across a given cross-sectional transect of an aquifer can be estimated from the equation:
mass fluxtransect
= (Cave
) x (Q), (2)
where Cave
, is the average contaminant concentration (in micrograms per liter), and Q is the ground-water flux in units of length per unit time (LT-1). When this flux is summed over a given transect of the aquifer, it gives mass flux
transect in units
of mass per unit time (MT-1). The ambient natural attenuation capacity (NAC) of the system can then be quantified as the dif-ference in contaminant mass flux between two transects:
NAC = (Mass fluxtransect 1
) – (Mass fluxtransect 2
) . (3)
In this formulation, NAC is expressed in units of contaminant mass attenuated per unit time (MT-1).
Figure �. Ways in which energy flow in ground-water systems affects the transformation of chlorinated ethenes.
Quantifying Mass and Energy Balance �
In principle, this empirical approach also can be used to assess the energy balance of a system. The large number of potential electron donors and electron acceptors present in ground-water systems makes this a difficult problem. The observed succession of electron-accepting processes (fig. 8), however, provides a framework for distributing energy flow in a predictable way. Empirically, energy flow can be assessed by observing the consumption of different electron acceptors as ground water flows downgradient (fig. 9). The overall flux of energy to particular electron-accepting processes then can be assessed using equations 1 and 2.
The chief advantage of using the empirical mass-balance approach is that no a priori assumptions need be made about the processes contributing to contaminant loading, contami-nant attenuation, or the consumption of electron donors and acceptors. As a description of the present behavior of a system, therefore, the empirical approach is highly useful. Because the individual processes contributing to contaminant loading and natural attenuation are not explicitly considered, however, the
empirical approach cannot predict how a system will respond if conditions change at some point in the future. Thus, the utility of the empirical approach for assessing long-term questions, such as the sustainability of natural attenuation, is limited.
A Deterministic Approach to Mass and Energy Balance
Mass and energy balance in ground-water systems also can be quantified by considering the individual processes that deliver, transport, transform, partition, or sequester mass and energy in ground-water systems. Numerous processes includ-ing advection, hydrodynamic dispersion, sorption, and biodeg-radation affect the mass and energy balance of solutes being transported by ground-water flow (fig. 6). The deterministic approach uses mathematical equations to represent each indi-vidual process, and then sums the processes to obtain a set of coupled mass and energy balance equations. These equations
Figure �. The empirical approach to describing the mass balance of a system depends on site-specific monitoring data.
10 A Framework for Assessing the Sustainability of Monitored Natural Attenuation
then can be solved simultaneously to evaluate the interac-tions of contaminants, electron donors, and electron acceptors over time for a variety of specified environmental conditions. The chief advantage of this deterministic approach is that it provides time-dependent mass and energy balances which then can be used to assess how a system may respond if conditions change over time. This approach is well-suited, therefore, for assessing the long-term sustainability of natural attenuation.
In this report, the 3-dimensional Sequential Electron Acceptor Model (SEAM3D) was used to quantify mass and energy balance (Waddill and Widdowson, 1997). This model was selected because it explicitly calculates a mass balance for the amount of contaminant NAPL present in a system, and because it tracks the flow of energy from electron donors (organic carbon) and the various competing electron accepting processes. This, in turn, makes it possible to simultaneously track the dissolution of NAPL over time, and to couple the biotransformation of dissolved contaminant mass to the organic carbon and electron acceptors available in an aquifer. A detailed description of the SEAM3D code is provided in Appendix 1.
The description of SEAM3D given in Appendix 1 shows that, in order to use a deterministic approach for quantifying mass and energy balance at any given site, a large number of parameters describing NAPL dissolution, advective and dispersive transport of contaminants, biotransformation of contaminants, and the delivery and utilization of electron donors and acceptors are required. The model-building process begins with conceptualizing the hydrologic system, moves to estimating values for the various parameters required, and then constrains these estimated values by using available hydro-logic, geochemical, and microbiologic data. Once the model has been adequately constrained, it can be used to evaluate how the sustainability of natural attenuation in a particular hydrologic system responds to various environmental condi-tions over time.
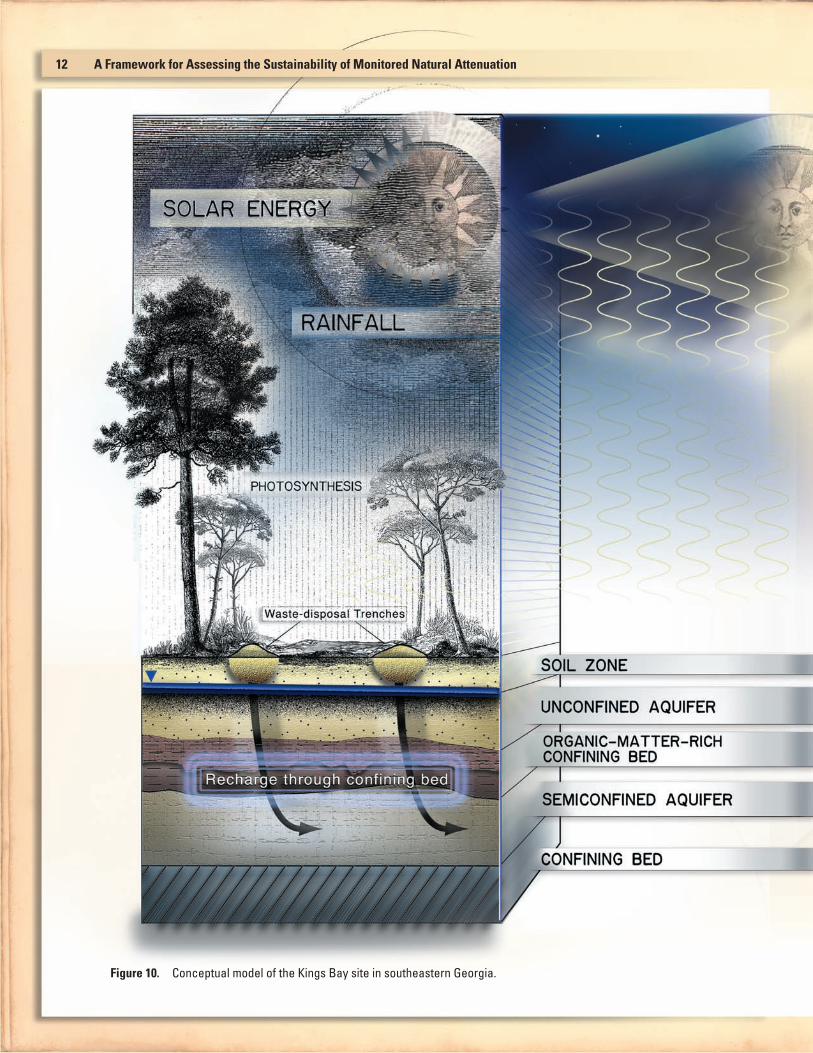
Conceptual Model of the Kings Bay Site
A conceptual model of the Kings Bay site, in southeast-ern Georgia, was developed from drilling logs and long-term monitoring data (fig. 10). The sediments underlying the site are of marginal marine origin and reflect the progradation of the shoreline over geologic time. Sediments exposed at land surface consist of fine- to medium-grained sands of wind-blown dune (aeolian) origin and range from 2 to 3 meters in thick-ness. Below these surface sands is a layer of organic-matter-rich sands and clays that record sedimentation in a back-bay lagoon environment. This organic-matter-rich layer is typically 3 meters thick and is areally extensive in the vicinity of the site. A photograph of this unit in outcrop, taken 2 miles from the site is shown in figure 5. Underlying the layer of organic-matter-rich sediments is another layer of fine- to medium-grained aeolian sand that ranges from 5 to 7 meters thick. This sandy layer is underlain by clayey sediments of marginal marine origin.
The hydrology of this site reflects the interaction of these geologic units. The sands exposed at land surface are relatively permeable and absorb most of the atmospheric precipitation that falls on the site. During precipitation, water saturates the sandy soil and percolates downward into the subsurface. For the first 2 or 3 meters of vertical flow, percolating recharge encounters soils and fine-grained quartz sands until it reaches the water table. The depth to the water table varies as much as 1 to 2 meters, depending on the amount of recent rainfall. Typ-ically, the water table resides in the sandy surface sediments above the organic-matter-rich layer. The organic-matter-rich layer is characterized by a lower hydraulic conductivity than the surface sands, but during and after rainfall, water moves downward through the organic-matter-rich layer, recharging the semiconfined aquifer beneath. The semiconfined aquifer has a higher hydraulic conductivity than the overlying organic-matter-rich layer, and ground-water flow changes from being predominantly vertical (in the organic-matter-rich layer) to horizontal (in the semiconfined layer). The semiconfined aqui-fer, therefore, acts as a regional “drain” moving recharge water from topographic highs near the landfill to discharge areas to the west (fig. 10).
During operation of the landfill (1978–1985), trenches were dug to a depth of about 8 feet, filled with municipal waste, and covered. Traces of these trenches are still visible at land surface (fig. 10). At some time during landfill opera-tion, PCE, probably waste from a dry-cleaning operation, was disposed of in the trenches. The relatively dense PCE moved downward through the soil, the organic-matter-rich confin-ing bed, and the semiconfined aquifer, finally pooling on the underlying confining bed. Horizontally flowing ground water dissolved the PCE, carrying it downgradient in the direction of a nearby housing subdivision. Because of the ambient anoxic conditions present in the semiconfined aquifer, PCE was subject to reductive dechlorination, transforming it to TCE, DCE, and VC. Each of these contaminants was subject to natural attenuation processes including advection, dispersion, sorption, and biodegradation, which tended to restrict expan-sion of the plume. In 1998, a series of observation wells were installed to delineate the areal extent of the plume (fig. 11). At that time, VC was observed 100 meters downgradient of the contaminant source area and impacted the nearby subdi-vision. Concentrations of chlorinated ethenes along the axis of the plume show that PCE and TCE predominated near the source area, and they were transformed to DCE and VC along the flowpath (fig. 12). Importantly, the VC concentration was observed to drop below detectable levels at the most downgra-dient well (KBA-11-37) although DCE was still detectable.
The observed patterns of chlorinated ethene biodegrada-tion in the semiconfined aquifer reflects the redox chemistry of the site (fig. 13). Ground water in the semiconfined aquifer, including ground water outside of the contaminant plume, is predominantly anoxic, and contains moderate concentrations of ferrous iron [Fe(II)], sulfide, and methane. This chemistry reflects the transport of recharge water through the organic-matter-rich confining bed (fig. 10), consumption of dissolved oxygen by aerobic microorganisms, and the establishment of
Quantifying Mass and Energy Balance 11
Figure 10. Conceptual model of the Kings Bay site in southeastern Georgia.
1� A Framework for Assessing the Sustainability of Monitored Natural Attenuation
anoxic conditions. Observed concentrations of dissolved iron and sulfide, as well as concentrations of hydrogen in the 0.3 to 2.0 nanomoles per liter (nM/L) range (fig. 13), indicate pre-dominantly sulfate-reducing and Fe(III)-reducing conditions in the semiconfined aquifer. The observed increase in methane concentrations may reflect methane generation in the organic-matter-rich semiconfined layer rather than active methano-genesis in the semiconfined aquifer itself. Near the landfill, sulfate-reducing conditions appear to predominate, and as ground water flows downgradient, Fe(III) reduction becomes increasingly predominant in the semiconfined aquifer.
The sulfate-reducing conditions near the source area facilitate the initial reduction of PCE and TCE to DCE and VC (fig. 12). Farther downgradient, however, the lack of measurable ethene concentrations in ground water suggests a net mineraliza-tion of DCE and VC. One possibility for this difference is that VC is reduced to ethene, which then mineralizes under anoxic condi-tions to CO
2. Another possible explanation is that VC is directly
mineralized to CO2 with no intermediate reductive step. Because
VC is less likely than DCE to undergo reduction, because VC is absent from the most downgradient ground water, and because DCE is present at low concentrations (about 10 micrograms per liter [µg/L]) in downgradient ground water, anoxic mineralization of VC is a possible mechanism at this site.
Constructing the Deterministic Model
The conceptual model of the Kings Bay site described previously (fig. 10) was used to construct a deterministic model of the site for the purpose of quantifying the mass and energy balance over time. The goals of this exercise included:
Quantifying the flux of electron donors and acceptors, including chlorinated ethenes, to the semiconfined aquifer and evaluating how this flux affects redox conditions and biodegradation processes.
Estimating the time required for the NAPL source to dis-solve and disperse, eliminating the contaminant plume. This provides an estimate of how long the plume can be expected to persist, and thus the length of time natural attenuation processes will need to be sustained into the future.
Quantifying the flux of dissolved organic carbon to the semiconfined aquifer, quantifying the mass of renewable (soil zone) and nonrenewable (organic-matter-rich confin-ing bed) sources of organic carbon in order to assess the long-term sustainability of natural attenuation at this site.
The deterministic mass- and energy-balance model was built in three steps. First, estimates of parameters describ-ing the geologic, hydrologic, and microbiologic conditions of the site were estimated and entered as initial input to the model. Secondly, these model parameters were constrained to reproduce observed rates of ground-water flow and observed redox conditions at the site. Thirdly, the mass of NAPL pres-ent in the semiconfined aquifer was constrained by comparing observed and simulated concentrations of dissolved chloride,
1.
2.
3.
Figure 11. Concentrations of vinyl chloride in the Kings Bay, Georgia, plume, November 1998.
0
500
1,000
1,500
2,000
2,500
3,000
3,500
0 25 50 100 125 150 175 200
DISTANCE ALONG FLOW PATH, IN METERS
PCE
TCE
DCE
VC
CON
CEN
TRAT
ION
S OF
CHL
ORIN
ATED
ETHE
NES
, IN
MIC
ROGR
AMS
PER
LITE
R
Figure 1�. Concentrations of chlorinated ethenes along the flowpath of the Kings Bay plume.
Observation well and vinyl chloride concentration, in micrograms per liter
EXPLANATION
0 25 50 METERS
0 50 100 150 200 FEET
GE
OR
GIA
STA
TE
RO
AD
SP
UR
40
FE
NC
E L
INE
FENCELINE
AtlantaStudyarea
Base modified from U.S. Geological Survey1:24,000-scale digital data
Quantifying Mass and Energy Balance 1�
Figure 1�. Concentrations of redox indicator parameters along the flowpath of the Kings Bay plume.
a realistic representation of the natural system. The large number of parameters involved makes it impossible to select a unique combination of parameters that describe the system. Given this challenge, the approach taken in this report was to constrain the parameter values using available hydrologic, microbiologic, and geochemical field data. The model was constrained in four steps:
Given observed water levels and aquifer-test estimates of hydraulic conductivity and porosity, the MODFLOW portion of the code was used to simulate rates of ground-water flow. Simulated rates of ground-water flow were then compared to observed rates of sulfate transport from a Fenton’s Reagent injection monitored for 6 years. The hydraulic conductivity and porosity values specified in the model were chosen to reproduce observed rates of ground-water flow.
The mass of NAPL in the contaminant source area initially was estimated by considering how much PCE might have been disposed of at the site. These estimates were refined by considering the observed distance of PCE transport downgradient from the source area, the distribution of chlorinated ethene daughter products, and observed concentrations of dissolved chloride produced from within the source area.
The areal recharge to the semiconfined aquifer was constrained by comparing the observed and simulated dilution of the chloride plume as it is transported down-gradient from the source area.
The transport of dissolved oxygen and organic carbon substrate to the semiconfined aquifer was constrained by comparing observed and simulated distribution of redox conditions, and by comparing observed and simulated concentrations of dissolved organic carbon.
Rates of Ground-Water FlowThe first step in obtaining a realistic mass balance of
a ground-water system is to have an accurate estimate of ground-water flow rates. These estimates are obtained by solv-ing the ground-water flow equation for appropriate boundary and initial conditions, and then applying Darcy’s equation to obtain ground-water velocity. In the SEAM3D code, these calculations are made by using the MODFLOW ground-water flow model. The hydrologic parameters used to simulate ground-water flow at this site are provided in Appendix 2. Initial estimates of these parameters were made from aquifer tests conducted at the site (Leeth, 1999), and were adjusted so that the observed head distribution at the site was reproduced by MODFLOW simulation. The observed head distribu-tion could be simulated by using constant-head nodes at the upgradient and downgradient boundaries to simulate lateral flow into and out of the system, assuming an areally constant value for hydraulic conductivity, and assuming a constant flux
1.
2.
3.
4.
1� A Framework for Assessing the Sustainability of Monitored Natural Attenuation
the final degradation product of chloroethene transformation. Finally, rates of dissolved chlorinated ethene biotransforma-tion were constrained by comparing observed and simulated concentrations of dissolved PCE, TCE, DCE, and VC.
The boundary conditions, hydrologic parameters, NAPL dissolution parameters, geochemical, redox, and microbial population parameters, and chlorinated ethene biodegradation parameters used in the SEAM3D simulations of this system are provided in Appendix 2.
Constraining the Mass-Balance Model
The large number of hydrologic, microbiologic, and geochemical parameters needed for the coupled set of mass-balance equations (Appendixes 1 and 2) solved by the SEAM3D code presents a significant challenge. Specifically, the parameter values must be adjusted so that the model gives
-0.5
0.0
0.5
1.0
0.2
0.4
0.6
0.8
1.0
1.2
00.51.01.52.02.5
0
0
1234567
DISTANCE ALONG THE FLOWPATH, IN METERS
0 20 40 60 80 100 120 140 160
0.5
1.0
1.5
2.0
2.5
DISS
OLVE
D OX
YGEN
DISS
OLVE
D IR
ONDI
SSOL
VED
SULF
IDE
(mill
igra
ms
per l
iter)
DISS
OLVE
D M
ETHA
NE
DISS
OLVE
D HY
DROG
EN(n
anom
oles
per
lite
r)
of vertical recharge to the aquifer from rainfall. While these hydrologic parameters yield a simulated head distribution that closely matched the observed head distribution, it does not follow that the simulated flux of water is representative of the system.
One way to constrain ground-water flow rates simulated by the model, which have a large affect on the simulated mass balance of the system, is to compare simulated and observed transport rates of a solute through the system. Because Fenton’s Reagent, a mixture of ferrous sulfate and hydrogen peroxide, was injected into the source area of this site in 1998, the transport of sulfate downgradient provides an estimate of ground-water travel time in the aquifer. Sulfate, which is subject to retardation, is not the ideal solute for this approach. Nevertheless, the observed breakthrough of sulfate in the downgradient wells can be used to constrain the simulated
flux of water through the model if sorption is considered. The breakthrough of sulfate at well KBA-11-13A, which occurred approximately 1.5 years after the injection, indicates a sulfate velocity of about 15 meters per year (fig. 14). The transport of a tracer, with a sorption coefficient appropriate for sulfate, was simulated with the model, and a hydraulic conductivity needed to match the observed sulfate velocity was identified (Appendix 2). The model, therefore, simulates a ground-water velocity comparable to what is observed in the field.
In addition to helping constrain rates of ground-water flow at the site, the arrival of Fenton’s Reagent-treated high- concentration sulfate water at well KBA-11-13A coincided with large declines in chlorinated ethene concentrations (fig. 14). This, in turn, shows that the Fenton’s Reagent treat-ment was effective in lowering contaminant concentrations at the source area.
Figure 1�. Concentration changes of (A) sulfate and (B) chlorinated ethenes over time at well KBA-11-13A from 1998 through 2004.
Quantifying Mass and Energy Balance 1�
1998 1999 2000 2001 2002 2003 2004 2005
TRIC
HLO
ROET
HEN
EA
ND
PERC
HLO
ROET
HEN
E(m
icro
gram
s pe
r lite
r)
0
10
20
30
40
50
60
70
DCE
(mic
rogr
ams
per l
iter)
0
100
200
300
400
500
TCEDCEPCE
B.
SULF
ATE
(mill
igra
ms
per l
iter)
0
200
400
600
800
1,000
1,200
1,400
1,600
1,800
VIN
YLCH
LORI
DE
(mic
rogr
ams
per l
iter)
0
20
40
60
80
100
SulfateVC
A. InitialFenton's Reagent
Injection
Areal Recharge to the Semiconfined Aquifer
The amount of areal recharge to the semiconfined aquifer was constrained by observed concentration changes of dissolved chloride in the plume. Near the contaminant source area at the first line of USGS observation wells, where chloroethene biodegradation is relatively incomplete, average chloride concentrations were 10.6 mg/L (fig. 15). Chloride concentrations increase at the second line of wells (to the west) to an average of 17.6 mg/L, reflecting the biotransforma-tion of chlorinated ethenes. Significantly, chloride concentra-tions decrease slightly at the third line of wells to an average of 14.5 mg/L. Model simulations that did not include areal recharge through the semiconfining bed indicated that chloride concentrations would continue to increase between the second and third line of wells. When areal recharge of low-chloride water to the aquifer was included, the observed downgradient dilution of the chloride plume could be reproduced. An areally constant value of recharge to the aquifer of 0.001 meter per day (m/d) per model cell (1 liter per day per 25 square meters [L/d/25 m2]) captured the observed downgradient dilution of the chloride plume.
Mass Balance of NAPL
The NAPL Dissolution Package of SEAM3D was used to simulate the dissolution of NAPL present at the site (Appendixes 1 and 2). Several lines of evidence were used to refine NAPL mass estimates. First, the distance that PCE was observed to move downgradient from the source area was captured over time at well KBA-11-13A. PCE was observed to reach well KBA-11-13A by the early 1980s at concentrations of about 20 µg/L, but by 1998, the PCE plume had regressed slightly back toward the source area (Southern Division, Naval Facilities Engineering Command, 2004). These data indicate that the dissolution of PCE over time has decreased and the size of the PCE plume was shrinking by 1998. The amount of NAPL placed in the modeled source area was constrained to reproduce the observed initial transport of PCE to well KBA-11-13A after 20 years of simulation, and to reproduce the subsequent recession of the PCE plume from that well.
Another line of evidence available to constrain the mass of NAPL initially present in the source area is observed concentrations of chloride near the source area. Since chloride is a final product of chloroethene degradation, the amount of chloride delivered to ground water is proportional to the mass of PCE dissolving and being transformed. At the Kings Bay site in 1998, observed concentrations of chloride at the first (most eastern) line of observation wells (near the plume source area) averaged 10.6 mg/L. At the second line of observation wells, chloride concentrations increased to 17.6 mg/L, reflect-ing the overall biodegradation of chlorinated ethenes (fig. 15). The final step in constraining the amount of NAPL present in the source area was to adjust the parameters to reproduce the observed chloride plume.
The mode of landfill operation suggests that between one and ten 55-gallon barrels of NAPL were released at the site. Table 1 shows the sensitivity of simulated chloride concentrations at the second line of wells to different assumed masses of NAPL. When two-thirds of a 55-gallon barrel of
Figure 1�. Observed chloride concentrations in ground water at the Kings Bay site, November 1998.
Table 1. Observed sensitivity of simulated chloride concentrations to a non-aqueous phase liquid (NAPL) mass.
[kg, kilogram; g/g, gram per gram; mg/L, milligrams per liter]
Simulated NAPL mass in each of three source
area model cells (kg)
Simulated NAPL mass in each of
three source area model cells
(g/g)1
Simulated chloride concentration increase at the second line of
observation wells (mg/L)
477 0.010 9
373 0.008 8
187 0.004 7
94 0.002 61Assumes cell volume of 25 cubic meters.
1� A Framework for Assessing the Sustainability of Monitored Natural Attenuation
15.615.0
KBA-37
9.414.2
17.5
15.0
17.2
10.610.7
10.610.5
2014.8
18.5
10.5
KBA-37
Observation well and chloride concentration, in milligrams per liter
Monitoring well and number
EXPLANATION
0 25 50 METERS
0 50 100 150 200 FEET
GEO
RG
IA S
TATE
RO
AD S
PUR
40
FEN
CE
LIN
E
FENCELINE
AtlantaStudyarea
Base modified from U.S. Geological Survey1:24,000-scale digital data
PCE (187 kg) was simulated in each of the three source area model cells (CN= 0.004 g/g), the resulting increase in chloride was approximately 7 mg/L.
For a specified CN (NAPL mass in grams of NAPL per gram of sediment) of 0.008 g/g, the simulated chloride increase was 8 mg/L, and for a CN of 0.010 g/g, the chloride concentration increase was 9 mg/L. Because the observed increase in chloride concentration was approximately 8 mg/L, a value of 0.008 g/g was assigned to each source area node in the constrained model. This simulated NAPL mass is equiva-lent to about four 55-gallon barrels of PCE in the source area. This was simulated by assigning a NAPL mass of 373 kg of PCE to each of three source-area model cells. Because of the uncertainty associated with NAPL mass, however, simulations designed to estimate times of remediation used a range of NAPL estimates.
Mass Balance of Electron Donors and Acceptors
SEAM3D is designed specifically to track the sequential utilization of electron acceptors in ground-water systems. The code uses inhibition functions (Appendix 1) to specify the sequential utilization of electron acceptors in the order oxy-gen > chlorinated ethenes > Fe(III) > sulfate > carbon dioxide coupled to the oxidation of dissolved organic carbon. If dis-solved oxygen is available (greater than 1 mg/L), the oxida-tion of organic carbon is coupled stoichiometrically to oxygen reduction. SEAM3D also considers solid ferric oxyhydroxides present in aquifer sediments as an electron acceptor. Thus, once oxygen has been consumed, oxidation of organic carbon is coupled to solid ferric hydroxides. The product of this reac-tion, dissolved ferrous iron [Fe(II)], is then tracked as a solute. Once solid ferric hydroxides have been depleted, oxidation of organic carbon switches to sulfate, and finally to carbon diox-ide (fig. 8). These features enable the user to simulate electron flow between electron donors (organic carbon) and available electron acceptors, and thus, to quantify the energy balance of a system.
SEAM3D simulations then were used to evaluate the energy balance for the Kings Bay site. Once estimates for the amount of areal recharge entering the aquifer were constrained by the observed dilution of chloride along the flowpath, differ-ent concentrations of dissolved organic carbon were assigned to vertically percolating recharge, simulating the transport of car-bon from the soil zone and the organic-matter-rich beds overly-ing the aquifer. In addition, recharging water was specified to contain various concentrations of electron acceptors in order to simulate the distribution of energy between available electron acceptors. Concentrations of solid ferric hydroxides present in the aquifer matrix were varied between 50 and 100 micrograms per gram (µg/g). The model was constrained by reproducing the observed distribution of redox processes at the site. This included simulated dissolved oxygen concentrations less than 0.2 mg/L, sulfate-reducing conditions near the landfill grad-ing to Fe(III)-reducing conditions downgradient, and dissolved organic carbon concentrations of approximately 2 mg/L.
Mass Balance of Dissolved Chlorinated Ethenes
The last step in constraining the mass-balance model was to adjust the Monod kinetic parameters for reductive dechlori-nation of chlorinated ethenes, and the direct oxidation of VC, in order to reproduce the observed 1998 concentrations of dis-solved chlorinated ethenes. This was done on a trial and error basis, and began with comparing the observed and simulated distribution of the PCE plume near the source area. Once the PCE plume was adequately reproduced, attention turned to the TCE plume, then to DCE, and finally to VC. The most difficult part of this procedure was to reproduce the observed behavior of the DCE and VC plumes. Monitoring data show that the DCE plume extended farther downgradient then the VC plume. This observed pattern could not be reproduced by considering reductive dechlorination to be the only ongoing biodegrada-tion process. Because VC is produced from DCE by reductive dechlorination, it was not possible to adjust the parameters so that the DCE plume was longer than the VC plume. Microcosm experiments conducted with aquifer material from the Kings Bay site indicate that VC is subject to a combination of reduc-tive dechlorination and anoxic mineralization (Bradley, 2003). For this reason, kinetic parameters for the anoxic mineraliza-tion of VC were included in the model. This, in turn, allowed the reproduction of the observed DCE and VC plume configu-rations. The final simulated and observed 1998 distributions of PCE, TCE, DCE, and VC are shown in figure 16.
Assessing the Sustainability of Natural Attenuation
After the model was constrained, SEAM3D was used to assess the sustainability of natural attenuation at the Kings Bay site. This sustainability depends upon the mass balance between contaminant loading and attenuation, the delivery of dissolved organic carbon needed to transform the contami-nants, and the sequestration of energy from organic carbon between competing electron-accepting processes. These issues of mass and energy balance can be quantitatively assessed using the deterministic model.
One approach for assessing sustainability is to use the model to illustrate how possible future changes in site condi-tions may affect contaminant behavior. This approach utilizes the time-dependent nature of the mass and energy balance equations that comprise the model, and can suggest ways of managing the site over time so as to maximize the sustain-ability of natural attenuation. The sustainability of MNA at the Kings Bay site was assessed in several ways.
The dissolution of NAPL and the size of the resulting chlo-rinated ethene plume were simulated over time to estimate the length of time needed for natural processes to deplete the contaminant source and remediate the plume. This, in turn, provided an estimate of the time frame over which natural attenuation processes would need to be sustained.
1.
Quantifying Mass and Energy Balance 1�
The removal of the NAPL source was simulated to estimate the length of time needed for the contaminant plume to degrade once its source was gone. This provided estimates of the minimum time frame over which natural attenuation processes would need to be sustained.
The flux of dissolved oxygen and dissolved organic carbon to the aquifer was varied to estimate the minimum delivery of organic carbon needed to sustain reductive dechlorination over time.
2.
3.
The minimum flux of dissolved organic carbon required to sustain reductive dechlorination was compared to renewable and nonrenewable sources of organic carbon to assess the long-term sustainability of MNA at the site.
The effects of ferric oxyhydroxide concentrations in aquifer sediments on the sustainability of VC-degrading processes over time.
4.
5.
KBA-11-18 KBA-11-18
KBA-11-18
KBA-PS-03
KBA-PS-03
KBA-PS-03
KBA-PS-03
KBA-11-10B
KBA-11-10B
KBA-11-10B
KBA-11-10B
KBA-11-03B
KBA-11-03B
KBA-11-03B
KBA-11-03B
5.75004.75003.75002.75001.75000.7500
5.75004.75003.75002.75001.75000.7500
5.75004.75003.75002.75001.75000.7500
5.75004.75003.75002.75001.75000.7500
GS-14 GS-14
GS-13
GS-12
GS-11
GS-10
GS-9
GS-8
KBA-11-18GS-14
GS-13
GS-12
GS-11
GS-10
GS-9
GS-8
GS-13
GS-12
GS-11
GS-10
GS-9
GS-8
GS-14
GS-13
GS-12
GS-11
GS-10
GS-9
GS-8
GS-7
GS-6
GS-5
GS-4
GS-7
GS-6
GS-5
GS-4
KBA-PDA-08
GS-7
GS-6
GS-5
GS-4
KBA-PDA-08
KBA-PDA-08
GS-7
GS-6
GS-5
GS-4
KBA-PDA-08
GS-3GS-2
GS-1
GS-15
GS-3GS-2
GS-1
GS-15
GS-3GS-2
GS-1
GS-15
GS-3GS-2
GS-1
GS-15
Source1Source2Source3
Source1Source2Source3
Source1Source2Source3
Source1Source2Source3
PCE TCE
DCE VC
MT3D BC Symbols
EXPLANATION
Point source/sink
MODFLOW BC SymbolsConstant head
0 25 50 METERS
0 50 100 150 200 FEET
Base modified from U.S. Geological Survey1:24,000-scale digital data
Figure 1�. Simulated and observed 1998 concentrations of chlorinated ethenes.
1� A Framework for Assessing the Sustainability of Monitored Natural Attenuation
NAPL Dissolution and Time of RemediationAssessing the sustainability of MNA requires an estimate
of how long reductive chlorination processes will need to be sustained over time. One way to estimate this is to consider the length of time needed for a NAPL source to dissolve and for the resulting plume to disperse. Simulations allowing the estimated mass of NAPL present in the system, as constrained by available hydrologic and geochemical data, were performed in order to make these estimates. Because the mass of NAPL emplaced in the aquifer is subject to uncertainty, a range of NAPL masses were simulated in each of three source-area cells ranging from 187 kg (two-thirds of a 55-gallon barrel) to 467 kg (one and two-thirds of a 55-gallon barrel). For these simulations, the time of remediation (TOR) was defined when concentrations of VC dropped below 5 µg/L throughout the model domain. The results of these simulations are summa-rized in table 2.
The estimated TORs from these simulations ranged from a minimum of 100 years to more than 500 years. These results indicate that TOR at this site—assuming that the NAPL is left in place and allowed to dissolve over time—will be greater than 100 years. Thus, in the absence of engineered NAPL removal actions, it is reasonable to conclude that MNA will have to be sustained at this site for approximately 300 years.
NAPL Removal and Time of Remediation
Guidance from the U.S. Environmental Protection Agency (1999) states that “monitored natural attenuation can be selected as a remediation alternative when the timeframe is reasonable compared to other remediation technologies.” The Georgia Department of Environmental Protection, the State agency responsible for environmental regulation at the Kings Bay site, concluded that any remedial strategy that would take longer than 50 years was not “reasonable” and could not be accepted. As a result, the U.S. Navy began considering other strategies for remediating the Kings Bay site. The technology selected was in situ oxidation using Fenton’s Reagent injec-tion. Accordingly, in December 1998, a series of Fenton’s Reagent injections were performed and a monitoring program
was initiated to assess the behavior of the contaminant plume after treatment with Fenton’s Reagent.
The waste-removal action was simulated in SEAM3D by instantly removing the NAPL after 20 years of simulation (at 1998) and simulating the subsequent collapse of the contami-nant plume. Because monitoring data following source area removal are available at this site, it is possible to compare simulated and measured chloroethene concentrations. Simu-lated and measured VC concentrations for 2004, which are shown for comparison in figure 17, are generally similar. The model was then used to simulate the length of time needed for VC concentrations to decline below 2 µg/L throughout the plume. Based on this approach, the estimated time of remedia-tion was approximately 14 years following Fenton’s Reagent treatment which corresponds to the year 2012.
These two TOR estimates—for the case of no NAPL removal and for the case of NAPL removal—indicate that natural attenuation processes would need to be sustained for at least 100 years if NAPL were not removed, and approximately 14 years if the NAPL were removed. In practice, the option to not remove the NAPL is moot since Fenton’s Reagent treat-ment has already occurred. Nevertheless, the model can be used to illustrate how different environmental conditions may affect the sustainability of MNA in this system.
Qualitatively, the sustained reductive dechlorination of chlorinated ethenes depends upon the establishment of anoxic conditions, at least to Fe(III) reduction, allowing part of the electron flow to be captured by chlororespiration (fig. 8). The SEAM3D model described in this report can be used to illus-trate how the interaction of dissolved oxygen and dissolved organic carbon present in recharging ground water affects the establishment of anoxic conditions.
The conceptual model of the Kings Bay site (fig. 10) assumes that dissolved oxygen and dissolved organic carbon are delivered to the semiconfined aquifer by areal recharge. The actual delivered concentrations of these species, however, is uncertain. By varying the concentrations of dissolved oxy-gen and organic carbon being delivered to the aquifer in the SEAM3D model, it is possible to illustrate the effects of these species on redox conditions and chlorinated ethene biodegra-dation in the system.
During the model-constraining procedure, the most real-istic comparison between simulated and measured redox con-ditions and chlorinated ethene biodegradation was achieved using concentrations of 5 mg/L dissolved oxygen [0.156 mil-limoles per liter (mM/L)] and 5 mg/L dissolved organic carbon (0.167 mM/L) in recharging water, which reflect the stoichi-ometry of oxygen consumption
O2 + CH
2O → CO
2 + H
2O
Table �. Estimated times of remediation for different non-aqueous phase liquid (NAPL) masses.
[kg, kilogram; g/g, gram per gram; >, greater than]
Simulated NAPL mass in each of three source
area model cells (kg)
Simulated NAPL mass in each of
three source area model cells
(g/g)1
Estimated time of remediation
(years)
467 0.010 >500
373 0.008 500
280 0.006 160
187 0.004 1001Assumes cell volume of 25 cubic meters.
Quantifying Mass and Energy Balance 1�
and the slightly greater molar concentration of dissolved organic carbon relative to oxygen. The short-term requirement for the sustainability of MNA for chlorinated ethenes is that the molar ratio of dissolved oxygen (DO) to organic carbon (both dissolved and particulate; DOC) delivered to the aquifer be less than 1. As a result,
DO(mol/L)STSR(dimensionless)= 1DOC(mol/L)
< , (4)
where STSR may be called the “short-term sustainability ratio” and concentrations of DO and DOC are expressed in molar units. When STSR is less than 1, anoxic conditions develop and the flow of energy proceeds toward the biodeg-radation of chlorinated ethenes. Conversely, when STSR is greater than 1, oxic conditions develop and the flow of energy is diverted away from chloroethene biodegradation.
The effects of the dissolved oxygen/dissolved organic carbon (DO/DOC) ratio on the sustainability of MNA at Kings Bay can be illustrated using model simulations. When the DO/DOC ratio (in units of milligrams per liter) in areal recharge was low (1/5 mg/L), then redox conditions were more reduc-ing and the size of the simulated PCE plume was correspond-ingly small (fig. 18), reflecting active chlororespiration. When the DO/DOC ratio was increased to 5/5, conditions remained anoxic, but more electron flow was sequestered by sulfate and Fe(III) reduction relative to chlororespiration and the simulated size of the PCE plume increased. When oxic conditions were established by simulating a DO/DOC ratio of 5/1, simulated
DOC concentrations declined below 1 mg/L. This further decreased the energy flow toward chlororespiration and caused the size of the simulated PCE plume to expand (fig. 18).
The most basic, short-term requirement for sustaining MNA for chlorinated ethenes, therefore, is that the molar flux of organic carbon to a system exceeds the molar flux of dis-solved oxygen. At the Kings Bay site, this requirement for the short-term sustainability of MNA is met.
Available Organic Carbon and Dissolved Organic Carbon Flux: Long-Term Sustainability
Given estimates of DOC flux to the semiconfined aquifer, a flux sufficient to maintain short-term MNA for chlorinated ethenes, it becomes possible to address the long-term sustain-ability of MNA as well. Qualitatively, if the amount of available organic carbon (AOC) present in the system is large relative to the flux of DOC needed to sustain anoxic conditions, then MNA will be more sustainable in the long term. Conversely, if the amount of AOC is small relative to the DOC flux, then MNA will be less sustainable. The results of the SEAM3D simulations, which give estimates of the DOC flux, make it pos-sible to evaluate the ratio between DOC flux and AOC.
For each model grid block (5 m x 5 m), the areal recharge rate is 0.001 m/d (1 L/d). Assuming this recharge contains 5 mg/L of dissolved organic carbon, the DOC flux to the aquifer from each model cell is 5 mg/d. This flux can be compared to the pool of organic carbon present in the soil zone and organic-matter-rich confining bed overlying the aquifer (fig. 10).
335
127
<1
12837
3
<1
61
<1
<1 <1
<1151
11149
0 25 50 METERS
0 50 100 150 200 FEET
GEO
RG
IA S
TATE
RO
AD S
PUR
40
FEN
CE
LIN
E
FENCELINE
AtlantaStudyarea
26.726.3
<1
<1<1
4.4
<1
<1
106
<1
<1<1
6.6
25.52.8
<1 <1
GEO
RG
IA S
TATE
RO
AD S
PUR
40
FEN
CE
LIN
E
FENCELINE
Approximate extent of theFenton’s Reagent Treatment
Approximate extent of theFenton’s Reagent Treatment
A. B.
1
Vinyl chloride plume
Observation well and vinyl chloride con- centration, in micro- grams per liter
EXPLANATION
Base modified from U.S. Geological Survey1:24,000-scale digital data
Figure 1�. The (A) simulated and (B) measured 2004 concentrations of chlorinated ethenes following source-area removal in 1998.
�0 A Framework for Assessing the Sustainability of Monitored Natural Attenuation
The most basic measure of the organic carbon content of soils and sediments is weight loss on ignition (LOI). Because much of the combustible organic carbon indicated by LOI is not bioavailable, however, it is not an appropriate measure of available organic carbon. Methods for directly measuring organic carbon content and extractable bioavailable organic carbon are available (Rectanus and others, 2005); these methods were used to estimate AOC at the Kings Bay site. The results of these analyses indicate considerable variability in the amount of organic carbon present (table 3). In general, soil-zone sediments have the least amount of organic carbon, and the organic-mat-ter-rich confining bed has the most. These estimates for the amount of extractable bioavailable organic carbon present in the sediments overlying the semiconfined aquifer make it possible to evaluate the ratio of DOC flux to the amount of AOC.
The 2-m thickness of sandy soil and sediments at land surface (fig. 10) has a bioavailable organic carbon content of approximately 500 mg/kg (table 3). Given the volume of each model grid block (5 m x 5 m x 2 m) and a bulk density of 1.85 x 10³ kg/m3, the resulting sediment mass in each block is 9.3 x 10⁴ kg. Furthermore, given the measured concentra-tion of bioavailable organic carbon in the sediment (500 mg/kg), the sediment contains on the order of 4.7 x 10⁷ mg of potentially metabolizable organic carbon. The 3-meter-thick organic-matter-rich confining bed overlying the aquifer can be treated in the same manner. Given a grid block volume of 5 m x 5 m x 3 m and a measured concentration of bioavailable organic matter of 5,000 mg/kg, the resulting mass of poten-tially metabolizable organic carbon is 6.9 x 10⁸ mg. In other words, the organic-matter-rich confining bed contains approxi-mately an order of magnitude more bioavailable organic carbon than the soil zone. The sum of potentially available organic carbon in the soil zone and in the organic-matter-rich confining bed at the Kings Bay site is on the order of 7.4 x 10⁸ mg per 125 m3, or 5.9 x 10⁶ mg/m3.
If it is assumed that DOC is continually delivered to the aquifer by vertically percolating recharge at a concentration of 5 mg/d per model cell of aquifer, the ratio of potentially avail-able carbon to the flux of DOC to the aquifer is:
LTSR(yr/m AOC(mg/mFluxofDOC(mg/yr)
33
) )= , (5)
where LTSR (in units of years per meter cubed of sediment) may be termed the “long-term sustainability ratio” for the MNA of the system. Ideally, the LTSR would quantify the length of time organic carbon in a given volume of aquifer can sustain the DOC flux needed to maintain MNA. In practice, however, the physics and chemistry of DOC mobilization are far too complex to make this estimate quantitative. On the other hand, it is clear that when the LTSR is large, the long-term sustainability of MNA at a site will be proportionally large. Conversely, when the LTSR is small, the sustainability of MNA will be small.
Figure 1�. Simulated 1998 PCE concentrations for DO/DOC ratios of 1/5, 5/5, and 5/1. All ratios are in milligrams per liter.
Quantifying Mass and Energy Balance �1
1/5 DO/DOC ratio
5/5 DO/DOC ratio
5/1 DO/DOC ratio
GS-14GS-13
GS-12GS-11
GS-10GS-9
GS-8
GS-14GS-13
GS-12GS-11
GS-10GS-9
GS-8
GS-14GS-13
GS-12GS-11
GS-10GS-9
GS-8
GS-7
GS-6
GS-5
GS-4
KBA-PDA-08
GS-3GS-2
GS-1
GS-15
GS-7
GS-6
GS-5
GS-4
KBA-PDA-08
GS-7
GS-6
GS-5
GS-4
KBA-PDA-08
GS-3GS-2
GS-1
GS-15
Source1Source2Source3
Source1Source2
Source3
Source1Source2
Source3
KBA-PS-03
KBA-PS-03
KBA-PS-03
KBA-11-10B
KBA-11-10B
KBA-11-10B
KBA-11-03B
KBA-11-03B
KBA-11-03B
KBA-11-18
KBA-11-18
KBA-11-18
5.75004.75003.75002.75001.75000.7500
5.75004.75003.75002.75001.75000.7500
5.75004.75003.75002.75001.75000.7500
MT3D BC Symbols
EXPLANATION
Point source/sink
MODFLOW BC SymbolsConstant head
0 25 50 METERS
0 50 100 150 200 FEET
Base modified from U.S. Geological Survey1:24,000-scale digital data
In the case of the Kings Bay site, the LTSR is:
LTSR= 5.9 10 mg/m
365mg/yr=1.6 10 yr/m
6 34 3´
´ ´ . (6)
This relatively large LTSR value illustrates that the amount of AOC in the system is large relative to the flux of DOC needed to sustain MNA. This, in turn, provides an explanation for the observed sustainability of MNA at the Kings Bay site for at least 20 years, and indicates that MNA could be sustained virtually indefinitely in this system.
Short-Term and Long-Term Sustainability
This analysis, which is based on simulations using a deterministic mass-balance model, indicates that the “sustain-ability” of MNA for chlorinated ethenes includes distinct short- and long-term components. The interaction of these components is illustrated in figure 19. When the short-term sustainability ratio (DO/DOC) is large, and the long-term sustainability ratio (AOC/DOC flux) is small, oxic conditions develop and MNA for chlorinated ethenes will be inherently unsustainable. When the STSR decreases below 1, anoxic con-ditions will develop and MNA will be sustainable for at least the short term. If the LTSR is too small, however, the amount of organic carbon may be insufficient to sustain MNA over the long term. When the STSR is small and the LTSR is large, MNA for chlorinated ethenes will be sustained over the long term. The threshold value of the LTSR needed to insure long-term (greater than 300 years) sustainability is not presently known. On the basis of this study, however, a value on the order of 104 yr/m3 may be sufficient to meet the requirements of long-term sustainability.
Electron Acceptor Depletion and Sustainability
The simulations of PCE transport shown on figure 18 indicate that a high DO/DOC ratio (relatively reducing condi-tions) serves to limit the extent of the PCE plume as would be intuitively expected. Sometimes, however, model simula-tions can reveal behavior that is less intuitively obvious. For example, model simulations indicate that over relatively long timeframes (about 80 years), VC concentrations do not follow the pattern observed for PCE (fig. 18). Figure 20 shows simu-lated VC concentrations for different DO/DOC ratios. In this case, however, both highly reducing (DO/DOC ratio of 1/5) and oxic (DO/DOC ratio of 5/1) conditions were smaller than the intermediate (5/5 DO/DOC ratio) condition. For the highly reducing case, reductive dechlorination was capable of restrict-ing VC transport, and thus the smaller VC plume. Similarly, under oxic conditions, oxic mineralization of VC restricted VC transport. For the intermediate condition, however, the amount of Fe(III) supporting anoxic mineralization of VC became limiting, which caused the VC plume to expand.
The simulations shown in figure 20 are probably not a realistic representation of the system as it now exists. Because of the Fenton’s Reagent injection, a large amount of Fe(III) has been added to the system. Much of the previous sulfate-reducing portion of the plume (near the source area) is in fact now dominated by Fe(III) reduction as a result of the added ferric iron. Model simulations that increased the amount of Fe(III) present in the system prevented the increased size of the VC plume for the 5/5 ratio of DO/DOC shown in figure 20. Nevertheless, these simulations illustrate that the sustain-ability of MNA for chlorinated ethenes in general, and for VC in particular, may be subject to electron-acceptor limitations in addition to electron-donor limitations. As a result, these electron-acceptor limitations also should be considered in evaluations of sustainability.
Short-termsustainability ratio
Long-termsustainability ratio
Dissolved oxygen
UnsustainableMNA
Short-termsustainable,
andlong-term
unsustainableMNA
Short-termand
long-termsustainable
MNALarge Small
Small Large
Dissolved organic carbon
Available organic carbonDissolved organic carbon flux
Ratio
Ratio
Figure 1�. Diagram showing the short- and long-term components of the sustainability of monitored natural attenuation (MNA).
�� A Framework for Assessing the Sustainability of Monitored Natural Attenuation
Table �. Organic carbon content of Kings Bay sediments.
[mg/kg, milligrams per kilogram; —, not determined]
Organic-matter-rich confining bed, cored samples at well USGS-9
1 5,800 3,600 400 ± 170
2 4,500 — 400 ± 11
3 4,600 — 130 ± 1
4 — — 1,100 ± 115
5 — — 300 ± 19
Mean 5,000 ± 700 3,600 2,300 ± 1201 Loss in weight of pre-dried samples after 8 hours at 400°C.
2 Elemental carbon analysis by catalytic combustion at 900°C.
3 Extractable bioavailable organic carbon, mean is sum of five extractions shown.
Quantifying Mass and Energy Balance ��
Figure �0. Simulated 2050 VC concentrations for DO/DOC ratios of 1/5, 5/5, and 5/1. All ratios are in milligrams per liter.
1/5 DO/DOC ratio
5/5 DO/DOC ratio
5/1 DO/DOC ratio
GS-14
GS-13
GS-12GS-11
GS-10
GS-9
GS-8
GS-14
GS-13
GS-12
GS-11
GS-10
GS-9
GS-8
GS-14
GS-13
GS-12
GS-11
GS-10
GS-9
GS-8
GS-7
GS-6
GS-5
GS-4
KBA-PDA-08
GS-3GS-2
GS-1
GS-15
GS-7
GS-6
GS-5
GS-4
KBA-PDA-08
GS-7
GS-6
GS-5
GS-4
KBA-PDA-08
GS-3GS-2
GS-1
GS-15
GS-3GS-2
GS-1
GS-15
Source1Source2
Source3
Source1Source2Source3
KBA-PS-03
KBA-PS-03
KBA-PS-03
KBA-11-10B
KBA-11-10B
KBA-11-10B
KBA-11-03B
KBA-11-03B
KBA-11-03B
KBA-11-18
KBA-11-18
KBA-11-18
5.75004.75003.75002.75001.75000.7500
5.75004.75003.75002.75001.75000.7500
5.75004.75003.75002.75001.75000.7500
XX
X
Source1Source2Source3
0 25 50 METERS
0 50 100 150 200 FEET
MT3D BC Symbols
EXPLANATION
Point source/sinkNAPL point source/sink
MODFLOW BC SymbolsConstant head
Base modified from U.S. Geological Survey1:24,000-scale digital data
Conclusions
The sustainability of monitored natural attenuation (MNA) for any site and for any contaminant depends upon (1) the
presence of chemical/biochemical processes capable of cycling contaminant(s) to innocuous byproducts, and (2) the availability of sufficient energy to drive these transformations to completion (fig. 6). By this definition, the example of the Kings Bay site meets all of the criteria for both short- and long-term sustainability of MNA for chlorinated ethenes. First, biochemical processes are in place (reductive dechlorination, VC oxidation) that transform chlorinated ethenes to innocu-ous byproducts. Secondly, sufficient energy exists in the form of organic carbon capable of driving these transformations to completion over the timeframe required (about 14 years).
The sustainability of natural attenuation for chlorinated ethenes can be quantitatively assessed by considering the mass and energy balance of ground-water systems. Such mass and energy balances can be made by using either empirical or deterministic methods. But regardless of the methods used, it is necessary to:
Quantify the flux of ground water moving through the sys-tem. Any assessment of mass and energy balance is highly sensitive to ambient rates of ground-water flow, and it is important for this parameter to be highly constrained.
Delineate the mass and distribution of chlorinated ethenes and/or NAPL present in the system. A true mass balance cannot be achieved without estimates of contaminant mass. While such estimates are difficult to make and are subject to considerable uncertainty, the sustainabil-ity of MNA cannot be assessed without them. A variety of methods are available for making these estimates. Given an estimated mass of NAPL present, it is possible to estimate the time of remediation (TOR) needed for a contamination to completely disperse.
Quantify the mass and flux of available electron accep-tors, especially dissolved oxygen, being delivered to the system. Oxygen can divert electron flow from chlorinated ethene reduction; understanding the dynamics of electron-acceptor delivery to the system is fundamental to quanti-fying MNA sustainability.
Quantify the mass and flux of available organic carbon. Microbially utilizable organic carbon in soil and aquifer sediments can be estimated using sediment-extraction procedures. Similarly, measurements of dissolved organic carbon provide an estimate of carbon mass present in the aqueous phase.
Assess the interaction of electron donors and acceptors. The short-term sustainability of MNA for chlorinated ethenes requires that the molar ratio of dissolved oxygen to dissolved organic carbon to a system be less than 1. The long-term sustainability of MNA requires that the
1.
2.
3.
4.
5.
ratio of available organic carbon in a system be large relative to the flux of organic carbon needed to maintain anoxic conditions.
The importance of sustainability when assessing MNA has only recently been identified as an important issue in envi-ronmental remediation (Newell and Aziz, 2004). The frame-work outlined in this report provides methods for assessing and quantifying the sustainability of MNA for chlorinated ethenes.
References
Alexander, Martin, 1994, Biodegradation and bioremediation: San Diego, Academic Press, 302 p.
Bradley, P.M., 2000, Microbial degradation of chloroethenes in groundwater systems: Hydrogeology Journal, v. 8, no. 1, p. 104–111.
Bradley, P.M., 2003, History and ecology of chloroethene biodegradation—A review: Bioremediation Journal, v. 7, no. 2, p. 81–109.
Bradley, P.M., and Chapelle, F.H., 1996, Anaerobic mineral-ization of vinyl chloride in Fe(III)-reducing, aquifer sedi-ments: Environmental Science and Technology, v. 30, no. 6, p. 2084–2086.
Carson, Rachel, 1962, Silent spring: Boston, Riverside Press, 368 p.
Chapelle, F.H., and Bradley, P.M., 1998, Selecting remedia-tion goals by assessing the natural attenuation capacity of groundwater systems: Bioremediation Journal, v. 2, no. 3, p. 227–238.
Chapelle, F.H., Bradley, P.M., and Casey, C.C., 2005, Behavior of a chlorinated ethene plume following source-area treat-ment with Fenton’s Reagent: Ground Water Monitoring and Remediation, v. 25, no. 2, p. 131–141.
Chapelle, F.H., Bradley, P.M., Lovley, D.R., O’Neill, Kathleen, and Landmeyer, J.E., 2002, Rapid evolution of redox pro-cesses in a petroleum hydrocarbon-contaminated aquifer: Ground Water, v. 40, no. 4, p. 353–360.
Chapelle, F.H., Campbell, B.G., Looney, B.B., Wiedemeier, T.H., and Sink, C.H., 2005, Empirical and deterministic methods for assessing monitored natural attenuation, in Proceedings of the In Situ and On-Site Bioremediation Eighth International Symposium, Baltimore, Md., June 6–9, 2005: Battelle Press.
Davis, J.W., and Carpenter, C.L., 1990, Aerobic biodegrada-tion of vinyl chloride in groundwater samples: Applied and Environmental Microbiology, v. 56, no. 12, p. 3878–3880.
�� A Framework for Assessing the Sustainability of Monitored Natural Attenuation
References ��
DiStefano, T.D., Gossett, J.M., and Zinder, S.H., 1991, Reduc-tive dechlorination of high concentrations of tetrachloro-ethene to ethene by an anaerobic enrichment culture in the absence of methanogenesis: Applied and Environmental Microbiology, v. 57, no. 8, p. 2287–2292.
Fetter, C.W., 1988, Applied hydrogeology (2d ed.): New York, Merrill Publishing Company, p. 68.
Grimvall, Anders, 1995, Evidence of naturally produced and man-made organohalogens in water and sediments, in Grim-vall, Anders, and de Leer, E.W.B., eds., Naturally-produced organohalogens: Boston, Kluwer Academic Publishers, p. 3–20.
Harr, Jonathon, 1995, A civil action: New York, Random House, 500 p.
Hartmans, S., 1995, Microbial degradation of vinyl chloride, in Singh, V.P., ed., Biotransformations—microbial degrada-tion of health-risk compounds: New York, Elsevier Science, p. 239–248.
Leeth, D.C., 1999, Hydrogeology of the surficial aquifer in the vicinity of a former landfill, Naval Submarine Base Kings Bay, Camden County, Georgia: U.S. Geological Survey Water-Resources Investigations Report 98-4246, 28 p.
Maymo-Gatell, Xavier, Chien, Y.T., Gossett, J.M., and Zinder, S.H., 1997, Isolation of a bacterium that reductively dechlorinates tetrachloroethene to ethene: Science, v. 276, p. 1568–1571.
National Academy of Science, 1970, Committee on Research in the Life Sciences of the Committee on Science and Pub-lic Policy.
National Research Council, 2000, Natural attenuation for groundwater remediation: Washington, D.C., National Academy Press, 274 p.
Newell, C.J., and Aziz, C.E., 2004, Long-term sustainability of reductive dechlorination reactions at chlorinated solvent sites: Biodegradation, v. 15, no. 6, p. 387–394.
Rectanus, H.V., Widdowson, M.A., Novak, J.T., and Chapelle, F.H., 2005, Method development for quantifying potential bioavailable organic carbon in sediments, in Proceedings of the Third European Bioremediation Conference, Chania, Crete, Greece, July 4–7, 2005.
Southern Division, Naval Facilities Engineering Command, 2004, Electronic Administrative Record and Index, Southern Division Naval Facilities Engineering Command, Charles-ton, South Carolina, 45 p.
U.S. Department of Energy, 2002, Alternative project plan for technology development, accelerated risk reduction through innovative remediation of chlorinated ethenes using moni-tored natural attenuation: U.S. Department of Energy, Office of Environmental Management.
U.S. Environmental Protection Agency, 1998, Technical proto-col for evaluating natural attenuation of chlorinated solvents in ground water: Washington, D.C., U.S. Environmental Protection Agency, Office of Research and Development, EPA/600/R-98/128, p. 232.
U.S. Environmental Protection Agency, 1999, Use of moni-tored natural attenuation at Superfund, RCRA corrective action, and underground storage tank sites, Final: U.S. Envi-ronmental Protection Agency, Office of Solid Waste and Emergency Response, Directive Number 9200.4-17P, 32 p.
Van Metre, P.C., and Mahler, B.J., 2004, Contaminant trends in reservoir sediment cores as records of influent stream quality: Environmental Science and Technology, v. 38, no. 11, p. 2978–2986.
Vogel, T.M., Criddle, C.S., and McCarty, P.L., 1987, Transfor-mations of halogenated aliphatic compounds: Environmen-tal Science and Technology, v. 21, no. 8, p. 722–736.
Vogel, T.M., and McCarty, P.L., 1985, Biotransformation of tetrachloroethylene to trichloroethylene, dichloroethylene, vinyl chloride, and carbon dioxide under methanogenic conditions: Applied and Environmental Microbiology, v. 49, no. 5, p. 1080–1083.
Waddill, D.W., and Widdowson, M.A., 1997, SEAM3D—A numerical model for three-dimensional solute transport and sequential electron acceptor-based bioremediation in groundwater: Virginia Polytechnic Institute and State Uni-versity Final Technical Report, prepared for the U.S. Army Corps of Engineers.
Wiedemeier, T.H., Rifai, H.S., Newell, C.J., and Wilson, J.T., 1999, Natural attenuation of fuels and chlorinated solvents in the subsurface: New York, John Wiley and Sons, 617 p.
Wiedemeier, T.H., Swanson, M.A., Moutoux, D.E., Wilson, J.T., Kampbell, D.H., Hansen, J.E., and Haas, P., 1996, Overview of the technical protocol for natural attenuation of chlorinated aliphatic hydrocarbons under development for the U.S. Air Force Center for Environmental Excellence: EPA/540/R-96/509, p. 35–59.
Wilson, J.T., and Wilson, B.H., 1985, Biotransformation of trichloroethylene in soil: Applied and Environmental Micro-biology, v. 49, no. 1, p. 242–243.
The SEAM3D code uses mathematical representations of contaminant loading and attenuation processes, and sums
them in order to provide a quantitative mass and energy bal-ance. Advection refers to dissolved mass carried by flowing ground water, and is proportional to the velocity of ground-water flow v [LT-1] and the change of concentration mass [ML-3] over a particular distance, x [L-1]:
-¶¶
v Cx
.
This advective term, therefore, has units of mass con-centration per unit time [ML-3T-1]. The dispersion of dissolved mass in flowing ground water is proportional to a scale- dependent constant, the coefficient of dispersion (D) [L2T-1], and the second derivative of the concentration gradient:
2
2
CDx
¶¶
.
Again, the units of this term are mass concentration per unit time [ML-3T-1]. Sorption refers to the distribution of a mass between the aqueous and adsorbed phases and can be described by the term:
b dK Cn t
r ¶-
¶,
where ρb is the average bulk density of aquifer solids [ML-3];
n is aquifer porosity (dimensionless); and Kd is a distribution
coefficient describing solute partition between the adsorbed and dissolved state [L3M-1]. The units of this term are also in mass concentration per unit time [ML-3T-1].
The microbial transformation of electron donors and acceptors is evaluated by summing the effects of microbial colonies inhabiting the ground-water system on substrates and electron acceptors (EA). For each substrate degraded by microbial population x, the sink term is
, ,
bio xsink ls x ls
x
MR rq
=å , (1.1)
where θ is the effective porosity (dimensionless); Mx is the
microbial biomass concentration [MbL
pm-3] for x = 1,2….NM
(number of microcolonies); and rx,ls
is the utilization rate of substrate ls in microbial population x where the units of this term are in mass concentration per unit time [M
lsM
b-1T-1]. For
each electron acceptor, the sink term is
, ,
bio xsink le x le
x
MR rq
=å . (1.2)
The utilization of each substrate within microbial popula-tion x is described by the equation
, , ,x ls x ls le
le
r n=å , (1.3)
where , ,x ls len is the specific rate of substrate utilization for microbial population x growing on substrate ls and electron acceptor le. Similarly, utilization of each electron acceptor follows
rx le x ls le x ls lels
, , , , ,=åg n , (1.4)
where , ,x ls leg is the electron-acceptor use coefficient [M
leM
ls-1]. Finally, Monod kinetics are used to describe
substrate and electron-acceptor utilization
max, , , , ,
__ _
, , ,
ls lex ls le x ls le x le li
se
x ls le x le lels
S E N I
K EK S
n n
- -é ù é ùê ú ê úê ú ê úê ú= ê úê ú ê úê ú ê ú++ê ú ê úë ûë û
, (1.5)
where max, ,x ls len is the maximum specific rate of substrate utili-
zation for microbial population x growing on substrate ls and electron acceptor le [M
lsM
b-1T-1]; , ,
sx ls leK is the half-saturation
constant for substrate ls for utilization of electron acceptor le [M
lsL-3]; ,
ex leK is the effective half-saturation constant for
electron acceptor le [MleL-3]; and
_
lsS and _
leE are the effec-tive concentrations of substrate ls [M
lsL-3] and electron accep-
tor le [MleL-3], respectively, (defined as the difference between
the aqueous phase concentrations and minimum concentra-tions below which biodegradation ceases).
The model code, SEAM3D, uses inhibition functions to simulate the preferential utilization of electron acceptors in the order O
2 > NO
3 > Mn(IV) > Fe(III) > SO
4 > CO
2, an order that
corresponds to the decreasing free energy available to micro-organisms from each reaction. When concentrations of oxygen are above a given threshold (about 0.5 mg/L), the model inhibits the oxidation of competing electron acceptors using a function ,le liI defined by
, 1le liI = for le=1, (1.6)
and
1,
, _1,
lele li
le li lile li li
IE
k
k
-
=
é ùê úê ú= Pê ú+ê úë û
for le = 2, 3, 4, 5, or 6, (1.7)
Appendix 1. Description of the Deterministic Model ��
Appendix 1. Description of the Deterministic Model
where ,le lik is the electron-inhibition coefficient [MleL-3], rep-
resenting inhibition of electron acceptor le by electron accep-tor li. Thus, the model is able to simulate the order of electron-acceptor utilization observed in natural systems (fig. 8).
Finally, the rate of dissolution of the NAPL mass
,NAPLSource lsR can be formulated in terms of the maximum con-
centration of a solute in equilibrium with a NAPL of given composition ( eq
lsC ) as given by Raoult’s law:
( )eq solls ls lsC f C= , (1.8)
where lsf is the mole fraction of the solute and sollsC is the
solubility of the solute, and the actual concentration at any given point in space (C
ls) is:
, ( )NAPL NAPL eqSource ls ls lsR k C C= - , (1.9)
where kNAPL is the NAPL dissolution rate constant (T-1). This gives ,
NAPLSource lsR in units of contaminant concentration per unit
time [ML-3T-1].The individual processes that affect any particular solute
in ground-water systems, including hydrodynamic dispersion, advection, sorption, and biodegradation, and NAPL dissolution then can be summed giving an explicit mass balance governing the transport of any particular solute. In the case of chlorinated ethenes, the general mass-balance equation may be written:
where S
ls is the aqueous phase chlorinated ethene
concentration [MlsL-3] for ls=1,2,...,NS
(number of individual chlorinated ethenes);
*lsS is the chlorinated ethene point-source
concentration [MlsL-3];
vi is the average pore-water velocity [LT-1];
xi is distance [L];
Dij is the tensor for the hydrodynamic dispersion
coefficient [L2T-1];
,biosink lsR is a biodegradation sink term dependent on
the mode of respiration [MlsL-3T-1];
,NAPLsource lsR is a term associated with non-aqueous phase
liquid (NAPL) dissolution [MlsL-3T-1];
Rls is the retardation factor for chlorinated ethene
ls [Lo]; t is time [T]; θ is aquifer porosity [Lo]; and q
s is the volumetric flux of water per unit
volume of aquifer [T-1] with qs > 0 for
sources and qs < 0 for sinks.
In the same manner, mass-balance equations can be written for dissolved organic carbon serving as electron donors in the system, and for the various soluble and insoluble compounds serving as electron acceptors. This set of coupled equations then can be solved simultaneously to assess electron donor oxidation coupled to electron acceptor reduction, and thus the flow of energy through the system.
�� A Framework for Assessing the Sustainability of Monitored Natural Attenuation
*, ,
bio NAPLls ls s lsi ij ls sink ls source ls ls
i i j
S S q Sv D S R R Rx x x t
¶ ¶ ¶¶¶ ¶ ¶ q 
æ ö÷ç ÷ç- + + - + =÷ç ÷÷çè ø, (1.10)
Figure 2.1. Map showing location of SEAM3D model area and boundary conditions ........................31
Appendix �. Parameters Used to Simulate the Kings Bay Site
ContentsBoundary Conditions and Hydrologic Parameters .................................................................................31Solute Transport Parameters: The Dispersion Package .......................................................................31Sources of Dissolved Chlorinated Ethenes: The NAPL Dissolution Package ...................................32Geochemical and Redox Parameters: The Biodegradation Package ................................................32Chlorinated Ethene Transformation Parameters: The Reductive Dechlorination Package ............33Sorption Parameters: The Chemical Reaction Package .......................................................................34
Tables 2.1. Hydrologic and dispersion parameters used in the SEAM3D model .................................31 2.2. Initial conditions, concentrations at the landfill boundary, and recharge
concentrations for electron donors, electron acceptors, tracer, and biodegradation end products ...................................................................................................32
2.3. Initial concentration of microbial populations and biodegradation parameters for four terminal electron-accepting processes ...................................................................33
2.4. Initial concentration of PCE/TCE and DCE/VC degraders and kinetic reductive dechlorination parameters for the simulated chlorinated ethenes ...................................34
2.5. Biodegradation parameters for net mineralization of DCE and VC ....................................34 2.6. Stoichiometric conversion factors for reductive dechlorination .......................................35 2.7. Sorption parameters for mobile constituents ........................................................................35
Boundary Conditions and Hydrologic Parameters
The site was modeled with one layer representing a semi-confined aquifer to which a non-aqueous phase liquid
(NAPL) source had been delivered (fig. 10). The conceptual-ization shown in figure 10 was translated into a deterministic model by applying the Basic Transport, Advection, Disper-sion, NAPL Dissolution, Source-Sink, Chemical Reaction, Biodegradation, and Reductive Dechlorination Packages of the SEAM3D model code. The steady-state flow field is constructed to represent the long-term average flow conditions at the site of the contamination in order to test the concept of monitored natural attenuation with SEAM3D over multi-decade time scales. Thus, the finite-difference grid is site specific with 20 columns and 40 rows with cell dimensions of 5 m by 5 m (an area of 20,000 m2, shown on figure 2.1). The upgradient and downgradient boundaries were simulated as constant-head boundaries to match the observed head gradient across the plume in the semiconfined aquifer. The upgradient boundary is near a ground-water divide identified previously at the site (Leeth, 1999) and is treated as a constant head based on the average head at this boundary. The downgradi-ent boundary was placed in the housing subdivision where water-level fluctuations are buffered by the presence of several small ponds. The lateral boundaries were placed perpen-dicular to observed lines of equal hydraulic head at the site, which is consistent with their treatment as no-flow boundar-ies. The water-table aquifer above the semiconfined aquifer was not actively simulated; however, the effect of recharge to the underlying semiconfined aquifer was simulated using the Source-Sink Package of SEAM3D.
SEAM3D uses the steady-state flow field created by MODFLOW, given concentration initial conditions and bound-ary conditions for the reactive transport model. A constant value of hydraulic conductivity (10 m/d) was assigned for the MODFLOW model based on estimates derived from aquifer tests conducted at the site (Leeth, 1999). The site-specific flow model is simplified; the average flow through the site is constrained by using the average known gradient across the site (commonly referred to as Darcy velocity); however, the pore velocity is determined by dividing the Darcy velocity deter-mined by MODFLOW by the porosity. A constant porosity of 0.3 was applied in the model. The site-specific effective poros-ity is unknown (Leeth, 1999), so the value of 0.3 was selected as representative of the type of sediments encountered at the site (Fetter, 1988). A specific storage (0.0001 1/meter) and specific yield (0.1 dimensionless) were assigned (table 2.1) based on estimates made from aquifer tests at the site (Leeth, 1999).
In the Source-Sink Package of SEAM3D, recharge to the semiconfined aquifer was simulated using areally constant val-ues, and recharge was considered to contain constant concen-trations of the electron acceptors dissolved oxygen (5 mg/L) and sulfate (10 mg/L). In addition, areal recharge was con-sidered to contain dissolved organic carbon mobilized from the soil zone and from the organic-matter-rich layer overlying the semiconfined aquifer (table 2.2). Because the amount of areal recharge delivered to the semiconfining aquifer was not directly measured, rates of electron acceptor-bearing recharge to the aquifer were adjusted as the model was constrained.
Solute Transport Parameters: The Dispersion Package
Given the ground-water velocity flow field generated by the MODFLOW-computed hydraulic gradient and an
assigned porosity, the dispersion coefficient is calculated from the assigned dispersivity (5.0 m) and the ratio of transverse to longitudinal dispersivity (0.01). The effective molecular diffusion coefficient, which for sites dominated by advective ground-water flow is typically much less than the dispersion, was set to 5.0 x 10⁻⁵ m2/d (table 2.1).
Figure �.1. Location of SEAM3D model area and boundary conditions.
Table �.1. Hydrologic and dispersion parameters used in the SEAM3D model.
[m/d, meter per day; m, meter; m2/d, square meter per day]
Model parameter Model inputHydraulic conductivity 10 m/d
Porosity 0.3
Specific storage 0.0001 1/meter
Specific yield 0.1 (dimensionless)
Longitudinal dispersivity 5.0 m
Transverse dispersivity 0.05 m
Molecular diffusion coefficient 5.0 x 10⁻⁵ m2/d
Appendix �. Parameters Used to Simulate the Kings Bay Site �1
KBA-11-18
GS-14GS-7
GS-3GS-2
GS-1
GS-15
GS-6
GS-5
GS-4
GS-13
GS-12
GS-11
GS-10
5.75004.75003.75002.75001.75000.7500
GS-9
GS-8
KBA-PDA-08
KBA-PS-03 KBA-11-10B
KBA-11-03B
Source1Source2Source3
MT3D BC Symbols
EXPLANATION
Point source/sink
MODFLOW BC SymbolsConstant head
0 25 50 METERS
0 50 100 150 200 FEET
Base modified from U.S. Geological Survey1:24,000-scale digital data
Sources of Dissolved Chlorinated Ethenes: The NAPL Dissolution Package
An important capability of the SEAM3D code is that it includes a NAPL Package designed to simulate the disso-
lution and mobilization of chlorinated ethenes from the NAPL present in the contaminant source area. This feature, when combined with the Biodegradation and Reductive Dechlorina-tion Packages, allows simulation of a global mass balance that includes mineral and dissolved electron acceptors, dissolved organic carbon substrate, and the dissolution and natural attenuation of chlorinated ethenes. This capability, in turn, makes it possible to estimate times of remediation associated with NAPL dissolution, and thus, to assess the sustainability of natural attenuation.
The SEAM3D model allows NAPL dissolution to be con-ceptualized by assigning a given NAPL mass ( NC in grams per gram) to model cells according to the equation
/N N
cell b cellC M Vr= , (2.1)
where NcellM mass of NAPL is assigned to each model cell
(g); Vcell
is the volume of the cell (∆x x∆y x NAPL thick-ness); and br (g/m3) is the sediment bulk density. SEAM3D then partitions the soluble components of the NAPL into the aqueous phase at each time step depending on the contaminant mass fraction of the NAPL, the molecular weight, solubility, rates of ground-water flow, and a NAPL dissolution constant. Depending on the amount of dissolution, the model then recal-culates the amount of remaining NAPL for the next time step.
NAPL at the site was considered to contain both PCE (molecular weight of 166; solubility of 150 mg/L; initial mass fraction of 0.15) and TCE (molecular weight of 131; solubil-ity of 1,100 mg/L; initial mass fraction of 0.01). These two contaminants were considered to coexist with an inert fraction of NAPL with a molecular weight of 150, and an initial NAPL
dissolution rate constant of 0.01 d-1. This rate constant was cho-sen primarily because it is sufficiently fast so that hydrologic (rate of ground-water flow) and chemical (solubility) condi-tions would determine the overall rate of NAPL dissolution.
Estimating the mass of NAPL originally emplaced in an aquifer is necessary to make a true mass balance of the system. At the Kings Bay site, eyewitness accounts of waste-disposal practices are available, although written records of how much waste was disposed are not available. One eyewitness account recalled that the waste-disposal trenches were dug with a backhoe to a depth of between 6 and 8 feet, trucks delivering municipal waste filled the trenches, and the backhoe then cov-ered the trenches with sand. Apparently, drums of PCE waste were disposed of in this fashion. Given the waste-disposal practices employed, the measured size of the PCE source areas (Chapelle and Bradley, 1998) and the approximate concentra-tions of PCE measured in the source area place some con-straints on the mass of NAPL emplaced. Nevertheless, because of the inherent uncertainties associated with estimating NAPL mass, a range of values was simulated.
Based on an approximate 5- by 15-m area of the source zone (75 m2), a thickness of affected aquifer of 1 m, measured concentrations of PCE ranging between 1 and 10 milligrams per gram (mg/g) of sediment, and a sediment bulk density of 1.85 x 10⁶ g/m3 suggest that between 280 and 2,800 kg of PCE were disposed of at the site. Because one 55-gallon barrel of PCE weighs about 280 kg, one could assume that between 1 and 10 barrels of waste PCE were disposed of at this site. Assuming that one barrel of PCE is assigned to each source-area model cell ( N
cellM = 280,000 g), that a cell area is 25 m2, a NAPL thickness is 1 m, and the br is 1.85 x 10⁶ g/m3, the
NC calculated from equation 2.1 would be 0.006 g/g. These estimates were used as the starting point for assigning an amount of PCE NAPL in the modeled source area, and then were refined as the model was constrained with available hydrologic and geochemical data.
Geochemical and Redox Parameters: The Biodegradation Package
Redox conditions at the Kings Bay site have previously been shown to be dominated by Fe(III) reduction and
sulfate reduction. Four redox processes (oxygen reduction, Fe(III) reduction, sulfate reduction, and methanogenesis) were incorporated into the SEAM3D simulation of the site. All of these electron-accepting processes were coupled to the oxida-tion of a soluble electron donor (dissolved organic carbon of oxidation state zero and a molecular weight of 32). To activate these processes in the model, the species oxygen, sulfate, Fe(II), and methane were defined so that SEAM3D would write a mass-balance equation for each species. SEAM3D is designed to consider Fe(III) reduction occurring with solid-phase Fe(III) oxyhydroxides. Near the landfill, where sulfate-reducing conditions were observed, the Fe(III) content of aquifer material was set to zero. Downgradient, where Fe(III)- reducing conditions were observed, the Fe(III) content of
Table �.�. Initial conditions, concentrations at the landfill boundary, and recharge concentrations for electron donors, electron acceptors, tracer, and biodegradation end products.
[mg/L, milligram per liter; O2, dissolved oxygen; Fe(III), ferric iron; SO
Cl 0.0 0.0 0.0(1) Unit for Fe(III) is milligrams per gram.
�� A Framework for Assessing the Sustainability of Monitored Natural Attenuation
aquifer materials was set to an initial value of 50 micrograms per kilogram (µg/kg). This value was based on measurements of Fe(III) made in a shallow coastal-plain aquifer with similar hydrology to that of Kings Bay (Chapelle and others, 2002). SEAM3D computes a mass balance on Fe(III) for each time step as Fe(III) reduction occurs over time, allowing the amount of Fe(III) present in the system to decrease as Fe(III) reduc-tion proceeds. This feature makes it possible to assess how the consumption of Fe(III) in the system affects the sustainability of natural attenuation.
A large number of parameters are required by SEAM3D in order to simulate the biodegradation of dissolved organic carbon coupled to the sequential reduction of oxygen, Fe(III), sulfate, and carbon dioxide. These include specifying the density of aerobic, Fe(III)-reducing, sulfate-reducing, and methanogenic microorganisms (grams per cubic centimeter); specifying the inhibition coefficients directing sequential uti-lization; specifying product generation coefficients for Fe(II) and methane; specifying Monod half-saturation constants for each electron-accepting process coupled to dissolved organic carbon (substrate) utilization; and specifying Monod maxi-mum utilization rate constants for each electron-accepting process. The problem was simplified by assuming that the microbial population is at steady state (rate of death equals rate of growth). The parameter values used to build the biodeg-radation package in the model are shown in table 2.3.
Chlorinated Ethene Transformation Parameters: The Reductive Dechlorination Package
The transformation of chlorinated ethenes was simulated within SEAM3D by assigning Monod kinetic parameters
(equation 1.5), which describe reductive dechlorination for each species. In addition, the anaerobic oxidation of VC was simulated. At the Kings Bay site, ethene, the final degrada-tion product of reductive dechlorination, is generally below detectable levels (0.01 mg/L), although occasional detections (about 0.1 mg/L) have been noted. If reductive dechlorination
to ethene were the only biodegradation process occurring, then ethene concentrations should be on the order of 1,000 µg/L for much of the plume. There are two possible explanations for this discrepancy. First, VC may be reduced to ethene, which is then rapidly mineralized to carbon dioxide, preventing the accumulation of ethene in solution. Secondly, VC may be directly mineralized to carbon dioxide (Bradley, 2000). The occasional detections of ethene show that a component of VC reduction to ethene occurs at the site; however, the observation that DCE (the source of VC) is transported farther downgradi-ent than VC indicates that VC is subject to anoxic mineral-ization as well. The SEAM3D code is capable of simulating both reductive and oxidative transformation of all chlorinated ethenes. At the Kings Bay site, reductive dechlorination was simulated for all four chlorinated ethenes, and anoxic mineral-ization was simulated only for VC.
The Monod kinetic parameters used to simulate chlori-nated ethene transformation at the Kings Bay site are shown in table 2.4. Half-saturation constants (K) and maximum rates of substrate uptake (v) for each reductive process were assigned. Only VC was considered subject to anoxic mineralization. Thus, half-saturation constants for direct mineralization of PCE, TCE, and DCE were set to zero, and a finite value was assigned for VC mineralization coupled to Fe(III) reduction.
The sequential reduction of PCE, TCE, DCE, and VC was simulated by assigning inhibition factors for each process. Since oxygen reduction strongly inhibits the reduction of all chlorinated ethenes, the inhibition factors for oxygen were set relatively low (table 2.5). Conversely, because electron- accepting processes such as Fe(III) reduction, sulfate reduc-tion, and methanogenesis are not observed to inhibit reductive dechlorination (Bradley, 2000), the inhibition concentrations are assigned larger values. Finally, the stoichiometric conver-sion factors for the various products of chlorinated ethene reduction, which allow model output in units of milligrams per liter, are shown in table 2.6.
Table �.�. Initial concentration of microbial populations and biodegradation parameters for four terminal electron-accepting processes.
[O2, oxygen; Fe(III), ferric iron; SO
4, sulfate; g m-3, grams per cubic meter; d-1, 1/day; g g-1, gram per gram]
Methanogens 0.025 0.01 10.0 N/A 0.0 N/A 0.20 10.0 25.0 1.0(1) Units for inhibition coefficients are in milligrams per liter, except for Fe(III), which is in milligrams per gram.
Appendix �. Parameters Used to Simulate the Kings Bay Site ��
Sorption Parameters: The Chemical Reaction Package
In addition to hydrologic and microbiologic transformations, the mass balance of solutes in the semiconfined aquifer is
subject to geochemical processes as well. All solutes are sub-ject to chemical and electrical interactions with aquifer materi-als. These interactions, which are highly complex and not well-understood, are typically lumped together and modeled as sorption processes. The SEAM3D code allows consideration of sorption processes on the transport of solutes in the Chemi-cal Reaction Package.
SEAM3D enables the user to use different approaches to modeling sorption including specifying linear and Freundlich adsorption isotherms. For the Kings Bay model, a linear
Table �.�. Initial concentration of PCE/TCE and DCE/VC degraders and kinetic reductive dechlorination parameters for the simulated chlorinated ethenes.
[O2, oxygen; Fe(III), ferric iron; SO
4, sulfate; PCE, perchloroethene; TCE, trichloroethene; DCE, dichloroethene; VC, vinyl chloride; g m-3, grams per cubic
meter; d-1, 1/day; N/A, not applicable]
Chlorinatedethene
yM max,EAlcn e
lcK kle li,(1)
(g m-�) (d-1) (g m-�) O� Fe(III) SO� PCE TCE DCE
PCE0.025
0.60 5.0 0.5 100 50 N/A N/A N/A
TCE 1.0 10.0 0.5 100 50 50 N/A N/A
DCE0.025
1.2 20.0 1.0 25 50 50 10 N/A
VC 0.5 15.0 1.0 25 50 50 10 1.0(1) Units for inhibition coefficients are in milligrams per liter except for Fe(III), which is in milligrams per gram.
Table �.�. Biodegradation parameters for net mineralization of DCE and VC.
[DCE, dichloroethene; VC, vinyl chloride; d-1, 1/day; g m-3, grams per cubic meter; g g-1, gram per gram; N/A, not applicable]
�� A Framework for Assessing the Sustainability of Monitored Natural Attenuation
isotherm coefficient was specified for each mobile chlorinated ethene, substrate, and product considered in the mass balance. In addition, a tracer was specified and assigned a sorption coefficient to help constrain rates of ground-water flow. The retardation factors for chlorinated ethenes were estimated from the approximate organic matter content of aquifer material and appropriate octanol/water partition coefficients. The solutes and adsorption isotherm coefficients are shown in table 2.7. Most of the biochemically active solutes such as dissolved oxygen and substrate were considered to be nonsorbing. Sulfate, however, is known to be slightly retarded relative to ground-water flow. Because sulfate transport was used to constrain rates of ground-water flow in the model, a sorption coefficient was specified. In addition, a tracer was specified with the same sorption coefficient as sulfate.
Table �.�. Stoichiometric conversion factors for reductive dechlorination.
Cl 0.0 1.01 Bulk density = 1.85 x 10⁶ grams per cubic meter; total porosity = 0.30.
Appendix �. Parameters Used to Simulate the Kings Bay Site ��
Prepared by the U.S. Geological Survey Enterprise Publishing Network Report edited and designed by Kimberly A. Waltenbaugh and James R. Douglas
Technical Reviewers: James Davis, U.S. Geological Survey Lashun King, Department of Civil and Environmental Engineering, Virginia Polytechnic Institute and State University Eve Kuniansky, U.S. Geological Survey Dan Waddill, Naval Facilities Engineering Command
For more information concerning the research in this report, please visit the U.S. Geological Survey Toxic Substances Hydrology Program Web site at http://toxics.usgs.gov/