78
THEUNS HENNING MOHAMMED DALIL ESSAKALI JUNG EUN OH A FRAMEWORK FOR URBAN TRANSPORT BENCHMARKING
THEUNS HENNING
MOHAMMED DALIL ESSAKALI
JUNG EUN OH
A FRAMEWORK FOR URBAN TRANSPORT BENCHMARKING
©2011 The International Bank for Reconstruction and Development / The
World Bank
1818 H Street NW
Washington DC 20433
Telephone: 202-473-1000
Internet: www.worldbank.org
E-mail: [email protected]
All rights reserved
This volume is a product of the staff of the International Bank for
Reconstruction and Development / The World Bank. The findings,
interpretations, and conclusions expressed in this volume do not necessarily
reflect the views of the Executive Directors of The World Bank or the
governments they represent.
The World Bank does not guarantee the accuracy of the data included in this
work. The boundaries, colors, denominations, and other information shown on
any map in this work do not imply any judgment on the part of The World Bank
concerning the legal status of any territory or the endorsement or acceptance
of such boundaries.
Rights and Permissions
The material in this publication is copyrighted. Copying and/or transmitting
portions or all of this work without permission may be a violation of applicable
law. The International Bank for Reconstruction and Development / The World
Bank encourages dissemination of its work and will normally grant permission
to reproduce portions of the work promptly.
For permission to photocopy or reprint any part of this work, please send a
request with complete information to the Copyright Clearance Center Inc., 222
Rosewood Drive, Danvers, MA 01923, USA; telephone: 978-750-8400; fax: 978-
750-4470; Internet: www.copyright.com.
All other queries on rights and licenses, including subsidiary rights, should be
addressed to the Office of the Publisher, The World Bank, 1818 H Street NW,
Washington, DC 20433, USA; fax: 202-522-2422; e-mail:
Cover picture: St-Petersburg, courtesy of Jung Eun Oh.
A FRAMEWORK FOR URBAN TRANSPORT
BENCHMARKING
The Transport Research Support program is a joint World Bank/ DFID initiative
focusing on emerging issues in the transport sector. Its goal is to generate
knowledge in high priority areas of the transport sector and to disseminate to
practitioners and decision-makers in transition and developing countries.
i
CONTENTS CONTENTS ............................................................................................. I
ACKNOWLEDGEMENTS ........................................................................ V
EXECUTIVE SUMMARY ....................................................................... VII
1 OBJECTIVE AND SCOPE OF THE STUDY ............................................ 1
1.1 OBJECTIVE OF THE STUDY .................................................................................... 1 1.2 SCOPE OF THE STUDY ......................................................................................... 2
2 BENCHMARKING: LESSONS AND GOOD PRACTICES ........................ 4
2.1 BENCHMARKING FOR PERFORMANCE IMPROVEMENT ................................................ 4 2.2 SUMMARY OF BENCHMARKING INITIATIVES ............................................................. 4 2.3 LESSONS LEARNED FROM THE BENCHMARKING INITIATIVES ...................................... 8
2.3.1 Benefits of Benchmarking in Transport Sector.............................................. 8 2.3.2 Good Approaches to Initiating Benchmarking Exercise ................................. 9
2.4 BENCHMARKING AS A CONTINUOUS PERFORMANCE IMPROVEMENT PROGRAM ........... 11
3 THE DEVELOPMENT OF THE KEY PERFORMANCE MEASUREMENT FRAMEWORK ....................................................................................... 12
3.1 BACKGROUND TO PERFORMANCE MEASURES/INDICATORS ..................................... 12 3.2 THE PERFORMANCE AREAS TARGETED THROUGH THIS BENCHMARKING EXERCISE ...... 12
3.2.1 Uptake of Public Transport ........................................................................ 14 3.2.2 Travel Efficiency ........................................................................................15 3.2.3 Accessibility .............................................................................................. 16 3.2.4 Affordability ............................................................................................. 16 3.2.5 Travelling Experience ................................................................................ 16
4 PILOT STUDY DETAILS ................................................................... 18
4.1 THE OBJECTIVE OF THE PILOT STUDY .................................................................. 18 4.2 SELECTED KEY PERFORMANCE MEASURES ........................................................... 18 4.3 SELECTED PILOT AREAS .................................................................................... 19
4.3.1 Basis of Selection ...................................................................................... 19 4.3.2 Bucharest – Romania ................................................................................ 19 4.3.3 Beijing – China .......................................................................................... 20 4.3.4 Singapore ................................................................................................. 21 4.3.5 Cape Town – South Africa ......................................................................... 22 4.3.6 Colombo – Sri Lanka ................................................................................. 22
4.4 APPLICABILITY OF PILOT AREAS .......................................................................... 23
5 PILOT STUDY DATA SUMMARIZATION AND COMPARATIVE ANALYSIS ............................................................................................ 24
5.1 AVAILABILITY OF KPI AND BACKGROUND DATA .................................................... 24 5.2 TRAVEL MODE ................................................................................................. 26 5.3 PUBLIC TRANSPORT PATRONAGE ........................................................................ 29 5.4 TRAVEL TIME ................................................................................................... 32 5.5 CATCHMENT AREA............................................................................................. 33 5.6 COST OF TRAVEL .............................................................................................. 34
ii
5.7 ROAD SAFETY ...................................................................................................35 5.8 PRESENTING THE BENCHMARKING ASSESSMENT ................................................... 36
6 IMPLEMENTATION OF A BENCHMARKING INITIATIVE .................... 38
6.1 DEVELOPING APPROPRIATE BENCHMARKS ........................................................... 38 6.1.1 Establishing the Status Quo ...................................................................... 38 6.1.2 The Normalization of Information and Data............................................... 38 6.1.3 Defining the Target ................................................................................... 39 6.1.4 Continuous Measurement and Reporting of Performance Relative to the Benchmark ............................................................................................................ 40
6.2 LESSONS FROM THE COMPARATIVE ANALYSES ...................................................... 40
7 CONCLUSIONS AND RECOMMENDATIONS..................................... 42
7.1 SUMMARY OF THE PILOT BENCHMARKING STUDY .................................................. 42 7.2 FINDINGS FROM THE PILOT STUDY PROJECT ......................................................... 43
7.2.1 Data Availability ....................................................................................... 43 7.2.2 Value of the KPIs and Comparative Information ......................................... 43 7.2.3 Establishing the Benchmark Level ............................................................. 44
7.3 RECOMMENDATIONS FOR ADOPTING A BENCHMARKING INITIATIVE AT LOCAL LEVEL ... 44 7.3.1 Motivation ............................................................................................... 44 7.3.2 Benchmarking Framework ........................................................................ 44 7.3.3 Data Requirements ................................................................................... 45
7.4 FURTHER WORK - INTERNATIONAL IMPLEMENTATION ............................................ 46
APPENDIX A: FULL LIST OF KEY PERFORMANCE INDICATORS ............. 47
REFERENCES ....................................................................................... 57
LIST OF ABBREVIATIONS ..................................................................... 59
iii
LIST OF TABLES
Table 2.1: Summary of Benchmark Initiatives ............................................................... 6
Table 2.2: Summary of Key Performance Indicators ...................................................... 8
Table 4.1: Performance Data requested from Pilot Areas ............................................ 19
Table 5.1: Performance Data Availability..................................................................... 25
Table 5.2: Public Transport Service Modes .................................................................. 25
Table 5.3: Area, Population and GDP Data .................................................................. 25
Table 5.4: Transport Supply Data ................................................................................ 25
LIST OF FIGURES
Figure 2.1: Benchmarking versus performance measurement ....................................... 5
Figure 2.2: Key stages in a benchmarking process ......................................................... 9
Figure 3.1: The main issues related to an effective public transport system .................. 13
Figure 3.2: Proposed KPI framework for benchmarking public transport ..................... 14
Figure 3.3: Personal security on public transport .......................................................... 17
Figure 5.1: Travel mode comparison............................................................................ 26
Figure 5.2: Public transport makeup in % modal share .................................................27
Figure 5.3: Trend analysis for travel mode indicator .................................................... 28
Figure 5.4: Comparison of annual public transport boarding passengers normalized to
city population ................................................................................................... 29
Figure 5.5: Per capita patronage by public transport mode ......................................... 30
Figure 5.6: Comparison of actual boarding passengers per bus and bus fleet numbers . 31
Figure 5.7: Trend analysis of boarding passengers in Bucharest .................................... 31
Figure 5.8: Average travel time comparison ................................................................ 32
Figure 5.9: Trend analysis of average travel time in Bucharest ..................................... 33
Figure 5.10: Average bus fare comparison ................................................................... 34
Figure 5.11: Cost of travel comparison between bus and metro ....................................35
Figure 5.12: Comparison of number of road fatalities ...................................................35
Figure 5.13: Trend analysis of road safety .................................................................... 36
Figure 5.14: Overall ranking comparison of four pilot city areas .................................... 37
Figure 7.1: Recommended priorities for key performance indicators ........................... 45
LIST OF BOXES
Box 1: Using Key Performance Indicators (KPIs) in Performance Management and
Benchmarking ...................................................................................................... 5

v
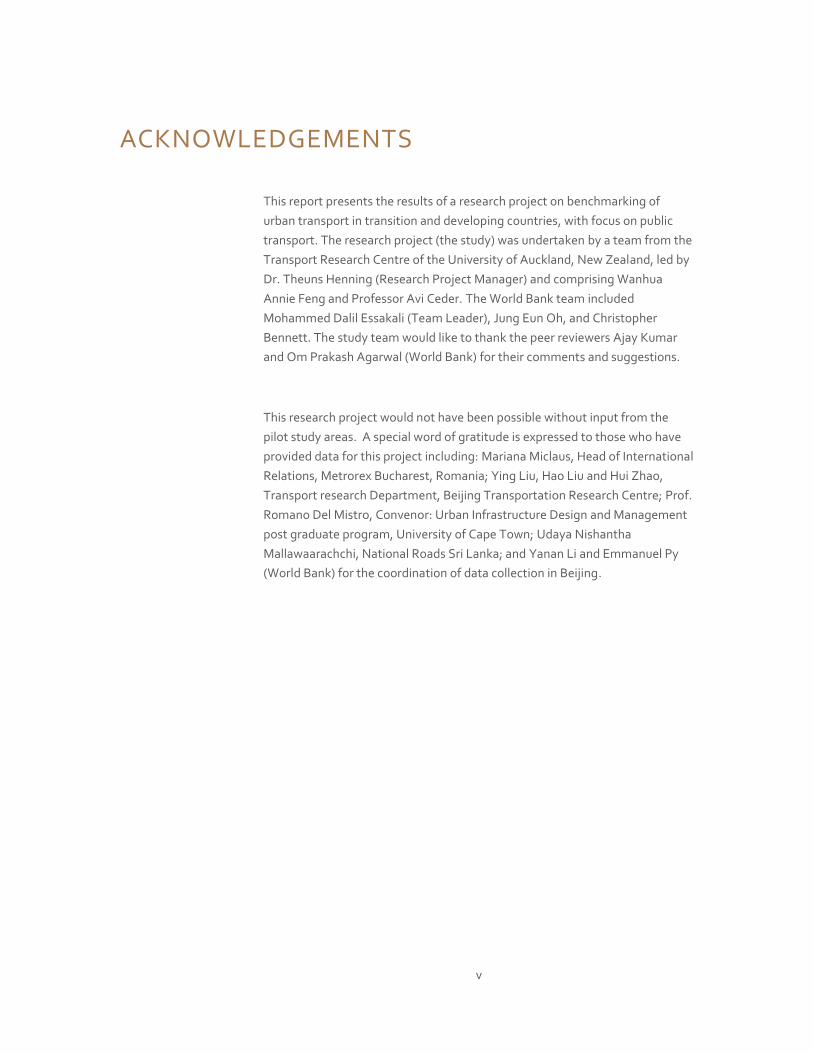
ACKNOWLEDGEMENTS
This report presents the results of a research project on benchmarking of
urban transport in transition and developing countries, with focus on public
transport. The research project (the study) was undertaken by a team from the
Transport Research Centre of the University of Auckland, New Zealand, led by
Dr. Theuns Henning (Research Project Manager) and comprising Wanhua
Annie Feng and Professor Avi Ceder. The World Bank team included
Mohammed Dalil Essakali (Team Leader), Jung Eun Oh, and Christopher
Bennett. The study team would like to thank the peer reviewers Ajay Kumar
and Om Prakash Agarwal (World Bank) for their comments and suggestions.
This research project would not have been possible without input from the
pilot study areas. A special word of gratitude is expressed to those who have
provided data for this project including: Mariana Miclaus, Head of International
Relations, Metrorex Bucharest, Romania; Ying Liu, Hao Liu and Hui Zhao,
Transport research Department, Beijing Transportation Research Centre; Prof.
Romano Del Mistro, Convenor: Urban Infrastructure Design and Management
post graduate program, University of Cape Town; Udaya Nishantha
Mallawaarachchi, National Roads Sri Lanka; and Yanan Li and Emmanuel Py
(World Bank) for the coordination of data collection in Beijing.

vi
vii
EXECUTIVE SUMMARY
Why benchmarking?
Many world cities have managed to build on their well performing urban
transport to increase competitiveness and attractiveness. Their urban
transport systems provide citizens with good access to economic and social
opportunities and enhanced quality of life, and enable businesses to efficiently
access labor and markets. These cities offer valuable lessons for transition and
developing countries.
Cities in transition and developing countries are experiencing simultaneous
growth of urban population, income, and private vehicle ownership, which,
combined with resource constraints, creates a challenging environment for
their urban transport systems. Policymakers in these cities must be able to
quickly design and implement performance enhancing measures for their
urban transport systems that are commensurate with the challenges they face.
This entails the ability to conduct self assessments, learn from good practice
elsewhere, and identify the areas and scale of potential improvement. The
institutionalization of this benchmarking provides policymakers with tools to
continuously seek enhanced performance for their urban transport.
Benchmarking, in the context of urban transport, provides comparative
information and management tools that enable: (i) governments to assess,
monitor, and fine-tune urban transport policies and to better exercise their
regulatory role; (ii) citizens to hold governments and service providers
accountable through better information; (iii) urban transport service providers
to identify performance gaps and set targets and measures to fill them; and
(iv) international development and financial institutions to design targeted and
result-based development programs and to draw and share lessons from the
experience of better performing cities.
The emerging environmental sustainability and climate change agenda has
further motivated many professionals and practitioners in the field to carry out
benchmarking. In this particular context, a benchmarking exercise provides a
framework to monitor and assess effectiveness of climate change policy
measures, and allows policymakers to learn about those relatively untested
policy measures.
Developing, implementing and maintaining an urban transport benchmarking
initiative for the benefit of cities in transition and developing countries has the
following benefits: (i) providing consistent and comparable performance data;
(ii) fast-tracking the performance improvement process by learning from
viii
others with superior performance; (iii) identifying good practices and
implementing changes; (iv) providing cities and organizations with continuous
performance improvement; (v) establishing a forum for cities and
organizations to share their experiences and exchange information; it allows
for an incremental development process that may start simple but can develop
more as more and better data becomes available; and (vii) building a
knowledge network mechanism to encourage development in the urban
transport sector for development countries.
This report summarizes the findings of a study aimed at exploring key
elements of a benchmarking framework for urban transport. Unlike many
industries where benchmarking has proven to be successful and
straightforward, the multitude of the actors and interactions involved in urban
transport systems may make benchmarking a complex endeavor. It was
therefore important to analyze what has been done so far, propose basic
benchmarking elements and test them, and identify lessons for a simple and
sustainable urban transport benchmarking framework. A major component of
this study was to investigate (a) the availability of data for benchmarking and
(b) the value of benchmarking on the basis of limited data.
The study therefore proposes a benchmarking framework for urban transport,
focusing on the performance of public transport. Because the design of a
benchmarking framework depends on the objectives sought from it, the study
focused on the performance of public transport systems from the
policymaker’s perspective. The study included pilot application of the
proposed framework in five cities from three continents—Beijing, Bucharest,
Cape Town, Colombo, and Singapore. The pilot application and comparative
analysis helped gauge applicability and practicality of the proposed
framework.
What and how to benchmark?
The study proposes thirteen core indicators that measure the performance of
public transport in five categories—uptake of public transport, travel
efficiency, accessibility, affordability, and quality of travel experience.
Selected indicators satisfy five key principles of performance measurement:
they are (i) specific, covering concisely one aspect of the activity; (ii)
measureable, constituting objective and quantifiable measures and avoiding
subjective measures such as rating or ranking scale; (iii) achievable, using data
that are commonly obtainable under normal circumstances and not too
sophisticated requiring cutting-edge technology for collection; (iv) relevant,
relevant to the objectives and activities that are being considered; and (v)
time-bound, with obtained data within similar timeframe.
Each of the five categories consists of a few key performance indicators (KPI).
Uptake of public transport is measured by modal share (percentage of trips
ix
made by private cars, public transport, bike, and walking), annual public
transport passenger-kilometer travelled, and annual public transport
patronage (number of passengers). Under travel efficiency category, various
aspects of public transport service quality and efficiency are measured. KPIs
include average and variance of public transport speed of home-based work
trips, average and variance of public transport travel time of home-based work
trips, public transport departure and arrival time reliability, and vehicle fuel
consumption. Accessibility category covers how well the patrons are served by
public transport services. It is measured by distance and/or walking time from
public transport stops to outer rim of patron dwellings (i.e., catchment areas).
Affordability is measured by average cost of home-based work trips. Quality
of travel experience concerns safety, security and comfort of trips. They are
measured by road safety KPIs—annual road accident fatalities, and those
involving public transport vehicles—and personal security KPIs—annual
number of crimes occurred on public transport vehicles and at stations and
percentage of people feeling safe when using public transport.
In order to draw on meaningful findings and policy implications from
benchmarking, one needs to contextualize physical and socio-economic
characteristics of a city, to which travel patterns and use of public transport are
attributed, and peer it with right benchmarks. Hence, this study also sets out
contextual indicators that would characterize a city’s demography,
infrastructure endowment, and economic development. Included as
contextual indicators are available modes of public transport, land area,
population and population density, vehicle ownership, road length, public
transport route length (by mode), public transport capacity (e.g., in terms of
fleet size), public transport vehicle-kilometers, gross domestic product, and
personal income. In addition to these characteristics, use of public resources
for transport affects the performance of public transport; hence, public
expenditure related measurements are also included as contextual indicators.
They are public transport spending as percentage of GDP, overall transport
spending as percentage of GDP, and subsidies to public transport.
The study recommends that the benchmarking follow a five-stage process,
particularly in the context of initiatives driven by the public sector (e.g.,
metropolitan public transport authority): initiating, planning, information
gathering, analysis, and implementation for impact. First at initiating stage,
broader policy objectives should be defined and a working group or steering
committee should be established. Second at planning stage, the
benchmarking framework is refined in light of specific policy objectives that
the benchmarking exercise aims to achieve. Following is the information
gathering stage, at which performance indicators are clearly defined,
methodology specified, and available performance data collected, collated,
and verified. In the fourth stage, performance information is compiled and
analyzed to identify performance gaps. In-depth review of case studies should
x
help identify good practices. Finally, an action plan should be devised based
on the identified performance gaps and good practices. The action plan then
should be implemented and its results should be regularly monitored. When
properly instituted, the result of performance monitoring will feed back into
and update the performance database (i.e., Stage 3 – information gathering),
followed by periodic repetition of Stages 3-5. Broader policy objectives and
benchmarking framework defined at earlier two stages will be revisited as
necessary.
Pilot Study Findings
The objectives of the pilot study were firstly to demonstrate the value of
benchmarking using a small sample of KPIs and a limited number of study
areas, and secondly to investigate practical and data-related aspects of the
benchmarking process. The five selected cities—Beijing, Bucharest, Cape
Town, Colombo, and Singapore—are characterized with distinctive historical
backgrounds of urban development, infrastructure endowment, and varying
levels of economic development.
In all cases, an increase in private car ownership goes hand in hand with a
decrease in public transport patronage, both of which are correlated with
income growth with the exception of Singapore, where restrictions are
imposed on car ownership and use. There is generally a positive correlation
between the population density and the share of trips by public transport. For
example, Bucharest has the highest public transport uptake despite its very
high private car ownership and relatively high cost of public transport trips (as
percentage of income). This seems to be attributed to its highest population
density, travel time of public transport trips that is on average superior to that
of car trips, and lack of parking spaces in the city center. In Beijing, per capita
bus patronage is highest among all cities, which is likely related to the
cheapest fare as percentage of income thanks to government subsidies.
Public transport uptake is closely related with patterns of urban development
and infrastructure endowment. In case of Cape Town, despite relatively high
population density and modest vehicle ownership, public transport patronage
is low: only quarter that of Bucharest and one third that of Beijing. This is
largely to do with the low-density development of residential areas in the
outskirt of the city, poor condition of infrastructure in many parts of the city,
and low quality of public transport. In all cities, road safety indicators have
improved over time, especially those that had higher per capita fatality rates
some years ago have dropped more dramatically.
The pilot study showed how a simple benchmarking framework using readily
available information and data can provide policymakers and professionals
with useful insight about their city’s performance relative to peers and about
possible means to reach higher performance. The pilot study also revealed
xi
important issues related to the relevance of indicators and the methodological
issues related to data availability and comparability.
Remaining challenges, yet, recommendations for informed urban transport
decision-making
Several factors and, often, combinations of them make the process of
benchmarking urban transport difficult. To name a few: the sophisticated
nature of the exercise, lack of willingness, lack of resources, and definition
problems. First of all, benchmarking urban transport is not merely about
collecting trip data and carrying out quantitative comparisons. Rather, it is an
intellectual process of identifying strengths and weaknesses of a system in
comparison with peers that are facing similar challenges; of giving an
indication of what can be achieved under favorable circumstances; and of
revealing underlying economic and physical factors that determine urban
transport performance. Normally, these findings are not immediately
apparent from the quantifiable information about urban transport
performance; and hence benchmarking process requires skilled eyes to put
things into right context.
Moreover, benchmarking urban transport initiatives often failed to secure
sustaining support. For example the Urban Transport Benchmarking Initiative
by the European Commission lasted through only two rounds of data
collection. An ambitious initiative that had started with 45 cities in Europe in
2006 was reduced to a much smaller program mostly for medium-sized cities
in three years, before the initiative ceased. If lack of willingness is one notable
barrier in some high-income cities, lack of resources is one of the great
constraints in case of the cities in transition and developing countries.
Institutions in those cities often lack the capacity and resources to collect basic
data and to monitor performance of their systems. In one of the pilot cities in
this study, the majority of the performance related data was unavailable and
some of the basic contextual data was only partly obtainable.
Benchmarking practices also often face with several definition problems,
notably with respect to the correct boundary of an urban transport system,
which often include not only the subjective city but also its surrounding
suburbs. When the geographical boundary encompasses more than one
jurisdictional unit, data collection and collation becomes more complicated.
Non-standardized definitions of performance data and indicators are also a
frequent source of confusion.
Notwithstanding these difficulties, benchmarking is one of the most effective
tools that enable informed decision-making for urban transport issues, which
are very complex and multi-faceted in nature. A few recommendations in this
report would help tackling the challenges. First, benchmarking practice should
xii
be considered as a continuous and evolving process; and the current lack of
data should not discourage the decision makers from initiating the effort. As
found in the case study, the benchmarking process can start with a small
number of key performance indicators as long as they align with the policy
objectives and can reveal underlying factors that affect urban transport
performance. As the benefits of benchmarking practices are felt and
experience accumulated, the scope of the benchmarking process can be
broadened, supported by larger data collection. Second, as the tested
approach that only focused on home-based work trip suggests, limiting the
scope of analysis to something that is concrete and easy to measure is a
practical approach that minimizes effort for data collection and analysis while
obtaining meaningful results. Third, institutions should consider using the
recent advancement of information and communication technologies wisely,
for cheaper traffic and trip data collection. Growing prevalence of mobile
phones and GPS equipment in many transition and developing countries opens
up the possibility for technology-driven low-cost traffic and trip data
collection. With supportive institution and modest investment, these
resources can be tapped on relatively easily.
In the long-term, the process of benchmarking should be instituted as part of
broader strategic planning and performance monitoring of urban transport,
institutionalizing data collection and availing financial and human resources.
This means urban transport policy that is based on (i) clear strategic objectives,
(ii) full understanding of status quo (i.e., current performance), (iii) well defined
targets (i.e., future performance), and (iv) good understanding of how other
cities succeeded or failed and why. This combination will maximize the
likelihood of effective and successful implementation of urban transport
solutions.
Finally, the increasing focus on results by governments and international
development institutions requires that initiatives targeting the improvement
of urban transport should be supported by sufficient information. The
benchmarking concept studied under this research project could be a useful
tool to support this drive for results. The global reach of development and
international financial institutions allows effective dissemination of knowledge
and would suggest that such a benchmarking initiative should be initiated as
part of their development work. It is therefore recommended that a gradual
full-scale development/implementation of a simple benchmarking initiative for
urban transport in transition and developing countries be implemented.
1
1
Objective and Scope of the Study
1 OBJECTIVE AND SCOPE OF THE STUDY Transition and developing countries are experiencing simultaneous growth of
population, income, and private vehicle ownership, which significantly affects urban
transport environment and poses challenges to policymakers and urban transport
professionals. Experience shows that the performance of urban transport service
delivery in many transition and developing countries is low; policymakers have
incomplete information to make decisions; and managers and professionals rarely have
a clear picture of their operational performance, best practices elsewhere, or the
desired performance level of their service provision. The poor performance of urban
transport can become a major impediment to achieving access and mobility objectives.
1.1 OBJECTIVE OF THE STUDY
The primary objective of the study was to develop and test a simple benchmarking
framework for urban transport, focusing primarily on public transport, using selected
key performance indicators and taking into account the most significant constraints
faced in transition and developing countries. To achieve its objective, the study
attempts to answer the following questions:
How is benchmarking relevant to policymakers seeking to improve the
performance of urban transport?
Do the required information and data exist to make such a benchmarking
exercise worthwhile?
Does the comparative analysis provide useful information?
How are the benchmark levels established?
Benchmarking provides policymakers and managers with information on relative
performance and guides them through a process of performance enhancement.
Benchmarking in the context of infrastructure service delivery has proven to be useful
in encouraging competition, and in enhancing technical and economic regulation.
The main immediate benefits from this study is enhanced knowledge of urban
transport performance in the World Bank and the broader urban transport community
in international development and financial institutions, by drawing lessons from the
experience of world cities. This will allow better targeting and design of result-based
development programs.
In addition to the immediate benefits to the development community, benchmarking,
in the context of urban transport, provides comparative information and management
tools that enable: (i) governments to assess, monitor, and fine-tune urban transport
policies and to better exercise their regulatory role; (ii) citizens to hold governments
and service providers accountable through better information; and (iii) urban transport
service providers to identify performance gaps and set targets and measures to fill
them.
2
2
A Framework for Urban Transport Benchmarking
1.2 SCOPE OF THE STUDY
The scope of this study was limited to the overall performance of urban public
transport services. This study was aware that embarking on a comprehensive
benchmarking exercise for urban transport as a whole from the onset can quickly
become a complex endeavor. While the scope of the study was limited, the approach
of the study was designed to provide lessons that can be used to customize
benchmarking to the specific needs of the wider organization. In addition, in order to
better understand these services, it is necessary to include public transport
performance within the context of the wider urban transport system and issues. The
data analysis should also be contextualized within some demographic statistics which
are included in this study.
In broader terms, one can conceive as many benchmarking frameworks as the
numerous perspectives from which urban transport performance can be studied. For
example, the interests of the city mayor or city policymakers are different from those of
a private operator providing public transport services, although they can be collectively
working to achieve ultimate city goals. The policymakers would want to benchmark
the performance of urban transport in their city to that of other peer cities. They would
more probably be interested in the impact of transport on the quality of life of citizens,
the share of public transport in the overall transport market, the efficiency of public
funding for urban transport, the reliability and accountability of the various service
providers, or the overall governance environment of the urban transport sector.
Service providers would likely be interested in benchmarking their operational,
technical, and financial performance against that of peers in the city or elsewhere
focusing on how to enhance their productivity while meeting their commitments in
terms of service delivery levels.
Notwithstanding these various perspectives, some useful benchmarking frameworks
can be developed according to the following mapping of urban transport issues:
Overall urban transport governance, covering policy matters, industry and
market structure, institutional organization, administrative structures, sector
funding, and regulatory matters.
Administrative and corporate governance, which is relevant to urban transport
because very often urban transport services are provided by administrative
structures, state or municipally-owned enterprises, or corporations.
Overall management performance of urban transport service provision along
managerial, technical, operational, and financial dimensions.
The simple framework that is the subject of this study reflects the perspective of
policymakers. In terms of the data included in the study, the aim is to utilize as much
existing data as possible from the selected study areas. For this reason, only work-
based trips are considered as they normally constitute the majority of trips made by
people on a daily basis. There are also different dynamics involved with private trips
and they would therefore warrant a separate study. Transition and developing

3
3
Objective and Scope of the Study
countries often have an active “informal” public transport, which is defined as
operations that are not associated with a large organization or officially recognized by
governance structures. Good examples of these are private people who transport
passengers on motorcycles (and even cars and vans) without any formal registration or
recognition of a business.
4
4
A Framework for Urban Transport Benchmarking
2 BENCHMARKING: LESSONS AND GOOD PRACTICES 2.1 BENCHM ARKING FOR PERFORM ANCE IMPROVEMENT
Performance management of any network or sectors can utilize a number of
techniques, with one of these being benchmarking. The term benchmark originates
from land surveying and was later widely used in scientific management practices to
present an efficiency standard to which a job could be performed (Dattakumar and
Jagadeesh, 2003). In the simplest terms, benchmarking has been defined as “learning
from the pros” (ASTD, 1992). The process of benchmarking is about comparing an
organization’s performance or process on a number of measures in relation to a
carefully selected benchmark (e.g. a successful peer organization), providing
information on the areas and scale of potential improvement, and indentifying good
practices for implementing changes that effect improvement. The main objectives of
benchmarking are to learn from top performers and adopt best practices for effective
performance improvement.
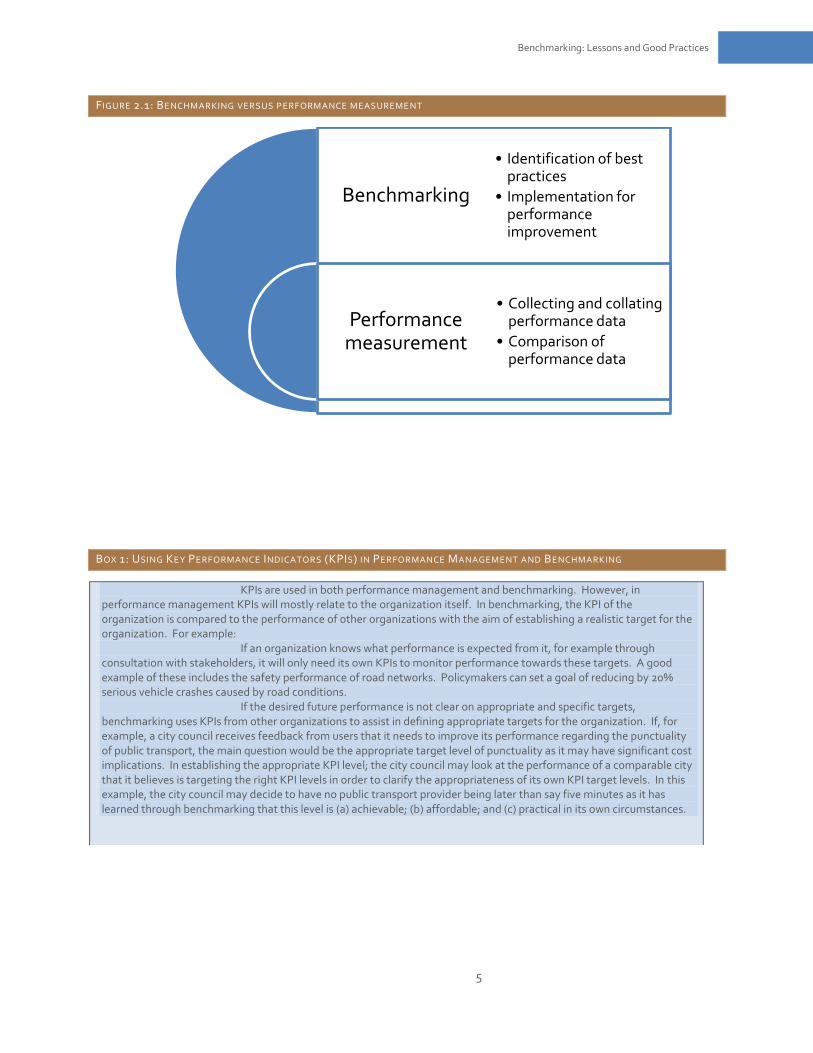
The benchmarking process has many defining features. It is different from
performance measurement, which is about collecting and comparing performance data
that tells an organization where it stands in relation to the past. Performance
measurement, therefore, has a past and present focus. Benchmarking, however, has a
present and future focus and encompasses the key elements of performance
measurement. The key themes include performance measurement, comparison,
identification of best practices and adopting these good practices and processes for
improvement (Geerlings et al., 2006; Dattakumar and Jagadeesh, 2003). Figure 2.1
illustrates the relationship between benchmarking and performance measurement.
The benchmarking process was pioneered by the Xerox Corporation in the United
States in order to meet the Japanese competitive market in the 1970s. Following
Xerox’s success story, benchmarking has been extensively applied in private sector
organizations to achieve competitive advantages. Nowadays, it is also used in public
sector organizations to improve asset performance and service delivery.
2.2 SUMMARY OF BENCHMARKING INITIATIVES
The primary objective of this section is to assess international and regional approaches
towards techniques of transport benchmarking and to narrow the focus to the most
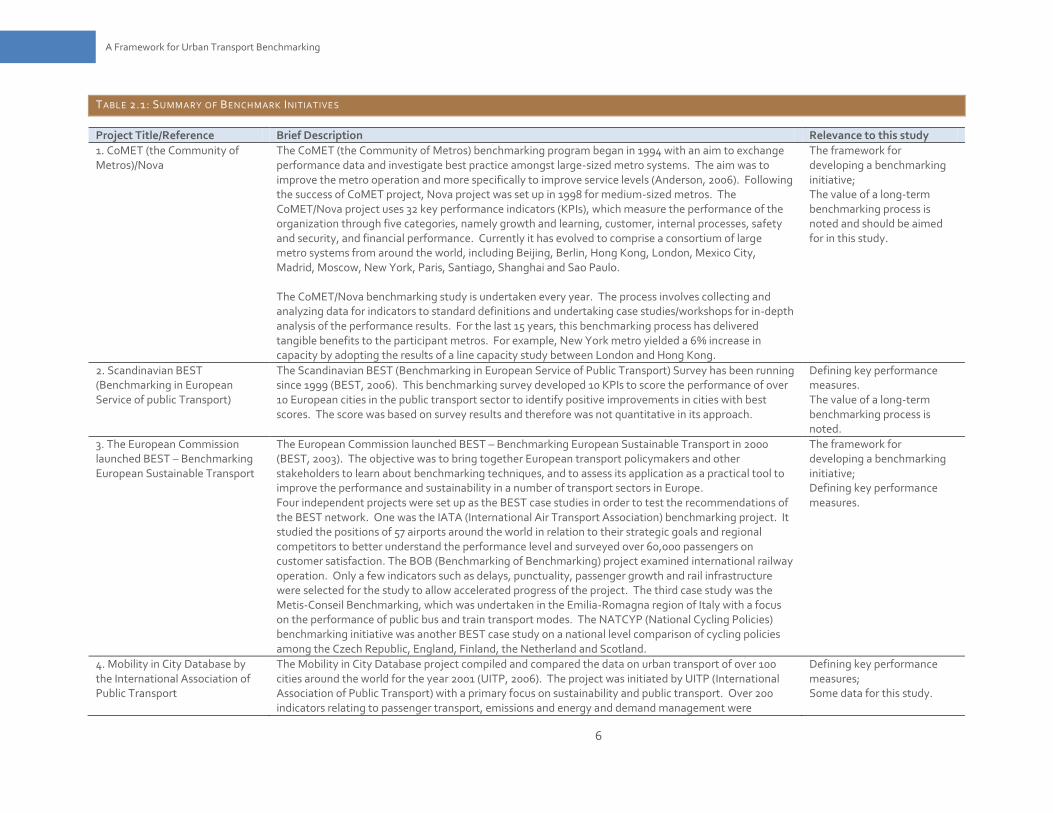
recent good practice initiatives. The projects outlined in Table 2.1 are some of the best
known benchmarking initiatives in urban transport. Some of the KPIs used in these
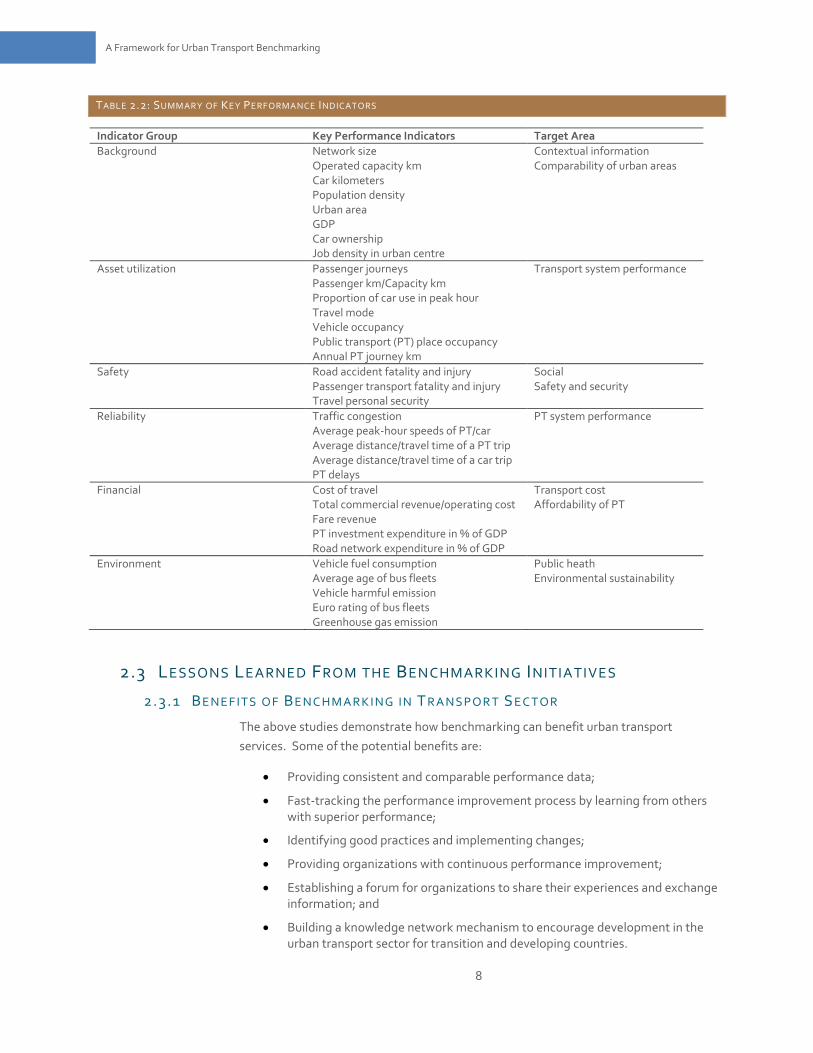
projects are summarized in Table 2.2. These indicators are highly relevant to this study.
5
5
Benchmarking: Lessons and Good Practices
FIGURE 2.1: BENCHMARKING VERSUS P ERFORMANCE MEASUREME NT
BOX 1: USING KEY PERFORMANCE INDICATORS (KPIS) IN PERFORMANCE MANAGEMENT AND BENCHMARKING
Benchmarking
Performance measurement
• Identification of best practices
• Implementation for performance improvement
• Collecting and collating performance data
• Comparison of performance data
KPIs are used in both performance management and benchmarking. However, in performance management KPIs will mostly relate to the organization itself. In benchmarking, the KPI of the organization is compared to the performance of other organizations with the aim of establishing a realistic target for the organization. For example:
If an organization knows what performance is expected from it, for example through consultation with stakeholders, it will only need its own KPIs to monitor performance towards these targets. A good example of these includes the safety performance of road networks. Policymakers can set a goal of reducing by 20% serious vehicle crashes caused by road conditions.
If the desired future performance is not clear on appropriate and specific targets, benchmarking uses KPIs from other organizations to assist in defining appropriate targets for the organization. If, for example, a city council receives feedback from users that it needs to improve its performance regarding the punctuality of public transport, the main question would be the appropriate target level of punctuality as it may have significant cost implications. In establishing the appropriate KPI level; the city council may look at the performance of a comparable city that it believes is targeting the right KPI levels in order to clarify the appropriateness of its own KPI target levels. In this example, the city council may decide to have no public transport provider being later than say five minutes as it has learned through benchmarking that this level is (a) achievable; (b) affordable; and (c) practical in its own circumstances.
6
6
A Framework for Urban Transport Benchmarking
TABLE 2.1: SUMMARY OF BENCHMARK INITIATIVES
Project Title/Reference Brief Description Relevance to this study
1. CoMET (the Community of Metros)/Nova
The CoMET (the Community of Metros) benchmarking program began in 1994 with an aim to exchange performance data and investigate best practice amongst large-sized metro systems. The aim was to improve the metro operation and more specifically to improve service levels (Anderson, 2006). Following the success of CoMET project, Nova project was set up in 1998 for medium-sized metros. The CoMET/Nova project uses 32 key performance indicators (KPIs), which measure the performance of the organization through five categories, namely growth and learning, customer, internal processes, safety and security, and financial performance. Currently it has evolved to comprise a consortium of large metro systems from around the world, including Beijing, Berlin, Hong Kong, London, Mexico City, Madrid, Moscow, New York, Paris, Santiago, Shanghai and Sao Paulo. The CoMET/Nova benchmarking study is undertaken every year. The process involves collecting and analyzing data for indicators to standard definitions and undertaking case studies/workshops for in-depth analysis of the performance results. For the last 15 years, this benchmarking process has delivered tangible benefits to the participant metros. For example, New York metro yielded a 6% increase in capacity by adopting the results of a line capacity study between London and Hong Kong.
The framework for developing a benchmarking initiative; The value of a long-term benchmarking process is noted and should be aimed for in this study.
2. Scandinavian BEST (Benchmarking in European Service of public Transport)
The Scandinavian BEST (Benchmarking in European Service of Public Transport) Survey has been running since 1999 (BEST, 2006). This benchmarking survey developed 10 KPIs to score the performance of over 10 European cities in the public transport sector to identify positive improvements in cities with best scores. The score was based on survey results and therefore was not quantitative in its approach.
Defining key performance measures. The value of a long-term benchmarking process is noted.
3. The European Commission launched BEST – Benchmarking European Sustainable Transport
The European Commission launched BEST – Benchmarking European Sustainable Transport in 2000 (BEST, 2003). The objective was to bring together European transport policymakers and other stakeholders to learn about benchmarking techniques, and to assess its application as a practical tool to improve the performance and sustainability in a number of transport sectors in Europe. Four independent projects were set up as the BEST case studies in order to test the recommendations of the BEST network. One was the IATA (International Air Transport Association) benchmarking project. It studied the positions of 57 airports around the world in relation to their strategic goals and regional competitors to better understand the performance level and surveyed over 60,000 passengers on customer satisfaction. The BOB (Benchmarking of Benchmarking) project examined international railway operation. Only a few indicators such as delays, punctuality, passenger growth and rail infrastructure were selected for the study to allow accelerated progress of the project. The third case study was the Metis-Conseil Benchmarking, which was undertaken in the Emilia-Romagna region of Italy with a focus on the performance of public bus and train transport modes. The NATCYP (National Cycling Policies) benchmarking initiative was another BEST case study on a national level comparison of cycling policies among the Czech Republic, England, Finland, the Netherland and Scotland.
The framework for developing a benchmarking initiative; Defining key performance measures.
4. Mobility in City Database by the International Association of Public Transport
The Mobility in City Database project compiled and compared the data on urban transport of over 100 cities around the world for the year 2001 (UITP, 2006). The project was initiated by UITP (International Association of Public Transport) with a primary focus on sustainability and public transport. Over 200 indicators relating to passenger transport, emissions and energy and demand management were
Defining key performance measures; Some data for this study.
7
7
Benchmarking: Lessons and Good Practices
reported.
5. Urban Transport Benchmarking Initiative by the European Commission
The Urban Transport Benchmarking Initiative by the European Commission was a three-year project completed in 2006 (Taylor, 2006). The project group benchmarked 45 participating European cities’ transport systems, explored and compared best practice examples among the participants, providing better understanding of how to improve urban transport strategies effectively.
The framework of developing a benchmarking initiative; Defining key performance measures; Some data for this study.
6. NZTA Benchmarking Initiative by the New Zealand Transport Agency
The New Zealand Transport Agency launched a benchmarking project during 2007 aimed at promoting sustainability in the transport sector. The project’s main objective was to establish a benchmarking process that would assist local authorities in promoting alternative transport options within the context of an urban area’s geographical and socio-economic backdrop.
The framework of developing a benchmarking initiative; Defining key performance measures; Some data for this study.
7. Benchmarking Efficiency of Sustainable Urban Transport in Chinese cities by the China Ministry of Transport
More recently, the China Ministry of Transport, in conjunction with the China Academy of Transportation Science completed a project on benchmarking efficiency of sustainable urban transport in Chinese cities in 2008 (Wu, 2009). The project identified seven challenges and five strategic priorities for major Chinese cities.
Defining key performance measures; Some data for this study.
8
8
A Framework for Urban Transport Benchmarking
TABLE 2.2: SUMMARY OF KEY PERFORMANCE INDICATORS
Indicator Group Key Performance Indicators Target Area
Background Network size Operated capacity km Car kilometers Population density Urban area GDP Car ownership Job density in urban centre
Contextual information Comparability of urban areas
Asset utilization Passenger journeys Passenger km/Capacity km Proportion of car use in peak hour Travel mode Vehicle occupancy Public transport (PT) place occupancy Annual PT journey km
Transport system performance
Safety Road accident fatality and injury Passenger transport fatality and injury Travel personal security
Social Safety and security
Reliability Traffic congestion Average peak-hour speeds of PT/car Average distance/travel time of a PT trip Average distance/travel time of a car trip PT delays
PT system performance
Financial Cost of travel Total commercial revenue/operating cost Fare revenue PT investment expenditure in % of GDP Road network expenditure in % of GDP
Transport cost Affordability of PT
Environment Vehicle fuel consumption Average age of bus fleets Vehicle harmful emission Euro rating of bus fleets Greenhouse gas emission
Public heath Environmental sustainability
2.3 LESSONS LEARNED FROM THE BENCHMARKING INITIATIVES
2.3.1 BE NE F IT S O F BE NC H M A R K I NG IN T R A NS PO R T S E C T O R
The above studies demonstrate how benchmarking can benefit urban transport
services. Some of the potential benefits are:
Providing consistent and comparable performance data;
Fast-tracking the performance improvement process by learning from others with superior performance;
Identifying good practices and implementing changes;
Providing organizations with continuous performance improvement;
Establishing a forum for organizations to share their experiences and exchange information; and
Building a knowledge network mechanism to encourage development in the urban transport sector for transition and developing countries.
9
9
Benchmarking: Lessons and Good Practices
2.3.2 GO O D AP PR O AC H E S T O INI T I AT I NG BE NC H M AR K IN G EXE R C IS E
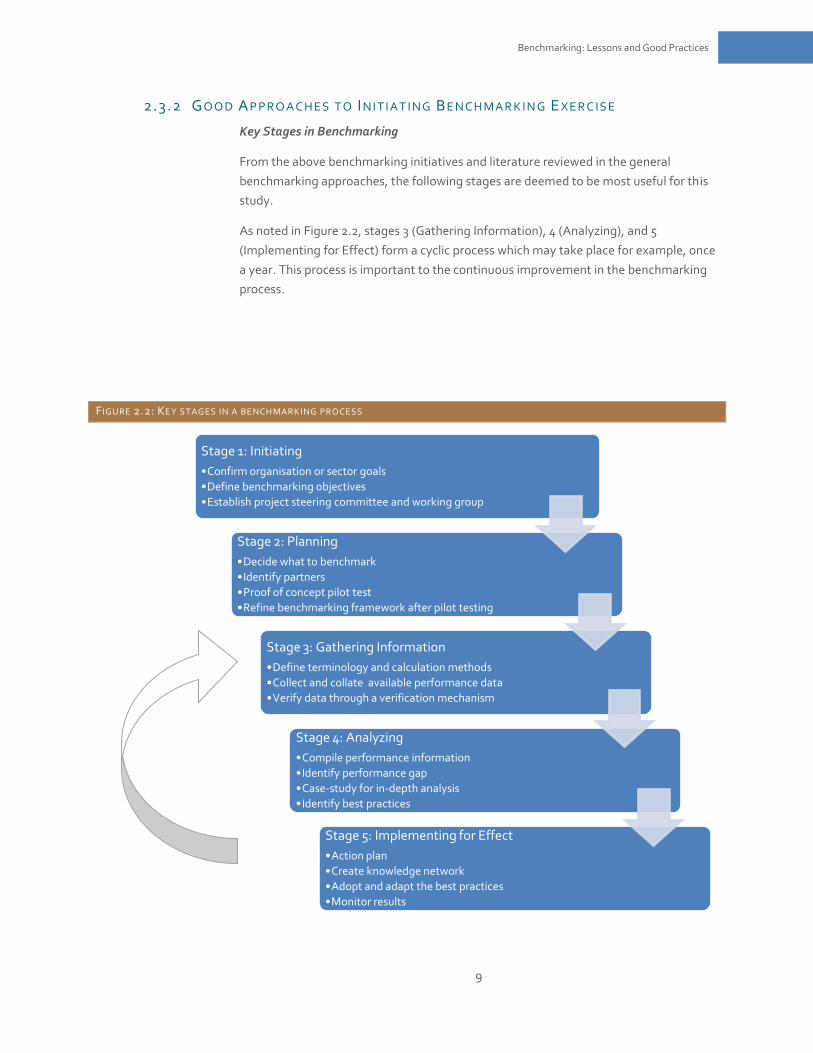
Key Stages in Benchmarking
From the above benchmarking initiatives and literature reviewed in the general
benchmarking approaches, the following stages are deemed to be most useful for this
study.
As noted in Figure 2.2, stages 3 (Gathering Information), 4 (Analyzing), and 5
(Implementing for Effect) form a cyclic process which may take place for example, once
a year. This process is important to the continuous improvement in the benchmarking
process.
FIGURE 2.2: KEY STAGES IN A BENCH MARKING PROCESS
Stage 1: Initiating
•Confirm organisation or sector goals
•Define benchmarking objectives
•Establish project steering committee and working group
Stage 2: Planning
•Decide what to benchmark
•Identify partners
•Proof of concept pilot test
•Refine benchmarking framework after pilot testing
Stage 3: Gathering Information
•Define terminology and calculation methods
•Collect and collate available performance data
•Verify data through a verification mechanism
Stage 4: Analyzing
•Compile performance information
•Identify performance gap
•Case-study for in-depth analysis
•Identify best practices
Stage 5: Implementing for Effect
•Action plan
•Create knowledge network
•Adopt and adapt the best practices
•Monitor results
10
10
A Framework for Urban Transport Benchmarking
Key Performance Indicator Framework
A KPI framework should be designed in the initial stage of the benchmarking process.
Some of the benchmarking initiatives in the literature have over 100 performance
indicators. The vast number of indicators requires an extensive amount of human
resources and financial input, which may not be feasible for a long-term process,
particularly for the case of transition and developing countries. Some of the important
features in the indicator framework are discussed below:
KPIs must relate to the sector or organization’s goals or policies;
It is best to limit the number of KPIs to ensure that the benchmarking process remains focused and can deliver results;
The KPIs should be comprehensive enough so as to represent all the different parts of the system/operation, yet concise enough to be able to be used effectively by an organization;
The framework should spell out clearly the definitions of each KPI so that the data set behind the indicators is collected to standard definitions for consistency and comparability;
Data availability and accuracy are important considerations in deciding which KPIs to include in the framework;
The framework may be updated over time to reflect major changes in the organization’s policy or strategic directions;
The literature review reveals that the three common threads running through various transport performance indicator frameworks are:
Environment – e.g. fuel consumption and emissions;
Economy – e.g. affordability and modal split; and
Social – e.g. road safety and accessibility.
Pilot Study
Most successful benchmarking begins with a focused area (field testing) under a pilot
study. A pilot study uses a subset of the KPIs (four for example) for limited study areas.
This not only serves as a starting point for the benchmarking project, but also captures
several potential benefits, including:
The pilot study provides quick evidence on whether benchmarking will fulfill
the objectives set for the benchmarking project;
The development of a KPI framework is an iterative process. Experience
demonstrates that a pilot study provides valuable information for the
improvement of the framework as well as the whole benchmarking process;
The pilot study provides potential for cost-saving by identifying some of the
pitfalls that may occur during a full-scale implementation of the benchmarking
process; and
11
11
Benchmarking: Lessons and Good Practices
The early engagement of stakeholders in the pilot study ensures their buy-in to
the benchmarking approach by giving them a first taste of the potential
benefits as well as instilling a sense of ownership.
Once a performance gap has been identified, case studies will provide an in-depth
analysis of the processes and management practices that other organizations have
used to achieve their superior performance. The case studies help with:
Providing a thorough understanding of the organization’s strategy, policies
and operation behind the performance data;
Identifying good practices in both operations and management that other
organizations can adopt to improve their performance; and
Offering information to support better dialogue between the policymaker and
managers in charge of service delivery.
2.4 BENCHM ARKING AS A CONTINUOUS PERFORM ANCE IMPROVEMENT
PROGRAM
Benchmarking should be developed as a long-term process and not a one-off exercise.
A long-term approach to benchmarking delivers tangible benefits to participating
organizations because:
It can take many years and iterative cycles to achieve benchmarking indicators
that are comparable and reported on a consistent basis (Anderson, 2006).
One-off benchmarking studies are rarely successful for this reason;
The value to any policymaker, or related stakeholder, is the results which are
extracted over time. Ongoing benchmarking allows performance trends to be
identified through time series analysis. Trends provide more conclusive
findings than any one-off snapshot; and
Performance trends help monitor the effectiveness of good practice on
performance improvements.
12
12
A Framework for Urban Transport Benchmarking
3 THE DEVELOPMENT OF THE KEY PERFORMANCE
MEASUREMENT FRAMEWORK 3.1 BACK GROUND TO PERFORMANCE MEASURES/INDICATORS
Performance measures/indicators are used in both performance measurement and
benchmarking. Benchmarking is a technique used to compare an organization’s
performance relative to a peer organization with similar contextual characteristics
based on the activity under consideration (Henning et al., 2010). Performance
measurement is normally an internally focused process where an organization
measures its current performance against historical performance. The performance
measures are normally a quantitative measure or index that numerically expresses a
specific activity. In the context of this study, reference is made to key performance
indicators (KPIs), as the aim is not to measure a complete set of performance measures,
but rather focus on some key ones that will provide a sufficient understanding of
relative comparison in the benchmarking process.
The challenge in defining KPIs is to select the appropriate ones that will give a sufficient
understanding of overall performance. The KPIs should also be practical in terms of
data availability and understandable to the audience. Useful KPIs can normally be
associated with the SMART principle (NAMS, 2007):
Specific – A KPI must cover concisely one aspect of the activity;
Measurable – KPIs must be quantifiable as subjective measures, e.g. a rating
scale, could lead to distorted comparisons;
Achievable – Available data and common items normally measured must be
used for KPIs. It would not be useful to develop sophisticated KPIs for which
data are unobtainable;
Relevant – The KPI must be relevant to the activity being considered.
Sometimes a different KPI is used to indicate or estimate a different activity.
For example, one can use fuel consumption as a surrogate of CO2 emission if
no actual emission data exist; and
Timebound – KPIs of similar timeframes need to be used in order to be an
effective comparison tool for benchmarking. Therefore, the data need to be
date-stamped.
3.2 THE PERFORMANCE AREAS TARGETED THROUGH THIS BENCHMARKING
EXERCISE
As explained in Section 1.1 the aim of this benchmarking study is to provide a
framework that includes a tool to measure and compare the effectiveness of public
transport systems. This tool could be used by decision makers to target their efforts
into areas that will improve the public transport system and as a result increase the
13
13
The Development of the Key Performance Measurement Framework
uptake of this transport mode. Ultimately, the KPIs have to be able to quantify the
quality of the public transport service within the context of its operating environment.
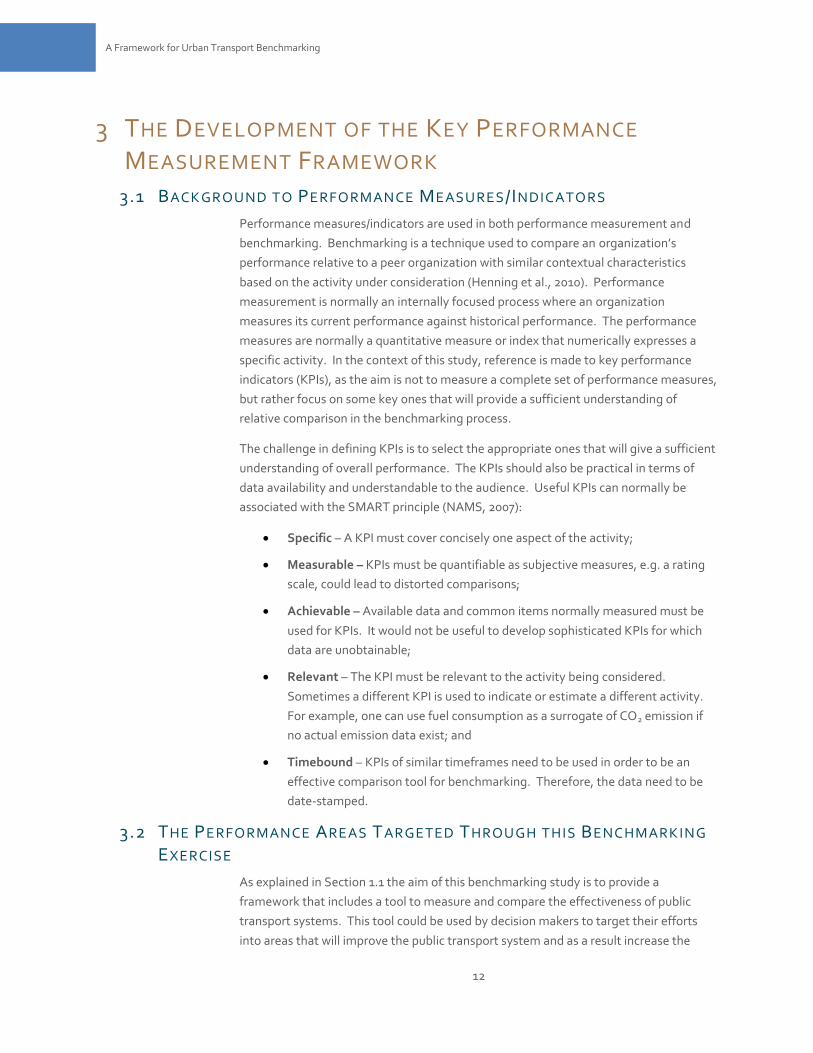
For example Figure 3.1 illustrates some of the main items highlighted as quality services
for a public transport strategy developed by the Auckland Regional Council (ARC,
2009).
The areas of measurement of the quality of public transport services are discussed in
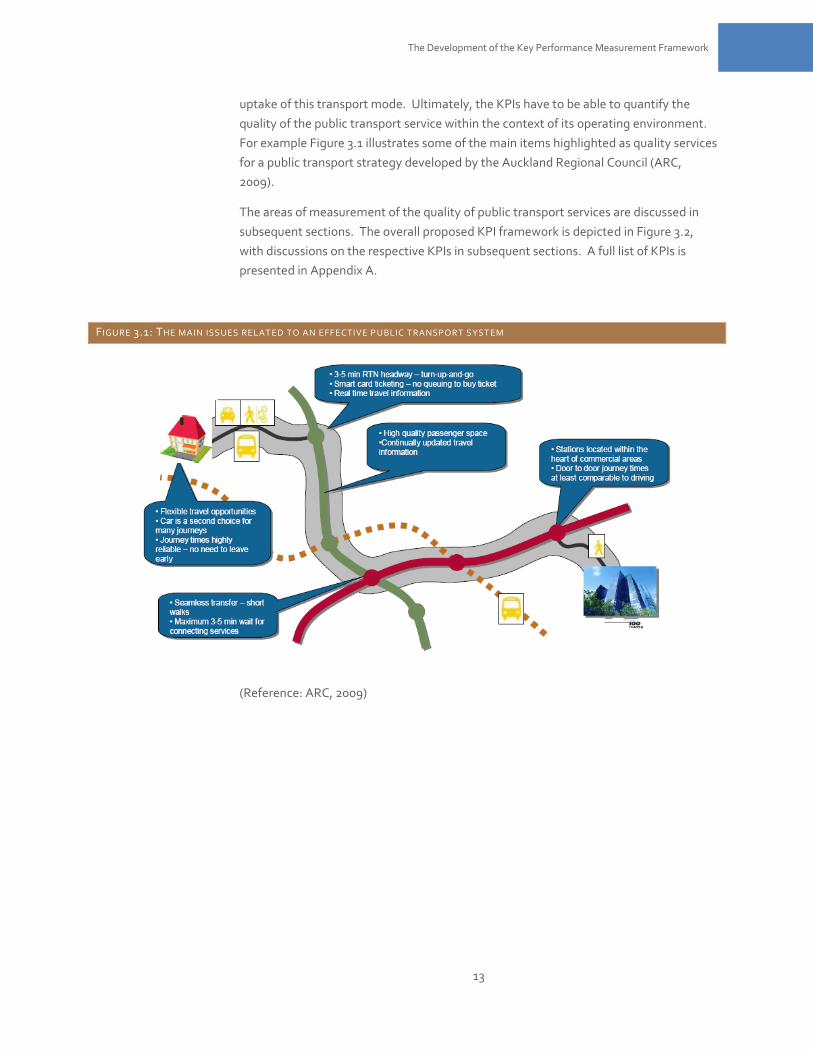
subsequent sections. The overall proposed KPI framework is depicted in Figure 3.2,
with discussions on the respective KPIs in subsequent sections. A full list of KPIs is
presented in Appendix A.
FIGURE 3.1: THE MAIN ISSUES RELAT ED TO AN EFFECTIVE P UBLIC TRANSPORT SYST EM
(Reference: ARC, 2009)
14
14
A Framework for Urban Transport Benchmarking
FIGURE 3.2: PROPOSED KPI FRAMEWORK FOR BENCHM ARKING PUBLIC TRANSP ORT
3.2.1 UPT AK E O F P UB LIC T R ANS PO R T
The first and most obvious performance area for public transport relates to the portion
of travelers using the services. Although it is not a direct measure of the quality of a
public transport system it is a definite indicator of its popularity or in some cases the
patron’s dependency on it for essential travel. Useful KPIs will need to explore
information on the following:
The modal composition and patronage share for each1;
The passenger distance travelled; and
The public transport patronage.
1 Note that for simplicity only work-based trips are considered in this framework
A
Uptake of Public Transport
Travel Efficiency
(Reliability /
Effectiveness in Operations
Coverage)
Accessable
Affordability
Travel Experience
(Safe
Secure and Comfort)
Pu
blic
Tra
ns
po
rt Q
ua
lity
Travel Mode
Passenger Kilometre
Travelled
Public-Transport Patronage
Speed of Journey
Travel Time
Reliability Departure &
Arrival Time
Cost of Travel
Road Safety
Personal Security
Vehicle fuel consumption
Catchment Area-Time
Catchment Area-Distance
Comfort
15
15
The Development of the Key Performance Measurement Framework
Linkage between public transport uptake and quality of the services should be handled
with care as there may not be a direct relationship. Especially in transition and
developing countries public transport has to be viewed in the context of the socio-
economic background. For example, in some countries people use public transport
simply because they don’t have any other means of travelling to work. For that reason,
public transport uptake has to be viewed against the background of the contextual data
and quality of the service data.
3.2.2 TR AV E L EF F IC IE NC Y
There is never a single factor that will determine why someone uses public transport as
a means of travel. For example, affordability and accessibility are often paramount
reasons why people use public transport. If a person has difficulty in using alternative
means of travel, by default this person will use public transport.
However, if the use of public transport pivots on the free choice of a person, travel
efficiency will be one of the most important factors determining the uptake of this
service. Travel efficiency is governed by three main factors including reliability,
effectiveness of operations and coverage of the service. Many publications such as
Ceder (2007) list a large number of performance measures that could be used to
measure the efficiency of public transport services. For benchmarking purposes a
select number of KPIs have to be chosen to cover the most critical aspects of public
transport. These include:
Speed of the journey;
Travel time;
Vehicle fuel consumption; and
Reliability in both departure and arrival times.
It can be seen from this list that the overall journey time and certainty around the
journey time is one of the main considerations for travel efficiency. This efficiency is
however a complex activity as there are other factors that impact on it, including trip
make-up (e.g. the use of multi-modal services such as ferries and buses in one trip),
connectivity between services, and the layout and efficiency of transfer facilities such as
train and bus stops. Data on all these factors are not always readily available and for
that reason focus has been placed on overall trip duration (travel time) and speed of the
journey (distance covered/travel time) to moderate the overall performance of this
activity.
The only issue associated with travel time is that it is not always within the control of
the public transport operation. For example in congested networks, public transport
can offer a more effective alternative if access preference is provided through
dedicated bus lanes. In other circumstances, public transport would be subjected to the
same congestion issues as other travelling modes. In order to obtain a better
understanding of operational effectiveness, the functionality of arrival and departure
times are tested in addition to travel time.
16
16
A Framework for Urban Transport Benchmarking
The next area considers the efficiency of energy use for the overall transport system.
By understanding the overall energy use for the travelling public, one can obtain an
understanding of not only the energy use per trips made, but also an indication of
emission issues. The latter need a significant amount of research for accurate
estimates as they are strongly related to vehicle type and age. However, there are
some crude estimation models available that could give a reasonable indication of
emission levels based on fuel consumption levels.
3.2.3 AC C E S S IB IL IT Y
There are normally two aspects to the accessibility of public transport: accessibility for
all travelling public and provisions for people with limited mobility. This study focuses
on the overall access for all patrons.
Accessibility in this project is defined in terms of the distance from the most remote
location within a catchment area to the transport facility. In addition, the walking time
from the most remote location to the transport facility needs to be incorporated.
Neither time nor distance measures, in isolation, can give a sufficient view on the ease
of access to the transport facility.
3.2.4 AF F O R D AB IL I T Y
Affordability is one of the primary drivers of public transport patronage in transition
and developing countries. As expected, one needs to normalize this KPI to the socio-
economic backdrop of the city in order for this KPI to provide a sensible comparison
between different areas.
3.2.5 TR AV E LL IN G EXPE R IE N C E
In terms of travelling experience, this study seeks more information on the following
three characteristics:
How safe is the journey in terms of road safety;
How secure are the facilities including terminals and public transport mode; and
How comfortable is the transport mode to the users?
Road safety data are normally readily available and in most cases it is possible to split
the public transport component from the remaining crash information. This measure
also needs to be normalized to the appropriate contextual data such as person/vehicle-
km travelled.
Security data can include both actual crime statistics associated with public transport
and perceived security from patrons. Henning et al. (2010) demonstrated that there
was normally (but not in all cases) a good correlation between perceived security and
actual crime statistics. Figure 3.3 illustrates the output from a benchmarking process in
New Zealand. The graph shows both the actual and perceived security aspects relating
to public transport. It can be seen that there is not always a direct relationship between
actual and perceived security. The report highlighted factors such as the media having
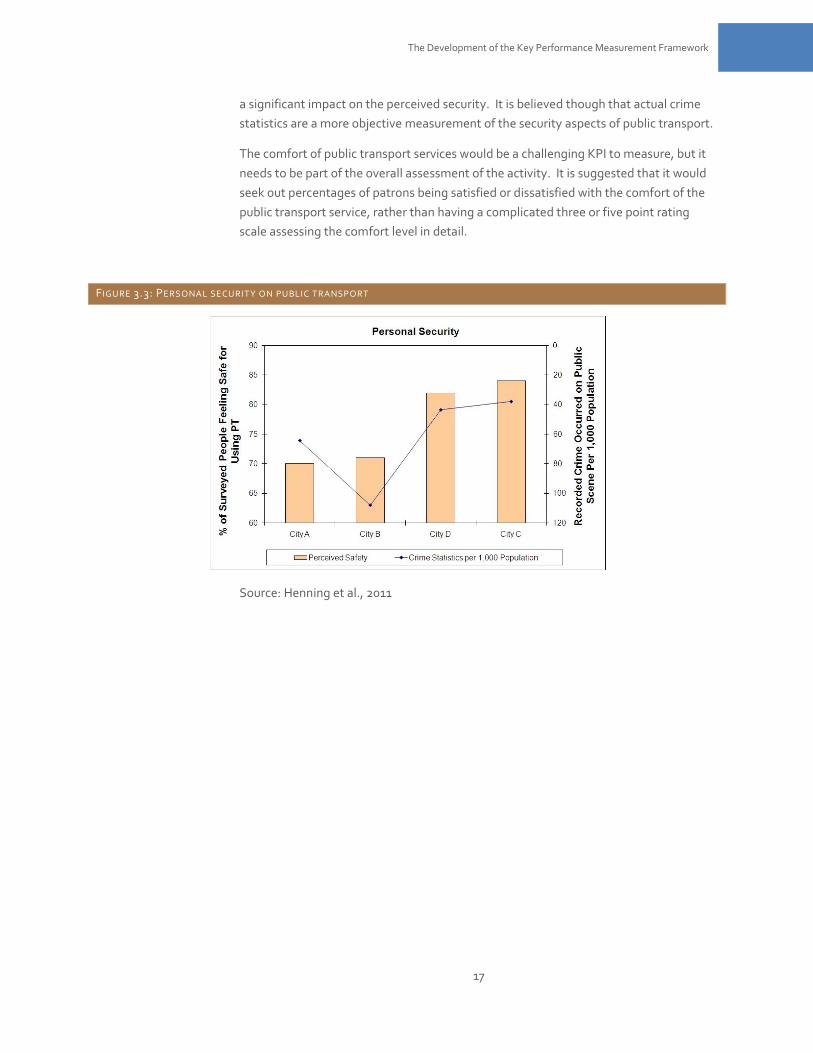
17
17
The Development of the Key Performance Measurement Framework
a significant impact on the perceived security. It is believed though that actual crime
statistics are a more objective measurement of the security aspects of public transport.
The comfort of public transport services would be a challenging KPI to measure, but it
needs to be part of the overall assessment of the activity. It is suggested that it would
seek out percentages of patrons being satisfied or dissatisfied with the comfort of the
public transport service, rather than having a complicated three or five point rating
scale assessing the comfort level in detail.
FIGURE 3.3: PERSONAL SECURITY ON PUBLIC TRANSPORT
Source: Henning et al., 2011
18
18
A Framework for Urban Transport Benchmarking
4 PILOT STUDY DETAILS 4.1 THE OBJECTIVE OF THE P ILOT STUDY
The main objective of the pilot study was to demonstrate the value and feasibility of
the benchmarking process using a small sample of KPIs and a limited number of study
areas. Secondary objectives include the investigation into the practical and data-
related aspects of the benchmarking process. It would be risky to embark on a full-
scale benchmarking process without testing the conceptual framework and data
availability. Experience has shown that in most cases it is difficult to obtain consistent
data from all participants due to a variety of factors, including:
The purposes of data collection are different between countries thus resulting
in completely different data collection strategies;
The level of data collection varies significantly given different drivers and
available resources for the data collection; and
The contextual background to each country varies significantly, requiring
sufficient understanding of the background and avoiding data reporting
without appropriate normalization.
This part of the study was therefore primarily aimed at developing the concept. As
such it is not an in-depth research into public transport issues and initiatives in the
selected pilot cities. It also involves the development of processes and techniques to
normalize the data so that these provide meaningful comparisons. The pilot testing
process of this study is summarized in the subsequent sections.
4.2 SELECTED KEY PERFORMANCE MEASURES
The KPIs proposed for the pilot study allow for performance measurement and
benchmarking in the following main areas (refer to Figure 3.2):
Uptake of public transport;
Travel efficiency including reliability, effectiveness in operation and coverage;
Accessibility;
Affordability; and
Travel experience including safety and comfort.
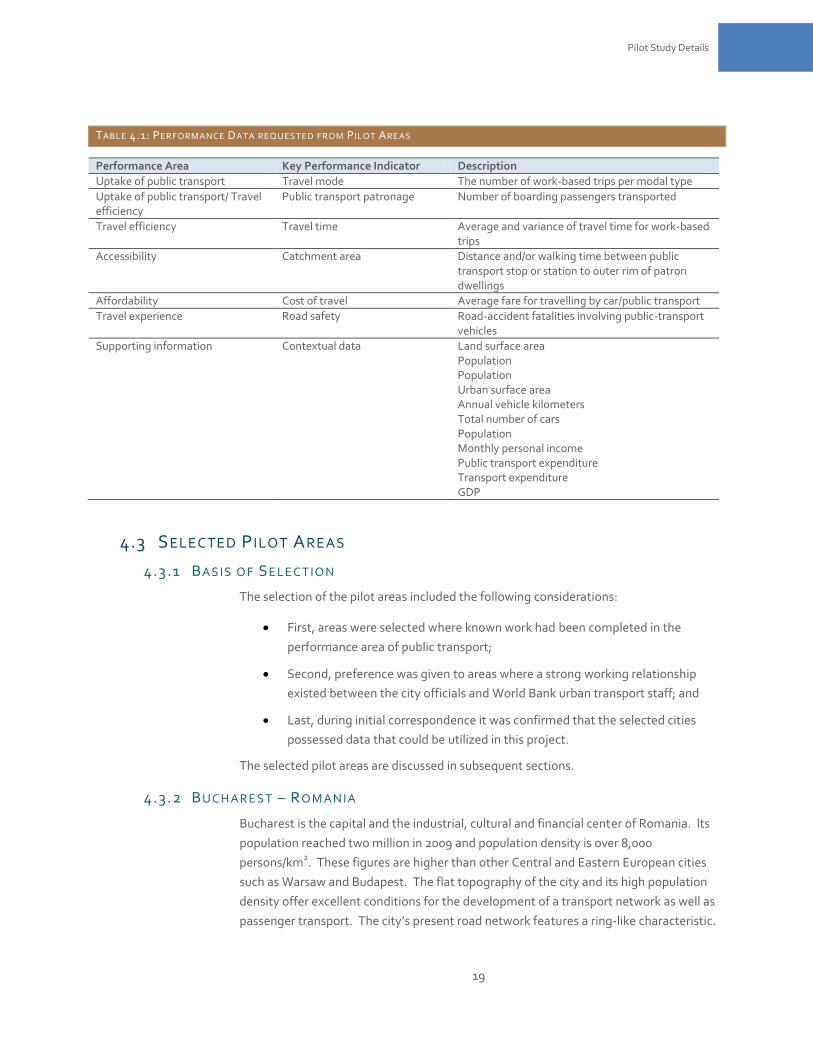
The KPI and data items requested in these main areas are summarized in Table 4.1 and
more details are provided in Appendix A.
19
19
Pilot Study Details
TABLE 4.1: PERFORMANCE DATA REQUESTED FROM PILOT AREAS
Performance Area Key Performance Indicator Description
Uptake of public transport Travel mode The number of work-based trips per modal type
Uptake of public transport/ Travel efficiency
Public transport patronage Number of boarding passengers transported
Travel efficiency Travel time Average and variance of travel time for work-based trips
Accessibility Catchment area Distance and/or walking time between public transport stop or station to outer rim of patron dwellings
Affordability Cost of travel Average fare for travelling by car/public transport
Travel experience Road safety Road-accident fatalities involving public-transport vehicles
Supporting information Contextual data Land surface area Population Population Urban surface area Annual vehicle kilometers Total number of cars Population Monthly personal income Public transport expenditure Transport expenditure GDP
4.3 SELECTED P ILOT AREAS
4.3.1 BAS IS O F SE LE C T IO N
The selection of the pilot areas included the following considerations:
First, areas were selected where known work had been completed in the
performance area of public transport;
Second, preference was given to areas where a strong working relationship
existed between the city officials and World Bank urban transport staff; and
Last, during initial correspondence it was confirmed that the selected cities
possessed data that could be utilized in this project.
The selected pilot areas are discussed in subsequent sections.
4.3.2 BUC H AR E S T – RO M AN I A
Bucharest is the capital and the industrial, cultural and financial center of Romania. Its
population reached two million in 2009 and population density is over 8,000
persons/km2. These figures are higher than other Central and Eastern European cities
such as Warsaw and Budapest. The flat topography of the city and its high population
density offer excellent conditions for the development of a transport network as well as
passenger transport. The city’s present road network features a ring-like characteristic.
20
20
A Framework for Urban Transport Benchmarking
Expansion of the urban area is evident from the growth of suburban centers and
development of low-density housing along the outer ring road.
Urban transport is a pressing concern in Bucharest. Some of the transport problems in
Bucharest are (Beldean et al., 2002; J.I.C.A., 2000):
Increase in vehicle ownership: The reforms of the political system together
with economic growth have changed people’s consumption patterns. Private
vehicle ownership is expected to reach 259 per 1,000 persons in 2015, which is
1.4 times more than what it was in 1998. As a result, the number of personal
trips is expected to increase. This increased travel demand will add pressure to
transport infrastructure and services;
Growing traffic congestion: Traffic congestion already occurs at major
intersections and trunk roads in the central area during peak times. Since
there are more people living in the surrounding areas than in the central area,
which remains the centre of commercial and business activities, daily
commuting into the central area is increasing;
Decrease of public transport usage: The rapid increase in private cars is only
one of the main factors contributing to a decrease in public transport usage.
There are two main public transport operators in Bucharest: METROREX
(metro) and RATB (surface transport). The two operators use different ticking
systems and so passenger transfer cannot be made using one ticket. At the
same time, public transport is also provided by several private companies
authorised by the Municipality of Bucharest. While duplicated and
complicated routes are common on trunk roads, due to the lack of cooperation
and coordination between the different providers there is inadequate coverage
on low-demand areas. The transfer between different modes is often
inconvenient. These factors combined reduce the attractiveness of public
transport;
Discontinuity in road network: Studies have shown that there are missing links
in the ring roads and some of the district roads are not well integrated into the
main network; and
Insufficient parking supply in the central area: The central area of Bucharest
was built up in 1930s and is fairly compact. The parking spaces are unable to
cope with the increasing demand for parking. Also, enforcement of parking
regulations is not so strict. Therefore, it is common to see vehicles illegally
parked on roads, causing traffic congestion and accidents. This is also
inconvenient for pedestrians.
4.3.3 BE IJ I NG – CH IN A
The municipality of Beijing had a population of 17.6 million in 2009 and a population
density of 1,069 persons/km2. The urban centre of Beijing had a population density as
high as 30,574 persons/km2 in 2000 (Ahmed et al., 2008). The urban transport system in
21
21
Pilot Study Details
Beijing is mainly road based. During the last 10 years car ownership in Beijing has
rapidly increased. Compounded with a 1.7-fold increase in the urban area from 1997 to
2004, an increasingly diversified urban population due to the influx of a migrant work
force and the change in urban land use patterns, Beijing is experiencing tremendous
pressure on urban transport travel demand. Some of these problems are (Ahmed et al.,
2008; Creutzig and He, 2009; Darido et al., 2009):
Increasing vehicle ownership: Automobile ownership in Beijing is growing at an
annual rate of 20.5%. This contributes to an increasing travel demand. The
average number of trips per person per day in 2003 increased by nearly 75%
compared with 1986 figures;
Traffic congestion: On average it takes over an hour to commute to work in
Beijing. A recent survey revealed that Beijing residents take the longest time
to travel to work compared with all major cities in China. Vehicle speed
declined from 45 km/hr in 1994 to less than 10 km/hr in 2005 on major ring
roads in Beijing and this is now extending to outer ring roads and major radial
and arterial roads;
Declining public transport usage: The public transport system in Beijing is very
well developed, but the usage is declining due to a combination of the
following reasons. Automobile-oriented policies lead to rapid motorization
and urbanization. Increasing urban sprawl and the relocation of urban dwellers
to suburban development increase travel distance and the time to reach the
workplace. Increasing wealth has brought a desire for choices and flexibility.
Increasing numbers of cars on the road reduce bus speeds substantially;
Greenhouse gas emissions: Rapid motorization directly relates to an increase
in energy use and therefore greenhouse gas emissions; and
Air pollution: Vehicle emissions have become the main source of air pollution
in Beijing.
4.3.4 S I NG APO R E
Singapore, as an island country, has limited land supply for land transport
development. On-going land reclamation projects have expanded the land area from
581.5 km2 in the 1960s to 710 km
2 in 2009.
Singapore’s land transport approach of controlled motorization and public transit
development has made it an example of success of how the two modes of transport can
be facilitated in parallel. Its transport planning and management policy recognizes the
importance of the demand for private car usage as well as the need to provide public
transport (Han, 2009). Transition and developing countries may be able to learn from
the Singapore experience. In this study, Singapore is considered a high level
benchmark.
22
22
A Framework for Urban Transport Benchmarking
4.3.5 CAPE TO W N – SO UT H AF R IC A
In terms of transport infrastructure, South Africa is among the best in Africa, supporting
both domestic and regional needs. Cape Town is the second most populous cities and
one of the four advanced economic centers in South Africa. The population of Cape
Town was close to 3.5 million in 2007, with a population density of about 1,400
persons/km2.
Cape Town’s urban transport issues are dictated by two factors. Firstly, the legacy from
the old apartheid governance structure resulted in large settlements of the workforce
living far distances from the CBD in low density dwellings. Although the urban form
generates large movement numbers, mass transport has limited access due to
distances to terminus. As a result there has been a significant uptake in informal and
less effective public transport options such as minibus taxis. Secondly, South Africa has
significant socio-economic challenges with a large portion of the population having
high levels of poverty, inadequate housing and basic services. (Haskins, 2006). Since
1994 the government has been focusing on addressing some of the poverty issues but
with the high demands infrastructure development has not kept up with the growth in
population and travel demand. As a result some of the transport issues faced by a city
such as Cape Town include (Haskins, 2006):
Outdated transport network-focused on private car use & ‘traditional’
destinations (e.g. CBD);
Current urban form generates large amounts of movement with great
financial, social & environmental cost to city; and
Life inconvenient & expensive for those who cannot afford a car. Poor have
little access to economic/social opportunities with the public transport system
inefficient:
difficult to switch from one mode to another
some parts of city inaccessible.
An integrated rapid-transit (IRT) system has been proposed to be a part of the solutions
to the transport issues in Cape Town. The project includes a priority rail plan, a bus
rapid-transit system, improvements to conventional bus and minibus operations, urban
space upgrades to provide safer cycling and walking experience and park-and ride
facilities. The construction of the first phase of the IRT system began in 2009 and it will
take the next ten to fifteen years to complete the project. Once completed the IRT
system will provide the Cape Town residents a safe, efficient and quality public transit.
4.3.6 CO LO M B O – SR I LA NK A
Colombo is the economic and political centre of Sri Lanka. The population of Colombo
reached 2.3 million in 2001 and the city centre has a population density of over 3,300
people/km2. Public transport (buses) is the main transport mode. The number of
vehicles is about 97 vehicles/1,000 population. Studies have shown that only a fraction
23
23
Pilot Study Details
of the vehicles are privately owned, the rest being owned by companies and various
levels of government.
The transport problems in Colombo are discussed in the World Bank (2001) report.
Some of the main problems are:
Low-quality and unsafe public transport service: Bus is the dominant public
transport mode and is operated by both public and private operators. Despite
an extensive bus service network and an overloading of buses on street, the
buses are poorly maintained, overcrowded and uncomfortable. Services in off-
peak and on low-demand routes are poorer than at peak hours in terms of
frequency and punctuality. It has been identified that the key factor
contributing to the low-quality service is an incoherent public transport policy
in the regulation and financing of the public transport sector;
Underdeveloped road infrastructure: Roads show an abundance of cracks and
potholes due to poor drainage and neglected maintenance work. The road
network lacks orbital links and secondary roads;
Chaotic and unsafe traffic conditions: Roadways are undivided and narrow.
They are shared by mixed types of vehicles including buses, truck motorcycles,
cars, 3-wheelers and bicycles, and pedestrians as well. Motorcycles, 3-
wheelers and bicycles have the highest accident rates;
Congestion: Travel speed is only 10–15 km/hr in peak hours on main arterial
roads. Some of the busiest roads have a speed as low as 5 km/hr; and
Unregulated parking: Traffic lanes get blocked by double parking. Vehicles
park illegally on walkways and entrances.
4.4 APPLICABILITY OF P I LOT AREAS
It is difficult to undertake any international study on the basis of limited countries.
However in the case of this study with its current objectives it is reasonable to expect
that the five countries and cities selected can provide a balanced view of the potential
value of a benchmarking process. The benchmarking also includes cities in high-
income countries such as New Zealand, Australia, and Canada.
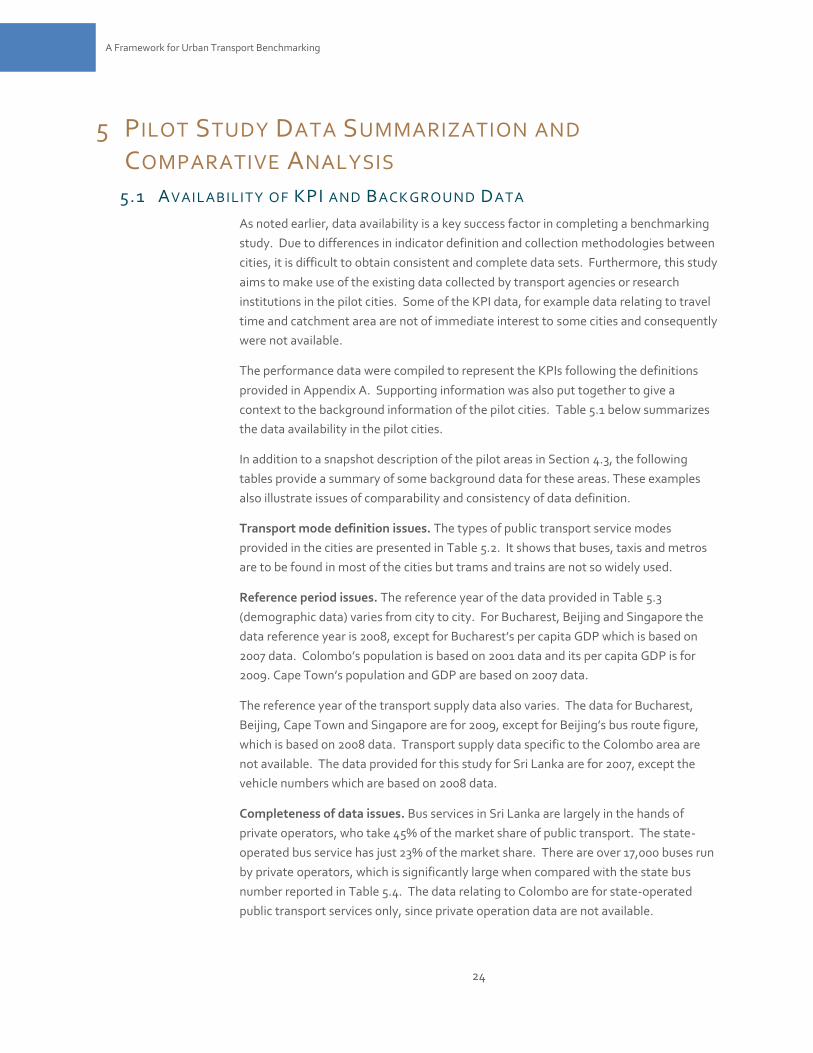
24
24
A Framework for Urban Transport Benchmarking
5 PILOT STUDY DATA SUMMARIZATION AND
COMPARATIVE ANALYSIS 5.1 AVAILABILITY OF KPI AND BACK GROUND DATA
As noted earlier, data availability is a key success factor in completing a benchmarking
study. Due to differences in indicator definition and collection methodologies between
cities, it is difficult to obtain consistent and complete data sets. Furthermore, this study
aims to make use of the existing data collected by transport agencies or research
institutions in the pilot cities. Some of the KPI data, for example data relating to travel
time and catchment area are not of immediate interest to some cities and consequently
were not available.
The performance data were compiled to represent the KPIs following the definitions
provided in Appendix A. Supporting information was also put together to give a
context to the background information of the pilot cities. Table 5.1 below summarizes
the data availability in the pilot cities.
In addition to a snapshot description of the pilot areas in Section 4.3, the following
tables provide a summary of some background data for these areas. These examples
also illustrate issues of comparability and consistency of data definition.
Transport mode definition issues. The types of public transport service modes
provided in the cities are presented in Table 5.2. It shows that buses, taxis and metros
are to be found in most of the cities but trams and trains are not so widely used.
Reference period issues. The reference year of the data provided in Table 5.3
(demographic data) varies from city to city. For Bucharest, Beijing and Singapore the
data reference year is 2008, except for Bucharest’s per capita GDP which is based on
2007 data. Colombo’s population is based on 2001 data and its per capita GDP is for
2009. Cape Town’s population and GDP are based on 2007 data.
The reference year of the transport supply data also varies. The data for Bucharest,
Beijing, Cape Town and Singapore are for 2009, except for Beijing’s bus route figure,
which is based on 2008 data. Transport supply data specific to the Colombo area are
not available. The data provided for this study for Sri Lanka are for 2007, except the
vehicle numbers which are based on 2008 data.
Completeness of data issues. Bus services in Sri Lanka are largely in the hands of
private operators, who take 45% of the market share of public transport. The state-
operated bus service has just 23% of the market share. There are over 17,000 buses run
by private operators, which is significantly large when compared with the state bus
number reported in Table 5.4. The data relating to Colombo are for state-operated
public transport services only, since private operation data are not available.
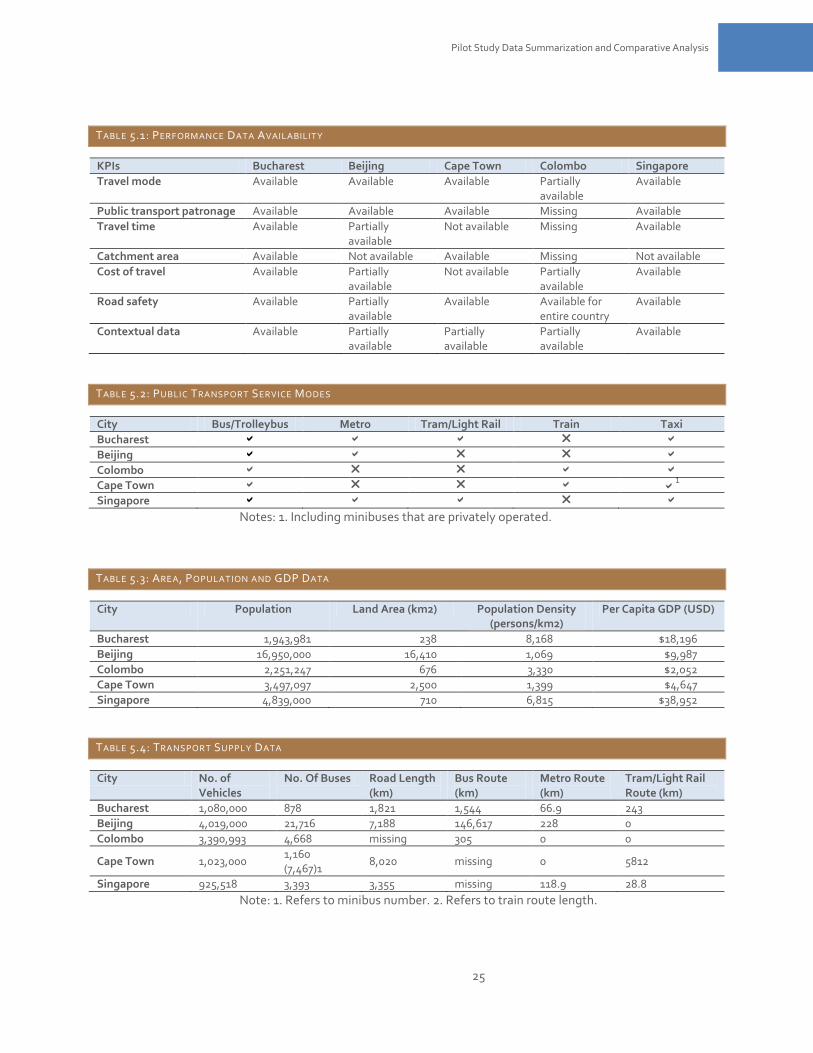
25
25
Pilot Study Data Summarization and Comparative Analysis
TABLE 5.1: PERFORMANCE DATA AVAILABILITY
KPIs Bucharest Beijing Cape Town Colombo Singapore
Travel mode Available Available Available Partially available
Available
Public transport patronage Available Available Available Missing Available
Travel time Available Partially available
Not available Missing Available
Catchment area Available Not available Available Missing Not available
Cost of travel Available Partially available
Not available Partially available
Available
Road safety Available Partially available
Available Available for entire country
Available
Contextual data Available Partially available
Partially available
Partially available
Available
TABLE 5.2: PUBLIC TRANSPORT SERVICE MODES
City Bus/Trolleybus Metro Tram/Light Rail Train Taxi
Bucharest
Beijing
Colombo
Cape Town 1
Singapore
Notes: 1. Including minibuses that are privately operated.
TABLE 5.3: AREA, POPULATION AND GDP DATA
City Population Land Area (km2) Population Density (persons/km2)
Per Capita GDP (USD)
Bucharest 1,943,981 238 8,168 $18,196
Beijing 16,950,000 16,410 1,069 $9,987
Colombo 2,251,247 676 3,330 $2,052
Cape Town 3,497,097 2,500 1,399 $4,647
Singapore 4,839,000 710 6,815 $38,952
TABLE 5.4: TRANSPORT SUPPLY DATA
City No. of Vehicles
No. Of Buses Road Length (km)
Bus Route (km)
Metro Route (km)
Tram/Light Rail Route (km)
Bucharest 1,080,000 878 1,821 1,544 66.9 243
Beijing 4,019,000 21,716 7,188 146,617 228 0
Colombo 3,390,993 4,668 missing 305 0 0
Cape Town 1,023,000 1,160 (7,467)1
8,020 missing 0 5812
Singapore 925,518 3,393 3,355 missing 118.9 28.8
Note: 1. Refers to minibus number. 2. Refers to train route length.
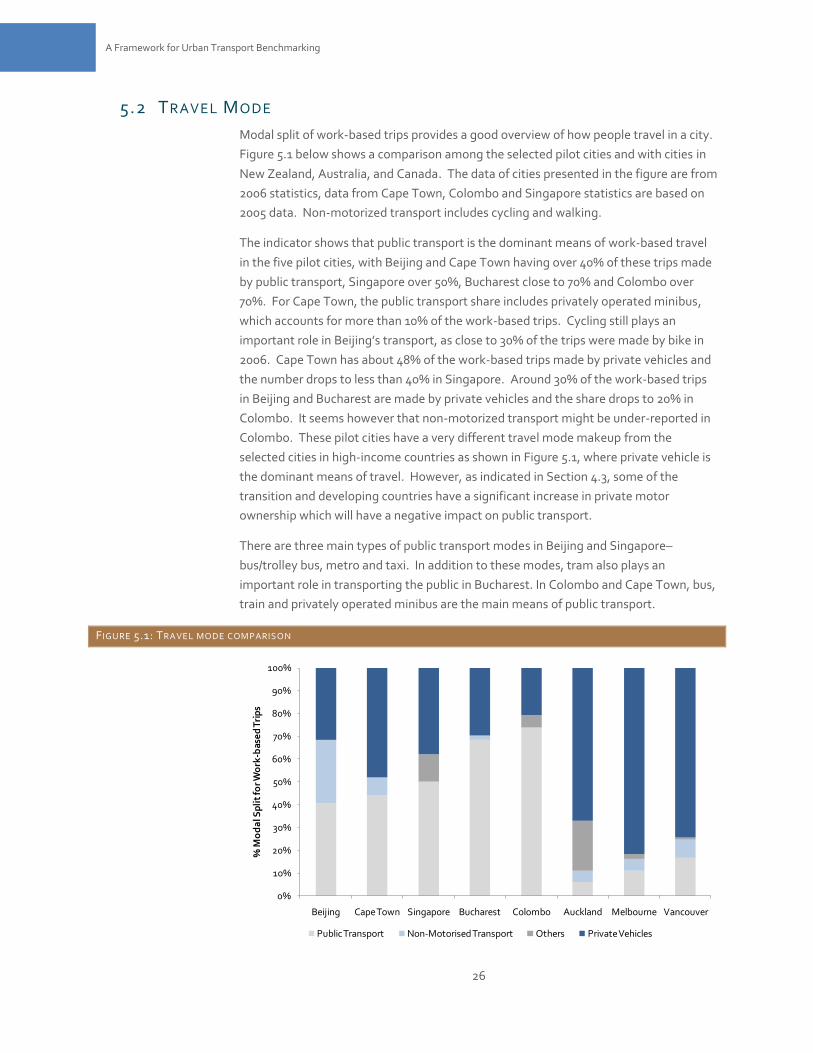
26
26
A Framework for Urban Transport Benchmarking
5.2 TRAVEL MODE
Modal split of work-based trips provides a good overview of how people travel in a city.
Figure 5.1 below shows a comparison among the selected pilot cities and with cities in
New Zealand, Australia, and Canada. The data of cities presented in the figure are from
2006 statistics, data from Cape Town, Colombo and Singapore statistics are based on
2005 data. Non-motorized transport includes cycling and walking.
The indicator shows that public transport is the dominant means of work-based travel
in the five pilot cities, with Beijing and Cape Town having over 40% of these trips made
by public transport, Singapore over 50%, Bucharest close to 70% and Colombo over
70%. For Cape Town, the public transport share includes privately operated minibus,
which accounts for more than 10% of the work-based trips. Cycling still plays an
important role in Beijing’s transport, as close to 30% of the trips were made by bike in
2006. Cape Town has about 48% of the work-based trips made by private vehicles and
the number drops to less than 40% in Singapore. Around 30% of the work-based trips
in Beijing and Bucharest are made by private vehicles and the share drops to 20% in
Colombo. It seems however that non-motorized transport might be under-reported in
Colombo. These pilot cities have a very different travel mode makeup from the
selected cities in high-income countries as shown in Figure 5.1, where private vehicle is
the dominant means of travel. However, as indicated in Section 4.3, some of the
transition and developing countries have a significant increase in private motor
ownership which will have a negative impact on public transport.
There are three main types of public transport modes in Beijing and Singapore–
bus/trolley bus, metro and taxi. In addition to these modes, tram also plays an
important role in transporting the public in Bucharest. In Colombo and Cape Town, bus,
train and privately operated minibus are the main means of public transport.
FIGURE 5.1: TRAVEL MODE COMPARISON
0%
10%
20%
30%
40%
50%
60%
70%
80%
90%
100%
Beijing Cape Town Singapore Bucharest Colombo Auckland Melbourne Vancouver
% M
od
al S
pli
t fo
r Wo
rk-b
ase
d T
rip
s
Public Transport Non-Motorised Transport Others Private Vehicles
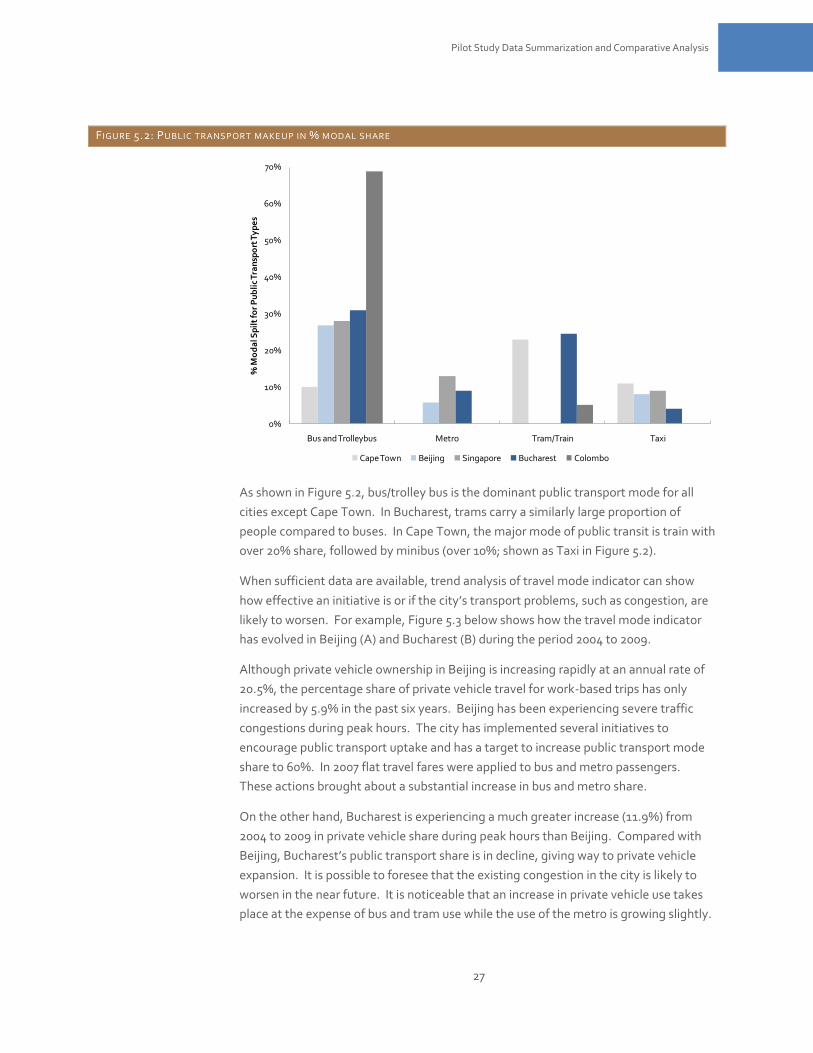
27
27
Pilot Study Data Summarization and Comparative Analysis
FIGURE 5.2: PUBLIC TRANSPORT MAKEUP IN % MODAL SHARE
As shown in Figure 5.2, bus/trolley bus is the dominant public transport mode for all
cities except Cape Town. In Bucharest, trams carry a similarly large proportion of
people compared to buses. In Cape Town, the major mode of public transit is train with
over 20% share, followed by minibus (over 10%; shown as Taxi in Figure 5.2).
When sufficient data are available, trend analysis of travel mode indicator can show
how effective an initiative is or if the city’s transport problems, such as congestion, are
likely to worsen. For example, Figure 5.3 below shows how the travel mode indicator
has evolved in Beijing (A) and Bucharest (B) during the period 2004 to 2009.
Although private vehicle ownership in Beijing is increasing rapidly at an annual rate of
20.5%, the percentage share of private vehicle travel for work-based trips has only
increased by 5.9% in the past six years. Beijing has been experiencing severe traffic
congestions during peak hours. The city has implemented several initiatives to
encourage public transport uptake and has a target to increase public transport mode
share to 60%. In 2007 flat travel fares were applied to bus and metro passengers.
These actions brought about a substantial increase in bus and metro share.
On the other hand, Bucharest is experiencing a much greater increase (11.9%) from
2004 to 2009 in private vehicle share during peak hours than Beijing. Compared with
Beijing, Bucharest’s public transport share is in decline, giving way to private vehicle
expansion. It is possible to foresee that the existing congestion in the city is likely to
worsen in the near future. It is noticeable that an increase in private vehicle use takes
place at the expense of bus and tram use while the use of the metro is growing slightly.
0%
10%
20%
30%
40%
50%
60%
70%
Bus and Trolleybus Metro Tram/Train Taxi
% M
od
al S
pil
t fo
r P
ub
lic
Tra
nsp
ort
Ty
pe
s
Cape Town Beijing Singapore Bucharest Colombo
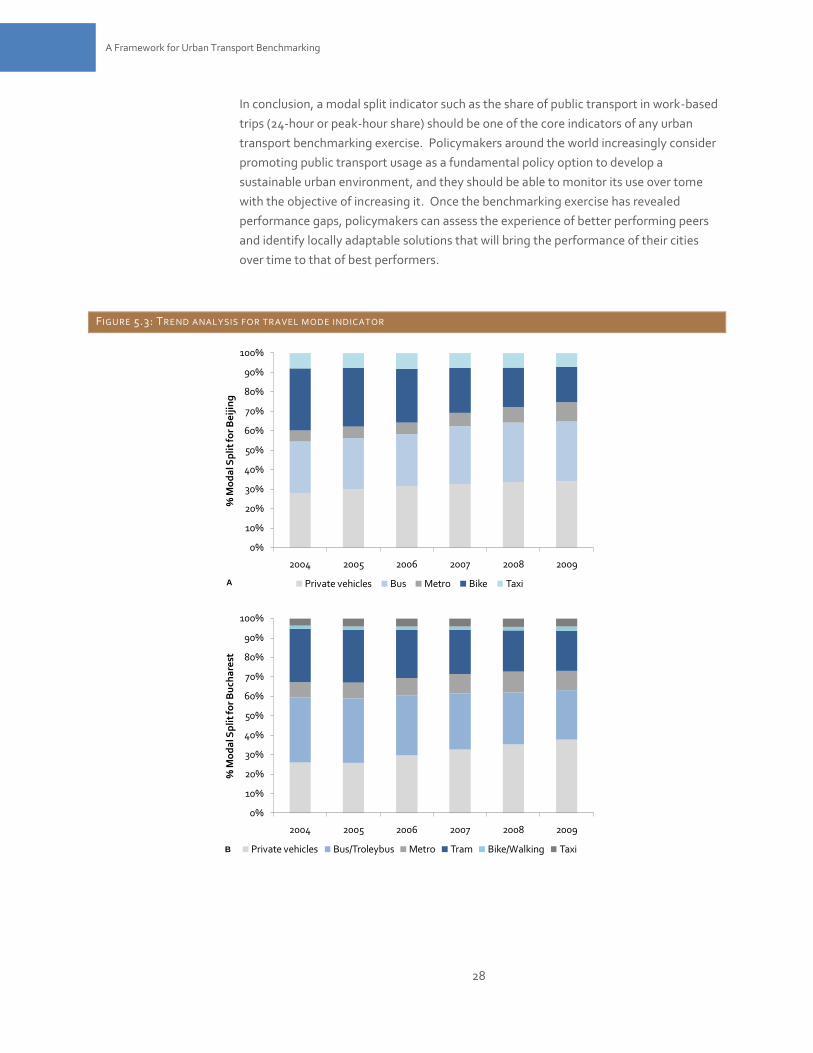
28
28
A Framework for Urban Transport Benchmarking
In conclusion, a modal split indicator such as the share of public transport in work-based
trips (24-hour or peak-hour share) should be one of the core indicators of any urban
transport benchmarking exercise. Policymakers around the world increasingly consider
promoting public transport usage as a fundamental policy option to develop a
sustainable urban environment, and they should be able to monitor its use over tome
with the objective of increasing it. Once the benchmarking exercise has revealed
performance gaps, policymakers can assess the experience of better performing peers
and identify locally adaptable solutions that will bring the performance of their cities
over time to that of best performers.
FIGURE 5.3: TREND ANALYSIS FOR TRAVEL MODE INDICATOR
0%
10%
20%
30%
40%
50%
60%
70%
80%
90%
100%
2004 2005 2006 2007 2008 2009
% M
od
al S
pli
t fo
r B
eij
ing
Private vehicles Bus Metro Bike TaxiA
0%
10%
20%
30%
40%
50%
60%
70%
80%
90%
100%
2004 2005 2006 2007 2008 2009
% M
od
al S
pli
t fo
r B
uch
are
st
Private vehicles Bus/Troleybus Metro Tram Bike/Walking TaxiB
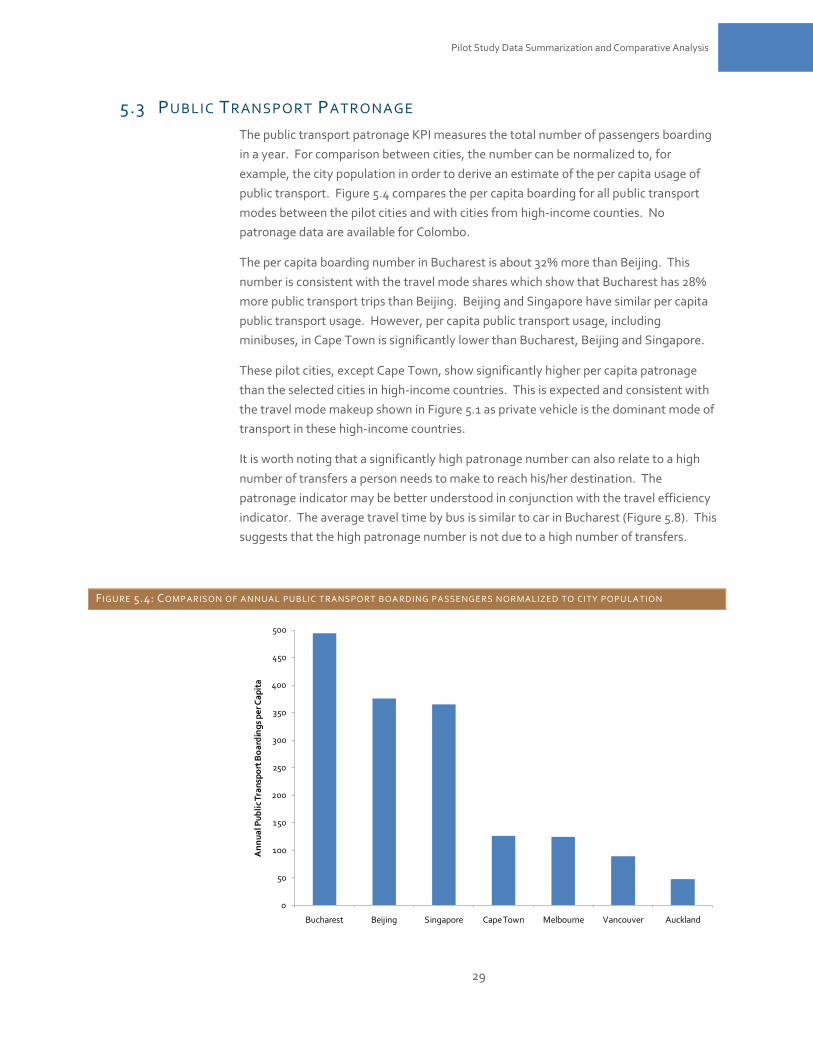
29
29
Pilot Study Data Summarization and Comparative Analysis
5.3 PUBLIC TRANSPORT PATRONAGE
The public transport patronage KPI measures the total number of passengers boarding
in a year. For comparison between cities, the number can be normalized to, for
example, the city population in order to derive an estimate of the per capita usage of
public transport. Figure 5.4 compares the per capita boarding for all public transport
modes between the pilot cities and with cities from high-income counties. No
patronage data are available for Colombo.
The per capita boarding number in Bucharest is about 32% more than Beijing. This
number is consistent with the travel mode shares which show that Bucharest has 28%
more public transport trips than Beijing. Beijing and Singapore have similar per capita
public transport usage. However, per capita public transport usage, including
minibuses, in Cape Town is significantly lower than Bucharest, Beijing and Singapore.
These pilot cities, except Cape Town, show significantly higher per capita patronage
than the selected cities in high-income countries. This is expected and consistent with
the travel mode makeup shown in Figure 5.1 as private vehicle is the dominant mode of
transport in these high-income countries.
It is worth noting that a significantly high patronage number can also relate to a high
number of transfers a person needs to make to reach his/her destination. The
patronage indicator may be better understood in conjunction with the travel efficiency
indicator. The average travel time by bus is similar to car in Bucharest (Figure 5.8). This
suggests that the high patronage number is not due to a high number of transfers.
FIGURE 5.4: COMPARISON OF ANNUAL PUBLIC TRANSPORT BOA RDING PASSENGERS NORMALIZED TO CITY POPU LATION
0
50
100
150
200
250
300
350
400
450
500
Bucharest Beijing Singapore Cape Town Melbourne Vancouver Auckland
An
nu
al P
ub
lic
Tra
nsp
ort
Bo
ard
ing
s p
er C
ap
ita
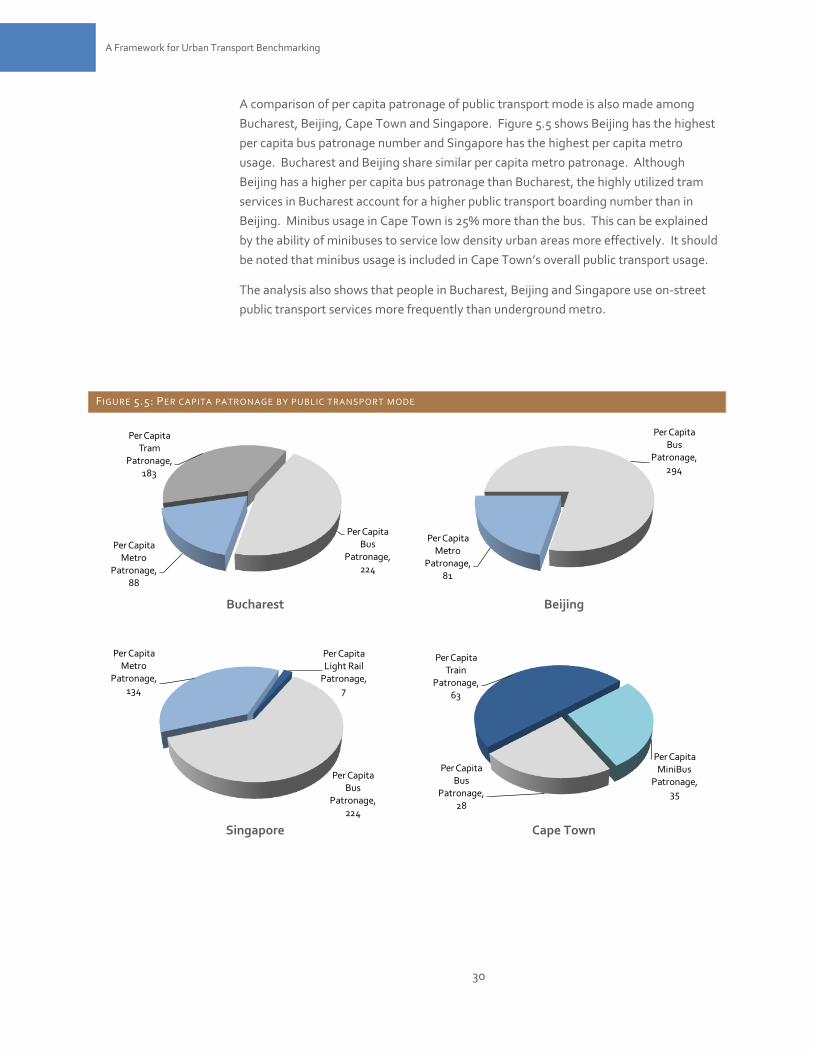
30
30
A Framework for Urban Transport Benchmarking
A comparison of per capita patronage of public transport mode is also made among
Bucharest, Beijing, Cape Town and Singapore. Figure 5.5 shows Beijing has the highest
per capita bus patronage number and Singapore has the highest per capita metro
usage. Bucharest and Beijing share similar per capita metro patronage. Although
Beijing has a higher per capita bus patronage than Bucharest, the highly utilized tram
services in Bucharest account for a higher public transport boarding number than in
Beijing. Minibus usage in Cape Town is 25% more than the bus. This can be explained
by the ability of minibuses to service low density urban areas more effectively. It should
be noted that minibus usage is included in Cape Town’s overall public transport usage.
The analysis also shows that people in Bucharest, Beijing and Singapore use on-street
public transport services more frequently than underground metro.
FIGURE 5.5: PER CAPITA PATRONAGE BY PUBLIC TRANSPORT MODE
Bucharest Beijing
Singapore Cape Town
Per Capita Bus
Patronage, 224
Per Capita Metro
Patronage, 88
Per Capita Tram
Patronage, 183
Per Capita Bus
Patronage, 294
Per Capita Metro
Patronage, 81
Per Capita Bus
Patronage, 224
Per Capita Metro
Patronage, 134
Per Capita Light Rail
Patronage, 7
Per Capita Bus
Patronage, 28
Per Capita Train
Patronage, 63
Per Capita MiniBus
Patronage, 35
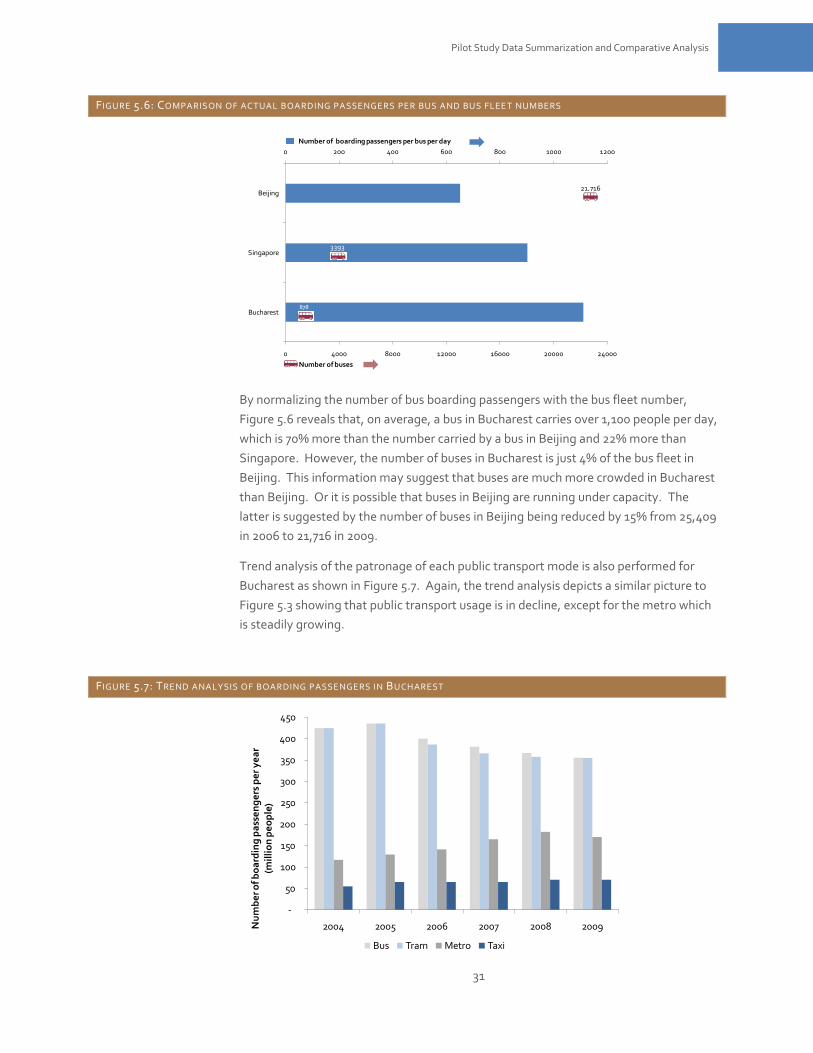
31
31
Pilot Study Data Summarization and Comparative Analysis
FIGURE 5.6: COMPARISON OF ACTUAL BOARDING PASSENGERS PER BUS AND BUS FLEE T NUMBERS
By normalizing the number of bus boarding passengers with the bus fleet number,
Figure 5.6 reveals that, on average, a bus in Bucharest carries over 1,100 people per day,
which is 70% more than the number carried by a bus in Beijing and 22% more than
Singapore. However, the number of buses in Bucharest is just 4% of the bus fleet in
Beijing. This information may suggest that buses are much more crowded in Bucharest
than Beijing. Or it is possible that buses in Beijing are running under capacity. The
latter is suggested by the number of buses in Beijing being reduced by 15% from 25,409
in 2006 to 21,716 in 2009.
Trend analysis of the patronage of each public transport mode is also performed for
Bucharest as shown in Figure 5.7. Again, the trend analysis depicts a similar picture to
Figure 5.3 showing that public transport usage is in decline, except for the metro which
is steadily growing.
FIGURE 5.7: TREND ANALYSIS OF BOARDING PASSENGERS IN BUCHAREST
878
3393
21,716
0 200 400 600 800 1000 1200
0 4000 8000 12000 16000 20000 24000
Bucharest
Singapore
Beijing
Number of boarding passengers per bus per day
Number of buses
-
50
100
150
200
250
300
350
400
450
2004 2005 2006 2007 2008 2009Nu
mb
er o
f bo
ard
ing
pa
sse
ng
ers
pe
r y
ea
r(m
illi
on
pe
op
le)
Bus Tram Metro Taxi
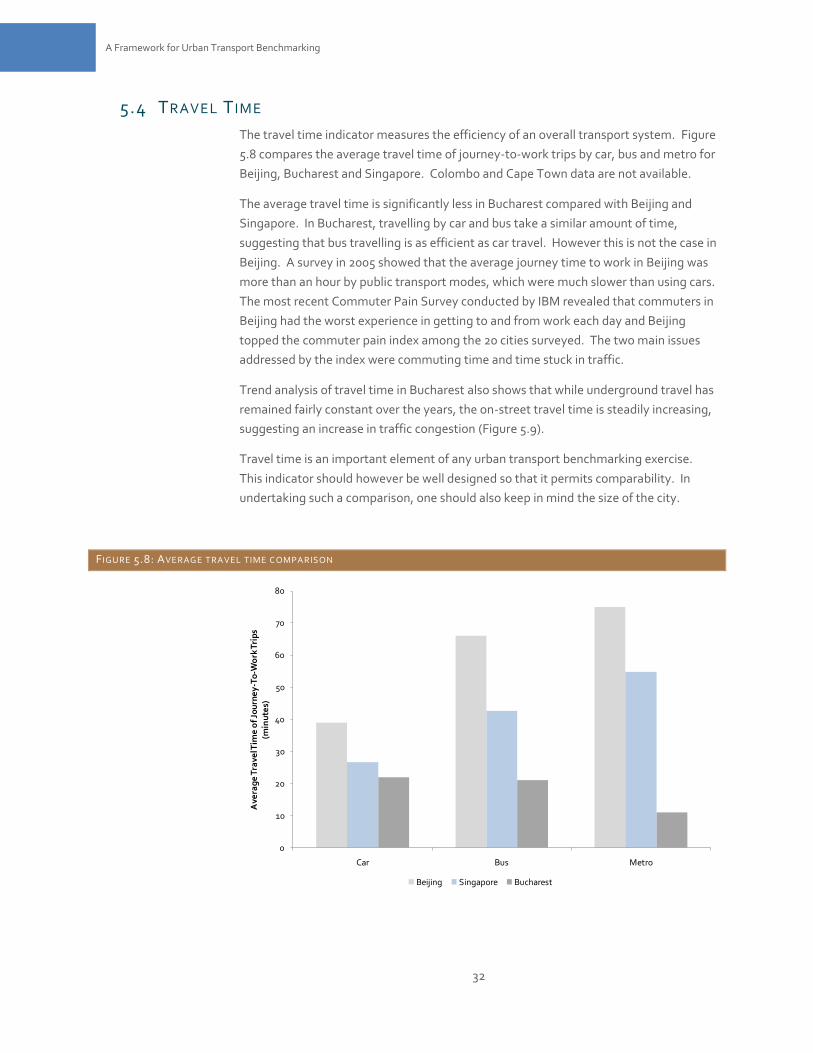
32
32
A Framework for Urban Transport Benchmarking
5.4 TRAVEL T IME
The travel time indicator measures the efficiency of an overall transport system. Figure
5.8 compares the average travel time of journey-to-work trips by car, bus and metro for
Beijing, Bucharest and Singapore. Colombo and Cape Town data are not available.
The average travel time is significantly less in Bucharest compared with Beijing and
Singapore. In Bucharest, travelling by car and bus take a similar amount of time,
suggesting that bus travelling is as efficient as car travel. However this is not the case in
Beijing. A survey in 2005 showed that the average journey time to work in Beijing was
more than an hour by public transport modes, which were much slower than using cars.
The most recent Commuter Pain Survey conducted by IBM revealed that commuters in
Beijing had the worst experience in getting to and from work each day and Beijing
topped the commuter pain index among the 20 cities surveyed. The two main issues
addressed by the index were commuting time and time stuck in traffic.
Trend analysis of travel time in Bucharest also shows that while underground travel has
remained fairly constant over the years, the on-street travel time is steadily increasing,
suggesting an increase in traffic congestion (Figure 5.9).
Travel time is an important element of any urban transport benchmarking exercise.
This indicator should however be well designed so that it permits comparability. In
undertaking such a comparison, one should also keep in mind the size of the city.
FIGURE 5.8: AVERAGE TRAVEL TIME C OMPARISON
0
10
20
30
40
50
60
70
80
Car Bus Metro
Ave
rag
e T
rave
l Tim
e o
f Jo
urn
ey
-To
-Wo
rk T
rip
s(m
inu
tes)
Beijing Singapore Bucharest
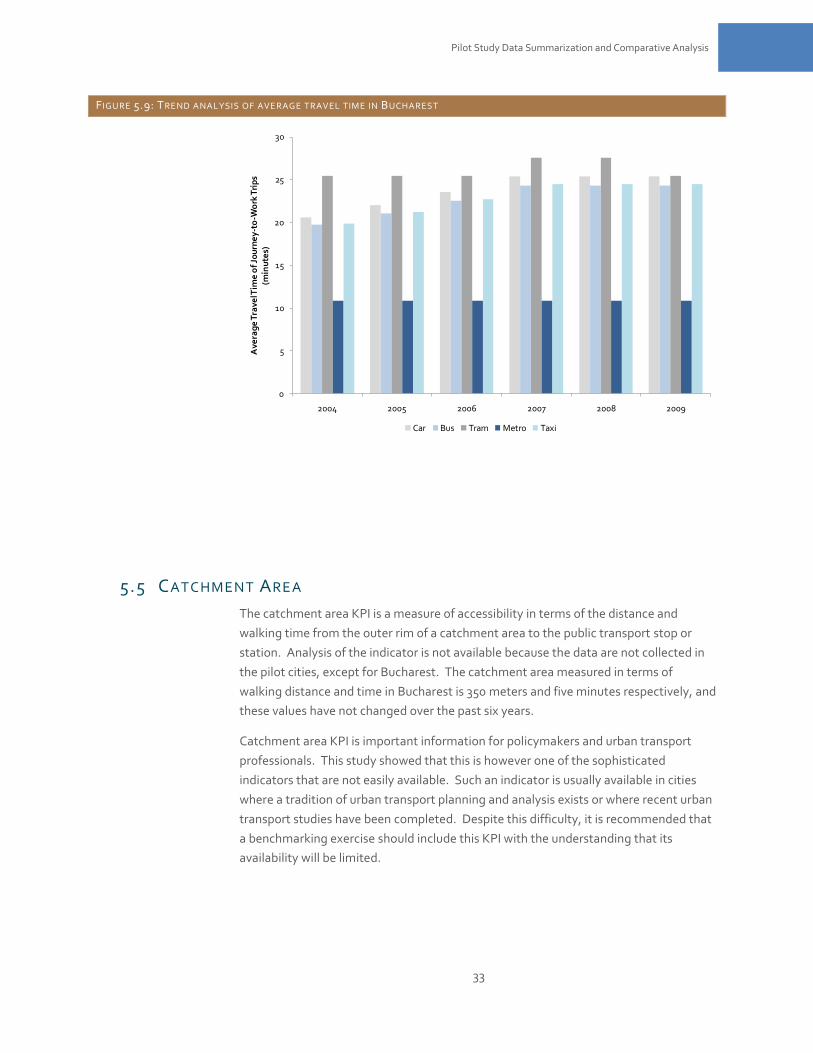
33
33
Pilot Study Data Summarization and Comparative Analysis
FIGURE 5.9: TREND ANALYSIS OF AVE RAGE TRAVEL TIME IN BUCHAREST
5.5 CATCHMENT AREA
The catchment area KPI is a measure of accessibility in terms of the distance and
walking time from the outer rim of a catchment area to the public transport stop or
station. Analysis of the indicator is not available because the data are not collected in
the pilot cities, except for Bucharest. The catchment area measured in terms of
walking distance and time in Bucharest is 350 meters and five minutes respectively, and
these values have not changed over the past six years.
Catchment area KPI is important information for policymakers and urban transport
professionals. This study showed that this is however one of the sophisticated
indicators that are not easily available. Such an indicator is usually available in cities
where a tradition of urban transport planning and analysis exists or where recent urban
transport studies have been completed. Despite this difficulty, it is recommended that
a benchmarking exercise should include this KPI with the understanding that its
availability will be limited.
0
5
10
15
20
25
30
2004 2005 2006 2007 2008 2009
Ave
rag
e T
rave
l Tim
e o
f Jo
urn
ey
-to
-Wo
rk T
rip
s(m
inu
tes)
Car Bus Tram Metro Taxi
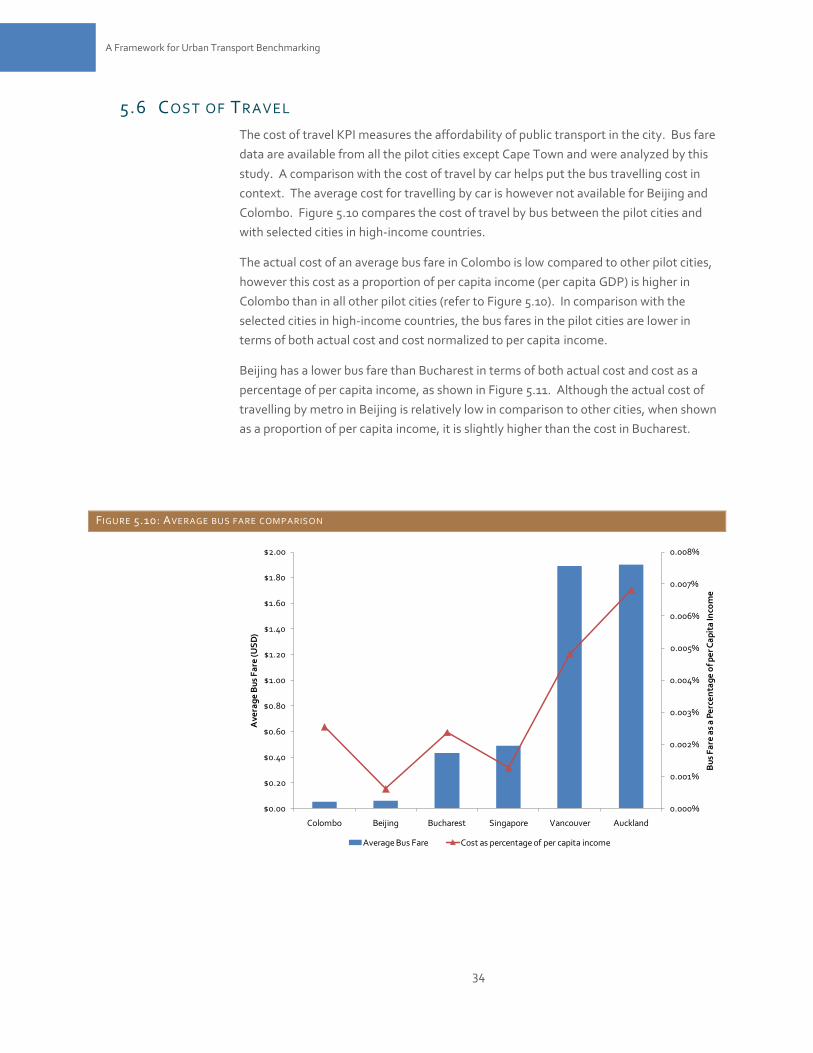
34
34
A Framework for Urban Transport Benchmarking
5.6 COST OF TRAVEL
The cost of travel KPI measures the affordability of public transport in the city. Bus fare
data are available from all the pilot cities except Cape Town and were analyzed by this
study. A comparison with the cost of travel by car helps put the bus travelling cost in
context. The average cost for travelling by car is however not available for Beijing and
Colombo. Figure 5.10 compares the cost of travel by bus between the pilot cities and
with selected cities in high-income countries.
The actual cost of an average bus fare in Colombo is low compared to other pilot cities,
however this cost as a proportion of per capita income (per capita GDP) is higher in
Colombo than in all other pilot cities (refer to Figure 5.10). In comparison with the
selected cities in high-income countries, the bus fares in the pilot cities are lower in
terms of both actual cost and cost normalized to per capita income.
Beijing has a lower bus fare than Bucharest in terms of both actual cost and cost as a
percentage of per capita income, as shown in Figure 5.11. Although the actual cost of
travelling by metro in Beijing is relatively low in comparison to other cities, when shown
as a proportion of per capita income, it is slightly higher than the cost in Bucharest.
FIGURE 5.10: AVERAGE BUS FARE COMPARISON
0.000%
0.001%
0.002%
0.003%
0.004%
0.005%
0.006%
0.007%
0.008%
$0.00
$0.20
$0.40
$0.60
$0.80
$1.00
$1.20
$1.40
$1.60
$1.80
$2.00
Colombo Beijing Bucharest Singapore Vancouver Auckland
Bu
s F
are
as
a P
erc
en
tag
e o
f pe
r Ca
pit
a In
com
e
Ave
rag
e B
us
Fa
re (U
SD
)
Average Bus Fare Cost as percentage of per capita income

35
35
Pilot Study Data Summarization and Comparative Analysis
FIGURE 5.11: COST OF TRAVEL COMPAR ISON BETWEEN BUS AND METRO
5.7 ROAD SAFETY
The road safety indicator measures how safe it is to travel on the road. It is a basic and
common indicator collected by countries/cities around the world. It is possible to split
the public transport component from the crash information. However these data are
not currently available from Beijing and Colombo. Road accident data for Colombo are
not available, but are represented by the country data. Figure 5.12 shows an analysis of
road-accident fatality data between the pilot cities.
The fatality data are normalized to the number of cars (A) and population (B) in the
cities. For Colombo, the data are normalized to the number of cars and population in
the country. Colombo has the highest road-accident fatality rate in the pilot cities.
While it has more fatalities per 10,000 cars than Bucharest, Beijing has relatively low
fatalities per population. Beijing and Singapore have relatively similar level of road
fatality rates.
FIGURE 5.12: COMPARISON OF NUMBER OF ROAD FATALITIES
$0.00
$0.10
$0.20
$0.30
$0.40
$0.50
$0.60
$0.70
Beijing Bucharest Singapore
Ave
rag
e F
are
(US
D)
Bus MetroA
0.000%
0.001%
0.002%
0.003%
Beijing Bucharest Singapore
Ave
rag
e F
are
as
a P
erc
en
tag
e o
f p
er C
ap
ita
In
com
e
Bus MetroB
0
1
2
3
4
5
6
7
8
Singapore Beijing Bucharest Cape Town Colombo
Nu
mb
er o
f Ro
ad
Fa
tali
tie
s p
er
10,0
00
Ca
rs
A
0
2
4
6
8
10
12
14
Singapore Beijing Bucharest Cape Town Colombo
Nu
mb
er o
f Ro
ad
Fa
tali
tie
s p
er
100
,00
0
Pe
op
le
B
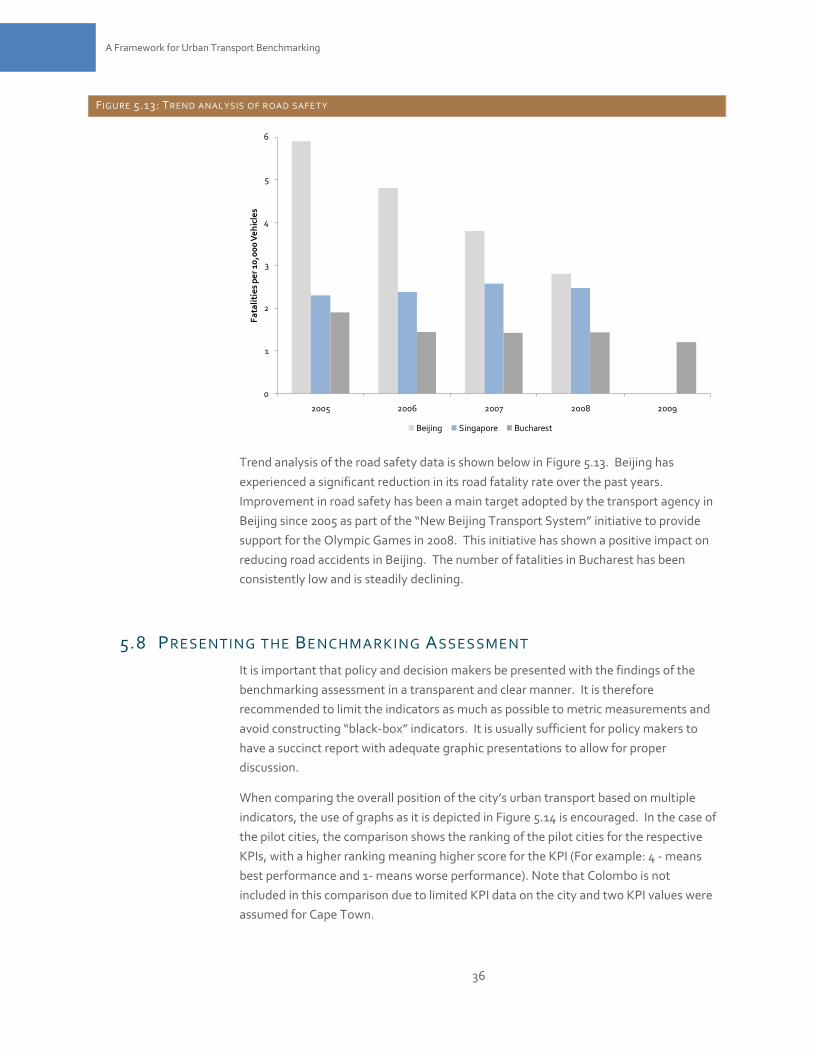
36
36
A Framework for Urban Transport Benchmarking
FIGURE 5.13: TREND ANALYSIS OF ROAD SAFETY
Trend analysis of the road safety data is shown below in Figure 5.13. Beijing has
experienced a significant reduction in its road fatality rate over the past years.
Improvement in road safety has been a main target adopted by the transport agency in
Beijing since 2005 as part of the “New Beijing Transport System” initiative to provide
support for the Olympic Games in 2008. This initiative has shown a positive impact on
reducing road accidents in Beijing. The number of fatalities in Bucharest has been
consistently low and is steadily declining.
5.8 PRESENTING THE BENCHMARKING ASSESSMENT
It is important that policy and decision makers be presented with the findings of the
benchmarking assessment in a transparent and clear manner. It is therefore
recommended to limit the indicators as much as possible to metric measurements and
avoid constructing “black-box” indicators. It is usually sufficient for policy makers to
have a succinct report with adequate graphic presentations to allow for proper
discussion.
When comparing the overall position of the city’s urban transport based on multiple
indicators, the use of graphs as it is depicted in Figure 5.14 is encouraged. In the case of
the pilot cities, the comparison shows the ranking of the pilot cities for the respective
KPIs, with a higher ranking meaning higher score for the KPI (For example: 4 - means
best performance and 1- means worse performance). Note that Colombo is not
included in this comparison due to limited KPI data on the city and two KPI values were
assumed for Cape Town.
0
1
2
3
4
5
6
2005 2006 2007 2008 2009
Fa
tali
tie
s p
er
10,0
00
Ve
hic
les
Beijing Singapore Bucharest
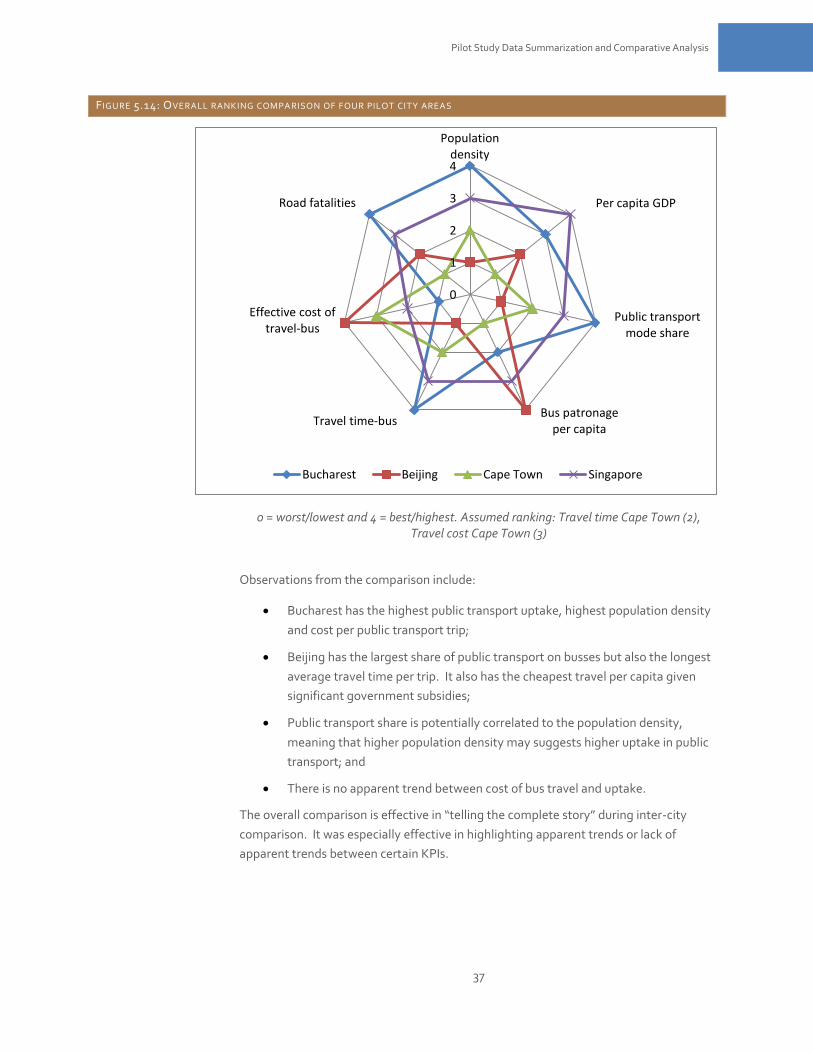
37
37
Pilot Study Data Summarization and Comparative Analysis
FIGURE 5.14: OVERALL RANKING COMPA RISON OF FOUR PILOT CITY AREAS
0 = worst/lowest and 4 = best/highest. Assumed ranking: Travel time Cape Town (2), Travel cost Cape Town (3)
Observations from the comparison include:
Bucharest has the highest public transport uptake, highest population density
and cost per public transport trip;
Beijing has the largest share of public transport on busses but also the longest
average travel time per trip. It also has the cheapest travel per capita given
significant government subsidies;
Public transport share is potentially correlated to the population density,
meaning that higher population density may suggests higher uptake in public
transport; and
There is no apparent trend between cost of bus travel and uptake.
The overall comparison is effective in “telling the complete story” during inter-city
comparison. It was especially effective in highlighting apparent trends or lack of
apparent trends between certain KPIs.
Population density
Per capita GDP
Public transport mode share
Bus patronage per capita
Travel time-bus
Effective cost of travel-bus
Road fatalities
0
1
2
3
4
Bucharest Beijing Cape Town Singapore
38
38
A Framework for Urban Transport Benchmarking
6 IMPLEMENTATION OF A BENCHMARKING INITIATIVE 6.1 DEVELOPING APPROPRI ATE BENCHMARK S
Section 5 presented benchmark values and comparisons between the pilot areas. The
next step is to use the comparative analysis and develop appropriate KPIs and
benchmarks for a city. Establishing a benchmarking initiative should reflect the desired
policy objectives and include only relevant indicators and comparators. This section
presents a brief summary of the process for establishing benchmarks based on
comparative analysis. Examples are used to illustrate important concepts of this
process.
6.1.1 ES T A B L IS H IN G T H E ST A T US Q U O
The first step towards any meaningful benchmarking is to have a thorough
understanding of the organization’s performance. This not only involves comparison
with other organizations but also involves an understanding of changes in the
organization’s internal performance over past years.
In terms of the external comparison, it is important to choose appropriate peer
organizations. For example it would be of little value to compare an organization with
another that clearly has a worse performance in the areas investigated. In addition, the
comparison should be undertaken against organizations/countries/cities with similar
contextual background, issues and trends. For example, in this pilot study, both
Bucharest and Beijing have similar backgrounds despite obvious differences in size and
population density. They both have been through important changes in the last
decades, and they have both focused on improving their overall transport efficiency. In
addition, both countries face challenges regarding the increase in private motor
ownership that could have a negative impact on the efficiency of the transport system
as a whole and consequently on public transport. In addition, Romania is a member of
the European Union, and it shares many similarities with cities in Central and Eastern
Europe. It is therefore logical that the benchmarking of Bucharest would use peer cities
in the European Union and in Central and Eastern Europe.
The status quo should cover the full spectrum of the transport efficiency assessment
with the primary aim of identifying both the strong and weak points of the urban
transport system.
6.1.2 TH E NO R M AL I ZAT IO N O F INF O R M A T IO N AN D D AT A
The normalization used in the comparative analysis not only causes a different outcome
in the analysis but is also central to the message to be conveyed. Consequently, it is
important to ensure that appropriate normalization techniques are employed. For
example, Figure 5.10 illustrates the comparison between the bus fares of the pilot areas
and those in high-income countries. It has been discussed that although Sri Lanka has
39
39
Implementation of a Benchmarking Initiative
the lowest actual bus fare in real terms, the fare normalized per capita income is the
highest of all five pilot areas.
Likewise, Figure 5.12 illustrates a comparison of fatal crashes between the pilot areas.
Two different normalization techniques are used: First, the information is normalized
on the basis of crashes per vehicle, and secondly they are normalized per population.
Although road crashes are normally reported per travelling vehicle in high-income
countries, normalizing them to population may be more appropriate for transition and
developing countries, especially given the difference in modal split between the two
(refer to Figure 5.1), and the difficulty in obtaining vehicle usage (vehicle-km for
example) in cities where a tradition of urban transport analysis is weak or does not
exist. When dealing with fatalities for comparative purposes, it is important to ensure
that the same definition is used: some countries only define fatalities as those which
happen at the time of the accident; others those within as much as 30 days of the
accident.
6.1.3 DE F I N ING T H E T AR G E T
Having a specific target sets a clear direction for an organization. For example the
decrease in fatal crashes in Beijing can only be attributed to a commitment from the
authorities to change the performance towards acceptable levels for the 2008 Beijing
Olympics (refer to Figure 5.13). From the pilot data it appears that Bucharest has also
achieved a decreasing trend in fatal crashes, but not as drastic as Beijing. Therefore,
one of the first steps towards establishing benchmarking targets is to have strong
policy commitment and vision in place to guide improvement strategies.
Comparisons with high-income countries may in some cases signal performance trends
to be avoided for transition and developing countries. For example, Beijing and
Bucharest may want to adopt policies that would help them avoid modal splits similar
to Australia or Canada (refer to Figure 5.1). If transport for the majority of people in
either Romania or China included such significant travel by private cars, there would be
negative consequences such as severe congestion and pollution.
Therefore, the target performance or benchmark level is decided based on a
combination of:
The organization’s current performance and its desired position in the future;
The contextual background in terms of future objectives for public policies
regarding urban transport;
Comparisons with cities/countries to establish some practical levels that would
be achievable in terms of an organization’s contextual background. Two
possible approaches could be used:
“We want to be as good as those guys” – where it is believed that
someone in similar circumstances has achieved an appropriate
performance level. If this also seems achievable for the organization
in question, the level is set accordingly;
40
40
A Framework for Urban Transport Benchmarking
The second approach would be to accept either a higher or lower
performance level than the peer organization. Reasons for deviating
from the peer organization may include resources available to the
organization; and in most cases, significant improvements in an
organization’s performance cannot be achieved in a short time frame.
Therefore a future target should be set on the basis of practical
incremental improvements.
6.1.4 CO NT IN UO US ME AS UR E M E NT AN D RE PO R T I N G O F PE R F O R M A NC E RE LAT I V E
T O T H E BE NC H M AR K
Benchmarking can only be successful if it becomes a continued process of
measurement and reporting against the set targets. Apart from obvious progress
monitoring that takes place, it will also ensure that the overall outcomes progress in a
desired direction. It is not uncommon for KPIs in a benchmarking progress to be
counter reactive. For example, one of the strategies to improve travel time and/or
travel speed could be to improve the capacity of a network by increasing the number of
motorway lanes. Although this may have the initial desired outcome, it can also
encourage patrons to use private vehicles, thus in the long run resulting in a poorer
performance of the public transport and overall traffic congestion. However, focused
capacity improvement such as dedicated bus lanes could have a long-term return on
increasing the effectiveness of public transport and decreasing congestion.
Having continuous measurement and reporting in mind should also help set the
expectations in terms of the scope and magnitude of the benchmarking framework.
Experience has shown that setting overambitious frameworks from the onset can lead
to cumbersome and costly initiatives that cannot be sustained over time. It appears
that the best approach would be to start with a simple but meaningful framework and
to upgrade it over time while paying particular attention to the marginal benefits and
costs of such upgrades.
6.2 LESSONS FROM THE COMPARATIVE ANALYSES
The pilot study involved six KPIs and five study areas from transition and developing
countries as well as comparators in high-income countries (New Zealand, Australia, and
Canada). Its objectives were to demonstrate the value of benchmarking and obtain a
better understanding of the practical and data-related aspects of benchmarking.
The study demonstrated the value of these comparisons in the context of public
transport service delivery. The following points are noted:
Although the study is not an in-depth research of the transport situation in the
pilot cities, this simple exercise has already identified a number of good
initiatives as well as performance gaps in the study areas. This is a relatively
quick demonstration, by using existing data sets provided by the pilot cities,
that benchmarking can be an effective tool in identifying areas for
improvement;
41
41
Implementation of a Benchmarking Initiative
A KPI should not be analyzed in isolation. As demonstrated in Figure 5.5 , for
example, the patronage KPI analysis in Section 5, the KPI is related to other
KPIs such as travel mode, travel time and cost. Understanding the interaction
between the KPIs will provide a more meaningful and complete picture of the
urban transport system;
Benchmarking should not be viewed as a one-off exercise. Other studies have
shown that it takes several iterations to develop an optimal benchmarking
initiative. Furthermore, this pilot study has demonstrated that when sufficient
data are collected, trend analysis such as in Figure 5.3 can capture the
effectiveness of an implemented initiative and also yield meaningful
implications for future changes.
The study also demonstrated that it is difficult to obtain consistent data from
all participants, but this should not prevent initiating urban transport
benchmarking if it is understood that such an endeavor should start with
simple but meaningful steps:
The purposes of existing data collection programs are different
between countries thus resulting in completely different data
collection strategies. Also, the constraints in resources and
knowledge further limit the type and frequency of performance data
collected in transition and developing countries. Making use of
simple and commonly used performance data will make
benchmarking more effective and attractive;
An analysis methodology is essential for consistent and accurate data
reporting. For example, the cost of travel needs to be normalized to a
commuter’s income as in the case of bus fare in Figure 5.10; and
The supporting technical tools for a benchmarking initiative should
not be underestimated although today’s IT environment offers cost
effective solutions. For example, development of a database is
needed due to the large amount of data involved in the process.
42
42
A Framework for Urban Transport Benchmarking
7 CONCLUSIONS AND RECOMMENDATIONS 7.1 SUMMARY OF THE P I LOT BENCHMARKING STUDY
Benchmarking is a well recognized approach to assess the performance of an
organization. In the infrastructure industry, good examples of benchmarking can be
found in the water supply area through the International Benchmarking Network for
Water and Sanitation Utilities (www.ib-net.org). Little evidence has been found that
benchmarking has been used successfully for transition and developing countries in the
assessment of urban public transport systems. This report documents a pilot study for
implementing a benchmarking initiative for public transport in transition and
developing countries, as a first step for a more ambitious initiative for urban transport
in general.
The objective of this project was to develop and test a benchmarking framework for
public transport services, taking into account the most significant constraints faced in
transition and developing countries. This involved the recommendation of key
performance indicators (KPIs) to assess the performance of various cities in the area of
public transport.
Using these indicators, policymakers and urban transport professionals will be able to
identify and implement improvements to public transport in order to achieve a safer,
cleaner, and more affordable services. The following questions have been answered
through this research project:
How is benchmarking relevant to policymakers seeking to improve the performance of urban transport?
Do the required information and data exist to make such a benchmarking exercise worthwhile?
Does the comparative analysis provide useful information?
How are the benchmark levels established?
For this study a full set of KPIs were developed as part of the benchmarking framework
which covers the main areas of:
Uptake of public transport
Travel efficiency
Accessibility
Affordability
Travel experience.
A total of 13 KPIs have been suggested and are supported by a number of contextual
indicators quantifying the demographic and socio-economic background of the areas in
question. For the purpose of the benchmarking pilot, six KPIs were used to investigate
43
43
Conclusions and recommendations
the performance of five pilot areas: Colombo (Sri-Lanka), Beijing (China), Bucharest
(Romania), Cape Town (South Africa), and Singapore.
7.2 F INDINGS FROM THE P ILOT STUDY PROJECT
7.2.1 DAT A AV A IL AB I LI T Y
It was encouraging to note that in most cases core data existed in most cities for
minimal comparative analysis. It was evident that more data existed for areas where
there was a tradition of urban transport planning and analysis or some concerted effort
to improve public transport services and the overall efficiency of the transport system.
It can be accepted that initially it would be a challenge to obtain all the required data for
a benchmarking initiative in a city, but that it is possible to gather the required
information during transport studies with little effort. It should be noted that no
additional data collection was undertaken as part of this study, and all data were
sourced from existing census and transport reports.
7.2.2 VAL UE O F T H E KPIS AN D CO M P AR A T I V E IN F O R M AT IO N
Useful comparisons were undertaken for the pilot areas. It was noted that the
observations from the comparisons were consistent with the development process and
initiatives associated with each country. For example, Beijing had targeted specific
issues such as encouraging the use of public transport through subsidies and significant
investment in safety improvements. Positive trends were observed that confirmed the
relevance of some of these initiatives.
The comparative analysis also confirmed that increased private vehicle ownership
placed greater pressure on the public transport system and brought about reductions in
patronage. For example, this trend was notable in Bucharest where there had been a
decrease in both bus and tram patrons. It seems that the Bucharest metro system is
now showing increased patronage.
It has been demonstrated that the normalization of KPIs to the appropriate contextual
parameters is essential in making KPIs meaningful and appropriate for the transition
and developing countries. Examples have demonstrated that the wrong conclusions
can be drawn from inappropriate or no normalization (refer to Section 6.1.2). In
addition, not all KPIs can necessarily be normalized.
It has been further demonstrated that comparative analysis should also include some
examples from high-income countries. This not only gives perspective to some of the
results, but also indicates trends that transition and developing countries should avoid,
for example, the dependency on private cars.
The overall conclusion is that comparative analysis is essential for a successful
benchmarking initiative and useful information can be yielded from the data supplied
by the pilot areas.
44
44
A Framework for Urban Transport Benchmarking
7.2.3 ES T A B L IS H IN G T H E BE N C H M AR K LE V E L
Comparative analysis is an essential component of benchmarking. It assists in giving a
relative performance status for the area in question. In addition, it highlights the
potential performance levels achievable for respective performance areas. Choosing an
appropriate peer comparison city is essential for this, otherwise unrealistic performance
targets could be developed. Through comparison with other successful areas a quick
insight can be obtained by investigating the successful initiatives that lead to the
desired performance outcomes.
Despite the usefulness of comparative analysis, establishing appropriate benchmarks
remains a function of policy objectives and commitment to make a change to the
current performance. This has been demonstrated by some of the successful aspects
highlighted by the Beijing and Bucharest pilot areas.
7.3 RECOMMENDATIONS FOR ADOPTING A BENCHMARKING INITI ATIVE AT
LOCAL LEVEL
7.3.1 MO T IV AT IO N
Any strategy of improvement needs to be underpinned by a robust process of self-
monitoring and external monitoring with peers. Only by knowing one’s current
performance, in relation to a target, that one can monitor the success of initiatives to
address shortcoming within a system. This is especially relevant to the urban public
transport. Given that there are many factors that assist in improving uptake of public
transport, it is important to know how a study area performs relatively to other cities in
order to gauge the effectiveness of certain initiatives.
It is therefore recommended that any agency that is tasked with managing and/or
improving public transport systems to start with a benchmark process as a first step.
This report provides some guidelines of how the benchmark process should be
undertaken. It also demonstrated the value of a benchmark process.
7.3.2 BE NC H M AR K ING FR AM E W O R K
A benchmarking framework consisting of 13 key performance measures (excluding
contextual measures) was recommended by this study. It is however understood that a
full scale benchmarking for urban transport in transition and developing countries
would take some years to be fully operational.
For this reason, a stage-wise benchmarking implementation is recommended. Figure
7.1 illustrates the full benchmarking process with priorities assigned to each key
performance indicators. The idea is to have representative KPIs for each of the core
reporting areas. Therefore as a starting point all the priority 1 KPIs would be regarded
as the minimum measures to report for a full representation of the urban public
transport performance. These priorities were selected on the basis of the availability
and ease of data collection. Priority items 2 and 3 therefore represent more complex
and more challenging data items to collect. As a benchmarking process matures over
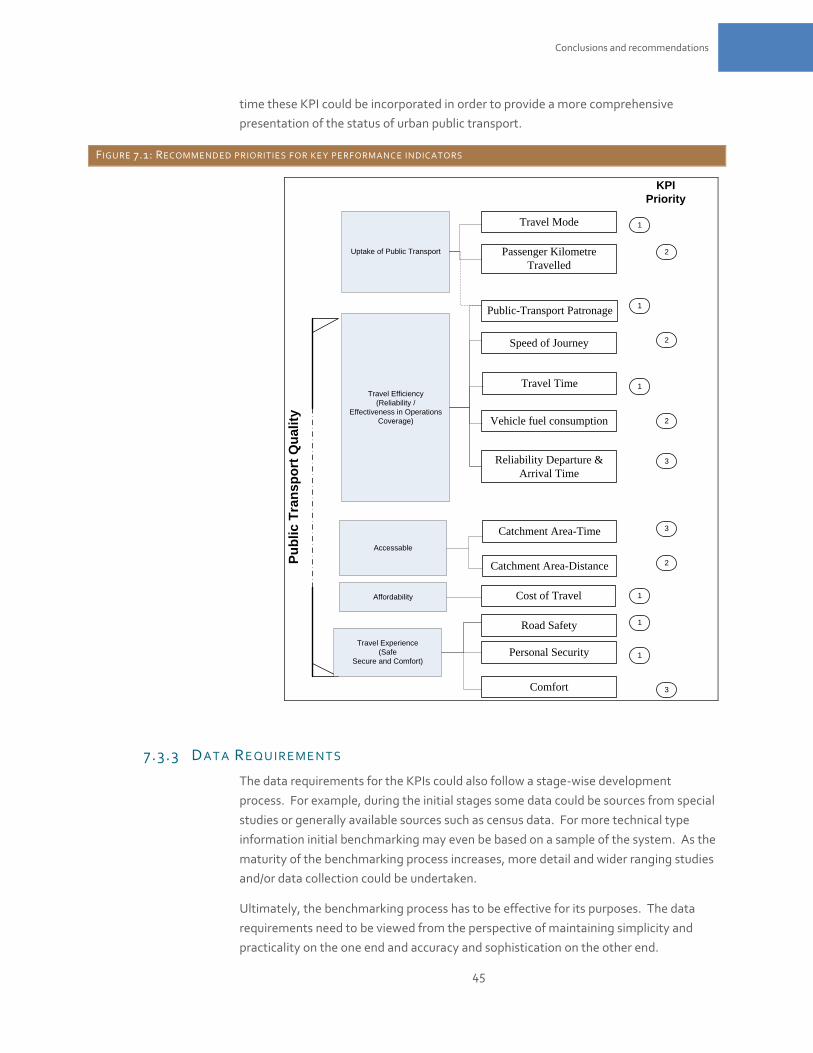
45
45
Conclusions and recommendations
time these KPI could be incorporated in order to provide a more comprehensive
presentation of the status of urban public transport.
FIGURE 7.1: RECOMMENDED PRIORITIES FOR KEY PERFORMANC E INDICATORS
A
Uptake of Public Transport
Travel Efficiency
(Reliability /
Effectiveness in Operations
Coverage)
Accessable
Affordability
Travel Experience
(Safe
Secure and Comfort)
Pu
blic
Tra
ns
po
rt Q
ua
lity
Travel Mode
Passenger Kilometre
Travelled
Public-Transport Patronage
Speed of Journey
Travel Time
Reliability Departure &
Arrival Time
Cost of Travel
Road Safety
Personal Security
Vehicle fuel consumption
Catchment Area-Time
Catchment Area-Distance
Comfort
2
1
1
1
1
1
2
2
2
1
3
3
3
KPI
Priority
7.3.3 DAT A RE QU IR E M E NT S
The data requirements for the KPIs could also follow a stage-wise development
process. For example, during the initial stages some data could be sources from special
studies or generally available sources such as census data. For more technical type
information initial benchmarking may even be based on a sample of the system. As the
maturity of the benchmarking process increases, more detail and wider ranging studies
and/or data collection could be undertaken.
Ultimately, the benchmarking process has to be effective for its purposes. The data
requirements need to be viewed from the perspective of maintaining simplicity and
practicality on the one end and accuracy and sophistication on the other end.
46
46
A Framework for Urban Transport Benchmarking
7.4 FURTHER WORK - INTERNATIONAL IM PLEMENTATION
The increasing focus on results by governments and international development
institutions requires that initiatives targeting the improvement of urban transport
should be supported by sufficient information. The benchmarking concept studied
under this research project could be a useful tool to support this drive for results. The
global reach of development and international financial institutions allows effective
dissemination of knowledge and would suggest that such a benchmarking initiative
should be initiated as part of their development work.
It is therefore recommended that a gradual full-scale development/implementation of a
simple benchmarking initiative for urban transport in transition and developing
countries be implemented. This implementation will typically involve the following:
Refining the definition of the core indicators to take account of the complexity
of urban transport;
Collecting the relevant data for target implementation;
Developing a web-based benchmark sharing and dissemination platform that
includes data analysis;
Constructing guidelines for the use of urban transport indicators and
benchmark indicators for transition and developing countries, and
Establishing a cooperative mechanism for continuous data collection.
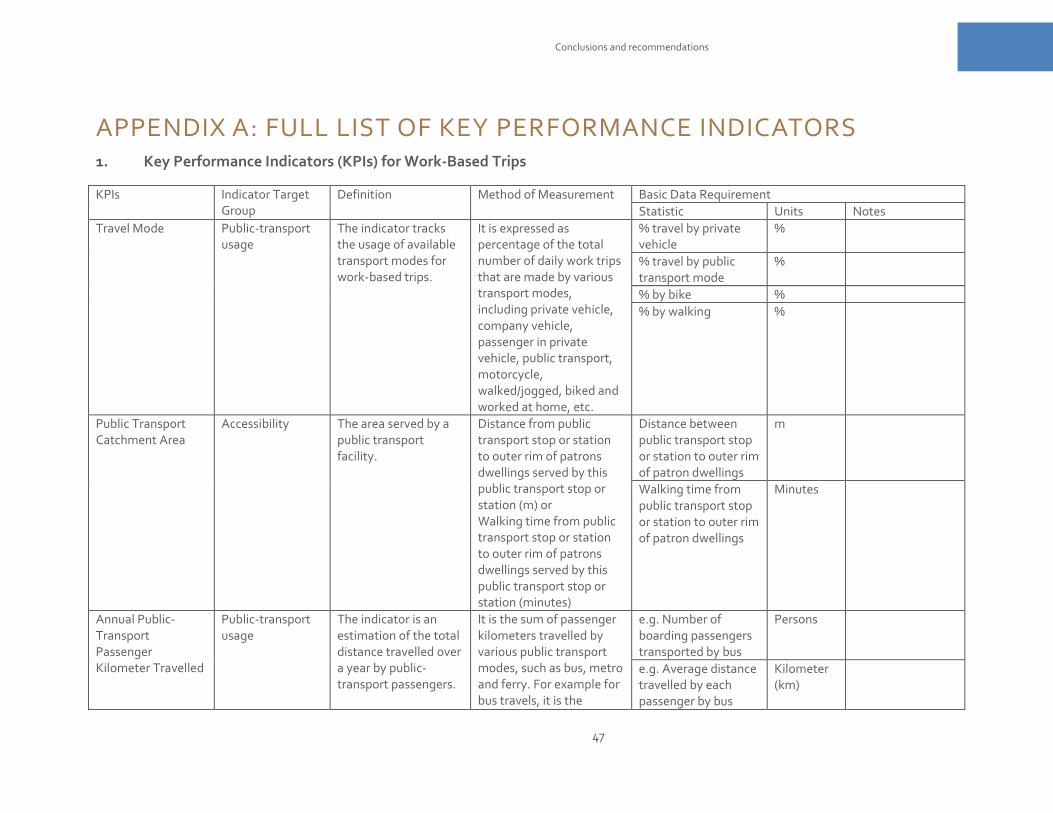
47
47
Conclusions and recommendations
APPENDIX A: FULL LIST OF KEY PERFORMANCE INDICATORS 1. Key Performance Indicators (KPIs) for Work-Based Trips
KPIs Indicator Target Group
Definition Method of Measurement Basic Data Requirement
Statistic Units Notes
Travel Mode Public-transport usage
The indicator tracks the usage of available transport modes for work-based trips.
It is expressed as percentage of the total number of daily work trips that are made by various transport modes, including private vehicle, company vehicle, passenger in private vehicle, public transport, motorcycle, walked/jogged, biked and worked at home, etc.
% travel by private vehicle
%
% travel by public transport mode
%
% by bike %
% by walking %
Public Transport Catchment Area
Accessibility The area served by a public transport facility.
Distance from public transport stop or station to outer rim of patrons dwellings served by this public transport stop or station (m) or Walking time from public transport stop or station to outer rim of patrons dwellings served by this public transport stop or station (minutes)
Distance between public transport stop or station to outer rim of patron dwellings
m
Walking time from public transport stop or station to outer rim of patron dwellings
Minutes
Annual Public-Transport Passenger Kilometer Travelled
Public-transport usage
The indicator is an estimation of the total distance travelled over a year by public-transport passengers.
It is the sum of passenger kilometers travelled by various public transport modes, such as bus, metro and ferry. For example for bus travels, it is the
e.g. Number of boarding passengers transported by bus
Persons
e.g. Average distance travelled by each passenger by bus
Kilometer (km)
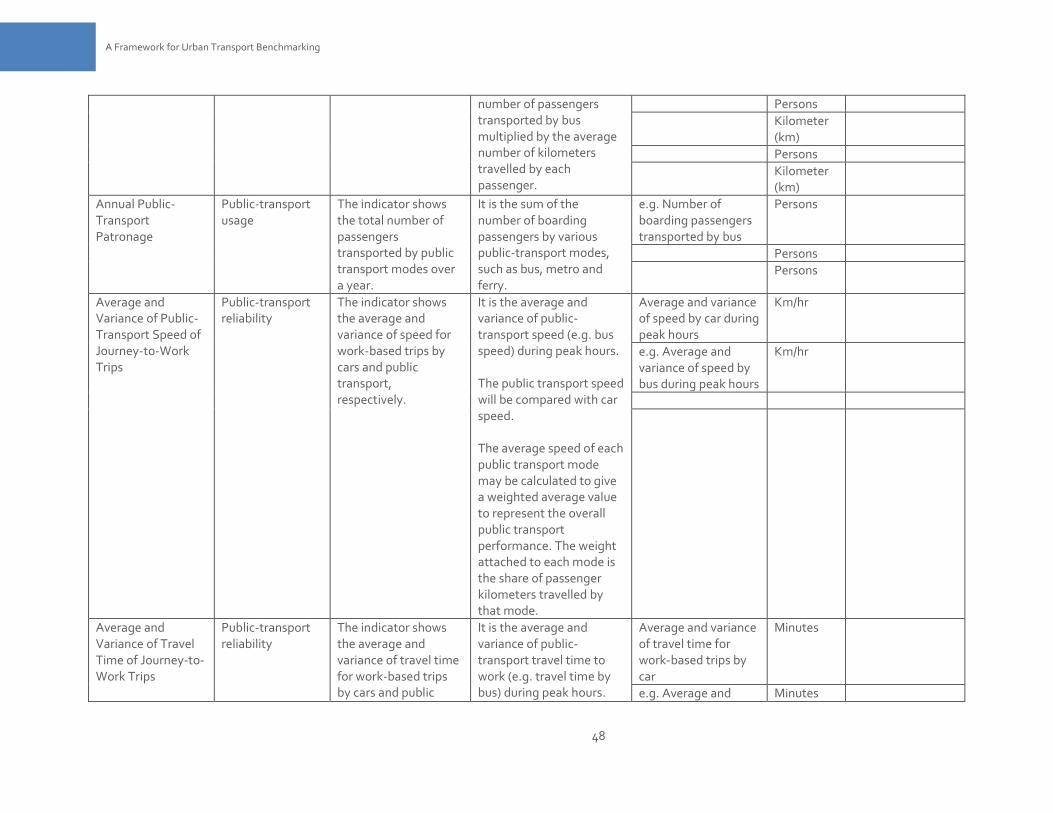
48
48
A Framework for Urban Transport Benchmarking
number of passengers transported by bus multiplied by the average number of kilometers travelled by each passenger.
Persons
Kilometer (km)
Persons
Kilometer (km)
Annual Public-Transport Patronage
Public-transport usage
The indicator shows the total number of passengers transported by public transport modes over a year.
It is the sum of the number of boarding passengers by various public-transport modes, such as bus, metro and ferry.
e.g. Number of boarding passengers transported by bus
Persons
Persons
Persons
Average and Variance of Public-Transport Speed of Journey-to-Work Trips
Public-transport reliability
The indicator shows the average and variance of speed for work-based trips by cars and public transport, respectively.
It is the average and variance of public-transport speed (e.g. bus speed) during peak hours. The public transport speed will be compared with car speed. The average speed of each public transport mode may be calculated to give a weighted average value to represent the overall public transport performance. The weight attached to each mode is the share of passenger kilometers travelled by that mode.
Average and variance of speed by car during peak hours
Km/hr
e.g. Average and variance of speed by bus during peak hours
Km/hr
Average and Variance of Travel Time of Journey-to-Work Trips
Public-transport reliability
The indicator shows the average and variance of travel time for work-based trips by cars and public
It is the average and variance of public-transport travel time to work (e.g. travel time by bus) during peak hours.
Average and variance of travel time for work-based trips by car
Minutes
e.g. Average and Minutes
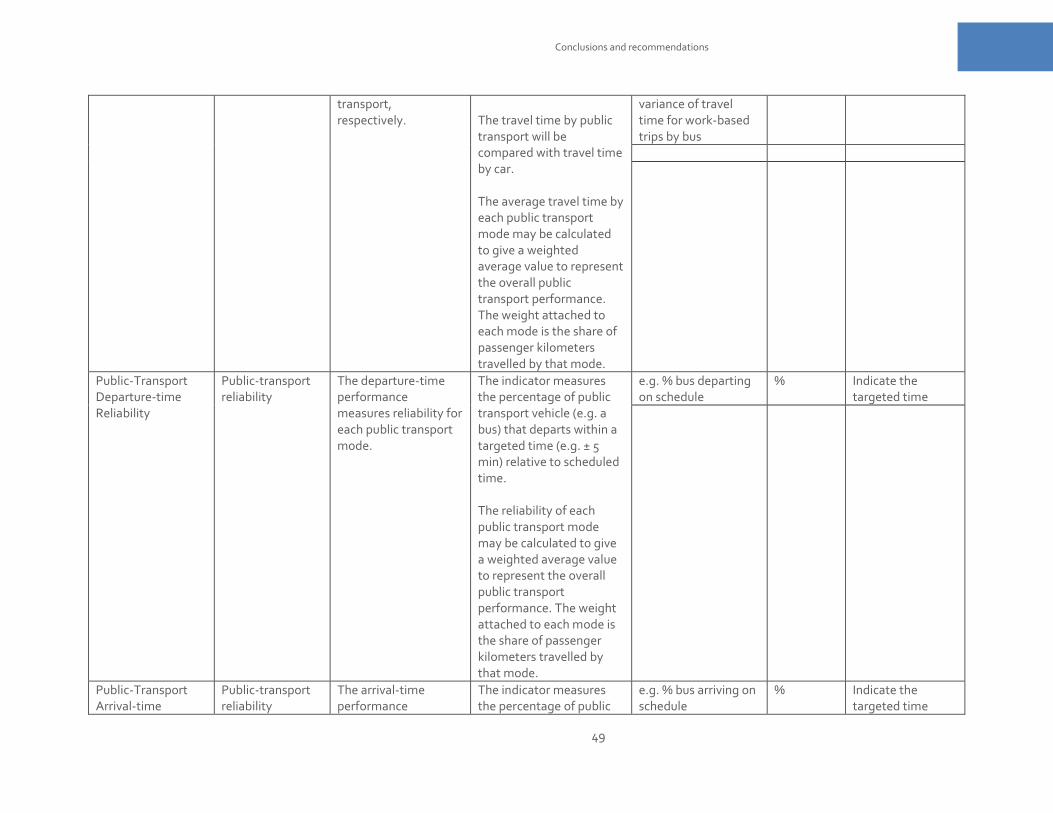
49
49
Conclusions and recommendations
transport, respectively.
The travel time by public transport will be compared with travel time by car. The average travel time by each public transport mode may be calculated to give a weighted average value to represent the overall public transport performance. The weight attached to each mode is the share of passenger kilometers travelled by that mode.
variance of travel time for work-based trips by bus
Public-Transport Departure-time Reliability
Public-transport reliability
The departure-time performance measures reliability for each public transport mode.
The indicator measures the percentage of public transport vehicle (e.g. a bus) that departs within a targeted time (e.g. ± 5 min) relative to scheduled time. The reliability of each public transport mode may be calculated to give a weighted average value to represent the overall public transport performance. The weight attached to each mode is the share of passenger kilometers travelled by that mode.
e.g. % bus departing on schedule
% Indicate the targeted time
Public-Transport Arrival-time
Public-transport reliability
The arrival-time performance
The indicator measures the percentage of public
e.g. % bus arriving on schedule
% Indicate the targeted time
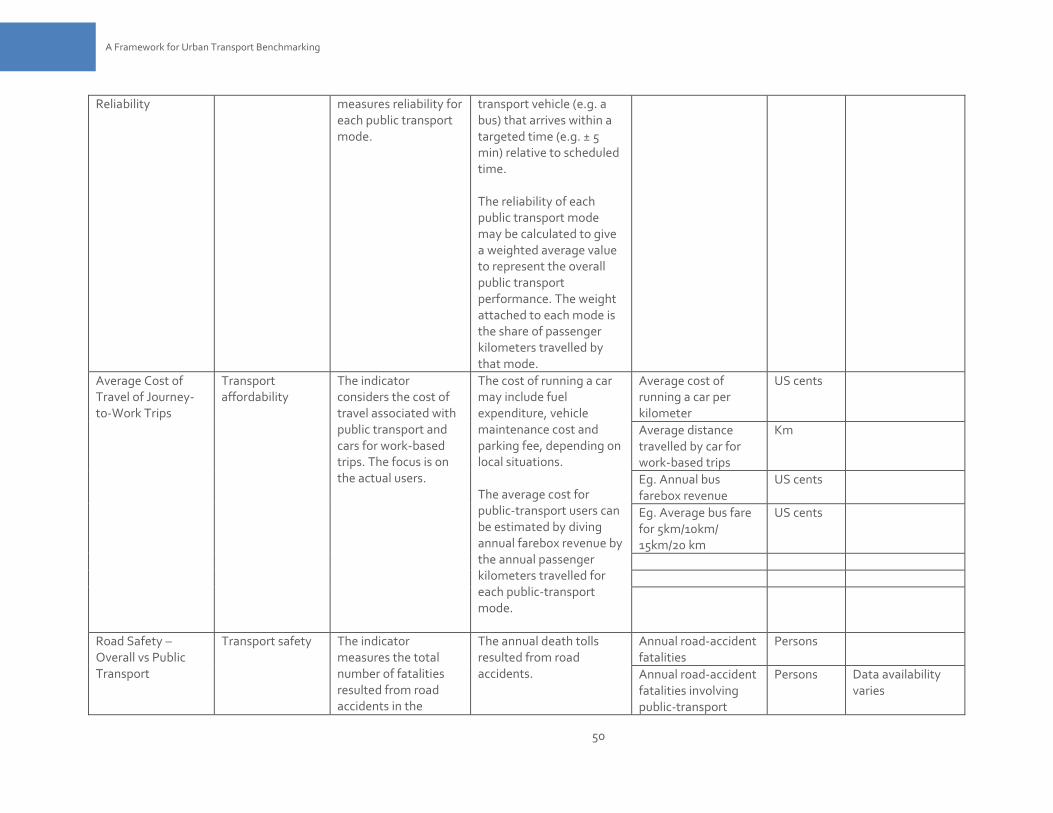
50
50
A Framework for Urban Transport Benchmarking
Reliability measures reliability for each public transport mode.
transport vehicle (e.g. a bus) that arrives within a targeted time (e.g. ± 5 min) relative to scheduled time. The reliability of each public transport mode may be calculated to give a weighted average value to represent the overall public transport performance. The weight attached to each mode is the share of passenger kilometers travelled by that mode.
Average Cost of Travel of Journey-to-Work Trips
Transport affordability
The indicator considers the cost of travel associated with public transport and cars for work-based trips. The focus is on the actual users.
The cost of running a car may include fuel expenditure, vehicle maintenance cost and parking fee, depending on local situations. The average cost for public-transport users can be estimated by diving annual farebox revenue by the annual passenger kilometers travelled for each public-transport mode.
Average cost of running a car per kilometer
US cents
Average distance travelled by car for work-based trips
Km
Eg. Annual bus farebox revenue
US cents
Eg. Average bus fare for 5km/10km/ 15km/20 km
US cents
Road Safety – Overall vs Public Transport
Transport safety The indicator measures the total number of fatalities resulted from road accidents in the
The annual death tolls resulted from road accidents.
Annual road-accident fatalities
Persons
Annual road-accident fatalities involving public-transport
Persons Data availability varies
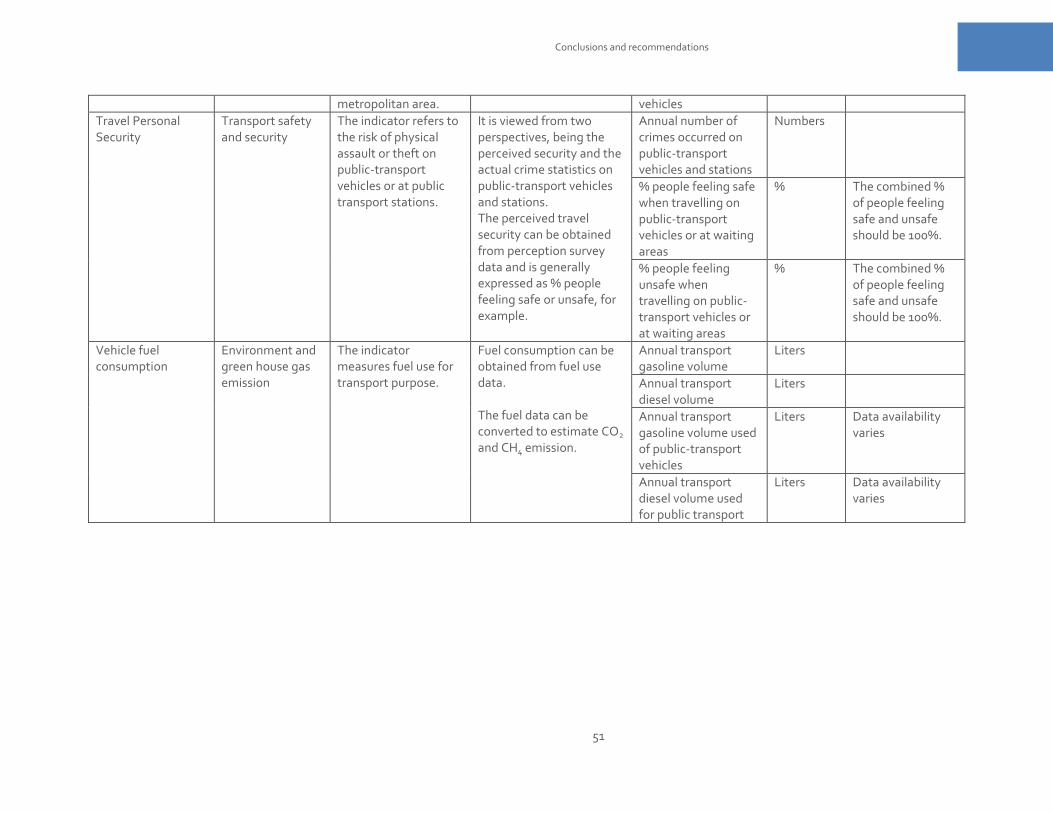
51
51
Conclusions and recommendations
metropolitan area. vehicles
Travel Personal Security
Transport safety and security
The indicator refers to the risk of physical assault or theft on public-transport vehicles or at public transport stations.
It is viewed from two perspectives, being the perceived security and the actual crime statistics on public-transport vehicles and stations. The perceived travel security can be obtained from perception survey data and is generally expressed as % people feeling safe or unsafe, for example.
Annual number of crimes occurred on public-transport vehicles and stations
Numbers
% people feeling safe when travelling on public-transport vehicles or at waiting areas
% The combined % of people feeling safe and unsafe should be 100%.
% people feeling unsafe when travelling on public-transport vehicles or at waiting areas
% The combined % of people feeling safe and unsafe should be 100%.
Vehicle fuel consumption
Environment and green house gas emission
The indicator measures fuel use for transport purpose.
Fuel consumption can be obtained from fuel use data. The fuel data can be converted to estimate CO2 and CH4 emission.
Annual transport gasoline volume
Liters
Annual transport diesel volume
Liters
Annual transport gasoline volume used of public-transport vehicles
Liters
Data availability varies
Annual transport diesel volume used for public transport
Liters Data availability varies
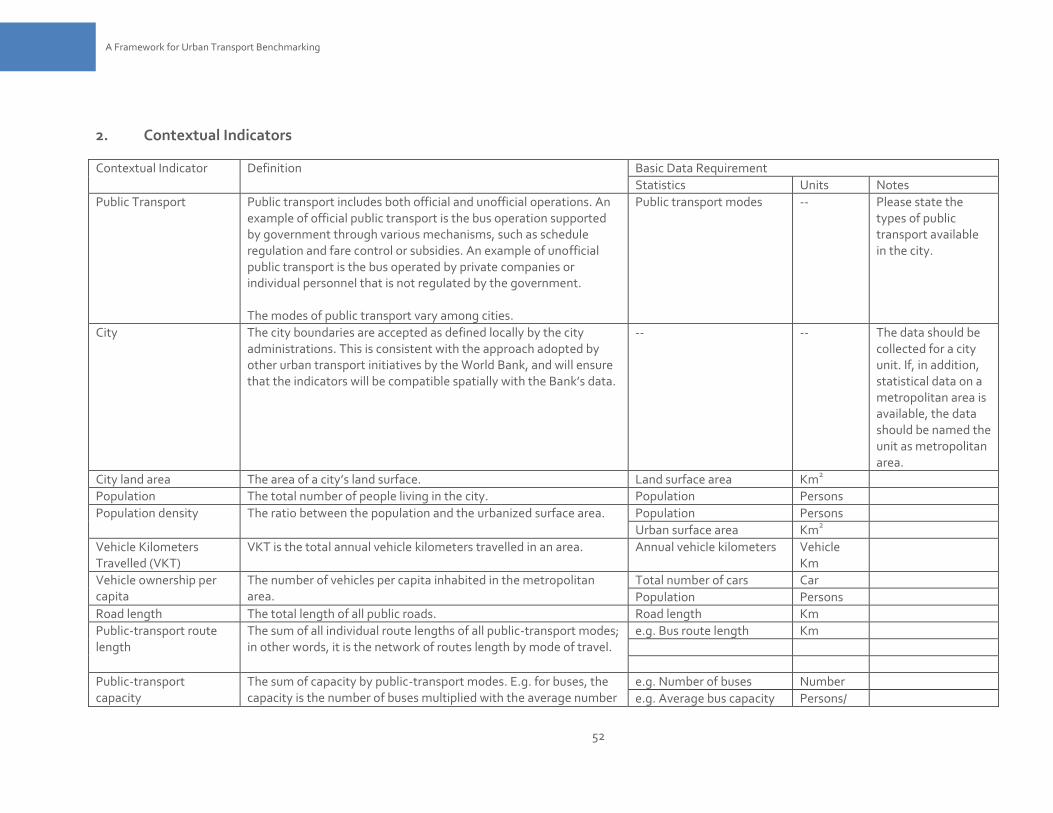
52
52
A Framework for Urban Transport Benchmarking
2. Contextual Indicators
Contextual Indicator Definition Basic Data Requirement
Statistics Units Notes
Public Transport Public transport includes both official and unofficial operations. An example of official public transport is the bus operation supported by government through various mechanisms, such as schedule regulation and fare control or subsidies. An example of unofficial public transport is the bus operated by private companies or individual personnel that is not regulated by the government. The modes of public transport vary among cities.
Public transport modes -- Please state the types of public transport available in the city.
City The city boundaries are accepted as defined locally by the city administrations. This is consistent with the approach adopted by other urban transport initiatives by the World Bank, and will ensure that the indicators will be compatible spatially with the Bank’s data.
-- -- The data should be collected for a city unit. If, in addition, statistical data on a metropolitan area is available, the data should be named the unit as metropolitan area.
City land area The area of a city’s land surface. Land surface area Km2
Population The total number of people living in the city. Population Persons
Population density The ratio between the population and the urbanized surface area.
Population Persons
Urban surface area Km2
Vehicle Kilometers Travelled (VKT)
VKT is the total annual vehicle kilometers travelled in an area. Annual vehicle kilometers Vehicle Km
Vehicle ownership per capita
The number of vehicles per capita inhabited in the metropolitan area.
Total number of cars Car
Population Persons
Road length The total length of all public roads. Road length Km
Public-transport route length
The sum of all individual route lengths of all public-transport modes; in other words, it is the network of routes length by mode of travel.
e.g. Bus route length Km
Public-transport capacity
The sum of capacity by public-transport modes. E.g. for buses, the capacity is the number of buses multiplied with the average number
e.g. Number of buses Number
e.g. Average bus capacity Persons/
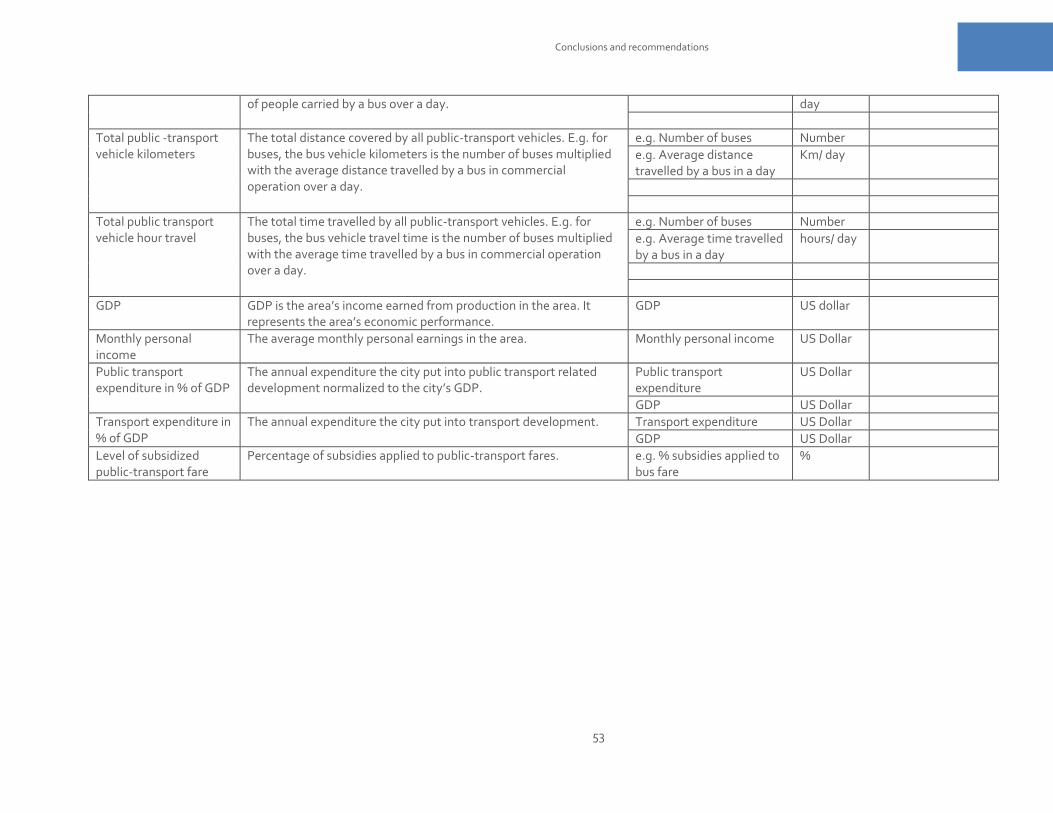
53
53
Conclusions and recommendations
of people carried by a bus over a day. day
Total public -transport vehicle kilometers
The total distance covered by all public-transport vehicles. E.g. for buses, the bus vehicle kilometers is the number of buses multiplied with the average distance travelled by a bus in commercial operation over a day.
e.g. Number of buses Number
e.g. Average distance travelled by a bus in a day
Km/ day
Total public transport vehicle hour travel
The total time travelled by all public-transport vehicles. E.g. for buses, the bus vehicle travel time is the number of buses multiplied with the average time travelled by a bus in commercial operation over a day.
e.g. Number of buses Number
e.g. Average time travelled by a bus in a day
hours/ day
GDP GDP is the area’s income earned from production in the area. It represents the area’s economic performance.
GDP US dollar
Monthly personal income
The average monthly personal earnings in the area. Monthly personal income US Dollar
Public transport expenditure in % of GDP
The annual expenditure the city put into public transport related development normalized to the city’s GDP.
Public transport expenditure
US Dollar
GDP US Dollar
Transport expenditure in % of GDP
The annual expenditure the city put into transport development. Transport expenditure US Dollar
GDP US Dollar
Level of subsidized public-transport fare
Percentage of subsidies applied to public-transport fares. e.g. % subsidies applied to bus fare
%
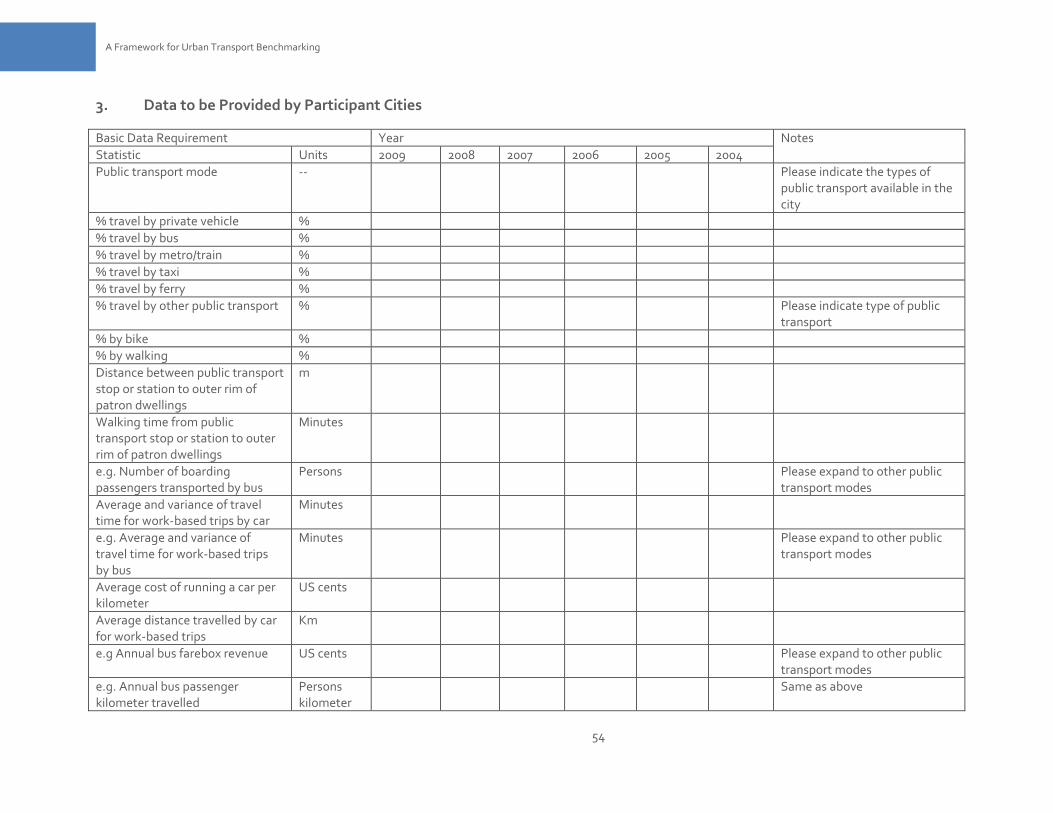
54
54
A Framework for Urban Transport Benchmarking
3. Data to be Provided by Participant Cities
Basic Data Requirement Year Notes
Statistic Units 2009 2008 2007 2006 2005 2004
Public transport mode -- Please indicate the types of public transport available in the city
% travel by private vehicle %
% travel by bus %
% travel by metro/train %
% travel by taxi %
% travel by ferry %
% travel by other public transport % Please indicate type of public transport
% by bike %
% by walking %
Distance between public transport stop or station to outer rim of patron dwellings
m
Walking time from public transport stop or station to outer rim of patron dwellings
Minutes
e.g. Number of boarding passengers transported by bus
Persons Please expand to other public transport modes
Average and variance of travel time for work-based trips by car
Minutes
e.g. Average and variance of travel time for work-based trips by bus
Minutes
Please expand to other public transport modes
Average cost of running a car per kilometer
US cents
Average distance travelled by car for work-based trips
Km
e.g Annual bus farebox revenue US cents Please expand to other public transport modes
e.g. Annual bus passenger kilometer travelled
Persons kilometer
Same as above
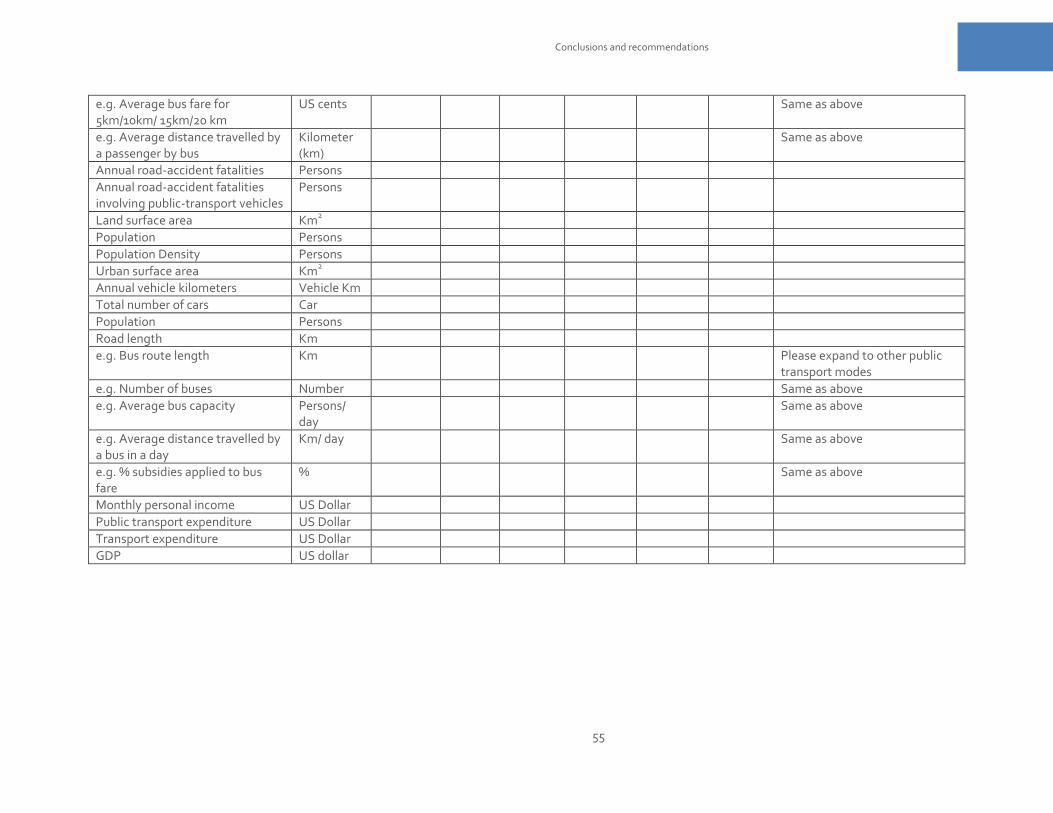
55
55
Conclusions and recommendations
e.g. Average bus fare for 5km/10km/ 15km/20 km
US cents Same as above
e.g. Average distance travelled by a passenger by bus
Kilometer (km)
Same as above
Annual road-accident fatalities Persons
Annual road-accident fatalities involving public-transport vehicles
Persons
Land surface area Km2
Population Persons
Population Density Persons
Urban surface area Km2
Annual vehicle kilometers Vehicle Km
Total number of cars Car
Population Persons
Road length Km
e.g. Bus route length Km Please expand to other public transport modes
e.g. Number of buses Number Same as above
e.g. Average bus capacity Persons/ day
Same as above
e.g. Average distance travelled by a bus in a day
Km/ day Same as above
e.g. % subsidies applied to bus fare
% Same as above
Monthly personal income US Dollar
Public transport expenditure US Dollar
Transport expenditure US Dollar
GDP US dollar

57
57
Conclusions and recommendations
REFERENCES
Ahmed, Q.I., Lu, H., and Ye, S. (2008) “Urban transportation and equity: a case
study of Beijing and Karachi.” Transportation Research Part A, 42,
125-139.
Anderson, R. (2006) “Metro benchmarking yields tangible benefits.” ERO,
March. 22-25.
ASTD (1992) Understanding Benchmarking: The Search for Best Practices.
Alexandria, VA.
ARC (2009) Strategic Option 3 Public Transport Network. Regional Land
Transport Strategy Working Report No 21. Auckland Regional
Council.
Beldean, V., Calinescu, S., and Sandu, I. (2002) Development and improving
efficiency of the underground urban transport in Bucharest
(Romania). In: Urban Mobility for All, Lisse.
BEST (2003) Benchmarking European Sustainable Transport: Final Publishable
Report. Brussels, Belgium.
BEST (2006) Benchmarking in European Service of Public Transport: Survey
Report. Stockholm, Sweden.
Ceder, A. (2007) Public Transit Planning and Operation: Theory, Modelling and
Practice: London: Elsevier , 626 p.
Creutzig, F., and He, D. (2009) “Climate change mitigation and co-benefits of
feasible transport demand policies in Beijing”. Transport Research
Part D, 14, 120-131.
Darido, G., Torres-Montoya, M., and Mehndiratta, S. (2009) Urban transport
and CO2 emissions: some evidence from Chinese cities. Working
paper prepared for the World Bank.
Dattakumar, R., and Jagadeesh, R. (2003) “A review of literature on
benchmarking.” Benchmarking: An International Journal, 10 (3), 176-
209.
Geerlings, H., Klementschitz, R., and Mulley, C. (2006) “Development of a
methodology for benchmarking public transportation organizations: a
practical tool based on an industry sound methodology.” Journal of
Cleaner Production, 14, 113-123.
Benchmarking of Urban Transport: A Framework
58
Han, S.S. (2009) “Sustainable transport planning in Asia: the Singapore story.”
Proceedings of the 4th International Conference on Future Urban
Transport, Göteborg, Sweden
Haskins, C. (2006). Development Issues in Cape Town. IDP Spatial Co-
ordination Workshop. Cape Town. South Africa.
Henning, T.F.P., Muruvan, S., Feng, W., and Dunn, R.C.M. (2011) “The
development of a benchmarking tool for monitoring progress towards
sustainable transportation in New Zealand.” Transport Policy.
Volume: 18 (p480-488 ).
Japan International Cooperation Agency (J.I.C.A.) (2000) The Comprehensive
Urban Transport Study of Bucharest City and its Metropolitan Area.
PADECO Co. Ltd.
NAMS Ltd. (2007) Developing Levels of Service & Performance Measures
Guidelines. Wellington, NZ: NAMS Ltd.
Taylor, N. (2006) The Urban Transport Benchmarking Initiative Year Three
Final Report. European Commission.
The World Bank. (2001) Sri Lanka – Toward an Urban Transport Strategy for
Colombo. Report No. 26297-CE, Washington D.C. January 2001.
UITP (2006) Mobility in Cities Database: Analysis and Recommendations
Report. Brussels, Belgium.
Vivier, J. (2006). Mobility in Cities Database - Analysis and Recommendations.
International Association of Public Transport, Brussels, Belgium.
Wu, H. (2009) Benchmarking efficiency of urban transport system in China.
Proceedings of the 4th International Conference on Future Urban
Transport, Göteborg, Sweden.
59
59
Conclusions and recommendations
LIST OF ABBREVIATIONS
BEST Benchmarking European Sustainable Transport
BoB Benchmarking of Benchmarks
CBD Central Business District
CoMET The Community of Metros
GDP Gross Domestic Product
IATA International Air Transport Association
IRT Integrated Rapid Transit
IT Information Technology
KPI Key Performance Indicator
NATCYP National Cycling Policy
NZTA New Zealand Transport Agency
PT Public Transport
UITP International Association of Public Transport


Transport Division
Transport, Water and
Information and Communication
Technology Department
The World Bank
1818 H Street NW
Washington DC 20433
USA
www.worldbank.org/Transport


