23
Related Rates Framework 1 A Framework to Describe the Solution Process for Related Rates Problems in Calculus Nicole Engelke Cal State Fullerton March 12, 2007

Related Rates Framework 1
A Framework to Describe the Solution Process for Related Rates Problems in Calculus
Nicole Engelke
Cal State Fullerton
March 12, 2007

Related Rates Framework 2
Abstract
Related rates problems are a source of difficulty for many calculus students. There has been little
research on the role of the mental model when solving these problems. Three mathematicians
were observed solving three related rates problems. From the examination of their solutions, a
framework for the solution process emerged. The framework is based on five phases: draw a
diagram, construct a functional relationship, relate the rates, solve for the unknown rate, and
check the answer for reasonability. Each phase can be described by the content knowledge the
problem solver accesses, the mental model that is developed, and the solution artifacts that are
generated.

Related Rates Framework 3
A Framework to Describe the Solution Process for Related Rates Problems in Calculus
Three mathematicians were observed solving three related rates problems. This data was
analyzed to develop a framework for solving related rates problems. It was found that the
mathematicians identified the problem type as a “related rates problem” and then engaged in a
series of phases to generate pieces of their solution. These phases were identified as: draw and
label a diagram, construct a meaningful functional relationship, relate the rates, solve for the
unknown rate, and check the answer for reasonability. To complete each phase and construct a
piece of the solution, the mathematicians built and refined a mental model of the problem
situation. The framework captured how the solution to the problem emerged from the
mathematicians’ thinking as they solved to related rates problems.
Background
Related rates problems emerged historically as a means to reform the manner in which
calculus was taught. Rev. William Ritchie (1790-1837) was a pioneer in mathematics education;
it was his desire to write a reform calculus text that was more accessible to ordinary, non-
university students (Austin, Barry, & Berman, 2000). In Ritchie’s text, related rates problems
were meant to be fundamental, explanatory problems that illustrate the power of calculus.
However, in today’s calculus classroom, related rates problems are often given only a cursory
treatment and are sometimes even omitted from the curriculum. Most traditional calculus
textbooks provide the student with a list of steps that should be followed to solve such problems.
For example, at the beginning of the section on related rates in his calculus textbook, Stewart
(1991) stated:
In a related rates problem the idea is to compute the rate of change of one quantity in
terms of the rate of change of another quantity (which may be more easily measured).

Related Rates Framework 4
The procedure is to find an equation that relates the two quantities and then use the Chain
Rule to differentiate both sides with respect to time. (p. 160)
Stewart’s description implies that these problems are easily solved in two quick steps. Two pages
later, he outlines a strategy for solving related rates problems that involves seven steps:
1) Read the problem carefully.
2) Draw a diagram if possible.
3) Introduce notation. Assign symbols to all quantities that are functions of time.
4) Express the given information and the required rate in terms of derivatives.
5) Write an equation that relates the various quantities of the problem. If necessary, use
the geometry of the situation to eliminate one of the variables by substitution.
6) Use the Chain Rule to differentiate both sides of the equation with respect to t.
7) Substitute the given information into the resulting equation and solve for the
unknown quantity. (p. 162)
Martin (2000) conducted a study investigating students’ difficulties with geometric
related rates problems. In attempting to understand students’ difficulties with these problems,
Martin broke down the procedure for solving them into seven steps which are closely related to
those presented by Stewart (1991). She classified these steps as either conceptual or procedural
as outlined in Table 1 below. In her study, Martin found that the problems that appeared to be the
easiest for students were the ones that required only the selection of the appropriate geometric
formula, differentiation, substitution, and algebraic manipulation. The most difficult questions
were those that required Step 7, solving an auxiliary problem. She also indicated that the
conceptual steps are more difficult for students than the procedural ones. However, Martin
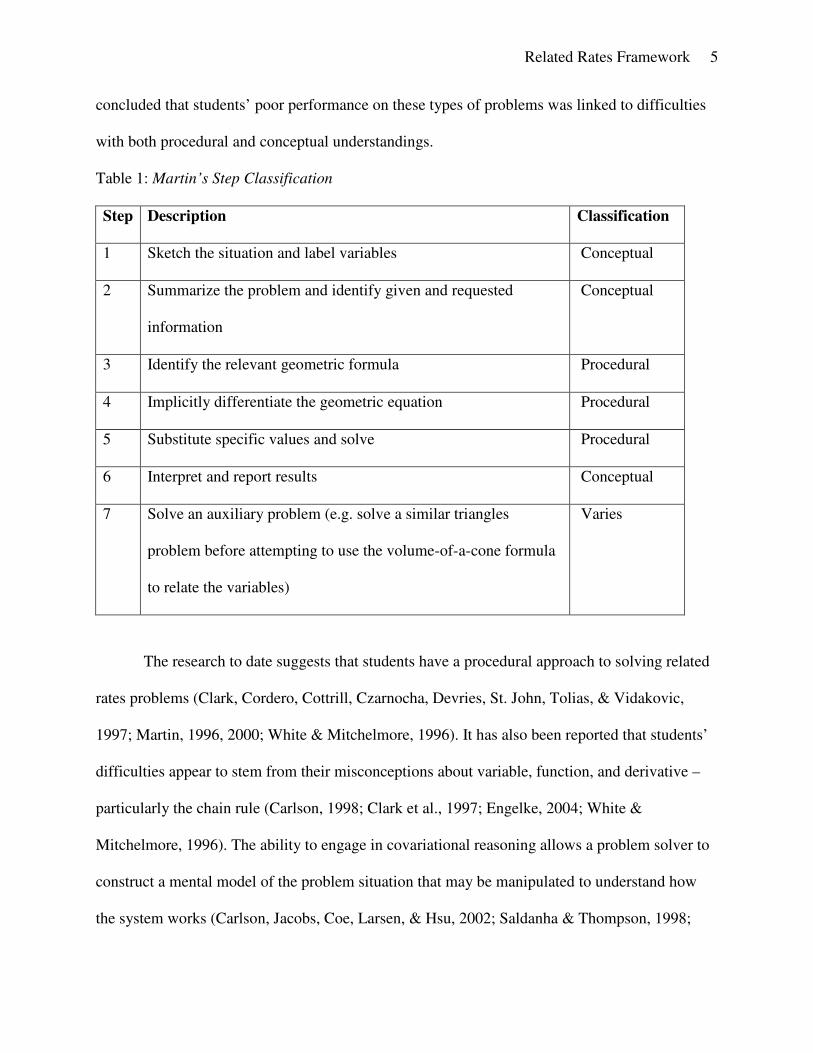
Related Rates Framework 5
concluded that students’ poor performance on these types of problems was linked to difficulties
with both procedural and conceptual understandings.
Table 1: Martin’s Step Classification
Step Description Classification
1 Sketch the situation and label variables Conceptual
2 Summarize the problem and identify given and requested
information
Conceptual
3 Identify the relevant geometric formula Procedural
4 Implicitly differentiate the geometric equation Procedural
5 Substitute specific values and solve Procedural
6 Interpret and report results Conceptual
7 Solve an auxiliary problem (e.g. solve a similar triangles
problem before attempting to use the volume-of-a-cone formula
to relate the variables)
Varies
The research to date suggests that students have a procedural approach to solving related
rates problems (Clark, Cordero, Cottrill, Czarnocha, Devries, St. John, Tolias, & Vidakovic,
1997; Martin, 1996, 2000; White & Mitchelmore, 1996). It has also been reported that students’
difficulties appear to stem from their misconceptions about variable, function, and derivative –
particularly the chain rule (Carlson, 1998; Clark et al., 1997; Engelke, 2004; White &
Mitchelmore, 1996). The ability to engage in covariational reasoning allows a problem solver to
construct a mental model of the problem situation that may be manipulated to understand how
the system works (Carlson, Jacobs, Coe, Larsen, & Hsu, 2002; Saldanha & Thompson, 1998;

Related Rates Framework 6
Simon, 1996). The ability to engage in transformational and covariational reasoning appears to
be critical for success when solving related rates problems (Engelke, 2004). The purpose of this
study was to develop a framework to describe how a mental model for a related rates problem
developed during the solution process.
To describe how a mental model emerged during the solution process, Carlson and
Bloom’s (2005) multidimensional problem solving framework provided an initial structure with
which to examine the data. Their framework describes four phases of the problem solving
process: orienting, planning, executing, and checking. They observed that in each phase the
problem solver accessed resources and heuristics. In addition, the problem solvers cycled
through the phases of plan, execute and check throughout the problem solving process. Using
these ideas, it was the researcher’s goal to identify distinct phases and the related content
knowledge and heuristics that were used when solving a related rates problem. It was also
desired to describe how content knowledge and heuristics informed the development of the
problem solver’s mental model of the problem situation.
The Study
Three mathematicians were asked to solve three related rates problems in a think aloud
problem solving session which lasted about 45 minutes. Each mathematician was given a sheet
of paper with the three problems printed on it and asked to work through the problem aloud and
to attempt to verbalize everything they were thinking. The interviewer asked clarifying questions
about their statements when additional information was needed. Each session was videotaped
and transcribed for analysis. Discourse analysis was used to analyze the mathematicians’
solution processes. Video recordings captured the problem solver’s gestures which were
particularly important to be able to identify how the problem solver used and referenced

Related Rates Framework 7
information he had written as part of the solution process. Particular attention was given to how
they talked about what they were imagining and how they talked about the diagrams they drew
and modified throughout the solution process. Because it is not possible to see what an individual
is imagining in his mind, these are the data that allow one to best conjecture how the mind is
interpreting and modeling the problem situation. In watching the video, it became apparent that
what the mathematicians wrote down played an integral part of their solution process. Each
written piece of written information was coded with the transcript and called an artifact. As the
data analysis progressed, solution artifacts were defined to be written pieces of information that
the problem solver used as an additional resource during the problem solving process to further
develop his mental model of the problem situation.
Results
Five phases were identified in the related rates problem solving process: draw a diagram,
construct a functional relationship, relate the rates, solve for the unknown rate, and check the
answer for reasonability. During the first three phases, the mathematicians were observed talking
about the changing quantities in the problem situation while referencing and modifying their
diagrams. From these statements, conjectures about how their mental models of the problem
situation developed and a framework to describe this process emerged. Due to space constraints,
we will examine just one mathematician’s solution to one problem.
One of the related rates problems the mathematicians were asked to solve required the
problem solver to create a powerful mental model as the geometric figure in the problem
situation does not have a commonly known volume formula. The problem was stated as follows:
Coffee is poured at a uniform rate of 20 cm3/sec into a cup whose inside is shaped like a
truncated cone. If the upper and lower radii of the cup are 4 cm and 2 cm, respectively, and the

Related Rates Framework 8
height of the cup is 6 cm, how fast will the coffee level be rising when the coffee is halfway up
the cup?
After reading the question, each of the mathematicians drew a diagram of the problem
situation. This diagram was then usually labeled with variables and constants. However, before
drawing the diagram, there is evidence that the mental model may have already been revised one
or more times. For example, Adam began the solution process with an incorrect interpretation of
the problem statement as see in the transcript below (transcript lines have been numbered to
facilitate the discussion):
Adam:
1. All right, well this is my kind of problem. Coffee is poured at a uniform rate of 20
cubic cm per second into a cup whose inside is shaped like a truncated cone.
2. Oh, this must be one of those horrible, uh, um hotel things, right? They have the little
plastic deals with the little conical cups and that always signals bad coffee. So, cause
they always make it much too weak, you know. So there you are in this windowless
ballroom, drinking out of this flimsy [hand motion]…yeah, I know what you’re
talking about. All right, a truncated cone.
3. All right, upper and lower radii of the cup are 4 and 2.
4. Um, this makes a difference. I don’t know what the upper and lower radii means.
5. Do you mean is the cup 4 inches wide? so it’s a shallow cup? or a tall narrow cup?
INT: The cone has actually been truncated so the bottom doesn’t actually exist.
Adam: Oh, oh, oh, I see. I’m still thinking about those horrible hotel cones. All right, so it’s
truncated like this. All right, gotcha, like that. [artifact-diagram]
Observe in Line 2 above that Adam’s initial interpretation of the problem situation is of a
whole cone and is related to his experience with coffee cups at conference hotels. In Lines 3 and
4, the phrase upper and lower radii appear to be in discordance with his current mental image.
After the interviewer explained the truncated aspect of the problem, Adam adjusted his mental
image and drew an accurate diagram of the problem situation. Thus, we have observed Adam’s
mental model develop from an inaccurate interpretation of the problem statement to an accurate
interpretation. In addition to the verbal statements that Adam made, he drew a diagram. Adam’s
diagram of the problem situation was the first solution artifact that he created. This diagram was
Related Rates Framework 9
further modified to include the labeling of constants and variables as Adam completed the first
phase of the problem solving framework: draw a diagram.
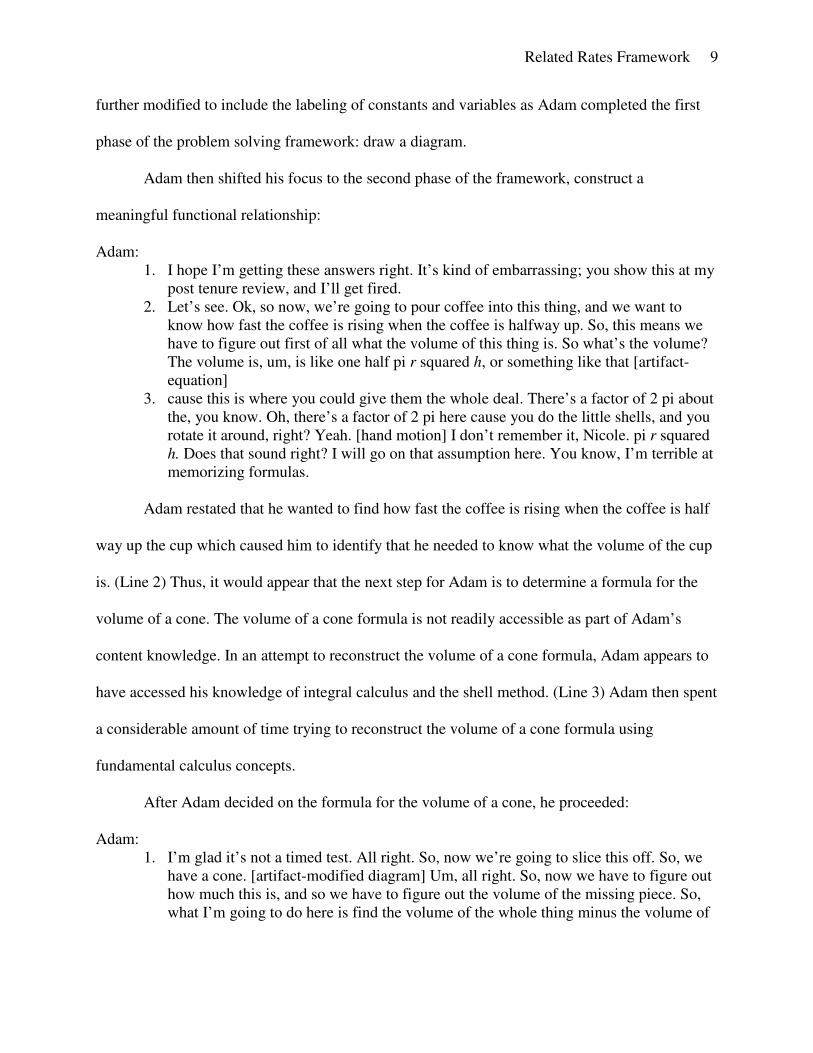
Adam then shifted his focus to the second phase of the framework, construct a
meaningful functional relationship:
Adam:
1. I hope I’m getting these answers right. It’s kind of embarrassing; you show this at my
post tenure review, and I’ll get fired.
2. Let’s see. Ok, so now, we’re going to pour coffee into this thing, and we want to
know how fast the coffee is rising when the coffee is halfway up. So, this means we
have to figure out first of all what the volume of this thing is. So what’s the volume?
The volume is, um, is like one half pi r squared h, or something like that [artifact-
equation]
3. cause this is where you could give them the whole deal. There’s a factor of 2 pi about
the, you know. Oh, there’s a factor of 2 pi here cause you do the little shells, and you
rotate it around, right? Yeah. [hand motion] I don’t remember it, Nicole. pi r squared
h. Does that sound right? I will go on that assumption here. You know, I’m terrible at
memorizing formulas.
Adam restated that he wanted to find how fast the coffee is rising when the coffee is half
way up the cup which caused him to identify that he needed to know what the volume of the cup
is. (Line 2) Thus, it would appear that the next step for Adam is to determine a formula for the
volume of a cone. The volume of a cone formula is not readily accessible as part of Adam’s
content knowledge. In an attempt to reconstruct the volume of a cone formula, Adam appears to
have accessed his knowledge of integral calculus and the shell method. (Line 3) Adam then spent
a considerable amount of time trying to reconstruct the volume of a cone formula using
fundamental calculus concepts.
After Adam decided on the formula for the volume of a cone, he proceeded:
Adam:
1. I’m glad it’s not a timed test. All right. So, now we’re going to slice this off. So, we
have a cone. [artifact-modified diagram] Um, all right. So, now we have to figure out
how much this is, and so we have to figure out the volume of the missing piece. So,
what I’m going to do here is find the volume of the whole thing minus the volume of

Related Rates Framework 10
the missing piece. If I took this thing down to the tip and then that will give me the
volume of the remainder.
2. Maybe there’s an easier way to do this problem. That’s why we always have example
9, cause somebody else has actually thought about it, and so we can follow the
pattern.
3. All right, let’s see, uh is this going to get me anywhere? [check] As the radius
decreases linearly, it goes from 4 cm to 2 cm in a distance of 6. Um, so that radius is
going to be decreasing uniformly with height. So, um, if we went down another 6 cm,
we’d have zero radius. So that would be the tip. So the whole the missing piece here
would be a cone of height of 12 cm. So the volume of the missing, of the bottom is
one half times pi times r squared, which is 2 squared times the h, which is 6. Um, all
right. So this is going to be 3 times 4 times pi, I think, right. [artifact-volume of
missing bottom]
4. And then the volume of the, the volume of the whole thing, that’s the volume that’s in
the bottom. The volume of the complete cone is one half times pi times uh 4 squared
times 12. Um, so this is 6 times 16 is 96 pi. [artifact-volume of complete cone]
5. All right, the volume of the cup is the difference between the two. So we are 86, 84 pi
[artifact-volume of cup] that’s a pain, let’s see [25:31]
Adam found the volume of the actual coffee cup by computing the difference between the
volume of the entire cone and the volume of the piece of the cone that does not really exist. As in
the trough problem, these calculations appear to allow Adam to better understand what is
happening in the problem situation.
After completing these calculations, Adam reconsidered how he should be thinking about
the problem situation.
Adam:
1. All right now, ok. So now actually what I need to think about here is, um, should I
think about height from the, um, the imaginary tip here? Or should I, should I start
thinking about height from here on up? And I think about height from the bottom of
the imaginary tip and hope that I made the correct adjustment when I get over here
2. Um, cause all you want to know is the rate of the change in the coffee. So whether I
measure from here or from down here, um, that doesn’t make a whole lot of
difference. So, that’s important, ok.
3. Let’s see. Um, yep, ok. Now in this case, since we have a cone, the volume depends
upon the height. So in this particular case then, the radius is, um, so the radius…
We’re going down here what, 2 cm in the space of 6 cm. So it’s changing at the rate
of um one third cm per cm, so the slope is a third. So that means that this is one half
times pi times one third h [artifact-volume equation]
4. Ahh, I’m looking back to worry about whether to measure from my imaginary tip, or
whether I’m going to start measuring from um the actual bottom. Um, what do I want
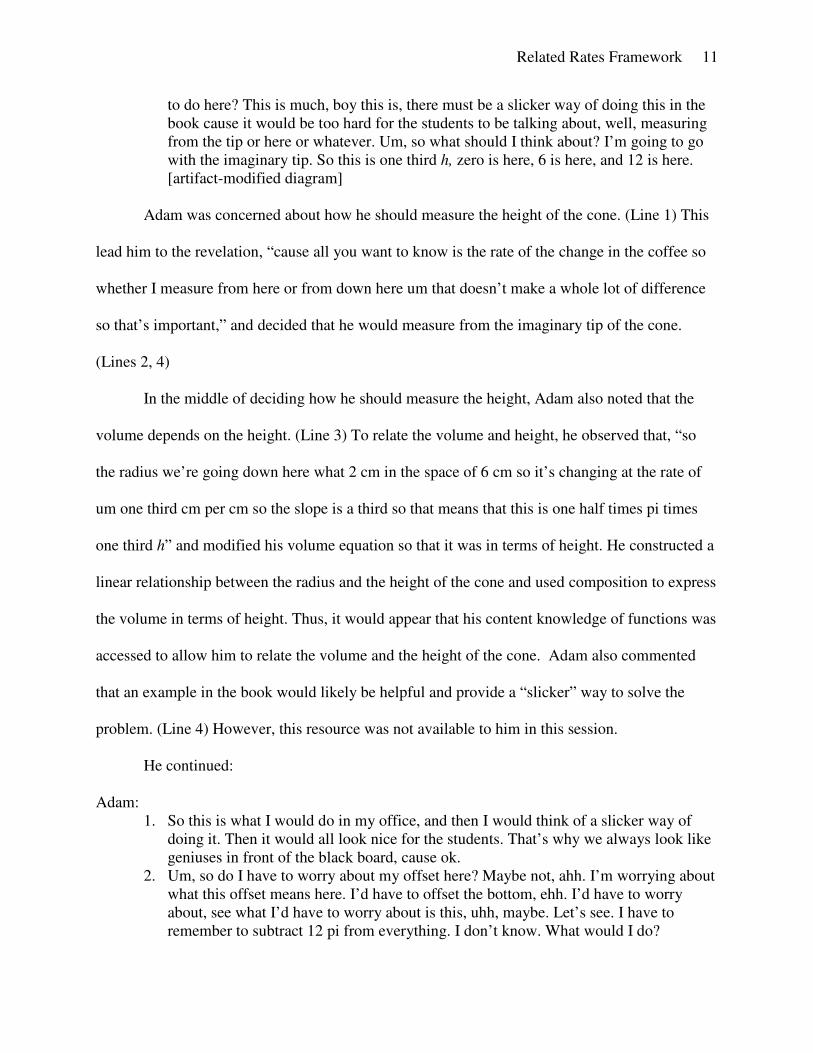
Related Rates Framework 11
to do here? This is much, boy this is, there must be a slicker way of doing this in the
book cause it would be too hard for the students to be talking about, well, measuring
from the tip or here or whatever. Um, so what should I think about? I’m going to go
with the imaginary tip. So this is one third h, zero is here, 6 is here, and 12 is here.
[artifact-modified diagram]
Adam was concerned about how he should measure the height of the cone. (Line 1) This
lead him to the revelation, “cause all you want to know is the rate of the change in the coffee so
whether I measure from here or from down here um that doesn’t make a whole lot of difference
so that’s important,” and decided that he would measure from the imaginary tip of the cone.
(Lines 2, 4)
In the middle of deciding how he should measure the height, Adam also noted that the
volume depends on the height. (Line 3) To relate the volume and height, he observed that, “so
the radius we’re going down here what 2 cm in the space of 6 cm so it’s changing at the rate of
um one third cm per cm so the slope is a third so that means that this is one half times pi times
one third h” and modified his volume equation so that it was in terms of height. He constructed a
linear relationship between the radius and the height of the cone and used composition to express
the volume in terms of height. Thus, it would appear that his content knowledge of functions was
accessed to allow him to relate the volume and the height of the cone. Adam also commented
that an example in the book would likely be helpful and provide a “slicker” way to solve the
problem. (Line 4) However, this resource was not available to him in this session.
He continued:
Adam:
1. So this is what I would do in my office, and then I would think of a slicker way of
doing it. Then it would all look nice for the students. That’s why we always look like
geniuses in front of the black board, cause ok.
2. Um, so do I have to worry about my offset here? Maybe not, ahh. I’m worrying about
what this offset means here. I’d have to offset the bottom, ehh. I’d have to worry
about, see what I’d have to worry about is this, uhh, maybe. Let’s see. I have to
remember to subtract 12 pi from everything. I don’t know. What would I do?
Related Rates Framework 12
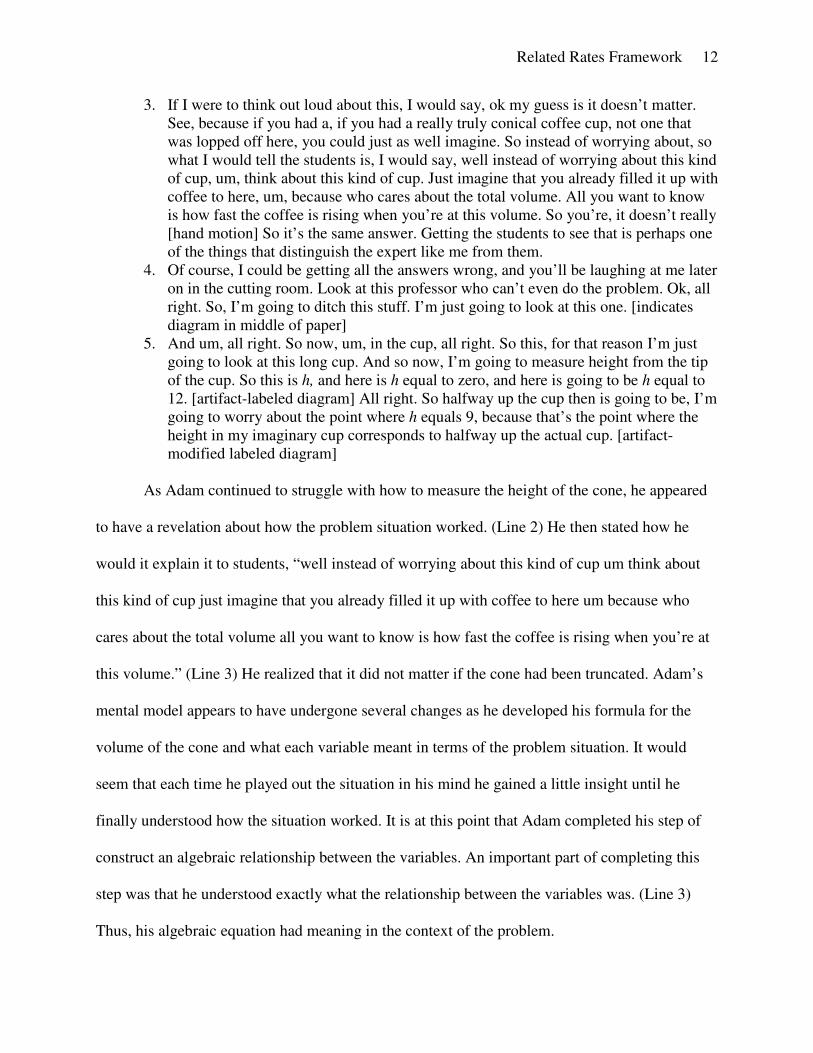
3. If I were to think out loud about this, I would say, ok my guess is it doesn’t matter.
See, because if you had a, if you had a really truly conical coffee cup, not one that
was lopped off here, you could just as well imagine. So instead of worrying about, so
what I would tell the students is, I would say, well instead of worrying about this kind
of cup, um, think about this kind of cup. Just imagine that you already filled it up with
coffee to here, um, because who cares about the total volume. All you want to know
is how fast the coffee is rising when you’re at this volume. So you’re, it doesn’t really
[hand motion] So it’s the same answer. Getting the students to see that is perhaps one
of the things that distinguish the expert like me from them.
4. Of course, I could be getting all the answers wrong, and you’ll be laughing at me later
on in the cutting room. Look at this professor who can’t even do the problem. Ok, all
right. So, I’m going to ditch this stuff. I’m just going to look at this one. [indicates
diagram in middle of paper]
5. And um, all right. So now, um, in the cup, all right. So this, for that reason I’m just
going to look at this long cup. And so now, I’m going to measure height from the tip
of the cup. So this is h, and here is h equal to zero, and here is going to be h equal to
12. [artifact-labeled diagram] All right. So halfway up the cup then is going to be, I’m
going to worry about the point where h equals 9, because that’s the point where the
height in my imaginary cup corresponds to halfway up the actual cup. [artifact-
modified labeled diagram]
As Adam continued to struggle with how to measure the height of the cone, he appeared
to have a revelation about how the problem situation worked. (Line 2) He then stated how he
would it explain it to students, “well instead of worrying about this kind of cup um think about
this kind of cup just imagine that you already filled it up with coffee to here um because who
cares about the total volume all you want to know is how fast the coffee is rising when you’re at
this volume.” (Line 3) He realized that it did not matter if the cone had been truncated. Adam’s
mental model appears to have undergone several changes as he developed his formula for the
volume of the cone and what each variable meant in terms of the problem situation. It would
seem that each time he played out the situation in his mind he gained a little insight until he
finally understood how the situation worked. It is at this point that Adam completed his step of
construct an algebraic relationship between the variables. An important part of completing this
step was that he understood exactly what the relationship between the variables was. (Line 3)
Thus, his algebraic equation had meaning in the context of the problem.

Related Rates Framework 13
Adam then proceeded to simplify his volume equation as is seen in the following excerpt.
Adam:
All right, um, ok. So we’re going from a radius of 4 at the top to a radius of zero at the
bottom over, over a space of 12 cm. So that means that the radius changes, uh, as the
height over three, and that’s what we’re going to go with. So this is one half pi. Let’s see.
This is a kind of small piece of paper. So, all right, so this is one half pi times the radius,
which is one third h, all squared, times h. [artifact-volume equation hhV
2
3
1
2
1
= π ]
Um, so we get a ninth times a half. So this is 18. So this is pi over 18 times h cubed.
That’s the volume of my reshaped cone here, [artifact-volume equation 3
18
1hV π= ]
After simplifying his volume equation, Adam continued to the next phase of relate the
rates:
Adam:
And, um, we’re interested in dh dt. So dv dt is dv dh times dh dt. [artifact-general chain
rule form equation dt
dh
dh
dV
dt
dV⋅= ] Um, and that means that dv dt is 20 cm per second
cubed, cm per second, and dv dh, uhh is what it’s going to be, pi over 9 times h squared
times dh dt. [artifact-differentiated equation dt
dhh ⋅=
2
920
π]
Adam identified dt
dhas the rate he wanted to find and then expressed a relationship
between the rates using the chain rule. He did not operate on the volume equation he constructed.
Rather, he expressed a relationship between the rates using the chain rule and then associated
each rate with a numeric value or a function.
Adam completed the final phase of the framework, check the answer for reasonability, by
performing a unit analysis:
Adam:
(1) All right. So when you’re halfway up the cup, that’s when h is equal to 9. So we
have pi over 9, times 9 squared, times dh dt equals 20 [artifact-substituted in
values into differentiated equation]
(2) And this is all going to be cubic cm per second because you have 9 squared, 9
square cm here, and we have cm per second here. So, our units are consistent.
[check]

Related Rates Framework 14
(3) Um, all right. So this 9 cancels one of these 9s. So I have 9 pi times dh dt, and so I
would say then that the height dh dt is 20 over 9 pi, uh, cm per second [artifact-
solution]
(4) Looks right. So, the reason I’m worried about the units here… let’s see. We have
20 on the left, here we have cubic cm per second, over here we have squared cm,
and we have cm per second. Um, so when I do the division here, I have a one over
cm squared so over here, and therefore my answer here is in terms of cm per
second, which is consistent with the idea of the height rising. [check] Um, so
that’s the answer, I think.
After he substituted the known values into his differentiated equation (Line 1), Adam
quickly obtained an answer to the problem. (Line 3) He performed a unit analysis to check his
answer for reasonability. (Lines 2, 4)
In Adam’s solution to the coffee cup problem, he frequently referenced and interacted
with the numerous diagrams he drew. This suggests that Adam is regularly manipulating and
modifying his mental model of the problem situation.
An interesting aspect of Adam’s solution is that even though he expressed the volume
equation in terms of height, he did not operate on the function he constructed to relate the rates.
Instead, when he carried out the relate the rates step, he wrote out the chain rule as
dt
dh
dh
dV
dt
dV⋅= . He then proceeded to associate each rate, such as
dh
dV, with either the appropriate
numeric value or function. He did this when solving the other problems, too. In contrast, the
other mathematicians in the study thought of each variable as a function of time and implicitly
differentiated their function with respect to time.
In solving the coffee cup problem, each phase generated solution artifacts. Adam drew
and labeled diagrams that were frequently accessed and used to further develop his ideas about
the problem situation. He also constructed and combined algebraic relationships as needed to
relate the volume and the height. After relating the volume and the height, he differentiated his
algebraic relationship with respect to time using the chain rule and known values were

Related Rates Framework 15
substituted into this equation. Adam then performed algebraic manipulations to yield a solution
which was checked for reasonability.
Conclusions
While a textbook may provide a list of about seven steps to follow when solving a related
rates problem, most mathematicians appear to condense this to four or five steps which may be
described as phases. These phases include: draw and label a diagram, construct a meaningful
functional relationship, relate the rates, solve for the unknown rate, and check the answer for
reasonability. The completion of each of these phases is influenced by the problem solver’s
ability to access mathematical content knowledge to construct a meaningful mental model of the
problem situation. As this content knowledge is accessed and the mental model is developed, the
problem solver creates solution artifacts (written pieces of information that result from analyzing
the problem) to represent his understanding of the problem. While a problem solver may write
down many things, the solution artifacts are the written pieces of information that become an
additional resource for the problem solver and frequently help to advance the solution process.
Table 2 below describes what solution artifacts are likely generated at each phase of the solution
process. It also describes what content knowledge (geometry, function, derivative, etc.) and
related heuristics may be accessed to develop the mental model and create solution artifacts. It
should be noted that these phases are not necessarily hierarchical. While it is likely that one will
proceed in this order, it is possible that certain aspects of one phase may be carried out during
another phase.
Related Rates Framework 16
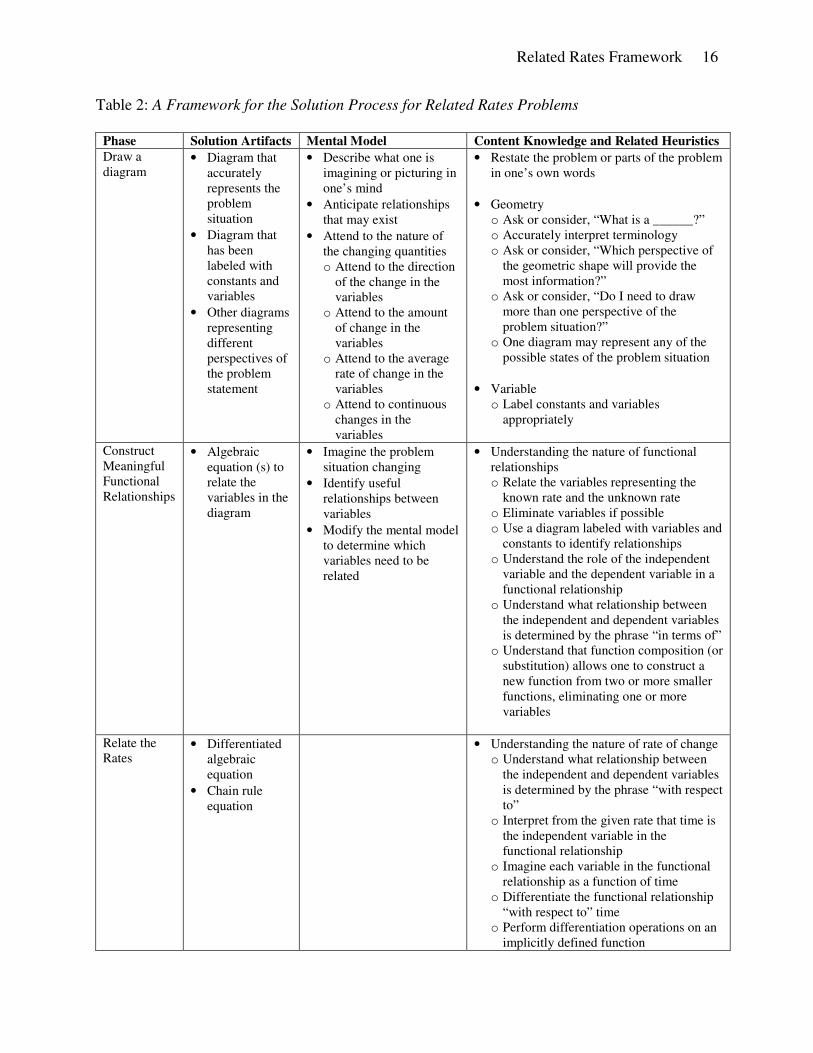
Table 2: A Framework for the Solution Process for Related Rates Problems
Phase Solution Artifacts Mental Model Content Knowledge and Related Heuristics
Draw a
diagram • Diagram that
accurately
represents the
problem
situation
• Diagram that
has been
labeled with
constants and
variables
• Other diagrams
representing
different
perspectives of
the problem
statement
• Describe what one is
imagining or picturing in
one’s mind
• Anticipate relationships
that may exist
• Attend to the nature of
the changing quantities
o Attend to the direction
of the change in the
variables
o Attend to the amount
of change in the
variables
o Attend to the average
rate of change in the
variables
o Attend to continuous
changes in the
variables
• Restate the problem or parts of the problem
in one’s own words
• Geometry
o Ask or consider, “What is a ______?”
o Accurately interpret terminology
o Ask or consider, “Which perspective of
the geometric shape will provide the
most information?”
o Ask or consider, “Do I need to draw
more than one perspective of the
problem situation?”
o One diagram may represent any of the
possible states of the problem situation
• Variable
o Label constants and variables
appropriately
Construct
Meaningful
Functional
Relationships
• Algebraic
equation (s) to
relate the
variables in the
diagram
• Imagine the problem
situation changing
• Identify useful
relationships between
variables
• Modify the mental model
to determine which
variables need to be
related
• Understanding the nature of functional
relationships
o Relate the variables representing the
known rate and the unknown rate
o Eliminate variables if possible
o Use a diagram labeled with variables and
constants to identify relationships
o Understand the role of the independent
variable and the dependent variable in a
functional relationship
o Understand what relationship between
the independent and dependent variables
is determined by the phrase “in terms of”
o Understand that function composition (or
substitution) allows one to construct a
new function from two or more smaller
functions, eliminating one or more
variables
Relate the
Rates • Differentiated
algebraic
equation
• Chain rule
equation
• Understanding the nature of rate of change
o Understand what relationship between
the independent and dependent variables
is determined by the phrase “with respect
to”
o Interpret from the given rate that time is
the independent variable in the
functional relationship
o Imagine each variable in the functional
relationship as a function of time
o Differentiate the functional relationship
“with respect to” time
o Perform differentiation operations on an
implicitly defined function
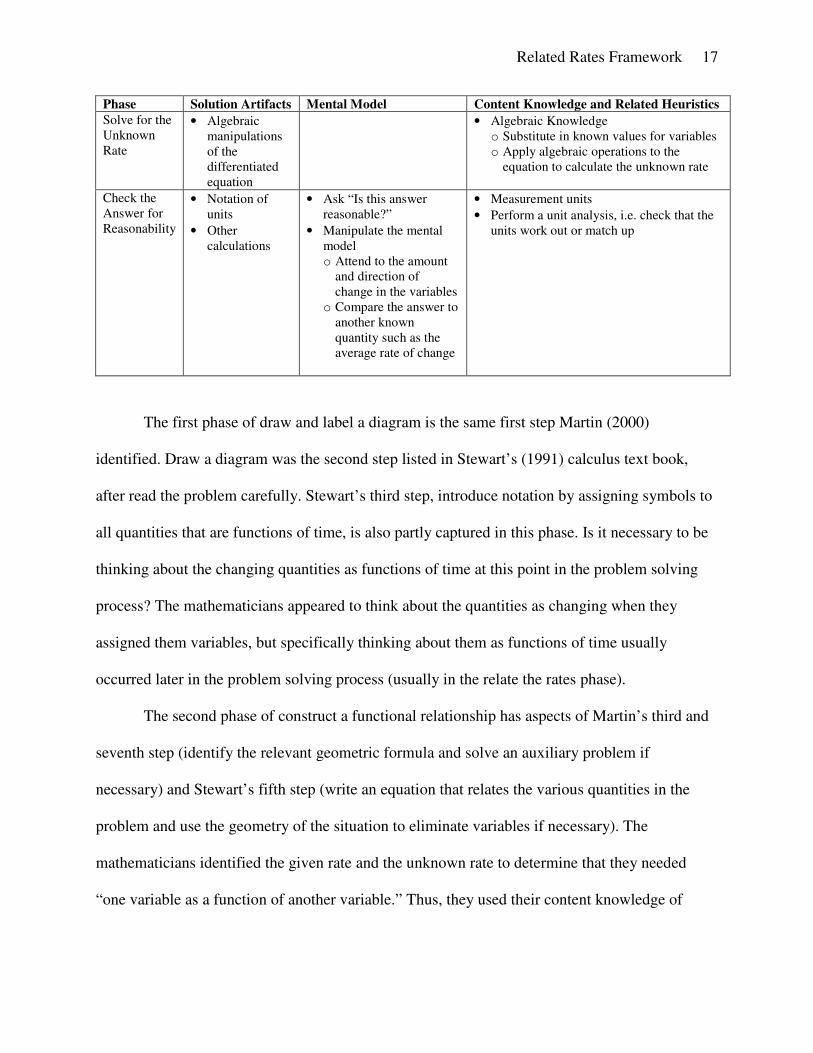
Related Rates Framework 17
Phase Solution Artifacts Mental Model Content Knowledge and Related Heuristics
Solve for the
Unknown
Rate
• Algebraic
manipulations
of the
differentiated
equation
• Algebraic Knowledge
o Substitute in known values for variables
o Apply algebraic operations to the
equation to calculate the unknown rate
Check the
Answer for
Reasonability
• Notation of
units
• Other
calculations
• Ask “Is this answer
reasonable?”
• Manipulate the mental
model
o Attend to the amount
and direction of
change in the variables
o Compare the answer to
another known
quantity such as the
average rate of change
• Measurement units
• Perform a unit analysis, i.e. check that the
units work out or match up
The first phase of draw and label a diagram is the same first step Martin (2000)
identified. Draw a diagram was the second step listed in Stewart’s (1991) calculus text book,
after read the problem carefully. Stewart’s third step, introduce notation by assigning symbols to
all quantities that are functions of time, is also partly captured in this phase. Is it necessary to be
thinking about the changing quantities as functions of time at this point in the problem solving
process? The mathematicians appeared to think about the quantities as changing when they
assigned them variables, but specifically thinking about them as functions of time usually
occurred later in the problem solving process (usually in the relate the rates phase).
The second phase of construct a functional relationship has aspects of Martin’s third and
seventh step (identify the relevant geometric formula and solve an auxiliary problem if
necessary) and Stewart’s fifth step (write an equation that relates the various quantities in the
problem and use the geometry of the situation to eliminate variables if necessary). The
mathematicians identified the given rate and the unknown rate to determine that they needed
“one variable as a function of another variable.” Thus, they used their content knowledge of
Related Rates Framework 18
geometry to identify appropriate relationships and eliminate variables if necessary by applying
function composition.
The third phase of relate the rates captures Martin’s fourth step (implicitly differentiate
with respect to time) and Stewart’s fourth and sixth steps (express the given and unknown rates
in terms of derivatives and use the chain rule to differentiate with respect to time, respectively).
For the mathematicians, it was because they were able to think about the variables in the
functional relationship as functions of time that allowed them to successfully apply the chain rule
or implicit differentiation. The mathematicians used the phrase “with respect to” to restate both
the known and unknown rates in the problem. It seemed that this was an extremely powerful tool
for the mathematicians as the phrase appeared to help them identify the independent and
dependent variables in the problem. Thus, they were able to compute the rate of change of each
variable “with respect to time” using the chain rule.
The fourth phase of solve for the unknown rate captures Martin’s fifth step (substitute in
values and solve) and Stewart’s seventh step (substitute in values and solve). This step did not
cause any difficulty for the mathematicians aside from a few algebraic errors.
The final phase of check the answer for reasonability may be considered part of Martin’s
sixth step, interpret and report results. Stewart does not direct the problem solver to check his
solution. This step was an inherent part of the mathematicians’ solution process, and they also
checked the results of many of their steps along the way. Performing checks after each step had
been carried out allowed the mathematicians to catch errors before moving on in most cases.
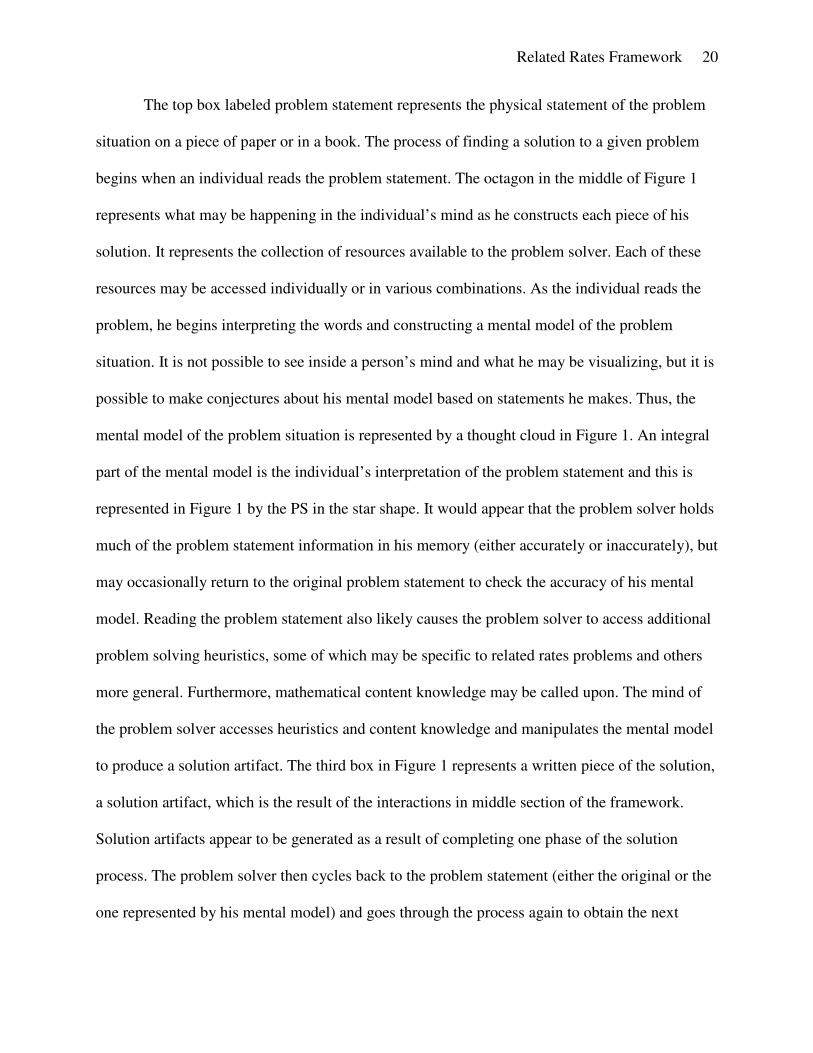
Figure 1 below illustrates the cyclic nature of the problem solving process. It begins with
the problem solver reading and interpreting the problem statement. As part of the interpretation,
the problem solver begins to access the resources available to him. The result of interpreting part

Related Rates Framework 19
of the problem situation is a solution artifact.
Figure1: The Solution Process for Related Rates Problems
Problem Statement
Solution Artifact
Mental Model
PS
Content
Knowledge
Previous
Solution
Artifacts Heuristics
Related Rates Framework 20
The top box labeled problem statement represents the physical statement of the problem
situation on a piece of paper or in a book. The process of finding a solution to a given problem
begins when an individual reads the problem statement. The octagon in the middle of Figure 1
represents what may be happening in the individual’s mind as he constructs each piece of his
solution. It represents the collection of resources available to the problem solver. Each of these
resources may be accessed individually or in various combinations. As the individual reads the
problem, he begins interpreting the words and constructing a mental model of the problem
situation. It is not possible to see inside a person’s mind and what he may be visualizing, but it is
possible to make conjectures about his mental model based on statements he makes. Thus, the
mental model of the problem situation is represented by a thought cloud in Figure 1. An integral
part of the mental model is the individual’s interpretation of the problem statement and this is
represented in Figure 1 by the PS in the star shape. It would appear that the problem solver holds
much of the problem statement information in his memory (either accurately or inaccurately), but
may occasionally return to the original problem statement to check the accuracy of his mental
model. Reading the problem statement also likely causes the problem solver to access additional
problem solving heuristics, some of which may be specific to related rates problems and others
more general. Furthermore, mathematical content knowledge may be called upon. The mind of
the problem solver accesses heuristics and content knowledge and manipulates the mental model
to produce a solution artifact. The third box in Figure 1 represents a written piece of the solution,
a solution artifact, which is the result of the interactions in middle section of the framework.
Solution artifacts appear to be generated as a result of completing one phase of the solution
process. The problem solver then cycles back to the problem statement (either the original or the
one represented by his mental model) and goes through the process again to obtain the next

Related Rates Framework 21
solution artifact. As each solution artifact is generated, it becomes an additional resource for the
problem solver. It should also be noted that after a solution artifact has been constructed, the
problem solver may choose to check that part of his solution process. This cycle continues until
the problem solver reaches a solution.
Content knowledge of geometry, variable, function, and derivative is necessary at
different points in the problem solving process. Knowledge of geometry is necessary to correctly
interpret the words in the problem, draw an accurate diagram, and choose an appropriate
relationship between the variables. Knowledge of the concept of function is necessary to apply
composition to eliminate unnecessary variables and successfully apply the chain rule.
Knowledge of the concept of derivative is necessary to successfully compute derivatives.
Heuristics that the problem solver chooses to employ appear to be closely related to
content knowledge that has been accessed recently. For example, reading “how fast” in the
problem statement may cause one to rely on the heuristic that “how fast” indicates we are talking
about a rate. Many of the heuristics employed are likely related to how one interprets phrases
from the problem statement and are difficult to discern from content knowledge. Thus, heuristics
are indicated by a box that overlaps with content knowledge.
This framework could be used to guide the development of teaching materials for related
rates problems. Alternatively, it may be used to analyze any problem solver’s solution process
and highlight any misconceptions or difficulties. In my own work, I used the framework to
analyze the results of a related rates teaching experiment. By using the descriptions in the
framework, I was able to compare and contrast how the students and mathematicians approached
related rates problems. The results of the analysis using the framework allowed me to discover a
Related Rates Framework 22
fundamentally different approach to solving related rates problems based on a deep
understanding of the chain rule that needs to be further investigated.
References
Austin, B., Barry, D., & Berman, D. (2000). The lengthening shadow: The story of related rates.
Mathematics Magazine, 73(1), 3-12.
Carlson, M. (1998). A cross-sectional investigation of the development of the function concept.
Research in Collegiate Mathematics Education III, Conference Board of the
Mathematical Sciences, Issues in Mathematics Education, 7, 114-163.
Carlson, M., & Bloom, I. (2005). The cyclic nature of problem solving: An emergent
multidimensional problem-solving framework. Educational Studies in Mathematics, 58,
45-75.
Carlson, M., Jacobs, S., Coe, E., Larsen, S., & Hsu, E. (2002). Applying covariational reasoning
while modeling dynamic events: A framework and a study. Journal for Research in
Mathematics Education, 33(5), 352-378.
Clark, J. M., Cordero, F., Cottrill, J., Czarnocha, B., Devries, D. J., St. John, D., et al. (1997).
Constructing a schema: The case of the chain rule? Journal of Mathematical Behavior,
16(4), 345-364.
Engelke, N. (2004). Related rates problems: Identifying conceptual barriers. In D. McDougall
(Ed.), 26th Annual Conference of the North American Chapter of the International Group
for the Psychology of Mathematics Education (Vol. 2, pp. 455-462). Toronto, Ontario,
Canada.
Martin, T. S. (1996, October 12-15). First-year calculus students' procedural and conceptual
understandings of geometric related rate problems. Paper presented at the International
Group for the Psychology of Mathematics Education, North American Chapter, Panama
City, FL.
Martin, T. S. (2000). Calculus students' ability to solve geometric related-rates problems.
Mathematics Education Research Journal, 12(2), 74-91.
Saldanha, L. A., & Thompson, P. W. (1998). Re-thinking covariation form a quantitative
perspective: Simultaneous continuous variation. Paper presented at the Annual Meeting
of the Psychology of Mathematics Education - North America, Raleigh, N. C.: North
Carolina State University.
Simon, M. A. (1996). Beyond inductive and deductive reasoning: The search for a sense of
knowing. Educational Studies in Mathematics, 30, 197-210.
Stewart, J. (1991). Calculus (Second ed.). Pacific Grove, CA: Brooks/Cole Publishing Co.

Related Rates Framework 23
White, P., & Mitchelmore, M. (1996). Conceptual knowledge in introductory calculus. Journal
for Research in Mathematics Education, 27(1), 79-95.


