A FREE TRADE AREA BETWEEN SOUTH AFRICA AND INDIA: WHICH COMMODITIES MATTER? Dirk Ernst van Seventer TIPS Thembi Mlangeni DTI This paper was presented at the TIPS Policy Review Workshop held in August 2001.
Transcript
A FREE TRADE AREA BETWEEN SOUTH AFRICA AND INDIA: WHICH COMMODITIES MATTER?
Dirk Ernst van Seventer TIPS
Thembi Mlangeni
DTI This paper was presented at the TIPS Policy Review Workshop held in August 2001.
ii
TABLE OF CONTENTS LIST OF TABLES ..................................................................................................................II LIST OF FIGURES .............................................................................................................. III EXECUTIVE SUMMARY .................................................................................................. IV 1 INTRODUCTION.................................................................................................................1 2 CURRENT STRUCTURE OF TRADE BETWEEN SOUTH AFRICA AND INDIA ..2
2.1 AGGREGATE TRADE FLOWS................................................................................................2 2.2 TRADE FLOWS AT THE 22-CHAPTER LEVEL.........................................................................3 2.3 TRADE FLOWS AT THE HS4 LEVEL .....................................................................................5 2.4 TRADE INTENSITIES BETWEEN SOUTH AFRICA AND INDIA .................................................9 2.5 TARIFFS ON TRADE BETWEEN SOUTH AFRICA AND INDIA ................................................10
3 TRADE CREATION AND TRADE DIVERSION FOLLOWING A HYPOTHETICAL FTA BETWEEN SOUTH AFRICA AND INDIA.............................17
3.1 METHODOLOGY ...............................................................................................................17 3.2 THE DATA ........................................................................................................................18 3.3 TRADE CREATION AND DIVERSION RESULTS.....................................................................18 3.4 REVEALED COMPARATIVE ADVANTAGE AND REVEALED TRADE BARRIERS ......................24
4 CONCLUSIONS .................................................................................................................29 REFERENCES.......................................................................................................................30 APPENDIX 1: TRADE INTENSITY INDEX METHODOLOGY ..................................31 APPENDIX 2: TRADE CREATION AND TRADE DIVERSION METHODOLOGY 32
APPENDIX 3: REVEALED TRADE BARRIER METHODOLOGY.............................36 LIST OF TABLES TABLE 1: IMPORTS, EXPORTS AND TOTAL TRADE ......................................................3 TABLE 2: GROWTH AND PATTERNS OF SOUTH AFRICAN IMPORTS FROM, EXPORTS TO AND TOTAL TRADE WITH INDIA..............................................................3 TABLE 3: IMPORTS FROM INDIA AT THE FOUR-DIGIT HS CODE LEVEL FOR SELECTED COMMODITIES ..................................................................................................6 TABLE 4: EXPORTS TO INDIA AT THE 4-DIGIT HS CODE LEVEL FOR SELECTED COMMODITIES .......................................................................................................................7 TABLE 5: INTRA-INDUSTRY INDICES FOR SOUTH AFRICAN TRADE WITH INDIA AND THE REST OF THE WORLD, 2000 (R '000).................................................................8 TABLE 6: SOUTH AFRICAN IMPORTS AND IMPORT WEIGHTED AND UNWEIGHTED TARIFFS FOR 22 CHAPTERS (2000, RAND '000 and JULY 2000 RESPECTIVELY) ...................................................................................................................11 TABLE 7: SOUTH AFRICAN IMPORTS AND IMPORT WEIGHTED AND UNWEIGHTED TARIFFS FOR THE HS2 LEVEL OF COMMODITY AGGREGATION RANKED ACCORDING TO THE VALUE OF IMPORTS TARIFF (2000, R '000 and JULY 2000 RESPECTIVELY) ...............................................................................................12 TABLE 8: SOUTH AFRICAN IMPORTS AND IMPORT WEIGHTED AND UNWEIGHTED TARIFFS FOR THE HS2 LEVEL OF COMMODITY AGGREGATION RANKED ACCORDING TO THE UNWEIGHTED TARIFF (2000, R '000 and JULY 2000 RESPECTIVELY) ...................................................................................................................13 TABLE 9: SELECTED INDIAN IMPORTS AND IMPORT WEIGHTED TARIFFS (1998, RAND '000) .............................................................................................................................14
iii
TABLE 10: SELECTED INDIAN IMPORTS AND IMPORT WEIGHTED TARIFFS (1997, US$ '000) RANKED ACCORDING TO THE UNWEIGHTED TARIFF .............................15 TABLE 11: SELECTED INDIAN IMPORTS AND IMPORT WEIGHTED TARIFFS (1997, US$ '000) RANKED ACCORDING TO VALUE OF IMPORTS..........................................16 TABLE 12: ESTIMATED IMPORT PRICE ELASTICITIES USED IN THE TRADE CREATION CALCULATIONS..............................................................................................18 TABLE 13: POTENTIAL TRADE CREATION IN SOUTH AFRICA FOLLOWING A FTA WITH INDIA USING IMPORT PRICE ELASTICITIES OF TABLE 12, (R '000, 2000)....19 TABLE 14: POTENTIAL TRADE CREATION IN SOUTH AFRICA FOLLOWING A FTA WITH INDIA USING A UNIFORM IMPORT PRICE ELASTICITIES OF 1.56 (R '000, 2000) ........................................................................................................................................20 TABLE 15: POTENTIAL TRADE DIVERSION IN SOUTH AFRICA FOLLOWING A FTA WITH INDIA USING A UNIFORM SUBSTITUTION ELASTICITIES OF 1.5 (R '000, 2000) ...............................................................................................................................22 TABLE 16: POTENTIAL TRADE CREATION IN INDIA FOLLOWING A FTA WITH INDIA USING A UNIFORM IMPORT PRICE ELASTICITIES OF 1.5 (US$ '000, 1998) .23 TABLE 17: POTENTIAL TRADE DIVERSION IN INDIA ON IMPORTS FROM SOUTH AFRICA FOLLOWING A FTA USING A UNIFORM SUBSTITUTION ELASTICITIES OF 1.5 (US$ '000, 1998)..........................................................................................................24 TABLE 18: REVEAL COMPARATIVE ADVANTAGE FOR SOUTH AFRICA FOR SELECTED SITC2 COMMODITIES, 1998...........................................................................25 TABLE 19: REVEAL TRADE BARRIERS FOR SOUTH AFRICAN EXPORTS TO INDIA FOR SELECTED SITC2 COMMODITIES, 1998..................................................................26 TABLE 20: REVEAL COMPARATIVE ADVANTAGE FOR INDIA FOR SELECTED SITC2 COMMODITIES, 1998................................................................................................27 TABLE 21: REVEAL TRADE BARRIERS FOR INDIAN EXPORTS TO SOUTH AFRICA, 1998.........................................................................................................................28 LIST OF FIGURES FIGURE 1: GROWTH AND PATTERNS OF IMPORTS FROM AND EXPORTS TO INDIA FOR SELECTED SECTORS........................................................................................4 FIGURE 2: TRADE INTENSITIES BETWEEN SOUTH AFRICA AND INDIA..................9
iv
EXECUTIVE SUMMARY The aim of this report is to provide policy-makers at the Department of Trade and Industry (DTI) with a first round of identification of those commodities that feature prominently in the trade flows between South Africa and India. These commodities will be of special interest to trade negotiators regarding a potential free trade area (FTA) with India. We start with a descriptive analysis of imports, exports and total trade (the sum of imports and exports) between South Africa and India. The descriptive analysis is based on annual trade flow data from Customs and Excise at current prices and covers the period from 1991 to 2000. This is followed by a short comment on the trade intensities based on UNComTrade data and tariff structures on trade between the two countries. We then turn our attention to estimating the impact of the proposed FTA between South Africa and India on the economies of the two countries. Simulations are conducted with a static, partial equilibrium methodology, based on the trade creation and trade diversion principles. Following a hypothetical free trade arrangement between South Africa and India, the following changes in trade flows between the two countries and third countries can, amongst others, be distinguished: Trade creation, which measures the increase in South African imports from India due to a
decrease in the relative price of these imports vis-à-vis domestically produced goods, resulting in a net increase in South Africa’s total imports and a net decrease in South Africa's domestic production; and
Trade diversion, which measures the increase in South African imports from India due to a decrease in the relative price of these imports vis-à-vis imports from other countries, resulting in a different geographical composition of imports, whereby imports from India increase at the expense of imports from other sources, with no change in total South African imports.
Trade creation is considered to be welfare enhancing since relatively high-cost domestic production is replaced with lower-cost imports from India. Nevertheless, South Africa has to face the decline of local, albeit less efficient, production. Trade diversion is considered to be welfare lowering in that South Africa switches its source of imports from a more efficiently producing country to a less efficiently producing country, leading to a less efficient allocation of resources, although the total import bill remains unchanged. The methodology employed here is relatively simple, with low data requirements, and can be used to evaluate the impact of changing tariff levels on trade patterns at a disaggregated commodity level. Finally, we consider the concept of revealed trade barriers (RTB). With regard to Indian imports, the question is: To what degree is the share of imports of a particular South African product in the total import basket of India larger or smaller than the share of total imports of that product in India’s total imports (summed over all products)? In other words: Is the import of a particular South African commodity more or less important compared to total Indian imports of that commodity from all sources? If the latter is the case, we may conclude that South Africa is exporting a commodity relatively more to the rest of the world than it is to India, possibly due to trade barriers in India. In terms of trade flows, South Africa has developed a trade surplus with India, importing to the value of about R1.8 billion and exporting about R3 billion in 2000. South African imports
v
from India are concentrated in textiles and clothing, raw hides and leather, and vegetable products, while exports to India are more diversified with contributions made by mineral products, chemicals, base metals, textiles, and pulp and paper. The tariff structure on imports from India shows an estimated unweighted average tariff of about 12%. Particularly high rates are imposed on textiles and clothing, footwear and raw hides, skins and leather products with 27%, 24% and 16% unweighted average rates respectively. All other groups of commodities, at least at the 22-chapter level, are treated with an average rate of around 10% or less. On the other side of the bilateral trade flows, South African exports to India are faced with an unweighted average tariff of 24%. Of particular concern to South African trade negotiators are broad commodities such as motor vehicles and machinery, which are challenged with duties of 40% on average. About 25% of South African exports to India are in precious stones and metals, mainly for jewellery. Although these exports are also faced with relatively high tariffs, their import price elasticity is probably very low. Of considerable interest to policy-makers is the potential for intra-industry trade. Identification of commodities with high intra-industry trade indices in trade with India – relative to trade with the rest of the world – would greatly facilitate negotiations as both parties are expected to benefit from free trade on such commodities. It should be noted that the intra-industry trade indices only become relevant at a relatively high level of disaggregation and we can only present results with regard to South Africa's trade. The results of this component of the analysis suggest considerable intra-industry trade for basic fabricated metals, precious stones and metals for jewellery, and some non-metallic minerals commodity groups. Turning to our partial equilibrium impact model, the results of the trade creation/diversion analysis suggest that in trade negotiations between South Africa and India, the former will focus on the textiles, clothing, leather, and electrical machinery commodities. It is in these product groups that imports from India are expected to make some inroads in terms of replacing domestic production. Also, with zero tariffs on Indian imports, these commodities will be subject to considerable trade diversion. In other words, imports of these commodities that are currently sourced from other countries will be replaced by imports from India. Commodities such as food products, metals products and heavy machinery require less attention as far as trade creation and trade diversion in South Africa is concerned. From India's point of view, a potential FTA with South Africa could raise concerns of trade creation and trade diversion for precious metals for jewellery, coal, iron and steel, basic chemicals, machinery and some non-metallic minerals products. The RTB analysis shows that Indian exports of textiles and clothing, as well as footwear and wood products, are overtraded in the South African market, i.e., South African imports of these groups of commodities are sourced relatively more from India than other countries. This suggests that there is no RTB for these commodity groups. On the other hand, a large range of Indian commodities with small trade volumes is relatively undertraded in South Africa, which suggests, in terms of the revealed trade barrier yardstick, a broad approach by Indian trade negotiators. The same applies to South African exports to India. Commodities with large trade volumes are overrepresented in the Indian market, compared to the average basket of Indian imports, including coal, iron and steel, pulp and paper and motor vehicles. Interestingly, this occurs in spite of relatively high trade barriers.
vi
1
1 INTRODUCTION Many developing countries have been unwilling participants in multilateral trade liberalisation agreements. South Africa is not one of these. South Africa successfully participated in the Uruguay Round of the then General Agreement on Tariffs and Trade (GATT), has concluded a development and co-operation agreement (including a free trade agreement) with the European Union (EU), and recently sealed a free trade agreement with the Southern African Development Community (SADC). South Africa’s interest with free trade matters is based on a realistic assessment of the growth potential of its domestic market. In recent years, it has shown some potential for strong growth but has generally fallen short of the levels of growth required to substantially reduce chronically high unemployment levels. The South African government is thus employing a strategy of limited domestic consumption stimulation, through, for example, the reduction of middle-class tax levels, and a sharply focused export-oriented growth strategy. Thus, the agreements with the EU and SADC encourage South African manufacturers to specialise in those industries in which they have a degree of competitiveness and encourage investment in South Africa by companies wishing to produce goods for export to the EU and SADC. Moreover, the agreements provide South Africa with a degree of power to leverage trade concessions from third countries fearful of the diversion of their trade with South Africa to the EU or SADC partners and vice versa. It is within this context that the issue of a FTA with India arises. India has in recent years come to play an increasingly important role in multilateral fora such as the WTO and as a relatively large and strongly growing economy, is an important developing country ally for South Africa. The aim of this report is to provide policy-makers at the DTI with a first round of identification of those commodities that feature prominently in the trade flows between South Africa and India. These commodities will be of special interest to trade negotiators regarding a potential free trade area with India. We use a relatively simple partial equilibrium analytical framework, although we lack South Africa specific data for some variables and use SACU trade data as a proxy for South African trade data, ignoring the potential future existence of FTAs between South Africa and other partners. We start with a descriptive analysis of trade flows and tariffs between South Africa and India, which includes a view on the total market for merchandise imports in India and a measure of changes in trade patterns between the two countries. We continue with an analysis of potential trade creation and trade diversion, which is based on a methodology derived from UNCTAD and previously applied to examine South Africa – EU trade creation and diversion (Jachia and Teljeur 1998). Since trade creation effects are not relevant to products that are currently not traded, we also present results of a special application of the theory of revealed comparative advantage for the identification of de facto barriers to trade between the two countries. According to Jachia and Teljeur, this information may prove useful during the negotiations for any free trade agreement, as the main “offensive interest”, i.e. important tariff lines that the negotiators should target as valuable inclusion in the tariff phase-down schedule, need to be identified. We conclude with a summary.
2
2 CURRENT STRUCTURE OF TRADE BETWEEN SOUTH AFRICA AND INDIA We start with an aggregate view on imports, exports and total trade (the sum of imports and exports) between South Africa and India, followed by an analysis at increasingly more disaggregated commodity levels. The analysis is based on annual data from Customs and Excise at current prices and covers the period from 1991 to 2000. We continue with a short comment on the tariff structure on trade between South Africa and India and conclude this section by focusing on trade intensities between the two countries. 2.1 Aggregate trade flows Table 1, row 1 shows that South African imports from India for the period 1991–2000 increased from R82 million to R1.8 billion in current prices. This constitutes a weighted average annual increase of 46% in nominal terms. Total imports (from all sources) by South Africa increased by 17% over the same period as shown in row 4, the share of India imports in Total South African imports therefore increased significantly, from 0.2% in 1989 to 1% in 1998. In the last two years of the period of observation, it can be seen that imports dropped in 1999, presumably due to the financial crises, but subsequently picked up again during 2000. Exports from South Africa to India increased from R21 million in 1991 to R3 billion in 2000, which translates to a 78% annual average growth rate over the period. During this period, South African total exports grew by 15% per annum while the share of India’s exports in total South African exports grew from 0.1% to 1.4%. Row 11 shows the trade balance between South Africa and India, which was initially in favour of India except for the years 1994 and 1995. However, during the last two years, the balance has swung South Africa's way. Rows 12-16 present the analysis of total trade defined as the sum of imports and exports. South African total trade has been increasing at an average annual rate of 16%, as shown in row 15. Growth in trade between the two countries has been increasing at an average of 57% per annum, while the share of South Africa-India trade in South Africa's total trade increased from 0.1% to 1.2% over the period under review.
1. South African Imports from India (Rm current pr)
82 110 165 406 711 1,112 1,561 1,705 1,566 1,765
2. Growth 32.8% 50.4% 146.4% 75.0% 56.5% 40.3% 9.2% -8.1% 12.7% 45.9%3. South African Imports Total (Rm current pr) 45,850 52,569 58,987 71,059 100,241 115,984 129,834 147,454 149,642 184,1314. Growth 14.7% 12.2% 20.5% 41.1% 15.7% 11.9% 13.6% 1.5% 23.0% 17.3%5. Indian share of South African imports 0.2% 0.2% 0.3% 0.6% 0.7% 1.0% 1.2% 1.2% 1.0% 1.0% 6. South African Export to India (Rm current pr) 21 21 94 491 707 1,072 1,339 1,628 2,365 2,9507. Growth 0.4% 341.2% 420.5% 43.9% 51.6% 24.9% 21.5% 45.3% 24.8% 77.8%8. South African Exports Total (Rm current pr) 62,011 69,253 80,608 59,552 92,861 124,736 137,339 153,374 174,597 213,0039. Growth 11.7% 16.4% -26.1% 55.9% 34.3% 10.1% 11.7% 13.8% 22.0% 15.4%10. Indian share of South African exports 0.0% 0.0% 0.1% 0.8% 0.8% 0.9% 1.0% 1.1% 1.4% 1.4% 11. Trade Balance South Africa - India (Rm current
pr) -61 -88 -70 86 -3 -40 -222 -77 798 1,186 12. 13. South African Trade with India (Rm current pr) 104 131 259 897 1,418 2,185 2,900 3,332 3,931 4,71514. Growth 26.2% 97.9% 246.3% 58.0% 54.1% 32.8% 14.9% 18.0% 19.9% 57.4%15. South African Total Trade (Rm current pr) 107,861 121,822 139,596 130,611 193,101 240,720 267,173 300,828 324,239 397,13416. Growth 12.9% 14.6% -6.4% 47.8% 24.7% 11.0% 12.6% 7.8% 22.5% 16.2%17. Indian share of South African trade 0.1% 0.1% 0.2% 0.7% 0.7% 0.9% 1.1% 1.1% 1.2% 1.2%Source: Customs and Excise
2.2 Trade flows at the 22-chapter level Table 2 shows nominal growth in imports and exports as well as the change in the patterns of trade at a slightly disaggregated level of 22 commodity chapters. Table 2: Growth and patterns of South African imports from, exports to and total trade with India # Chapter Imports Exports Total
Source: Customs and Excise and own calculations The first three columns of Table 2 show imports from India for the last five years. In the first column, growth rates vary between -19% and 80%. The products with the highest growth rates are precious metals with 80%, followed by mineral products with 59.7%, and animal or vegetable oils and fats with 41%. The second and third columns measure the composition of imports for the first and second half of the 1990s. Textiles, fabrics and clothing show a decline in the second half of the 1990s from 30% to 20% and hides, skins and leather from
4
14% to 8%, while vegetable products show an increase from 10% to 17% and chemical products from 9% to 13%. Commodities exported to India that show very high average growth from 1996-2000 are footwear, animal and vegetable fats and oils, precious metals, articles of stones, asbestos, ceramic glass, chemical products and mineral products. During the second half of the 1990s, exports to India were dominated by chemical products, basic metals and mineral products. Over the period of observation, these commodity groups accounted for about 70% of South Africa's export basket to India. Paper and pulp, precious metals, and textiles and clothing account for 7%, 3% and 2% respectively. Compared to the first half of the 1990s, the biggest gains in share have been made by mineral products (coal), followed by chemical products and precious metals, while paper and pulp and textiles and clothing have lost share. A summary of these findings is shown in the figures below. Figures 1 and 2 rank those commodities with above average growth in imports from and exports to India for the period 1996-2000. Figures 3 and 4 show the proportional contribution to imports from and exports to India over the same period. Figure 1: Growth and patterns of imports from and exports to India for selected sectors
Source: Customs and Excise and own calculations Broadly, the trade pattern between the two countries suggests that South Africa imports foodstuffs and textiles, and exports resource-based goods to India. Considerable inter-
Above average growth in imports f rom India (annual ave 996-2000)
industry trade is taking place in the chemicals group, although it should be noted that our analysis at this stage is undertaken at a rather aggregate level. 2.3 Trade flows at the HS4 level Table 3 shows in more detail commodities that make a relatively high contribution to South Africa's import basket from India. Growth rates have been calculated over the period 1996-2000 and growth rates for commodities with zero import in any of these years have not been calculated. It can be seen that quite a number of high value HS4 commodity groups have shown growth that is higher than the average of 46% (see row 2 of Table 1), except some of the leather commodities. Note the appearance of (processed) diamonds (row 8) and some basic iron and steel (row 17) products.
6
Table 3: Imports from India at the four-digit HS code level for selected commodities HS4 code Description Imports
2000 % of total SA imports from India2000
Growth rate in imports from India 1996-2000
% of SA imports in commodity 2000
1. 1006 Rice. 139,066,362 7.9% 45.6% 14.6% 2. 4104 Leather of bovine or equine animals, without hair on, other than leather of head 88,380,347 5.0% 4.8% 19.7% 3. 3004 Medicaments (excluding goods of heading no.30.02, 30.05 or 30.06) consisting of 73,816,612 4.2% 173.0% 2.1% 4. 6205 Men's or boys' shirts. 50,481,258 2.9% 58.5% 33.6% 5. 6403 Footwear with outer soles of rubber, plastics, leather or composition leather an 41,340,092 2.3% 16.4% 7.5% 6. 3808 Insecticides, rodenticides, fungicides, herbicides, anti-sprouting products and 39,915,372 2.3% 78.4% 5.6% 7. 3204 Synthetic organic colouring matter, whether or not chemically defined; preparati 32,973,683 1.9% 35.2% 7.0% 8. 7102 Diamonds, whether or not worked, but not mounted or set. 32,457,804 1.8% 1438.2% 1.0% 9. 6302 Bed linen, table linen, toilet linen and kitchen linen. 26,526,351 1.5% 16.2% 27.2% 10. 4106 Goat or kid skin leather, without hair on, (excluding than leather of headi 41.0 24,301,947 1.4% 7.6% 75.9% 11. 0306 Crustaceans, whether in shell or not, live, fresh, chilled frozen, dried, salted 24,241,576 1.4% 47.4% 28.6% 12. 5208 Woven fabrics of cotton, containing 85 % or more by mass of cotton, of a mass of 23,885,711 1.4% 5.8% 16.0% 13. 6206 Women's or girls' blouses, shirts and shirt-blouses. 22,930,362 1.3% 17.0% 31.8% 14. 6204 Women's or girls' suits, ensembles, jackets blazers, dresses, skirts, divided sk 22,253,518 1.3% 1.9% 16.0% 15. 9801 Original equipment components: 21,538,201 1.2% 67.9% 0.1% 16. 5509 Yarn (excluding sewing thread) of synthetic staple fibres, not put up for retail 19,658,103 1.1% -13.0% 24.1% 17. 8481 Taps, cocks, valves and similar appliances for pipes, boiler shells, tanks, vats 19,514,724 1.1% 37.5% 2.4% 18. 7210 Flat-rolled products of iron or non-alloy steel, of a width of 600 mm or more, c 17,161,354 1.0% 179.8% 6.5% 19. 0910 Ginger, saffron, turmeric (curcuma), thyme, bay leaves, curry and other spices. 16,472,286 0.9% 29.3% 55.5% 20. 8409 Parts suitable for use solely or principally with the engines of heading no. 84. 16,094,995 0.9% 38.2% 2.4% 21. 9506 Articles and equipment for general physical exercise, gymnastics, athletics othe 15,916,832 0.9% 14.5% 4.6% 22. 8708 Parts and accessories of the motor vehicles of headings nos.87.01 to 87.05. 15,277,937 0.9% 12.6% 0.7% 23. 6406 Parts of footwear (including uppers whether or not attached to soles (excluding 13,920,685 0.8% 88.4% 13.5% 24. 8536 Electrical apparatus for switching or protecting electrical circuits or for maki 13,790,368 0.8% 24.4% 1.2% 25. 1302 Vegetable saps and extracts; pectic substances, pectinates and pectates; agar-ag 13,106,255 0.7% 40.1% 12.5% 26. 7222 Other bars and rods of stainless steel; angles, shapes and sections of stainless 12,877,971 0.7% 11.7% 16.3% 27. 6211 Track suits, ski suits and swimwear; other garments. 12,313,730 0.7% 18.5% 32.1% 28. 7323 Table, kitchen or other household articles and parts thereof, of iron or steel; 12,302,466 0.7% 37.0% 12.4% 29. 0909 Seeds of anise, badian, fennel, coriander, cumin, caraway or juniper berries. 11,689,986 0.7% 25.0% 48.0% 30. 8455 Metal-rolling mills and rolls therefor. 11,435,478 0.6% 21.5% 5.7% 31. 2916 Unsaturated acyclic monocarboxylic acids, cyclic monocarboxylic acids, their anh 11,276,902 0.6% -34.9% 4.4% 32. 7208 Flat-rolled products of iron or non- alloy steel, of a width of 600 mm or more, 11,198,551 0.6% na na 33. 8540 Thermionic, cold cathode or photo- cathode valves and tubes (for example, vacuum 11,069,861 0.6% 9.1% 4.9% 34. 6109 T-shirts, singlets and other vests, knitted or crocheted. 10,947,072 0.6% 49.8% 13.7% 35. 5702 Carpets and other textile floor coverings, woven, not tufted or flocked, whether 10,823,668 0.6% 19.2% 29.0% 36. 1512 Sunflower-seed, safflower or cotton-seed oil and fractions thereof, whether or n 10,800,271 0.6% na na 37. 4202 Trunks, suitcases, vanity-cases, executive-cases, brief-cases, school satchels, 10,658,003 0.6% 30.3% 3.9% 38. 5007 Woven fabrics of silk or of silk waste. 10,549,946 0.6% 15.1% 44.2% 39. 2610 Chromium ores and concentrates. 10,071,265 0.6% na na 40. 6802 Worked monumental or building stone (excl. slate) and articles thereof (excl. go 9,682,217 0.5% 53.1% 12.7% 41. 3907 Polyacetals, other polyethers and epoxide resins, in primary forms; polycarbonat 9,616,204 0.5% 102.1% 1.6% 42. 8306 Bells, gongs and the like, non-electric, of base metal; statuettes and other orn 9,363,909 0.5% 28.4% 30.5% 43. 6307 Other made up articles, including dress patterns. 9,270,410 0.5% 24.7% 13.0% 44. 5515 Other woven fabrics of synthetic staple fibres. 9,212,703 0.5% 16.5% 8.3% 45. 8302 Base metal mountings, fittings and similar articles suitable for furniture, door 8,910,030 0.5% 15.6% 4.8% 46. 5205 Cotton yarn (excluding sewing thread), containing 85 % or more by mass of cotton 8,905,841 0.5% 52.3% 17.8% 47. 3920 Other plates, sheets, film, foil and strip, of plastics, non-cellular and not re 8,171,515 0.5% -1.3% 1.5% 48.
49. 8539 Electric filament or discharge lamps, including sealed beam lamp units and ultra 7,925,136 0.4% 31.5% 2.5% 50. 4010 Conveyor or transmission belts or belting, of vulcanised rubber. 7,844,788 0.4% 121.1% 5.4%
Source: Customs and Excise and own calculations In the last table of this section, we show the same kind of information for South African exports to India. The top HS4 commodities are all part of the minerals, basic metals and chemicals groups. With an average growth of 78% per annum, it can be seen that only a few of the top 50 HS4 commodities are displaying relatively high growth in exports to India. Exceptions are uncoated paper and paper board (see row 12), some chemical products (see rows 14 and 22), asbestos (row 25), complete building structures (see row 29) and diamonds (row 30). The latter suggests evidence of inter-industry trade in the relatively narrow HS4 commodity group of processed diamonds, with presumably some cutting and processing of South African and Botswana diamonds taking place in India.
7
Table 4: Exports to India at the 4-digit HS code level for selected commodities HS4 code Description Imports
2000 % of total SA exports 2000
Growth rate 1996-2000
% of SA exports in commodity 2000
1. 2809 Diphosphorus pentaoxide; phosphoric acid and polyphosphoric acids. 719,741,865 24.6% 41.0% 95.5% 2. 2701 Coal; briquettes, ovoids and similar solid fuels manufactured from coal. 507,433,481 17.4% 46.9% 5.5% 3. 9999 Not elsewhere classified 375,486,461 12.9% na na 4. 4702 Chemical wood pulp, dissolving grades. 227,501,920 7.8% 46.5% 9.3% 5. 7208 Flat-rolled products of iron or non- alloy steel, of a width of 600 mm or more, 182,375,865 6.2% 57.0% 9.4% 6. 2835 Phosphinates (hypophosphites), phospho- nates (phosphites), phosphates and polyp 87,082,555 3.0% 61.0% 20.3% 7. 7108 Gold (including gold plated with platinum) unwrought or in semi- manufactured fo 69,250,096 2.4% na na 8. 3603 Safety fuses; detonating fuses; percussion or detonating caps; igniters; electri 60,225,048 2.1% na na 9. 2914 Ketones and quinones, whether or not with other oxygen function, and their halog 49,588,753 1.7% 15.4% 9.1% 10. 8407 Spark-ignition reciprocating or rotary internal combustion piston engines. 46,661,403 1.6% na na 11. 7204 Ferrous waste and scrap; remelting scrap ingots of iron or steel. 39,690,292 1.4% 17.5% 19.6% 12. 4802 Uncoated paper and paperboard, of a kind used for writing, printing or other gra 37,650,234 1.3% 239.0% 6.2% 13. 7202 Ferro-alloys. 34,627,599 1.2% -0.8% 0.4% 14. 2712 Petroleum jelly; paraffin wax, micro- crystalline petroleum wax, slack wax, ozok 26,134,398 0.9% 247.1% 4.9% 15. 7601 Unwrought aluminium. 26,046,464 0.9% -34.2% 0.5% 16. 7106 Silver (including silver plated with gold or platinum), unwrought or in semi-man 20,294,914 0.7% na na 17. 7210 Flat-rolled products of iron or non-alloy steel, of a width of 600 mm or more, c 20,156,418 0.7% 24.1% 2.1% 18. 8421 Centrifuges, including centrifugal dryers; filtering or purifying machinery and 17,893,666 0.6% 25.1% 0.4% 19. 8002 Tin waste and scrap. 16,704,132 0.6% na na 20. 7219 Flat-rolled products of stainless steel, of a width of 600 mm or more. 15,879,318 0.5% -13.2% 0.5% 21. 7224 Other alloy steel in ingots or other primary forms; semi-finished products of ot 15,403,164 0.5% na na 22. 2905 Acyclic alcohols and their halogenated, sulphonated, nitrated or nitrosated deri 15,239,863 0.5% 90.5% 6.1% 23. 7209 Flat-rolled products of iron or non-alloy steel, of a width of 600 mm or more, c 14,690,010 0.5% 51.7% 3.6% 24. 7207 Semi-finished products of iron or non- alloy steel. 13,739,586 0.5% 76.6% 2.8% 25. 2524 Asbestos. 13,610,471 0.5% 79.7% 21.3% 26. 2710 Petroleum oils and oils obtained from bituminous minerals, other than crude; pre 13,602,385 0.5% 28.3% 0.2% 27. 5402 Synthetic filament yarn (excluding sewing thread), not put up for retail sale, i 12,655,585 0.4% 33.1% 3.6% 28. 2707 Oils and other products of the distillation of high temperature coal tar; simila 9,385,550 0.3% 17.9% 4.8% 29. 7308 Structures (excl. prefabricated buildings of heading no. 94.06) and parts of struc 8,972,631 0.3% 782.7% 1.1% 30. 7102 Diamonds, whether or not worked, but not mounted or set. 8,057,379 0.3% 145.2% 0.1% 31. 4804 Uncoated kraft paper and paperboard, in rolls or sheets, other than that of head 8,056,000 0.3% na na 32. 7602 Aluminium waste and scrap. 7,808,201 0.3% 56.3% 4.2% 33. 4801 Newsprint, in rolls or sheets. 7,271,493 0.2% -11.9% 1.8% 34. 5503 Synthetic staple fibres, not carded, combed or otherwise processed for spinning. 7,083,363 0.2% 37.2% 7.3% 35. 4403 Wood in the rough, whether or not stripped of bark or sapwood, or roughly square 6,598,339 0.2% 8.9% 5.0% 36. 3812 Prepared rubber accelerators; compound plasticisers for rubber or plastics, n.e. 6,374,026 0.2% na na 37. 7304 Tubes, pipes and hollow profiles, seamless, of iron (excluding cast iron) or ste 6,244,317 0.2% 73.4% 2.6% 38. 7404 Copper waste and scrap. 6,107,605 0.2% 3.7% 2.0% 39. 8207 Interchangeable tools for hand tools whether or not power-operated or for machin 4,938,687 0.2% -41.7% 1.7% 40. 7902 Zinc waste and scrap. 4,936,461 0.2% 71.6% 56.2% 41. 8542 Electronic integrated circuits and microassemblies. 4,808,800 0.2% 111.2% 3.9% 42. 8609 Containers (including containers for the transport of fluids) specially designed 4,771,590 0.2% -19.0% 0.2% 43. 5201 Cotton, not carded or combed. 4,414,218 0.2% na na 44. 5102 Fine or coarse animal hair, not carded or combed. 4,365,940 0.1% -28.0% 6.9% 45. 2907 Phenols; phenol-alcohols. 4,215,759 0.1% -12.6% 2.9% 46. 4819 Cartons, boxes, cases, bags and other packing containers, of paper, paperboard, 4,032,942 0.1% 130.5% 2.0% 47. 7216 Angles, shapes and sections of iron or non-alloy steel. 4,011,816 0.1% -19.0% 0.4% 48. 4002 Synthetic rubber and factice derived from oils, in primary forms or in plates, s 3,651,778 0.1% 24.6% 3.1% 49. 2833 Sulphates; alums; peroxosulphates (persulphates). 3,241,878 0.1% na na 50. 7201 Pig iron and spiegeleisen in pigs, blocks or other primary forms. 2,986,059 0.1% -1.9% 0.6%
Source: Customs and Excise and own calculations 2.4 Intra-industry Trade between South Africa and India Of considerable interest to policy-makers is the potential for intra-industry trade. Identification of commodities with high intra-industry trade indices in trade with India relative to trade with the rest of the world would greatly facilitate negotiations, as both parties are expected to benefit from free trade on such commodities. The intra-industry trade index is the difference between total trade and the absolute value of net trade divided by total trade of a commodity. It should be noted that the intra-industry trade index only becomes relevant at a relatively high level of disaggregation and we can only present results with regard to South Africa’s trade.
8
Table 5: Intra-industry indices for South African trade with India and the rest of the world, 2000 (R '000)
HS4 HS4 Description Exports to India Total export Imports
from India Total Imports
Intra-industry
trade index
for trade with India
Intra-industry
trade index
for trade with RoW
IIT India/
IIT total exports
1. 3923 Articles for the conveyance or packing of goods, o…. 1,034,480 276,879,651 2,101,901 287,450,210 0.66 0.02 38.96
2. 8607 Parts of railway or tramway locomotives or rolling…. 869,910 65,358,795 476,787 62,646,669 0.71 0.02 38.67
43. 9608 Ball point pens; felt tipped and other porous-tipp…. 2,100,000 27,392,189 1,914,915 137,936,661 0.95 0.69 1.39
44. 4911 Other printed matter, including printed pictures a…. 136,229 57,373,550 490,665 110,516,234 0.43 0.32 1.38
45. 8538 Parts suitable for use solely or principally with …. 1,304,118 64,405,632 968,002 279,510,683 0.85 0.63 1.35
46. 6812 Fabricated asbestos fibres; mixtures with a basis …. 20,794 18,478,056 61,430 8,424,998 0.51 0.38 1.34
47. 7020 Other articles of glass. 2,195 16,128,019 11,855 9,948,886 0.31 0.24 1.32
48. 9030 Oscilloscopes, spectrum analysers and other instru…. 1,571,409 60,491,005 1,040,208 247,619,847 0.80 0.61 1.30
49. 4407 Wood sawn or chipped lengthwise, sliced or peeled,…. 351,030 104,419,752 255,503 506,116,885 0.84 0.66 1.28
50. 8501 Electric motors and generators (excluding generati…. 1,796,264 99,677,568 2,948,924 398,027,429 0.76 0.60 1.26
Source: Customs & Excise and own calculations
For those commodity groups where an IIT for trade between India and SA can be calculated, a comparison with the IIT on trade between the RoW and SA is drawn by taking the ration of the two. The results of this component of the analysis suggest considerable intraindustry trade
9
exists for a wide range of HS4 product groups. Most notable are a number of groups associated to motor vehicles, accessories and tyres. Otherwise, no particular pattern emerges here with a few metal products and machinery and equipment represented as well as the odd clothing group. 2.5 Trade intensities between South Africa and India In the previous section we looked at trade patterns between South Africa and India. However, it is also important to evaluate bilateral trade in relation to the respective country’s exports to the rest of the world. Although this has to some degree been achieved, we examine in this section the effects of changes in trade patterns between South Africa and India by calculating import and export intensity. These measures are determined for SACU in relation to India for the period 1990-1998. The import intensity index is an index of intensity of India’s (South Africa’s) export trade with South Africa (India) relative to its exports to the rest of the world. It can be noted that: • If the value of the index is greater than 1: This indicates a greater intensity in the bilateral
trading relationship between South Africa and India relative to the latter's trade with the rest of the world.
• If the value of the index is equal to 1: Trade is not geographically biased, and bilateral relations between the two countries are the same as their trade with the world.
• If the value of the index is less than 1: This indicates relatively low intensities in bilateral trade between the two countries.
As a data source, we use UNComTrade data published by Statistics Canada as part of their World Trade Analyser system. The results are shown in the next figure. Figure 2: Trade intensities between South Africa and India
0.00
0.50
1.00
1.50
2.00
2.50
3.00
1990 1991 1992 1993 1994 1995 1996 1997 1998
Import Intensity Export Intensity Source: own calculations
10
It can be seen that since 1994, trade between South Africa and India is more intense relative to trade of either country with the rest of the world. The slight decline in the intensities of the very last year may be because of the Asian crisis. 2.6 Tariffs on trade between South Africa and India We continue this section with a short comment on the tariff structure on trade between South Africa and India. With regard to South African imports from India and the MFN-applied tariffs, we make use of Customs and Excise data for the trade flows at the HS8 level. As is discussed elsewhere, a small part of South Africa's imports face non-ad valorem duties. For South Africa's total import basket, this is not more than 4.5%. However, due to the composition of imports from India, the proportion of non-ad valorem imports is almost 17%. Given that total imports from India are about R1.8 billion, non-ad valorem imports are almost R300 million. Most of these imports take place in the textiles and clothing commodity groups and because the fraction of non-ad valorem imports of total imports is relatively high, we have decided to convert them to ad valorem equivalents. For a more detailed outline of the conversion methodology see van Seventer (2001). Further aggregation to the HS4, HS2 and 22-chapter level is possible in an unweighted fashion or using import weights. South Africa's imports from India, their share in total imports from India, the unweighted and import weighted tariffs on the imports from India and from the rest of the world are shown in the next table. In the top row it can be seen that total imports from India mounted to about R1.8 billion in 2000. The import-weighted tariff on imports from India is 12%. Taking simple averages across the HS8 commodity lines for which South Africa is importing from India, we calculate 11%.
11
Table 6: South African imports and import weighted and unweighted tariffs for 22 chapters (2000, Rand '000 and July 2000 respectively) CH22
code CH22 Descriptions
Imports from India (R '000)
Share of total South African imports
Unweigh-ted tariffs on imports from India
Import weighted tariffs on imports from India
Total/average 1,764,805 100.0% 10.6% 12.1% 1. 01 Live animals; animal products 31,415 1.8% 0.3% 3.6% 2. 02 Vegetable products 215,485 12.2% 1.3% 6.6% 3. 03 Animal or vegetable fats and oils and their cleavage 22,189 1.3% 0.5% 4.2% 4. 04 Prepared foodstuffs; beverages, spirits and vinegar; tobacco etc 13,722 0.8% 11.1% 13.8% 5. 05 Mineral products 20,155 1.1% 0.1% 1.9% 6. 06 Products of the chemical or allied industries 290,793 16.5% 2.1% 2.9% 7. 07 Plastics and articles thereof; rubber and articles thereof 64,561 3.7% 10.7% 10.7% 8. 08 Raw hides and skins, leather, furskins and articles 132,701 7.5% 6.3% 15.7% 9. 09 Wood and articles of wood; wood charcoal; cork and articles 4,375 0.2% 18.0% 9.7%
10. 10 Pulp of wood or of other fibrous cellulosic material; waste and scrap of paper etc 12,727 0.7% 6.3% 9.0%
14. 14 Natural or cultured pearls, precious or semi-precious stones, precious metals etc 39,315 2.2% 3.0% 12.6%
15. 15 Base metals and articles of base metal 174,942 9.9% 7.7% 7.6% 16. 16 Machinery and mechanical appliances; electrical equipment; parts thereof 199,618 11.3% 7.0% 4.2% 17. 17 Vehicles, aircraft, vessels and associated transport equipment 34,373 1.9% 11.5% 11.1%
19. 20 Miscellaneous manufactured articles 38,998 2.2% 6.1% 10.7% 20. 21 Works of art, collectors' pieces and antiques 762 0.0% 0.0% 0.0% 21. 22 Other unclassified goods and balance of payments adjustments 3,484 0.2% 0.0% 0.0%
Source: Customs and Excise, DTI and own calculations, note: only ad valorem tariffs are considered Relatively high tariffs are imposed on textiles and footwear (see rows 11 and 12). Textiles also represent a high value in this particular aggregation scheme. Another large cluster of commodities is vegetable products (see row 2), chemical products (see row 6), and basic metals (row 15), the imports of which are faced with relatively low tariffs. The next table shows the same results at the HS2 level with imports and their respective import weighted and unweighted tariffs for the first 50 lines, ranked according to the unweighted tariff level. As before, high unweighted tariffs are imposed on textile and clothing imports. Relatively low tariffs are levied on imports of electrical machinery (see row 46) and metal products (see rows 43 and 44). If we rank the imports at the HS2 level according the value of imports, it can be seen that on the largest HS2 group, which is cereals, there are no tariffs. Other HS2 commodity groups with a relatively high value of imports from India and low duties are hides, skins and leather, machinery, electrical machinery, pharmaceutical products and organic chemicals. Textiles, clothing and footwear are typically the HS2 commodity groups with a relatively high value that is faced with a relatively high tariff (see rows 2, 8, 13, 14, 18, 27 and 28).
12
Table 7: South African imports and import weighted and unweighted tariffs for the HS2 level of commodity aggregation ranked according to the value of imports tariff (2000, R '000 and July 2000 respectively) HS2
code HS2 descriptions
Imports from India (R '000)
Share of total South African imports
Import weighted tariffs on imports from India
Unweigh-ted tariffs on imports from India
Total / average 1,764,805 100.0% 10.6% 12.1% 1. 10 Cereals 139,066 7.9% 0.0% 0.0% 2. 62 Articles of apparel and clothing accessories, not knitted or crocheted 120,340 6.8% 38.5% 38.5% 3. 41 Raw hides and skins (excluding furskins) and leather 113,385 6.4% 2.6% 4.7% 4. 84 Nuclear reactors, boilers, machinery and mechanical appliances; parts thereof. 110,055 6.2% 4.6% 3.0% 5.
85 Electrical machinery and equipment and parts thereof; sound recorders and reproducers, television im…. 89,563 5.1% 9.9% 5.7%
6. 30 Pharmaceutical products. 78,306 4.4% 0.6% 1.3% 7. 29 Organic chemicals. 74,411 4.2% 0.8% 1.0% 8. 64 Footwear, gaiters and the like; parts of such articles 56,673 3.2% 27.5% 25.3% 9. 73 Articles of iron or steel. 55,172 3.1% 10.5% 6.1% 10. 72 Iron and steel. 54,703 3.1% 3.3% 3.2% 11. 38 Miscellaneous chemical products. 47,600 2.7% 6.5% 3.2% 12. 32 Tanning or dyeing extracts, tannins and their derivatives; dyes, pigments and other colouring matter…. 42,963 2.4% 0.1% 1.9% 13. 63 Other made up textile articles; sets; worn clothing and worn textile articles; rags 42,371 2.4% 36.8% 33.5% 14. 52 Cotton 39,458 2.2% 22.0% 22.0% 15. 71 Natural or cultured pearls, precious or semi-precious stones, precious metals, metals clad with prec…. 39,315 2.2% 3.0% 12.6% 16. 09 Coffee, tea, mate and spices 38,792 2.2% 4.3% 4.2% 17. 39 Plastics and articles thereof. 37,972 2.2% 10.2% 10.1% 18. 55 Man-made staple fibres. 33,111 1.9% 22.0% 21.6% 19. 87 Vehicles (excluding railway or tramway rolling-stock) and parts and accessories thereof. 32,730 1.9% 12.0% 11.6% 20. 03 Fish and crustaceans, molluscs and other aquatic invertebrates 31,399 1.8% 0.3% 2.5% 21. 28 Inorganic chemicals; organic or inorganic compounds of precious metals, of rare-earth metals, of rad…. 31,054 1.8% 0.7% 0.7% 22. 82 Tools, implements, cutlery, spoons and forks, of base metal; parts thereof of base metal. 27,428 1.6% 12.2% 10.3% 23. 40 Rubber and articles thereof. 26,589 1.5% 11.2% 11.4% 24. 83 Miscellaneous articles of base metal. 22,510 1.3% 6.3% 12.3% 25.
15 Animal or vegetable fats and oils and their cleavage products; edible fats; animal or vegetable waxes…. 22,189 1.3% 0.5% 4.2%
26. 98 Special classifications provisions 21,538 1.2% 35.0% 35.0% 27. 61 Articles of apparel and clothing accessories, knitted or crocheted 20,576 1.2% 39.9% 39.3% 28. 42 Articles of leather; saddlery and harness; travel goods, handbags and similar containers; articles of…. 19,313 1.1% 27.7% 26.3% 29.
90 Optical, photographic, cinematographic, measuring, checking, precision, medical or surgical instrume…. 18,583 1.1% 1.2% 0.7%
30. 13 Lac; gums, resins and other vegetable saps and extracts 18,397 1.0% 0.2% 5.6% 31. 95 Toys, games and sports requisites; parts and accessories thereof. 16,828 1.0% 0.2% 3.7% 32. 68 Articles of stone, plaster, cement, asbestos, mica or similar materials 16,580 0.9% 4.4% 4.5% 33. 57 Carpets and other textile floor coverings. 16,517 0.9% 30.0% 30.0% 34. 54 Man-made filaments 15,456 0.9% 18.0% 20.2% 35. 26 Ores, slag and ash. 12,619 0.7% 0.0% 0.0% 36. 96 Miscellaneous manufactured articles. 12,259 0.7% 8.0% 10.5% 37. 76 Aluminium and articles thereof 11,155 0.6% 6.3% 5.9% 38. 50 Silk 10,608 0.6% 0.0% 0.0% 39. 59 Impregnated, coated, covered or laminated textile fabrics; textile articles of a kind suitable for i…. 10,439 0.6% 17.5% 12.2% 40. 33 Essential oils and resinoids; perfumery, cosmetic or toilet preparations. 10,032 0.6% 10.8% 13.3% 41. 94 Furniture; bedding, mattresses, mattress supports, cushions and similar stuffed furnishings; lamps a…. 9,911 0.6% 13.8% 17.3% 42. 70 Glass and glassware. 9,879 0.6% 8.3% 8.5% 43. 53 Other vegetable textile fibres; paper yarn and woven fabrics of paper yarn. 9,747 0.6% 1.9% 3.4% 44. 69 Ceramic products. 8,710 0.5% 15.6% 10.5% 45. 08 Edible fruit and nuts; peel of citrus fruit or melons 7,493 0.4% 0.5% 9.2% 46. 25 Salt, sulphur, earths and stone, plastering materials, lime and cement. 7,490 0.4% 0.2% 1.5% 47. 49 Printed books, newspapers, pictures and other products of the printing industry; manuscripts, typesc…. 6,905 0.4% 1.9% 5.3% 48. 24 Tobacco and manufactured tobacco substitutes. 6,668 0.4% 10.4% 20.9% 49. 12 Oil seeds and oleaginous fruits; miscellaneous grains, seeds and fruit; industrial or medical plants…. 6,175 0.3% 9.1% 6.1% 50. 48 Paper and paperboard; articles of paper pulp, of paper or of paperboard 5,822 0.3% 11.5% 10.7%
Source: Customs and Excise, DTI and own calculations, note: only ad valorem tariffs are considered These results are confirmed in the next table, where we also rank the imports and associated weighted and unweighted tariffs by value of imports.
13
Table 8: South African imports and import weighted and unweighted tariffs for the HS2 level of commodity aggregation ranked according to the unweighted tariff (2000, R '000 and July 2000 respectively) HS2
code HS2 descriptions
Imports from India 2000 (R '000)
Share of total South African imports
Import weighted tariffs on imports from India
Unweigh-ted tariffs on imports from India
Total / average 1,764,805 100.0% 10.6% 12.1% 1. 61 Articles of apparel and clothing accessories, knitted or crocheted 20,576 1.2% 39.9% 39.3% 2. 62 Articles of apparel and clothing accessories, not knitted or crocheted 120,340 6.8% 38.5% 38.5% 3. 98 Special classifications provisions 21,538 1.2% 35.0% 35.0% 4. 63 Other made up textile articles; sets; worn clothing and worn textile articles; rags 42,371 2.4% 36.8% 33.5% 5. 57 Carpets and other textile floor coverings. 16,517 0.9% 30.0% 30.0% 6. 66 Umbrellas, sun umbrellas, walking-sticks, seat sticks, whips, riding-crops and parts thereof 7 0.0% 26.8% 28.3% 7. 04 Dairy produce; birds' eggs; natural honey; edible products of animal origin, not elsewhere specified…. 0 0.0% 28.2% 28.2% 8. 42 Articles of leather; saddlery and harness; travel goods, handbags and similar containers; articles of…. 19,313 1.1% 27.7% 26.3% 9. 65 Headgear and parts thereof 507 0.0% 25.9% 25.7% 10. 17 Sugars and sugar confectionery 382 0.0% 21.5% 25.5% 11. 64 Footwear, gaiters and the like; parts of such articles 56,673 3.2% 27.5% 25.3% 12. 60 Knitted or crocheted fabrics. 961 0.1% 21.0% 22.6% 13. 52 Cotton 39,458 2.2% 22.0% 22.0% 14. 55 Man-made staple fibres. 33,111 1.9% 22.0% 21.6% 15. 24 Tobacco and manufactured tobacco substitutes. 6,668 0.4% 10.4% 20.9% 16. 54 Man-made filaments 15,456 0.9% 18.0% 20.2% 17. 06 Live trees and other plants; bulbs, roots and the like; cut flowers and ornamental foliage 85 0.0% 20.0% 20.0% 18. 58 Special woven fabrics; tufted textile fabrics; lace tapestries; trimmings; embroidery. 3,546 0.2% 24.3% 19.3% 19. 19 Preparations of cereals, flour, starch, or milk; pastrycooks products 925 0.1% 20.8% 17.9% 20. 94 Furniture; bedding, mattresses, mattress supports, cushions and similar stuffed furnishings; lamps a…. 9,911 0.6% 13.8% 17.3% 21. 18 Cocoa and cocoa preparations 0 0.0% 17.0% 17.0% 22. 46 Manufactures of straw, of esparto or of other plaiting materials; basketware and wickerwork 580 0.0% 19.9% 16.7% 23. 67 Prepared feathers and down and articles made of feathers or of down; artificial flowers; articles of…. 122 0.0% 19.9% 16.7% 24. 56 Wadding, felt and nonwovens; special yarns; twine, cordage, ropes and cables and articles thereof. 4,419 0.3% 17.3% 16.1% 25. 51 Wool, fine or coarse animal hair; horsehair yarn and woven fabric 4,495 0.3% 22.0% 15.0% 26. 34 Soap, organic surface-active agents, washing preparations, lubricating preparations, artificial waxe…. 2,689 0.2% 19.2% 15.0% 27. 43 Furskins and artificial fur; manufactures thereof 3 0.0% 18.9% 15.0% 28. 20 Preparations of vegetables, fruit, nuts or other parts of plants. 1,068 0.1% 12.5% 14.4% 29. 33 Essential oils and resinoids; perfumery, cosmetic or toilet preparations. 10,032 0.6% 10.8% 13.3% 30. 71 Natural or cultured pearls, precious or semi-precious stones, precious metals, metals clad with prec…. 39,315 2.2% 3.0% 12.6% 31. 83 Miscellaneous articles of base metal. 22,510 1.3% 6.3% 12.3% 32. 59 Impregnated, coated, covered or laminated textile fabrics; textile articles of a kind suitable for i…. 10,439 0.6% 17.5% 12.2% 33. 87 Vehicles (excluding railway or tramway rolling-stock) and parts and accessories thereof. 32,730 1.9% 12.0% 11.6% 34. 40 Rubber and articles thereof. 26,589 1.5% 11.2% 11.4% 35. 07 Edible vegetables and certain roots and tubers 3,567 0.2% 12.9% 11.0% 36. 48 Paper and paperboard; articles of paper pulp, of paper or of paperboard 5,822 0.3% 11.5% 10.7% 37. 96 Miscellaneous manufactured articles. 12,259 0.7% 8.0% 10.5% 38. 69 Ceramic products. 8,710 0.5% 15.6% 10.5% 39. 82 Tools, implements, cutlery, spoons and forks, of base metal; parts thereof of base metal. 27,428 1.6% 12.2% 10.3% 40. 39 Plastics and articles thereof. 37,972 2.2% 10.2% 10.1% 41. 44 Wood and articles of wood; wood charcoal 3,776 0.2% 17.8% 10.0% 42. 08 Edible fruit and nuts; peel of citrus fruit or melons 7,493 0.4% 0.5% 9.2% 43. 70 Glass and glassware. 9,879 0.6% 8.3% 8.5% 44. 21 Miscellaneous edible preparations. 2,117 0.1% 18.6% 7.8% 45. 36 Explosives; pyrotechnic products; matches; pyrophoric alloys: certain combustible preparations. 376 0.0% 4.9% 7.5% 46. 16 Preparations of meat, of fish or of crustaceans, molluscs or other aquatic invertebrates 1,842 0.1% 0.4% 7.1% 47. 73 Articles of iron or steel. 55,172 3.1% 10.5% 6.1% 48. 11 Products of the milling industry; malt; starches; inulin; wheat gluten 92 0.0% 2.5% 6.1% 49. 12 Oil seeds and oleaginous fruits; miscellaneous grains, seeds and fruit; industrial or medical plants…. 6,175 0.3% 9.1% 6.1% 50. 27 Mineral fuels, oils and products of their distillation; bituminous substances; mineral waxes. 46 0.0% 0.6% 6.0%
Source: Customs and Excise, DTI and own calculations, note: only ad valorem tariffs are considered The next question is: Which HS2 commodities are expected to be of interest to Indian trade policy-makers when considering a FTA with South Africa? We employ UNCTAD's TRAINS
14
database and therefore results are expressed in US$. It also appears that a considerably lower number of commodities are imported by India from South Africa. At the HS6 level there are, according to TRAINS, only about 410 lines, compared with about 660 HS8 lines according to Customs and Excise (which aggregates into 610 HS6 lines). In spite of this discrepancy, we continue to employ the TRAINS database because it offers not only Indian imports from South Africa, but also information on imports from other sources, which is necessary for contextualisation. In line with the presentation of tariffs on South African imports in Tables 6-8, we start with the aggregation level of the 22 chapters. In Table 9 it can be seen that the tariffs in India are considerably higher than shown for South Africa in Table 6, especially if we remember that the tariffs from the same TRAINS database are even lower (see footnote 1). Table 9: Selected Indian imports and import weighted tariffs (1998, Rand '000) CH22
code CH22 descriptions
Imports from South Africa (R '000)
Share of total imports from South Africa
Import weighted tariffs on imports from South Africa
Unweighted tariffs on imports from the rest of the World
Total/average 496,633 1.2% 23.6% 25.4% 1. 01 Live animals; animal products 13 0.0% 10.0% 10.0% 2. 02 Vegetable products 1,637 0.2% 40.0% 40.0% 3. 03 Animal or vegetable fats and oils and their cleavage 44 0.0% 30.0% 30.0% 4. 04 Prepared foodstuffs; beverages, spirits and vinegar; tobacco etc 6,713 2.5% 2.8% 20.0% 5. 05 Mineral products 112,623 1.1% 3.2% 12.2% 6. 06 Products of the chemical or allied industries 86,770 1.7% 29.1% 27.7% 7. 07 Plastics and articles thereof; rubber and articles thereof 5,585 0.5% 30.9% 31.8% 8. 08 Raw hides and skins, leather, furskins and articles 752 0.5% 1.5% 4.0% 9. 09 Wood and articles of wood; wood charcoal; cork and articles 12,781 2.9% 1.5% 21.4% 10. 10 Pulp of wood or of other fibrous cellulosic material; waste and scrap of paper etc 12,768 1.4% 5.9% 17.0% 11. 11 Textiles and textile articles 10,291 1.2% 32.1% 31.4% 12. 12 Footwear, headgear, umbrellas, sun umbrellas, walking-sticks, seat-sticks, whips etc 1 0.0% 40.0% 40.0% 13. 13 Articles of stone, plaster, cement, asbestos etc 38 0.0% 40.0% 40.0% 14. 14 Natural or cultured pearls, precious or semi-precious stones, precious metals etc 126,176 1.9% 39.6% 28.6% 15. 15 Base metals and articles of base metal 93,382 2.8% 26.8% 27.2% 16. 16 Machinery and mechanical appliances; electrical equipment; parts thereof 18,938 0.3% 21.3% 23.6% 17. 17 Vehicles, aircraft, vessels and associated transport equipment 4,011 0.4% 40.0% 40.0% 18. 18 Optical, Photographic, cinematographic, measuring, checking, precision, medical 4,083 0.5% 20.0% 21.4% 19. 20 Miscellaneous manufactured articles 27 0.0% 40.0% 40.0% 20. 21 Works of art, collectors' pieces and antiques 0 0.0% 0.0% 10.0%
Source: UNCTAD TRAINS and own calculations Judging from the last column of the table below in which we show the unweighted applied import tariffs, it can be seen that there are, compared to South Africa, clearly a lower number of tariffs in India: the top 16 tariffs are all exactly 40%. All of these HS2 commodities are also characterised by relatively low values of imports. The commodity group in row 33 has a weighted tariff of just under 40% and it captures about 25% of India's total imports from South Africa, which includes precious metals such as gold for jewellery. Another big export commodity for South Africa is the inorganic chemicals group 28 (see row 20) – which is faced with a 30% import tariff – as well as the iron and steel products of commodity group 72 (see row 36).
15
Table 10: Selected Indian imports and import weighted tariffs (1997, US$ '000) ranked according to the unweighted tariff HS2
code HS2 descriptions
Imports from South Africa (R '000)
Share of total imports from South Africa
Import weighted tariffs on imports from South Africa
Unweighted tariffs on imports from the rest of the World
Total/average 496,633 1.2% 23.6% 25.4%
1 08 Edible fruit and nuts; peel of citrus fruit or melons 1,637 0.5% 40.0% 40.0% 2 33 Essential oils and resinoids; perfumery, cosmetic or toilet preparations. 21 0.1% 40.0% 40.0% 3 34 Soap, organic surface-active agents, washing preparations, lubricating preparati….. 72 0.1% 40.0% 40.0% 4 40 Rubber and articles thereof. 523 0.2% 40.0% 40.0% 5 42 Articles of leather; saddlery and harness; travel goods, handbags and similar con….. 18 1.0% 40.0% 40.0% 6 53 Other vegetable textile fibres; paper yarn and woven fabrics of paper yarn. 15 0.1% 40.0% 40.0% 7 56 Wadding, felt and nonwovens; special yarns; twine, cordage, ropes and cables and….. 276 1.0% 40.0% 40.0% 8 57 Carpets and other textile floor coverings. 14 0.6% 40.0% 40.0% 9 58 Special woven fabrics; tufted textile fabrics; lace tapestries; trimmings; embro….. 22 0.1% 40.0% 40.0% 10 59 Impregnated, coated, covered or laminated textile fabrics; textile articles of a….. 112 0.1% 40.0% 40.0% 11 64 Footwear, gaiters and the like; parts of such articles 1 0.0% 40.0% 40.0% 12 68 Articles of stone, plaster, cement, asbestos, mica or similar materials 38 0.1% 40.0% 40.0% 13 83 Miscellaneous articles of base metal. 58 0.2% 40.0% 40.0% 14 87 Vehicles (excluding railway or tramway rolling-stock) and parts and accessories ….. 4,011 1.0% 40.0% 40.0% 15 93 Arms and ammunition; parts and accessories thereof. 10 1.0% 40.0% 40.0% 16 96 Miscellaneous manufactured articles. 17 0.0% 40.0% 40.0% 17 54 Man-made filaments 2,024 2.3% 31.1% 33.0% 18 15 Animal or vegetable fats and oils and their cleavage products; edible fats; anima….. 44 0.0% 30.0% 30.0% 19 18 Cocoa and cocoa preparations 29 0.4% 30.0% 30.0% 20 28 Inorganic chemicals; organic or inorganic compounds of precious metals, of rare-….. 69,493 5.8% 30.0% 30.0% 21 30 Pharmaceutical products. 194 0.2% 30.0% 30.0% 22 32 Tanning or dyeing extracts, tannins and their derivatives; dyes, pigments and ot….. 205 0.1% 30.0% 30.0% 23 39 Plastics and articles thereof. 5,062 0.7% 30.0% 30.0% 24 50 Silk 10 0.0% 30.0% 30.0% 25 55 Man-made staple fibres. 1,224 0.7% 30.0% 30.0% 26 73 Articles of iron or steel. 743 0.2% 30.0% 30.0% 27 74 Copper and articles thereof 7,771 1.2% 30.0% 30.0% 28 78 Lead and articles thereof. 376 0.9% 30.0% 30.0% 29 79 Zinc and articles thereof. 417 0.3% 30.0% 30.0% 30 81 Other base metals; cermets: articles thereof. 219 0.4% 30.0% 30.0% 31 91 Clocks and watches and parts thereof. 17 0.1% 30.0% 30.0% 32 38 Miscellaneous chemical products. 972 0.2% 29.7% 29.4% 33 71 Natural or cultured pearls, precious or semi-precious stones, precious metals, m….. 126,176 1.9% 39.6% 28.6% 34 85 Electrical machinery and equipment and parts thereof; sound recorders and reprod….. 4,036 0.2% 23.8% 27.6% 35 29 Organic chemicals. 15,572 0.8% 25.4% 27.0% 36 72 Iron and steel. 63,123 4.5% 28.2% 26.9% 37 48 Paper and paperboard; articles of paper pulp, of paper or of paperboard 2,979 0.6% 12.3% 26.4% 38 51 Wool, fine or coarse animal hair; horsehair yarn and woven fabric 6,067 3.2% 34.9% 26.0% 39 37 Photographic or cinematographic goods. 178 0.1% 25.0% 25.0% 40 82 Tools, implements, cutlery, spoons and forks, of base metal; parts thereof of ba….. 10,120 9.8% 25.0% 25.0% 41 44 Wood and articles of wood; wood charcoal 12,781 3.0% 1.5% 21.4% 42 84 Nuclear reactors, boilers, machinery and mechanical appliances; parts thereof. 14,902 0.3% 20.7% 21.0% 43 17 Sugars and sugar confectionery 6,214 4.6% 2.1% 20.0% 44 76 Aluminium and articles thereof 7,490 3.6% 20.0% 20.0% 45 90 Optical, photographic, cinematographic, measuring, checking, precision, medical ….. 4,066 0.5% 20.0% 20.0% 46 25 Salt, sulphur, earths and stone, plastering materials, lime and cement. 11,390 3.0% 3.8% 17.5% 47 49 Printed books, newspapers, pictures and other products of the printing industry… 66 0.0% 11.2% 13.3% 48 52 Cotton 527 0.8% 1.1% 12.5% 49 27 Mineral fuels, oils and products of their distillation; bituminous substances; m… 97,730 1.0% 3.1% 10.5% 50 05 Products of animal origin, not elsewhere specified or included 13 0.2% 10.0% 10.0%
Source: UNCTAD TRAINS Database
16
Table 11: Selected Indian imports and import weighted tariffs (1997, US$ '000) ranked according to value of imports HS2
code HS2 descriptions
Imports from South Africa (R '000)
Share of total imports from South Africa
Import weighted tariffs on imports from South Africa
Unweighted tariffs on imports from the rest of the World
Total/average 496,633 1.2% 23.6% 25.4%
1 71 Natural or cultured pearls, precious or semi-precious stones, precious metals, m… 126,176 1.9% 39.6% 28.6% 2 27 Mineral fuels, oils and products of their distillation; bituminous substances; m… 97,730 1.0% 3.1% 10.5% 3 28 Inorganic chemicals; organic or inorganic compounds of precious metals, of rare-… 69,493 5.8% 30.0% 30.0% 4 72 Iron and steel. 63,123 4.5% 28.2% 26.9% 5 29 Organic chemicals. 15,572 0.8% 25.4% 27.0% 6 84 Nuclear reactors, boilers, machinery and mechanical appliances; parts thereof. 14,902 0.3% 20.7% 21.0% 7 44 Wood and articles of wood; wood charcoal 12,781 3.0% 1.5% 21.4% 8 25 Salt, sulphur, earths and stone, plastering materials, lime and cement. 11,390 3.0% 3.8% 17.5% 9 82 Tools, implements, cutlery, spoons and forks, of base metal; parts thereof of ba… 10,120 9.8% 25.0% 25.0% 10 47 Pulp of wood or of other fibrous cellulosic material; waste and scrap of paper … 9,723 3.4% 3.9% 1.7% 11 74 Copper and articles thereof 7,771 1.2% 30.0% 30.0% 12 76 Aluminium and articles thereof 7,490 3.6% 20.0% 20.0% 13 17 Sugars and sugar confectionery 6,214 4.6% 2.1% 20.0% 14 51 Wool, fine or coarse animal hair; horsehair yarn and woven fabric 6,067 3.2% 34.9% 26.0% 15 39 Plastics and articles thereof. 5,062 0.7% 30.0% 30.0% 16 90 Optical, photographic, cinematographic, measuring, checking, precision, medical… 4,066 0.5% 20.0% 20.0% 17 85 Electrical machinery and equipment and parts thereof; sound recorders and reprod… 4,036 0.2% 23.8% 27.6% 18 87 Vehicles (excluding railway or tramway rolling-stock) and parts and accessories… 4,011 1.0% 40.0% 40.0% 19 26 Ores, slag and ash. 3,503 2.5% 5.2% 6.7% 20 75 Nickel and articles thereof 3,065 2.8% 10.0% 10.0% 21 48 Paper and paperboard; articles of paper pulp, of paper or of paperboard 2,979 0.6% 12.3% 26.4% 22 54 Man-made filaments 2,024 2.3% 31.1% 33.0% 23 08 Edible fruit and nuts; peel of citrus fruit or melons 1,637 0.5% 40.0% 40.0% 24 55 Man-made staple fibres. 1,224 0.7% 30.0% 30.0% 25 38 Miscellaneous chemical products. 972 0.2% 29.7% 29.4% 26 73 Articles of iron or steel. 743 0.2% 30.0% 30.0% 27 41 Raw hides and skins (excluding furskins) and leather 734 0.5% 0.5% 1.4% 28 52 Cotton 527 0.8% 1.1% 12.5% 29 40 Rubber and articles thereof. 523 0.2% 40.0% 40.0% 30 22 Beverages, spirits and vinegar. 470 2.7% 10.0% 10.0% 31 79 Zinc and articles thereof. 417 0.3% 30.0% 30.0% 32 78 Lead and articles thereof. 376 0.9% 30.0% 30.0% 33 56 Wadding, felt and nonwovens; special yarns; twine, cordage, ropes and cables and… 276 1.0% 40.0% 40.0% 34 81 Other base metals; cermets: articles thereof. 219 0.4% 30.0% 30.0% 35 32 Tanning or dyeing extracts, tannins and their derivatives; dyes, pigments and ot… 205 0.1% 30.0% 30.0% 36 30 Pharmaceutical products. 194 0.2% 30.0% 30.0% 37 37 Photographic or cinematographic goods. 178 0.1% 25.0% 25.0% 38 59 Impregnated, coated, covered or laminated textile fabrics; textile articles of a… 112 0.1% 40.0% 40.0% 39 34 Soap, organic surface-active agents, washing preparations, lubricating preparati… 72 0.1% 40.0% 40.0% 40 49 Printed books, newspapers, pictures and other products of the printing industry… 66 0.0% 11.2% 13.3% 41 31 Fertilizers. 63 0.0% 0.0% 0.0% 42 83 Miscellaneous articles of base metal. 58 0.2% 40.0% 40.0% 43 15 Animal or vegetable fats and oils and their cleavage products; edible fats; anima… 44 0.0% 30.0% 30.0% 44 68 Articles of stone, plaster, cement, asbestos, mica or similar materials 38 0.1% 40.0% 40.0% 45 18 Cocoa and cocoa preparations 29 0.4% 30.0% 30.0% 46 58 Special woven fabrics; tufted textile fabrics; lace tapestries; trimmings; embro… 22 0.1% 40.0% 40.0% 47 33 Essential oils and resinoids; perfumery, cosmetic or toilet preparations. 21 0.1% 40.0% 40.0% 48 42 Articles of leather; saddlery and harness; travel goods, handbags and similar con… 18 1.0% 40.0% 40.0% 49 96 Miscellaneous manufactured articles. 17 0.0% 40.0% 40.0% 50 91 Clocks and watches and parts thereof. 17 0.1% 30.0% 30.0%
Source: UNCTAD TRAINS Database A better view of the relative importance of India's tariff structure for imports from South Africa is shown in the next table where we rank the contents of the previous table according to value of imports. It can easily be seen that most of HS2 commodity groups with the highest value are faced with relatively high import tariffs. Exceptions are group 27 (see row 2), which includes coal, and group 47, which includes paper and pulp products (row 10).
17
3 TRADE CREATION AND TRADE DIVERSION FOLLOWING A
HYPOTHETICAL FTA BETWEEN SOUTH AFRICA AND INDIA Since the aim of this study is to examine the impact of the proposed FTA between South Africa and India on the bilateral trade flows between the two countries, simulations are conducted with a static, partial equilibrium methodology. 3.1 Methodology The methodology employed here is comparatively simple, with low data requirements, which can be used to evaluate the impact of changing tariff levels on trade patterns at a disaggregated commodity level. Following a hypothetical free trade arrangement between South Africa and India, the following changes in trade flows between the two countries and third countries can, amongst others, be distinguished: Trade creation, which measures the increase in South African imports from India due to a
decrease in the relative price of these imports vis-à-vis domestically produced goods, resulting in a net increase in South Africa's total imports and a net decrease in South Africa's domestic production; and
Trade diversion, which measures the increase in South African imports from India due to a decrease in the relative price of these imports vis-à-vis imports from other countries resulting in a different geographical composition of imports, whereby imports from India increase at the expense of imports from other sources, with no change in total South African imports.
Trade creation is considered to be welfare enhancing since relatively high-cost domestic production is replaced with lower-cost imports from India. Nevertheless, South Africa has to face the decline of local, albeit less efficient, production. Trade diversion is considered to be welfare lowering in that South Africa switches its source of imports from a more efficiently producing country to a less efficiently producing country, leading to a less efficient allocation of resources, although the total import bill remains unchanged. Operationalisation of the trade creation and trade diversion methodology follows from rewriting the relationships that define the elasticity of imports with regard to changes in the import price and the elasticity that defines the substitution of imports from one source to another following a change in the relative price, respectively. In particular, the import price elasticity drives the degree to which imports respond to changes in import prices following a change in the tariffs. The substitution elasticity between imports from two different sources (India versus the rest of the world) governs the extent to which imports are switched (or substituted) from one source to another following a change in the price of imports, again due to changes in tariffs. Further details are available in Appendix 2. The methodologies rest on a number of restrictive assumptions, amongst others, the adoption of perfect substitution between imports from various sources in the case of trade creation. Although the methodology chosen here is probably a good first step, further refinement is recommended.
18
3.2 The data For South Africa, we make use of Customs and Excise data at the HS8 digit level for SACU imports from India and from the rest of the world for 2000. Tariff duties for July 2000 were obtained from the DTI and are assumed to be representative for the full calendar year. This may be a strong assumption in practice, as tariffs can change on a monthly basis. On the other hand, the one of the purposes of South Africa's multi-year tariff phase-down commitment to the World Trade Organisation (WTO) is to create a stable environment for importers and investors. Trade creation and trade diversion are critically dependent on the choice of the import price elasticity and the import substitution elasticity. With regard to the import price elasticities, Gumede (2000) has estimated a single value of 1.56 for the import price elasticity and Jachia and Teljeur (1998) use 1.50 for the substitution elasticity across all commodities. Clearly, a single elasticity that applies across all commodities is unsatisfactory. Recently, Gumede (2000) has made an attempt to estimate import price elasticities for a limited number of sectors. However, a number of estimations could not be used since either the signs of the estimated elasticity are in the wrong direction, i.e. suggesting that the import demand goes up with an increase in the price, or no estimates were recorded. The following results were considered to be useable for our purposes. Table 12: Estimated import price elasticities used in the trade creation calculations
22 Chapter Description Sector
Estimated import price elasticity
1. Unspecified manf -0.364 2. Live animals animal products manf -0.364 3. Vegetable products manf -0.364 4. Animal or vegetable fats and oils manf -0.364 5. Prepared foodstuffs, beverages, tobacco manf -0.364 6. Mineral products manf -0.364 7. Products of chemical or allied industries chems -0.301 8. Plastics and rubber chems -0.301 9. Raw hides and skins, leather manf -0.364 10. Wood, cork, straw manf -0.364 11. Pulp, paper and paperboard, books manf -0.364 12. Textiles, fabrics, clothing manf -0.364 13. Footwear, headgear, umbrellas manf -0.364 14. Articles of stone asbestos ceramics glass manf -0.364 15. Precious metals manf -0.364 16. Base metals manf -0.364 17. Machinery, mechanical and electrical mach -0.113 18. Vehicles, aircraft, ships manf -0.364 19. Optical photograph measuring musical inst manf -0.364 20. Miscellaneous manufactured articles manf -0.364 21. Works of art collectors pieces and antiques manf -0.364 22. Other unclassified goods manf -0.364
Source: Gumede 2000 It can be seen that the estimated import price elasticities are much lower than the –1.56 used by Gumede (2000). As a result, the trade creation effect will be more than half the size if we use the estimates of Table 12 above compared to the single estimate of –1.56. In what follows, we will report South Africa's trade creation estimates for both sets of elasticities. Finally, on the export side, i.e. from the point of India's imports, we employ data on trade flows and tariffs from UNCTAD's TRAINS database as shown in Tables 8 and 9 above and use import demand and substitution elasticities of 1.5. 3.3 Trade creation and diversion results
19
We now turn to the results of the trade creation and trade diversion models, starting with South African imports, followed by Indian imports. South African imports Trade creation results for the top and bottom 25 HS2 commodities are shown in the next table, using the sector-specific elasticities of Gumede as well as the uniform elasticity suggested by Jachia and Teljeur. Since there are about 99 HS2 commodities and we report only on the top and bottom 50, we omit a great number of tariff lines, although this typically constitutes less than 10% of the total trade creation (or trade diversion). Table 13: Potential trade creation in South Africa following a FTA with India using import price elasticities of Table 12, (R '000, 2000) HS2
code HS2 Descriptions
Trade creation
Total 51,584 1 62 Articles of apparel and clothing accessories, not knitted or crocheted 12,184 2 64 Footwear, gaiters and the like; parts of such articles 4,452 3 63 Other made up textile articles; sets; worn clothing and worn textile articles; rags 4,147 4 52 Cotton 2,590 5 55 Man-made staple fibres. 2,173 6 61 Articles of apparel and clothing accessories, knitted or crocheted 2,134 7 98 Special classifications provisions 2,033 8 73 Articles of iron or steel. 1,904 9 42 Articles of leather; saddlery and harness; travel goods, handbags and similar containers; articles of animal gut (excluding silk-worm gut) 1,523 10 57 Carpets and other textile floor coverings. 1,387 11 87 Vehicles (excluding railway or tramway rolling-stock) and parts and accessories thereof. 1,280 12 82 Tools, implements, cutlery, spoons and forks, of base metal; parts thereof of base metal. 1,082 13 41 Raw hides and skins (excluding furskins) and leather 1,060 14 39 Plastics and articles thereof. 1,059 15 84 Nuclear reactors, boilers, machinery and mechanical appliances; parts thereof. 1,034 16 85 Electrical machinery and equipment and parts thereof; sound recorders and reproducers, television image and sound recorders and reproducers… 910 17 38 Miscellaneous chemical products. 871 18 54 Man-made filaments 859 19 40 Rubber and articles thereof. 808 20 72 Iron and steel. 635 21 09 Coffee, tea, mate and spices 586 22 59 Impregnated, coated, covered or laminated textile fabrics; textile articles of a kind suitable for industrial use. 567 23 83 Miscellaneous articles of base metal. 485 24 94 Furniture; bedding, mattresses, mattress supports, cushions and similar stuffed furnishings; lamps and lighting fittings, not elsewhere spec… 437 25 69 Ceramic products. 428 74 04 Dairy produce; birds' eggs; natural honey; edible products of animal origin, not elsewhere specified or included 0 75 18 Cocoa and cocoa preparations 0 76 01 Live animals 0 77 02 Meat and edible meat offal 0 78 05 Products of animal origin, not elsewhere specified or included 0 79 10 Cereals 0 80 14 Vegetable plaiting materials; vegetable products not elsewhere specified or included 0 81 26 Ores, slag and ash. 0 82 31 Fertilizers. 0 83 45 Cork and articles of cork 0 84 47 Pulp of wood or of other fibrous cellulosic material; waste and scrap of paper or paperboard. 0 85 50 Silk 0 86 75 Nickel and articles thereof 0 87 78 Lead and articles thereof. 0 88 79 Zinc and articles thereof. 0 89 80 Tin and articles thereof. 0 90 81 Other base metals; cermets: articles thereof. 0 91 86 Railway or tramway locomotives, rolling-stock and parts thereof; railway or tramway track fixtures and fittings and parts thereof; mechanica… 0 92 88 Aircraft, spacecraft and parts thereof. 0 93 89 Ships, boats and floating structures. 0 94 91 Clocks and watches and parts thereof. 0 95 92 Musical instruments; parts and accessories of such articles. 0 96 93 Arms and ammunition; parts and accessories thereof. 0 97 97 Works of art, collectors' pieces and antiques. 0 98 99 Other unclassified goods. 0
Source: own calculations In the first ten rows we see that most trade creation takes place in the textiles, clothing and leather industries with the exception of basic iron and steel fabricates and the special
20
classification provision. Further down, from row 10 to 25, we obtain a more diversified picture, with sectors such as electrical machinery, rubber, motor vehicles and parts. In the second half of the table, it can be seen that no trade creation can be expected in food products, other than iron and steel metal productions and some of the more basic chemicals. Using a uniform import price elasticity, the commodity pattern looks very similar, although the total value of trade creation has now increased from R60 million to about R240 million, as can be seen in the next table. The reason, of course, is the higher import price elasticity that is now 1.56 as opposed to roughly 0.35 on average in Table 13. Table 14: Potential trade creation in South Africa following a FTA with India using a uniform import price elasticities of 1.56 (R '000, 2000) HS2
code HS2 descriptions
Trade creation
236,082 1 62 Articles of apparel and clothing accessories, not knitted or crocheted 52,218 2 64 Footwear, gaiters and the like; parts of such articles 19,081 3 63 Other made up textile articles; sets; worn clothing and worn textile articles; rags 17,772 4 85 Electrical machinery and equipment and parts thereof; sound recorders and reproducers, television image and sound recorders and reproducers,
and parts and accessories of such articles 12,557
5 52 Cotton 11,100 6 55 Man-made staple fibres. 9,314 7 61 Articles of apparel and clothing accessories, knitted or crocheted 9,147 8 98 Special classifications provisions 8,711 9 73 Articles of iron or steel. 8,159 10 84 Nuclear reactors, boilers, machinery and mechanical appliances; parts thereof. 7,591 11 42 Articles of leather; saddlery and harness; travel goods, handbags and similar containers; articles of animal gut (excluding silk-worm gut) 6,528 12 57 Carpets and other textile floor coverings. 5,946 13 39 Plastics and articles thereof. 5,490 14 87 Vehicles (excluding railway or tramway rolling-stock) and parts and accessories thereof. 5,486 15 82 Tools, implements, cutlery, spoons and forks, of base metal; parts thereof of base metal. 4,637 16 41 Raw hides and skins (excluding furskins) and leather 4,545 17 38 Miscellaneous chemical products. 4,513 18 40 Rubber and articles thereof. 4,188 19 54 Man-made filaments 3,680 20 72 Iron and steel. 2,721 21 09 Coffee, tea, mate and spices 2,512 22 59 Impregnated, coated, covered or laminated textile fabrics; textile articles of a kind suitable for industrial use. 2,428 23 83 Miscellaneous articles of base metal. 2,079 24 94 Furniture; bedding, mattresses, mattress supports, cushions and similar stuffed furnishings; lamps and lighting fittings, not elsewhere specified or
included; illuminated signs, illuminated name-plates and the like; prefabricated buildings. 1,874
25 69 Ceramic products. 1,834 74 04 Dairy produce; birds' eggs; natural honey; edible products of animal origin, not elsewhere specified or included 0 75 18 Cocoa and cocoa preparations 0 76 01 Live animals 0 77 02 Meat and edible meat offal 0 78 05 Products of animal origin, not elsewhere specified or included 0 79 10 Cereals 0 80 14 Vegetable plaiting materials; vegetable products not elsewhere specified or included 0 81 26 Ores, slag and ash. 0 82 31 Fertilizers. 0 83 45 Cork and articles of cork 0 84 47 Pulp of wood or of other fibrous cellulosic material; waste and scrap of paper or paperboard. 0 85 50 Silk 0 86 75 Nickel and articles thereof 0 87 78 Lead and articles thereof. 0 88 79 Zinc and articles thereof. 0 89 80 Tin and articles thereof. 0 90 81 Other base metals; cermets: articles thereof. 0 91 86 Railway or tramway locomotives, rolling-stock and parts thereof; railway or tramway track fixtures and fittings and parts thereof; mechanical
(including electro-mechanical) traffic signalling equipment of all kinds. 0
92 88 Aircraft, spacecraft and parts thereof. 0 93 89 Ships, boats and floating structures. 0 94 91 Clocks and watches and parts thereof. 0 95 92 Musical instruments; parts and accessories of such articles. 0 96 93 Arms and ammunition; parts and accessories thereof. 0 97 97 Works of art, collectors' pieces and antiques. 0 98 99 Other unclassified goods. 0
Source: own calculations
21
Great differences are recorded for commodity ranking of electrical machinery (row 4), and machinery (row 10), which have increased their trade creation relative to what is indicated in Table 13. This is due to the considerably higher import price elasticity, i.e. 1.56 compared to 0.113 (see row 17 of Table 12). It can, thus, be concluded that the choice of the import price elasticity has, at least, some impact on the selection of the commodities on which trade negotiators should focus. It should be noted that we assumed that the initial tariff would be maintained throughout the period of implementation of the hypothetical FTA, which can be considered as the next five years. However, over this period the tariff structure in South Africa will change as part of WTO commitments. In principal, this will have a negative impact on trade creation, as the initial tariff will come down. What is needed is a schedule of applied MFN tariffs at the detailed HS8 level for the next five years. We continue below with a report on the trade diversion calculations. In Table 15 we report on the estimated trade diversion using an elasticity that assumes a substitution between similar products originating from different suppliers of unity. It can easily be seen that the ranking of HS2 product groups is very similar to that of the trade creation calculations, notably those with the uniform import price elasticity shown in Table 14. In fact, all top ten HS2 commodities appear in both the trade creation and trade diversion ranking. The same applies to the bottom ten HS2 commodities. The usefulness of a comparison of trade creation and trade diversion at the aggregate and at the commodity levels remains to be seen. With a uniform, albeit arbitrarily chosen, import price elasticity of 1.56 and a uniform elasticity of substitution of 1, it would appear that total trade diversion outweighs total trade creation by about 10%. All commodities with high trade diversion outweigh trade creation, while the raw hides, skins and leather (see row 18) is the only commodity group for which trade creation (not shown in Table 14) is larger than trade diversion.
22
Table 15: Potential trade diversion in South Africa following a FTA with India using a uniform substitution elasticities of 1.5 (R '000, 2000) HS2
code HS2 descriptions Trade diversion
141,310 1 62 Articles of apparel and clothing accessories, not knitted or crocheted 42,928 2 64 Footwear, gaiters and the like; parts of such articles 17,607 3 63 Other made up textile articles; sets; worn clothing and worn textile articles; rags 14,598 4 85 Electrical machinery and equipment and parts thereof; sound recorders and reproducers, television image and sound recorders and reproducers… 12,028 5 52 Cotton 10,001 6 55 Man-made staple fibres. 8,633 7 61 Articles of apparel and clothing accessories, knitted or crocheted 8,438 8 98 Special classifications provisions 8,364 9 73 Articles of iron or steel. 7,632 10 84 Nuclear reactors, boilers, machinery and mechanical appliances; parts thereof. 7,272 11 42 Articles of leather; saddlery and harness; travel goods, handbags and similar containers; articles of animal gut (excluding silk-worm gut) 5,939 12 87 Vehicles (excluding railway or tramway rolling-stock) and parts and accessories thereof. 5,259 13 39 Plastics and articles thereof. 5,240 14 57 Carpets and other textile floor coverings. 5,063 15 82 Tools, implements, cutlery, spoons and forks, of base metal; parts thereof of base metal. 4,347 16 38 Miscellaneous chemical products. 4,273 17 40 Rubber and articles thereof. 3,980 18 41 Raw hides and skins (excluding furskins) and leather 3,690 19 54 Man-made filaments 3,496 20 72 Iron and steel. 2,533 21 59 Impregnated, coated, covered or laminated textile fabrics; textile articles of a kind suitable for industrial use. 2,283 22 09 Coffee, tea, mate and spices 2,194 23 83 Miscellaneous articles of base metal. 1,915 24 94 Furniture; bedding, mattresses, mattress supports, cushions and similar stuffed furnishings; lamps and lighting fittings, not elsewhere spec… 1,784 25 69 Ceramic products. 1,753 74 04 Dairy produce; birds' eggs; natural honey; edible products of animal origin, not elsewhere specified or included 0 75 18 Cocoa and cocoa preparations 0 76 01 Live animals 0 77 02 Meat and edible meat offal 0 78 05 Products of animal origin, not elsewhere specified or included 0 79 10 Cereals 0 80 14 Vegetable plaiting materials; vegetable products not elsewhere specified or included 0 81 26 Ores, slag and ash. 0 82 31 Fertilizers. 0 83 45 Cork and articles of cork 0 84 47 Pulp of wood or of other fibrous cellulosic material; waste and scrap of paper or paperboard. 0 85 50 Silk 0 86 75 Nickel and articles thereof 0 87 78 Lead and articles thereof. 0 88 79 Zinc and articles thereof. 0 89 80 Tin and articles thereof. 0 90 81 Other base metals; cermets: articles thereof. 0 91 86 Railway or tramway locomotives, rolling-stock and parts thereof; railway or tramway track fixtures and fittings and parts thereof; mechanica… 0 92 88 Aircraft, spacecraft and parts thereof. 0 93 89 Ships, boats and floating structures. 0 94 91 Clocks and watches and parts thereof. 0 95 92 Musical instruments; parts and accessories of such articles. 0 96 93 Arms and ammunition; parts and accessories thereof. 0 97 97 Works of art, collectors' pieces and antiques. 0 98 99 Other unclassified goods. 0
Source: own calculations Indian imports The next question is: Which HS2 commodities are expected to be of interest to Indian trade policy-makers when considering a FTA with South Africa? Since we employ UNCTAD's TRAINS database, the results are expressed in US$. It also appears that a considerably lower number of commodities are imported from South Africa by India.
23
Table 16: Potential trade creation in India following a FTA with India using a uniform import price elasticities of 1.5 (US$ '000, 1998) HS2
code HS2 Descriptions
Trade creation
133,545 1 71 Natural or cultured pearls, precious or semi-precious stones, precious metals, metals clad with precious metal, and articles thereof; imitat… 53,659 2 28 Inorganic chemicals; organic or inorganic compounds of precious metals, of rare-earth metals, of radioactive elements or of isotopes. 24,055 3 72 Iron and steel. 20,829 4 29 Organic chemicals. 4,730 5 27 Mineral fuels, oils and products of their distillation; bituminous substances; mineral waxes. 4,413 6 84 Nuclear reactors, boilers, machinery and mechanical appliances; parts thereof. 3,829 7 82 Tools, implements, cutlery, spoons and forks, of base metal; parts thereof of base metal. 3,036 8 74 Copper and articles thereof 2,690 9 51 Wool, fine or coarse animal hair; horsehair yarn and woven fabric 2,356 10 76 Aluminium and articles thereof 1,873 11 39 Plastics and articles thereof. 1,752 12 87 Vehicles (excluding railway or tramway rolling-stock) and parts and accessories thereof. 1,719 13
85 Electrical machinery and equipment and parts thereof; sound recorders and reproducers, television image and sound recorders and reproducers,… 1,166
14 90 Optical, photographic, cinematographic, measuring, checking, precision, medical or surgical instruments and apparatus: parts and accessories… 1,017 15 54 Man-made filaments 721 16 08 Edible fruit and nuts; peel of citrus fruit or melons 702 17 25 Salt, sulphur, earths and stone, plastering materials, lime and cement. 618 18 47 Pulp of wood or of other fibrous cellulosic material; waste and scrap of paper or paperboard. 553 19 48 Paper and paperboard; articles of paper pulp, of paper or of paperboard 488 20 55 Man-made staple fibres. 424 21 75 Nickel and articles thereof 418 22 38 Miscellaneous chemical products. 334 23 44 Wood and articles of wood; wood charcoal 278 24 26 Ores, slag and ash. 259 25 73 Articles of iron or steel. 257 32 32 Tanning or dyeing extracts, tannins and their derivatives; dyes, pigments and other colouring matter; paints and varnishes; putty and other … 71 33 30 Pharmaceutical products. 67 34 22 Beverages, spirits and vinegar. 64 35 37 Photographic or cinematographic goods. 53 36 59 Impregnated, coated, covered or laminated textile fabrics; textile articles of a kind suitable for industrial use. 48 37 34 Soap, organic surface-active agents, washing preparations, lubricating preparations, artificial waxes, prepared waxes, polishing or scouring… 31 38 83 Miscellaneous articles of base metal. 25 39 68 Articles of stone, plaster, cement, asbestos, mica or similar materials 16 40 15 Animal or vegetable fats and oils and their cleavage products; edible fats; animal or vegetable waxes 15 41 18 Cocoa and cocoa preparations 10 42 49 Printed books, newspapers, pictures and other products of the printing industry; manuscripts, typescripts and plans 10 43 58 Special woven fabrics; tufted textile fabrics; lace tapestries; trimmings; embroidery. 9 44 33 Essential oils and resinoids; perfumery, cosmetic or toilet preparations. 9 45 52 Cotton 9 46 42 Articles of leather; saddlery and harness; travel goods, handbags and similar containers; articles of animal gut (excluding silk-worm gut) 8 47 96 Miscellaneous manufactured articles. 7 48 53 Other vegetable textile fibres; paper yarn and woven fabrics of paper yarn. 6 49 57 Carpets and other textile floor coverings. 6 50 91 Clocks and watches and parts thereof. 6 51 41 Raw hides and skins (excluding furskins) and leather 6 52 93 Arms and ammunition; parts and accessories thereof. 4 53 50 Silk 3 54 05 Products of animal origin, not elsewhere specified or included 2 55 64 Footwear, gaiters and the like; parts of such articles 0 56 31 Fertilizers. 0
Source: own calculations We only present results of the trade creation model for uniform import price elasticity. The table above assumes an import price elasticity of 1. The commodity groups that will be of specific interest to Indian trade negotiators are found at the top of the table. Attention will focus in particular on precious stones and metals for jewellery, coal, iron and steel, basic chemicals, machinery and some non-metallic minerals such as cement. The high levels of trade creation for coal are interesting in that the tariff is relatively low, as was shown in Table 11 above, and it appears that the high value of the imports makes this product group still notable. In general, the product groups that featured in Tables 8 and 9, where we showed trade flows and tariffs, are also prominent in the trade creation rankings. The ranking of commodities according to the value of trade creation appears to be closely related to the value of imports and/or the tariff.
24
Table 17: Potential trade diversion in India on imports from South Africa following a FTA using a uniform substitution elasticities of 1.5 (US$ '000, 1998) HS2
Code HS2 descriptions Trade
diversion 86,326 1 71 Natural or cultured pearls, precious or semi-precious stones, precious metals, metals clad with precious metal, and articles thereof; imitat… 35,087 2 28 Inorganic chemicals; organic or inorganic compounds of precious metals, of rare-earth metals, of radioactive elements or of isotopes. 15,111 3 72 Iron and steel. 13,266 4 29 Organic chemicals. 3,129 5 27 Mineral fuels, oils and products of their distillation; bituminous substances; mineral waxes. 2,913 6 84 Nuclear reactors, boilers, machinery and mechanical appliances; parts thereof. 2,544 7 82 Tools, implements, cutlery, spoons and forks, of base metal; parts thereof of base metal. 1,825 8 74 Copper and articles thereof 1,771 9 51 Wool, fine or coarse animal hair; horsehair yarn and woven fabric 1,520 10 76 Aluminium and articles thereof 1,204 11 39 Plastics and articles thereof. 1,160 12 87 Vehicles (excluding railway or tramway rolling-stock) and parts and accessories thereof. 1,135 13
85 Electrical machinery and equipment and parts thereof; sound recorders and reproducers, television image and sound recorders and reproducers,… 776
14 90 Optical, photographic, cinematographic, measuring, checking, precision, medical or surgical instruments and apparatus: parts and accessories… 674 15 54 Man-made filaments 469 16 08 Edible fruit and nuts; peel of citrus fruit or melons 466 17 25 Salt, sulphur, earths and stone, plastering materials, lime and cement. 400 18 47 Pulp of wood or of other fibrous cellulosic material; waste and scrap of paper or paperboard. 356 19 48 Paper and paperboard; articles of paper pulp, of paper or of paperboard 324 20 55 Man-made staple fibres. 280 21 75 Nickel and articles thereof 271 22 38 Miscellaneous chemical products. 222 23 44 Wood and articles of wood; wood charcoal 180 24 73 Articles of iron or steel. 171 25 26 Ores, slag and ash. 169 32 32 Tanning or dyeing extracts, tannins and their derivatives; dyes, pigments and other colouring matter; paints and varnishes; putty and other … 47 33 30 Pharmaceutical products. 45 34 22 Beverages, spirits and vinegar. 42 35 37 Photographic or cinematographic goods. 36 36 59 Impregnated, coated, covered or laminated textile fabrics; textile articles of a kind suitable for industrial use. 32 37 34 Soap, organic surface-active agents, washing preparations, lubricating preparations, artificial waxes, prepared waxes, polishing or scouring… 21 38 83 Miscellaneous articles of base metal. 17 39 68 Articles of stone, plaster, cement, asbestos, mica or similar materials 11 40 15 Animal or vegetable fats and oils and their cleavage products; edible fats; animal or vegetable waxes 10 41 18 Cocoa and cocoa preparations 7 42 49 Printed books, newspapers, pictures and other products of the printing industry; manuscripts, typescripts and plans 7 43 58 Special woven fabrics; tufted textile fabrics; lace tapestries; trimmings; embroidery. 6 44 33 Essential oils and resinoids; perfumery, cosmetic or toilet preparations. 6 45 52 Cotton 6 46 42 Articles of leather; saddlery and harness; travel goods, handbags and similar containers; articles of animal gut (excluding silk-worm gut) 5 47 96 Miscellaneous manufactured articles. 5 48 53 Other vegetable textile fibres; paper yarn and woven fabrics of paper yarn. 4 49 57 Carpets and other textile floor coverings. 4 50 91 Clocks and watches and parts thereof. 4 51 41 Raw hides and skins (excluding furskins) and leather 4 52 93 Arms and ammunition; parts and accessories thereof. 3 53 50 Silk 2 54 05 Products of animal origin, not elsewhere specified or included 1 55 64 Footwear, gaiters and the like; parts of such articles 0 56 31 Fertilizers. 0
Source: own calculations As is the case with the calculations for South Africa, following the hypothetical FTA, trade diversion in India is closely related to trade creation, with precious stones and metals for jewellery, coal, iron and steel, basic chemicals and machinery featuring prominently. Given the choice of the import price and substitutions elasticities – although rather arbitrary as both were assigned the value of unity – trade creation is slightly larger than trade diversion. The largest gains of trade creation over trade diversion are expected to be recorded for precious stones and metals, inorganic chemicals, and basic iron and steel. 3.4 Revealed comparative advantage and revealed trade barriers Since trade creation effects are not relevant to products that are currently not traded, it may be useful to consider an application of the theory of revealed comparative advantage for the
25
identification of de facto barriers to trade. According to Jachia and Teljeur (1998), this information may prove valuable during the negotiations for any free trade agreement, as the main “offensive interest”, i.e. important tariff lines that the negotiators should target as a valuable inclusion in the tariff phase-down schedule, need to be identified The starting point of RTB is the concept of revealed comparative advantage, which suggests that a comparative advantage is "revealed" in a particular commodity if its share in the country’s export basket is larger than the share of the commodity’s world trade in total world trade. In other words, is the commodity more important to South Africa's export than to world trade? This construction can be extended in order to evaluate RTB. With regard to Indian imports, the question is then: To what degree is a commodity's share of imports in the import basket from South Africa larger or smaller than the share of total imports of that commodity in India’s total import basket (summed over all products)? In other words: Are the imports of a particular commodity from South Africa relatively more or less important compared to total Indian imports from all sources of that commodity? If the RTB ratio is less than 1 we may conclude that South Africa is exporting a commodity relatively more to the rest of the world than it is to India, possibly due to trade barriers in India (see Appendix 3 for details). We use UNComTrade data as published by Statistics Canada’s World Trade Analyser system. Revealed comparative advantages for South Africa at the SITC2 level are shown in the next table. Table 18: Reveal comparative advantage for South Africa for selected SITC2 commodities, 1998
SITC2 Description
Total SACU Exports (US$ million) RCA index
1. 32 Coal, coke and briquettes 1,462.13 18.23 2. 28 Metalliferous ores and metal scrap 1,302.41 7.95 3. 06 Sugar, sugar preparations and honey 363.37 6.01 4. 25 Pulp and waste paper 354.43 5.65 5. 52 Inorganic chemicals 602.86 5.32 6. 93 Special transactions and commod, not class.t 2,661.77 4.83 7. 94 Animals, live, zoo animals, dogs, cats etc. 6.38 4.62 8. 27 Crude fertilizers and crude materials (excl. coal) 187.35 3.80 9. 66 Non-metallic mineral manufactures, n.e.s. 1,460.23 3.75 10. 05 Vegetables and fruit 938.33 3.58 11. 21 Hides, skins and furskins, raw 69.58 3.18 12. 67 Iron and steel 1,447.25 2.73 13. 56 Fertilizers, manufactured 146.73 2.59 14. 82 Furniture and parts thereof 467.38 2.26 15. 26 Textile fibres (except wool tops) and their wastes 163.52 2.13 16. 11 Beverages 262.25 2.13 17. 62 Rubber manufactures, n.e.s. 310.70 1.95 18. 61 Leather, leather manuf., n.e.s. and dressed furskins 141.13 1.72 19. 24 Cork and wood 184.27 1.46 20. 03 Fish, crustaceans, molluscs, preparations thereof 252.64 1.43 21. 68 Non-ferrous metals 434.47 1.19 22. 59 Chemical materials and products, n.e.s. 264.24 1.14 23. 64 Paper, paperboard, artic. of paper, paper-pulp/board 390.37 1.10 24. 04 Cereals and cereal preparations 212.14 1.03 25. 12 Tobacco and tobacco manufactures 88.78 1.01 26. 29 Crude animal and vegetable materials, n.e.s. 67.89 1.00
Source: own calculations It can be seen that South Africa’s revealed comparative advantage remains with natural resource-based commodities or their immediate downstream products. In the next table, we present the results of the application of model of India’s RTB with respect to South Africa’s exports. It can be seen that the majority of the product lines show a RTB value that is lower than 1, which indicates that South Africa’s exports are relatively undertraded in the Indian
26
market relative to imports from the rest of the world. However, the trade values involved are relatively modest. Table 19: Revealed trade barriers for South African exports to India for selected SITC2 commodities, 1998
SITC2 Description
Total SACU Exports (US$ million) RTB index
1. 00 Live animals chiefly for food 6 0.00 2. 01 Meat and meat preparations 49 0.00 3. 03 Fish, crustaceans, molluscs, preparations thereof 253 0.00 4. 07 Coffee, tea, cocoa, spices, manufactures thereof 73 0.00 5. 08 Feeding stuff for animals, not incl. unmil. cereals 10 0.00 6. 12 Tobacco and tobacco manufactures 89 0.00 7. 34 Gas, natural and manufactured 7 0.00 8. 42 Fixed vegetable oils and fats 34 0.00 9. 81 Sanitary, plumbing, heating and lighting fixtures 19 0.00 10. 83 Travel goods, handbags and similar containers 12 0.00 11. 85 Footwear 15 0.00 12. 94 Animals, live, zoo animals, dogs, cats etc. 6 0.00 13. 95 Arms, of war and ammunition therefor 0 0.00 14. 93 Special transactions and commod., not class.t 2,662 0.00 15. 88 Photographic apparatus, optical goods, watches 26 0.00 16. 56 Fertilizers, manufactured 147 0.01 17. 66 Non-metallic mineral manufactures, n.e.s. 1,460 0.02 18. 43 Animal-vegetable oils-fats, processed, and waxes 9 0.03 19. 11 Beverages 262 0.03 20. 54 Medicinal and pharmaceutical products 90 0.04 21. 79 Other transport equipment 337 0.04 22. 24 Cork and wood 184 0.05 23. 06 Sugar, sugar preparations and honey 363 0.08 24. 74 General industrial machinery and equipment, and parts 390 0.09 25. 22 Oil seeds and oleaginous fruit 29 0.09 26. 29 Crude animal and vegetable materials, n.e.s. 68 0.10 27. 84 Articles of apparel and clothing accessories 155 0.10 28. 75 Office machines and automatic data processing equip. 137 0.10 29. 02 Dairy products and birds' eggs 60 0.11 30. 04 Cereals and cereal preparations 212 0.11 31. 76 Telecommunications and sound recording apparatus 210 0.11 32. 63 Cork and wood manufactures (excl. furniture) 82 0.12 33. 58 Artif. resins, plastic mat., cellulose esters/ethers 135 0.13 34. 73 Metalworking machinery 34 0.13 35. 59 Chemical materials and products, n.e.s. 264 0.15 36. 72 Machinery specialized for particular industries 651 0.15 37. 05 Vegetables and fruit 938 0.16 38. 61 Leather, leather manuf., n.e.s. and dressed furskins 141 0.16 39. 97 Gold, non-monetary 16 0.17 40. 71 Power generating machinery and equipment 198 0.22 41. 82 Furniture and parts thereof 467 0.25 42. 89 Miscellaneous manufactured articles, n.e.s. 237 0.26 43. 77 Electrical machinery, apparatus and appliances n.e.s. 312 0.31 44. 87 Professional, scientific and controlling instruments 122 0.34 45. 21 Hides, skins and furskins, raw 70 0.39 46. 23 Crude rubber (including synthetic and reclaimed) 19 0.42 47. 55 Essential oils and perfume mat.; toilet-cleansing mat 111 0.44 48. 53 Dyeing, tanning and colouring materials 90 0.52 49. 33 Petroleum, petroleum products and related materials 92 0.56 50. 09 Miscel. Edible products and preparations 47 0.60 51. 69 Manufactures of metal, n.e.s. 382 0.62 52. 62 Rubber manufactures, n.e.s. 311 0.65 53. 65 Textile yarn, fabrics, made-upart., related products 293 0.86 54. 27 Crude fertilizers and crude materials (excl. coal) 187 0.92 55. 28 Metalliferous ores and metal scrap 1,302 1.60 56. 26 Textile fibres (except wool tops) and their wastes 164 1.82 57. 78 Road vehicles (incl. air cushion vehicles 1,150 2.01 58. 68 Non-ferrous metals 434 2.03 59. 51 Organic chemicals 361 2.45 60. 64 Paper, paperboard, artic. of paper, paper-pulp/board 390 2.91 61. 41 Animal oils and fats 1 3.17 62. 52 Inorganic chemicals 603 4.55 63. 67 Iron and steel 1,447 4.86 64. 25 Pulp and waste paper 354 10.54 65. 32 Coal, coke and briquettes 1,462 11.03
Source: own calculations
27
Moreover, it is shown that not all South African commodities that have relatively low access to the Indian market currently display high volumes of trade. South African policy-makers would probably want to note that coal, iron and steel, as well as non-ferrous metals, are the more traditional exports with relatively high imports (in terms of values) that are not undertraded in the Indian market. However, more interesting commodity groups are motor vehicles (row 57), which are also not undertraded. On the other hand, other transport equipment (row 21), as well as a range of machinery and electrical machinery product groups (see amongst others rows 34, 36 and 40) and a number of food product groups, export more to the rest of the world than to the Indian market. There may be some potential to focus the negotiations on these product groups. Turning to India's exports, the main product groups in which the country has a revealed comparative advantage are non-metallic minerals, textiles, clothing and food products. Other manufactures such as machinery and electronics are less important. Table 20: Revealed comparative advantage for India for selected SITC2 commodities, 1998
SITC2 Description
Total Indian Exports (US$ million) RCA index
1. 99 Unclassified 7,469.57 8.04 2. 66 Non-metallic mineral manufactures, n.e.s. 5,297.65 6.78 3. 07 Coffee, tea, cocoa, spices, manufactures thereof 1,179.96 4.57 4. 08 Feeding stuff for animals, not incl. unmil. cereals 653.82 4.21 5. 65 Textile yarn, fabrics, made-upart., related products 4,953.42 4.16 6. 61 Leather, leather manuf., n.e.s. and dressed furskins 683.34 4.15 7. 29 Crude animal and vegetable materials, n.e.s. 525.04 3.84 8. 27 Crude fertilizers and crude materials (excl. coal) 347.97 3.51 9. 83 Travel goods, handbags and similar containers 379.79 3.45 10. 84 Articles of apparel and clothing accessories 4,826.45 3.41 11. 28 Metalliferous ores and metal scrap 993.82 3.02 12. 03 Fish, crustaceans, molluscs, preparations thereof 1,045.40 2.94 13. 53 Dyeing, tanning and colouring materials 463.33 2.11 14. 22 Oil seeds and oleaginous fruit 198.25 1.73 15. 51 Organic chemicals 1,346.62 1.61 16. 04 Cereals and cereal preparations 561.69 1.36 17. 05 Vegetables and fruit 695.77 1.32 18. 42 Fixed vegetable oils and fats 186.99 1.19 19. 81 Sanitary, plumbing, heating and lighting fixtures 160.71 1.16 20. 85 Footwear 343.05 1.12 21. 69 Manufactures of metal, n.e.s. 878.14 1.05 22. 12 Tobacco and tobacco manufactures 175.48 0.99 23. 67 Iron and steel 1,017.61 0.96 24. 26 Textile fibres (except wool tops) and their wastes 131.64 0.85 25. 43 Animal-vegetable oils-fats, processed, and waxes 19.62 0.73
Source: own calculations The degree to which India's exports are represented in the South African market can be examined in the next table. It can be seen that Indian exports of a large number of SITC2 product groups are underrepresented in the South African market.
28
Table 21: Revealed trade barriers for Indian exports to South Africa, 1998
SITC2 Description
Total Indian Exports (US$ million) RTB index
1. 00 Live animals chiefly for food 7 0.00 2. 01 Meat and meat preparations 96 0.00 3. 02 Dairy products and birds' eggs 12 0.00 4. 21 Hides, skins and furskins, raw 1 0.00 5. 25 Pulp and waste paper 1 0.00 6. 32 Coal, coke and briquettes 8 0.00 7. 34 Gas, natural and manufactured 2 0.00 8. 41 Animal oils and fats 0 0.00 9. 56 Fertilizers, manufactured 11 0.00 10. 94 Animals, live, zoo animals, dogs, cats etc. 0 0.00 11. 95 Arms, of war and ammunition therefor 3 0.00 12. 97 Gold, non-monetary 20 0.00 13. 79 Other transport equipment 55 0.00 14. 33 Petroleum, petroleum products and related materials 161 0.00 15. 12 Tobacco and tobacco manufactures 175 0.00 16. 76 Telecommunications and sound recording apparatus 128 0.02 17. 75 Office machines and automatic data processing equip. 145 0.03 18. 28 Metalliferous ores and metal scrap 994 0.07 19. 26 Textile fibres (except wool tops) and their wastes 132 0.07 20. 24 Cork and wood 8 0.09 21. 64 Paper, paperboard, artic. of paper, paper-pulp/board 53 0.09 22. 23 Crude rubber (including synthetic and reclaimed) 10 0.10 23. 78 Road vehicles (incl. air cushion vehicles 533 0.16 24. 11 Beverages 5 0.16 25. 06 Sugar, sugar preparations and honey 40 0.20 26. 43 Animal-vegetable oils-fats, processed, and waxes 20 0.22 27. 71 Power generating machinery and equipment 321 0.22 28. 74 General industrial machinery and equipment, and parts 360 0.24 29. 88 Photographic apparatus, optical goods, watches 38 0.27 30. 63 Cork and wood manufactures (excl. furniture) 65 0.30 31. 73 Metalworking machinery 44 0.30 32. 68 Non-ferrous metals 150 0.34 33. 09 Miscel. edible products and preparations 39 0.37 34. 72 Machinery specialized for particular industries 255 0.42 35. 87 Professional, scientific and controlling instruments 124 0.45 36. 55 Essential oils and perfume mat.; toilet-cleansing mat 163 0.49 37. 42 Fixed vegetable oils and fats 187 0.51 38. 58 Artif. resins, plastic mat., cellulose esters/ethers 252 0.63 39. 27 Crude fertilizers and crude materials (excl. coal) 348 0.70 40. 59 Chemical materials and products, n.e.s. 134 0.74 41. 77 Electrical machinery, apparatus and appliances n.e.s. 612 0.76 42. 93 Special transactions and commod., not class.t 122 0.77 43. 03 Fish, crustaceans, molluscs, preparations thereof 1,045 0.90 44. 82 Furniture and parts thereof 149 1.01 45. 89 Miscellaneous manufactured articles, n.e.s. 1,205 1.03 46. 52 Inorganic chemicals 106 1.13 47. 54 Medicinal and pharmaceutical products 483 1.21 48. 83 Travel goods, handbags and similar containers 380 1.26 49. 66 Non-metallic mineral manufactures, n.e.s. 5,298 1.28 50. 67 Iron and steel 1,018 1.33 51. 51 Organic chemicals 1,347 1.39 52. 05 Vegetables and fruit 696 1.57 53. 62 Rubber manufactures, n.e.s. 226 1.72 54. 81 Sanitary, plumbing, heating and lighting fixtures 161 1.75 55. 53 Dyeing, tanning and colouring materials 463 2.33 56. 69 Manufactures of metal, n.e.s. 878 2.36 57. 22 Oil seeds and oleaginous fruit 198 3.32 58. 08 Feeding stuff for animals, not incl. unmil. cereals 654 3.47 59. 85 Footwear 343 3.64 60. 65 Textile yarn, fabrics, made-upart., related products 4,953 4.92 61. 07 Coffee, tea, cocoa, spices, manufactures thereof 1,180 5.02 62. 84 Articles of apparel and clothing accessories 4,826 6.33 63. 04 Cereals and cereal preparations 562 9.61 64. 29 Crude animal and vegetable materials, n.e.s. 525 11.34 65. 61 Leather, leather manuf., n.e.s. and dressed furskins 683 15.89
Source: own calculations However, their total export values are relatively modest. The exceptions are metalliferous ores and metal scrap (row 18) and motor vehicles (row 23), some of the electrical machinery commodities (see row 41), and prepared fish (see row 43).
29
4 CONCLUSIONS In terms of trade flows, South African imports from India are concentrated in textiles & clothing, vegetable products and raw hides and leather, while exports to India are more diversified with contributions made by mineral products, chemicals, base metals, textiles and pulp and paper. The tariff structure on South Africa imports from India shows an estimated import weighted average (book) rate of about 12%. Particularly high rates are imposed on textiles & clothing and footwear and wood products with 27%, 24% and 18% unweighted average tariffs respectively. All other groups of commodities, at least at the 22 Chapter level, are treated with an average rate of about 10% or less. On the other side of the bilateral trade flows, South African exports to India are faced with an average tariffs of 24%. Of particular concern to South African trade negotiators are broad commodities such as motor vehicles and machinery, for which duties of 40% on average apply. In addition, considerable intraindustry trade relative to South Africa's total exports were shown to apply to a range of relatively narrow defined HS4 level commodity groups, amongst others, groups associated with motor vehicles. From the point of view of trade creation/diversion, South Africa should focus on the textiles, clothing, leather, and electrical machinery commodities. It is in these product groups that imports from India are expected to make some inroads. Also, with zero tariffs on Indian imports, these commodities will be subject to considerable trade diversion. In other words, imports of these commodities, which are currently sourced from other countries, will be replaced by imports from India. Commodities such as food products, metals products and heavy machinery require less attention as far as trade creation and trade diversion in South Africa are concerned. From India's point of view, a potential FTA with South Africa could raise concerns of trade creation and trade diversion for precious metals for jewellery, coal, iron and steel, basic chemicals, machinery and some non-metallic minerals such as cement. The RTB analysis shows that Indian exports of textiles and clothing as well as footwear and wood products are overtraded in the South African market, i.e., South African imports of these groups of commodities are sourced relatively more from India than other countries. This suggests that there is no RTB for these commodity groups. On the other hand, a large range of Indian commodities with small trade volumes are relatively undertraded in the South African, which suggests that the same applies to South African exports to India. Commodities with large trade volumes are over-represented in the Indian market, compared to the average basket of Indian imports, including coal, iron and steel, pulp and paper and motor vehicles. Interestingly, for iron and steel and vehicles, this occurs in spite of relatively high trade barriers.
30
REFERENCES Gumede, V. 2000: Import Performance And Import Demand Functions For South Africa, TIPS Working Paper no 9. Jachia, L and Teljeur E. 1998: Free Trade with Europe – the Winners and Losers, Results of the SMART Simulation, TIPS Working Paper no 11, July. Tsikata, YM. 1999: Southern Africa: Trade, Liberalization and Implications for a Free Trade Area, Paper presented at the 1999 TIPS Forum. van Seventer, DEN. 2001: Note on Tariff Schedule, Apr 2001, Draft prepared for TIPS Trade Policy Review Workshop, Johannesburg, May 2001.
31
APPENDIX 1: TRADE INTENSITY INDEX METHODOLOGY The trade intensity index is an index of intensity of India’s (South Africa’s) export trade with South Africa (India) relative to its exports to the rest of the world and can be defined as: (A.1.1) [ ] ( )[ ]
iw
j
i
ij
XXX
MM
ijm −= where Mij = South African imports from India Mi = total imports of South Africa Xw = total world exports (trade) Xi , Xj = total South African export and total export of India respectively The index of intensity of India’s import trade with South Africa is defined as: (A.1.2) [ ] ( )[ ]
jw
i
i
ij
MXM
XX
ijx −=
where Xij = South African exports to India Xw = total world imports (trade) Mj = total imports of India
32
APPENDIX 2: TRADE CREATION AND TRADE DIVERSION METHODOLOGY The methodology employed here is comparatively simple, without onerous data requirements, which can be used to evaluate the impact of changing tariff levels on trade patterns at a disaggregated commodity level. Following a hypothetical free trade arrangement between South Africa and India, the following changes in trade flows between the two countries and third countries can amongst others be distinguished: Trade creation (TC), which measures the increase in imports from India due to a decrease
in the relative price of these imports vis-à-vis domestically produced goods, resulting in a net increase in South Africa's total imports and a net decrease in South Africa's domestic production; and
Trade diversion (TD), which measures the increase in South Africa imports from India due to a decrease in the relative price of these imports vis-à-vis imports from other countries resulting in a different geographical composition of imports, whereby imports from India increase at the expense of imports from other sources, with no change in total South African imports.
Trade creation is considered to be welfare enhancing since relatively high-costs domestic production is replaced with lower-cost imports from India. Nevertheless South Africa has to face the decline of local, albeit less efficient, production. Trade diversion is considered to be welfare lowering in that South Africa switches its source of imports from a more efficiently producing country to a less efficiently producing country, leading to a less efficient allocation of resources, although the total import bill remains unchanged. A2.1 Trade Creation Trade creation follows directly from the formulation of the import price elasticity:
(A2.1a) jj
jjj PP
MMEm
∆
∆=
in which Emj is the percentage change in the demand for imports of good j (∆Mj / Mj ) when the price of the imports (Pj) on the domestic market increases by 1% (∆Pj / Pj ), Mj is the current value of imports of good j and ∆Mj its change, i.e., the trade creation. Equation (A2.1a) can be rewritten as:
(A2.1b) j
jjjjj P
PMEmMTC
∆=∆= **
If Tj,0 and Tj,1, are the tariff of good j before and after the free trade agreement comes in effect respectively we can define the relative price increase as:
(A3.1c) ( ) ( )
( )j
jj
j
j
TTT
PP
,0
,0,1
111
+
+−+=
∆
If we assume that T1,j=0, i.e., the new tariff under the free trade area is set to zero, then, eqn (2.1c) changes into:
33
(A2.1d) ( )j
jjjj T
TMEmTC
,0
,0
1**
+
−=
A number of issues remain unresolved in this formulation. Firstly, are products from India and the rest of the world perfect substitutes? If so, one is assuming that elasticity of import demands are equivalent. Secondly, the problem is that if this is the case then we would see zero imports from India initially as all imports of the product would be sourced from the cheapest country somewhere else in the rest of the world. A2.2 Trade Diversion Continuing with trade diversion, this is a more complicated matter in that it involves the imports from sources other than India. As a starting point, it is useful to first consider the change in price of imports from India relative to that of other sources. This relative price change follows a preferential liberalisation (such as a South Africa – India Free Trade Area), which brings the tariffs on imports from India down to zero whilst retaining an unchanged positive tariff on imports from other sources. The relative price change between imports from India and other sources can be written as follows:
(A2.2a)
( )( )( )( )
1
1111
,0
,0
,1
,1
−
+
+
+
+
=
∆
RoWj
Indiaj
RoWj
Indiaj
RoWj
Indiaj
RoWj
Indiaj
TTTT
PP
PP
This formulation can be simplified by assuming no change in the tariffs applicable to imports from other sources, i.e.: (A2.2b) RoW
jRoWj TT ,0,1 =
Moreover, as before we assume full liberalisation in which the tariff after the free trade arrangement is set to zero, (A2.2c) 0,1 =India
jT Substituting eqn (2.2b) and (2.2c) into eqn (2.2a) yields:
(A2.2d) ( )Indiajo
Indiajo
RoWj
Indiaj
RoWj
Indiaj
TT
PP
PP
,
,
1 +=
∆
Trade diversion follows from the formulation of the elasticity of substitution. The elasticity of substitution tells us how import demand will shift from the rest of the world (RoW) to India as the price of Indian imports changes relative to RoW imports.
34
(A2.2e)
∆
∆
=
RoWj
Indiaj
RoWj
Indiaj
RoWj
Indiaj
RoWj
Indiaj
j
PP
PP
MM
MM
Es
For example if Esj = -3, then a 1 % fall in the relative price of Indian imports would result in a 3 % increase in the relative demand for Indian imports. We generally ignore the negative sign of Es., i,e redefine elasticity to be –Es. For purposes of calculating trade diversion we want to find ∆Mj
India. Similar to the trade creation formulation, we can rewrite the elasticity of substitution as follows
(A2.2f)
∆
=
∆ RoW
j
Indiaj
RoWj
Indiaj
RoWj
Indiaj
jRoWj
Indiaj
MM
PP
PP
EsMM
**
Applying the quotient rule of differentiation to the left hand side of (A2.2f) we can proceed with:
(A2.2g) ( )2
**RoWj
RoWj
Indiaj
Indiaj
RoWj
RoWj
Indiaj
M
MMMMMM ∆−∆
=
∆
If net trade is assumed not to be effected, i.e.: (A2.2h) RoW
jIndiaj MM ∆−=∆
substituting eqn (A2.2h) and (A2.2g) into (A2.2f) results in:
(A2.2i) ( )( )RoW
jIndiaj
RoWj
Indiaj
RoWj
Indiaj
RoWj
Indiaj
jIndiajj MM
MM
PP
PP
EsMTD+
∆
=∆=*
**
Finally, given our formulation of relative price changes in (A2.2d) we can rewrite (A2.2i) as follows:
(A2.2j) ( )
RoWj
Indiaj
Indiajo
IndiajoRoW
jIndiaj
Indiajj MM
EsT
TMM
MTD+
+=∆=
*1
**,
,
Note that the UNCTAD formulation, reported by Jachia and Teljeur (1998) adds an additional term to the denominator that is equal to:
35
( ) EsT
TM India
jo
IndiajoIndia
j *1 ,
,
+
While Tsikata (1999: 42) employs the following formulation to calculate trade diversion (A2.3) TDj = TCj * Es Clearly, with an elasticity of substitution of unity, the amount of trade diversion is equal to trade creation. In order to evaluate the impact of the FTA, it is useful to analyse the import and export sides separately. The formulation for the export side is analogue to eqns (2.1) and (2.2) above except that the symbol M refers to Indian imports and the superscript India changes to South Africa indicating South African exports to India.
36
APPENDIX 3: REVEALED TRADE BARRIER METHODOLOGY The starting point of revealed trade barriers is the theory of revealed comparative advantage. This theory suggests that a country’s exports shows a revealed comparative advantage in a particular commodity if its share in the country’s export basket is larger than the share of the commodity’s world trade in total world trade. In other words: Is the commodity more important to South Africa's export than to world trade? Formally:
A3.1 ∑∑∑
∑=
i kik
iik
kik
ikik X
X
XXRCA
in which Xik is export of country i in product k. This construction can be extended in order to evaluate revealed trade barriers (RTB). With regard to Indian imports, the question is then: To what degree is a commodity's share of imports in the import basket from South Africa larger or smaller than the share of total imports of that commodity in India’s total import basket (summed over all products)? In other words: Are the imports of a particular commodity from South Africa relatively more or less important compared to total Indian imports from all sources of that commodity? Formally:
A3.2 ∑∑
∑
∑=
i k
jik
i
jik
k
jik
jikj
ik M
M
MM
RTB
in which j
ikM is country j’s imports from country i of product k. If the ratio is less than 1 we may conclude that South Africa is exporting a commodity relatively more to the rest of the world than it is to India, possibly due to trade barriers in India.


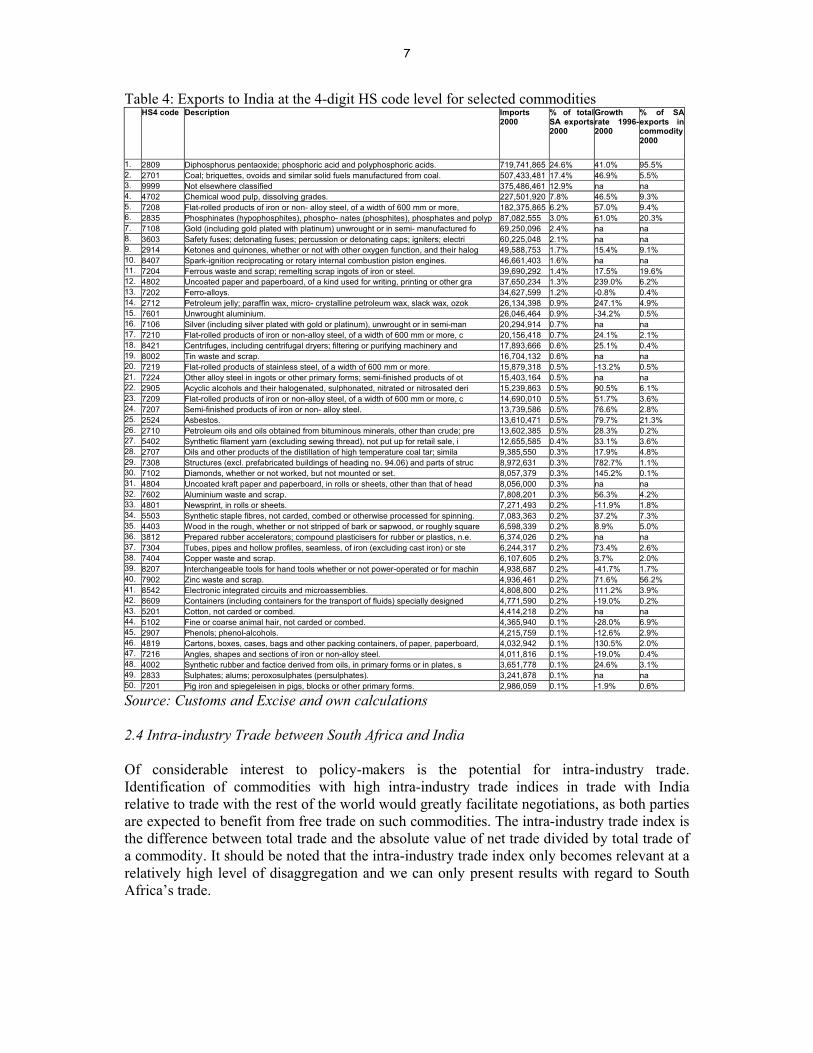
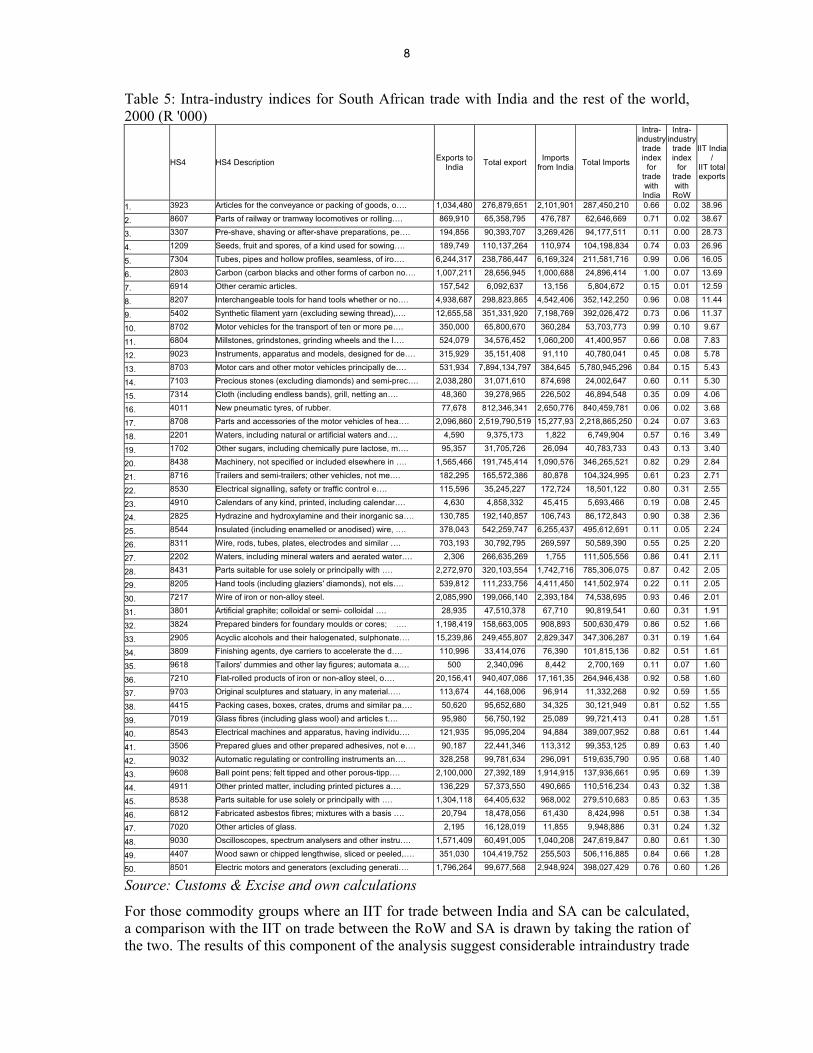


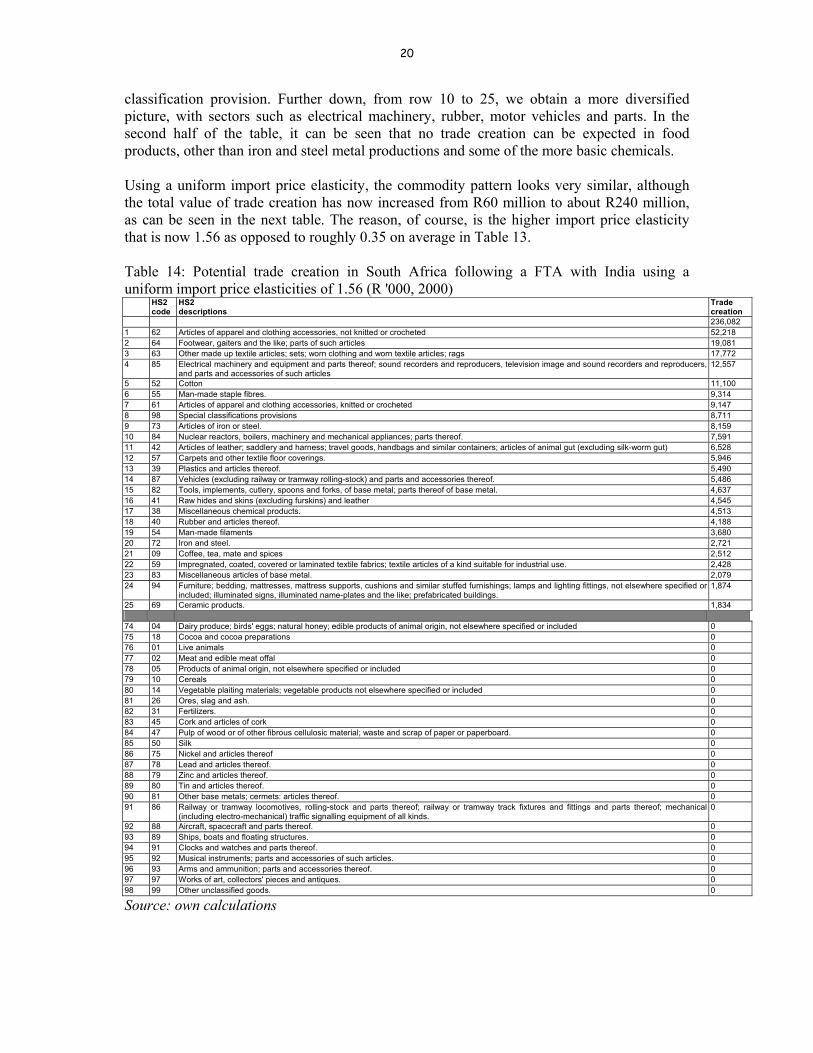


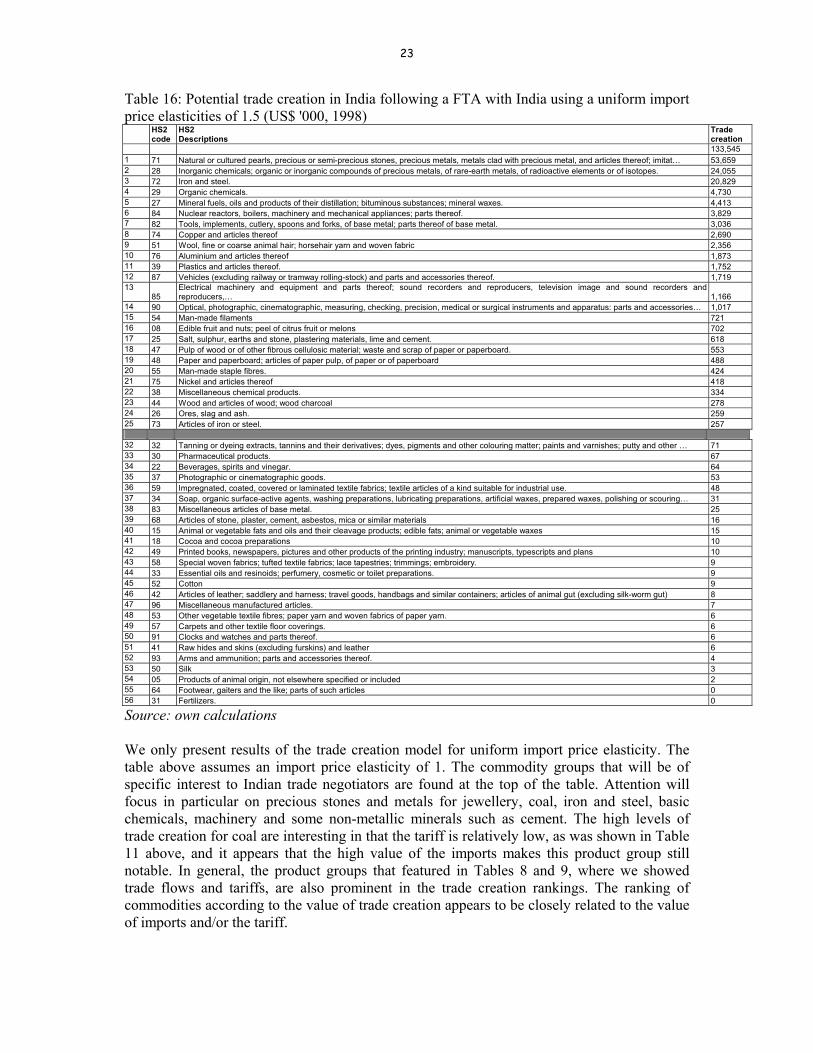


![Erik van Seventer Program Manager Biobased Economy ... EU BRIDGE RTO's EvS.pdfMicrosoft PowerPoint - Ppt0000007 [Alleen-lezen] Author: WEEN0001 Created Date: 5/29/2013 4:48:57 PM ...](https://static.documents.pub/doc/80x56/601b4c9db691c678d96f00db/erik-van-seventer-program-manager-biobased-economy-eu-bridge-rtos-evspdf-microsoft.jpg)