25
A Frequency-based RF Partial Discharge Detector for Low- power Wireless Sensing
| Date post: | 05-Aug-2015 |
| Category: |
Engineering |
| Upload: | swathi-venugopal |
| View: | 133 times |
| Download: | 3 times |

A Frequency-based RF Partial Discharge Detector for Low-power Wireless Sensing

index
INTRODUCTIONRf pd monitoringPD frequency characteristicsWireless sensor networkDetector requirementDETECTOR OVERVIEWOUTPUT DATALaboratory case studyCONCLUSIONReference

INTRODUCTION
PARTIAL DISCHARGE“Partial discharge is a localized dielectric break down of a solid or fluid electrical insulation system under high voltage stress”
Degradation in dielectric insulation during operational life time or manufacturing time Leads to internal arcing
NEED FOR DETECTION
• To avoid equipment failure• Ensure equipment uptime• Mitigate business risk
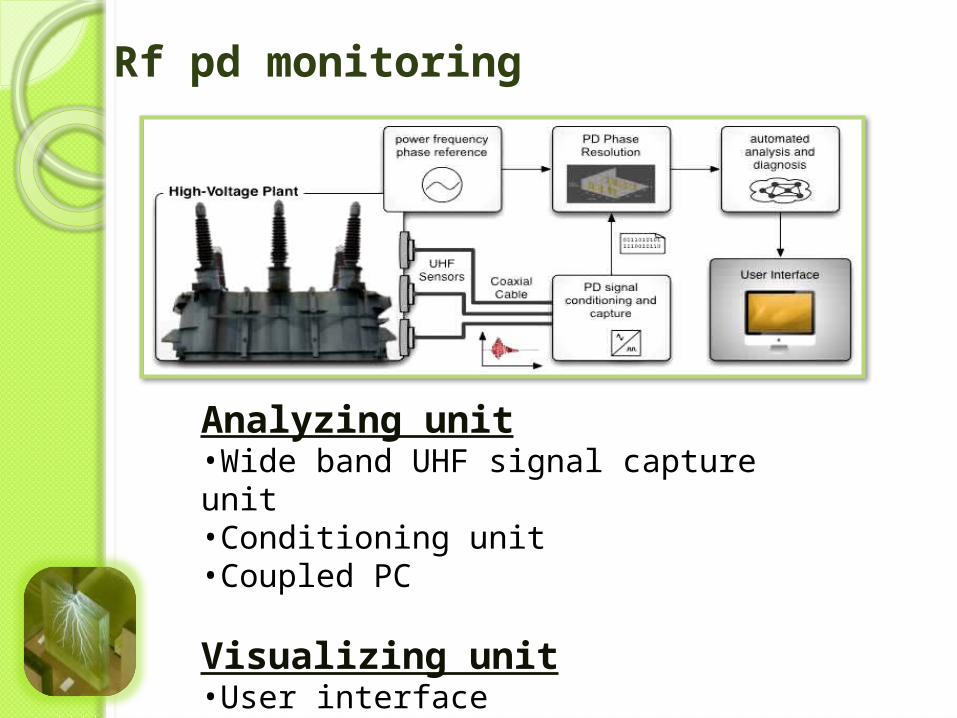
Rf pd monitoring
Analyzing unit•Wide band UHF signal capture unit•Conditioning unit•Coupled PC
Visualizing unit•User interface
Disadvantages
•It requires a large processing capability to capture UHF signals•Not viable to install in all high voltage plants
Advantages
• Effective & accurate tool.•GIS & oil filled transformer.

PD frequency characteristics
•Defect-specific information used for classification based on frequency spectrum.
•The relationship between PD source and sensor in terms of geometry and distance due to complex propagation effects

Wireless sensor network
wide-range of monitoring applications. Ad-hoc network with redundant links.Sensory data is passed back through data aggregation nodes to a wired network Data is presented to monitoring engineers.Integrated computing platform;Encapsulating sensing, processing, data storage, communications & power components in a single compact Package.

Disadvantages
Degrading effect of Impulsive noise emitted by PDs on wireless data channels.
Advantages
Low costAbsence of potentially hazardous cabling Reduced bandwidth requirements High capacity communication links b/w substations &corporate networks.

Detector requirement
Functional requirementsSensing & recordingintensity of PD signals & relative spectral magnitudesDifferentiation of PD from RF noiseRelatively smallInterface with RF sensors ( plant enclosures)
A Low-power 3channel detector-

DETECTOR OVERVIEW
DETECTOR FREQUENCY BANDS
Band Range
Lower 0 – 450 MHz
Middle 400 – 750 MHz
Upper 700 – 3200 MHz
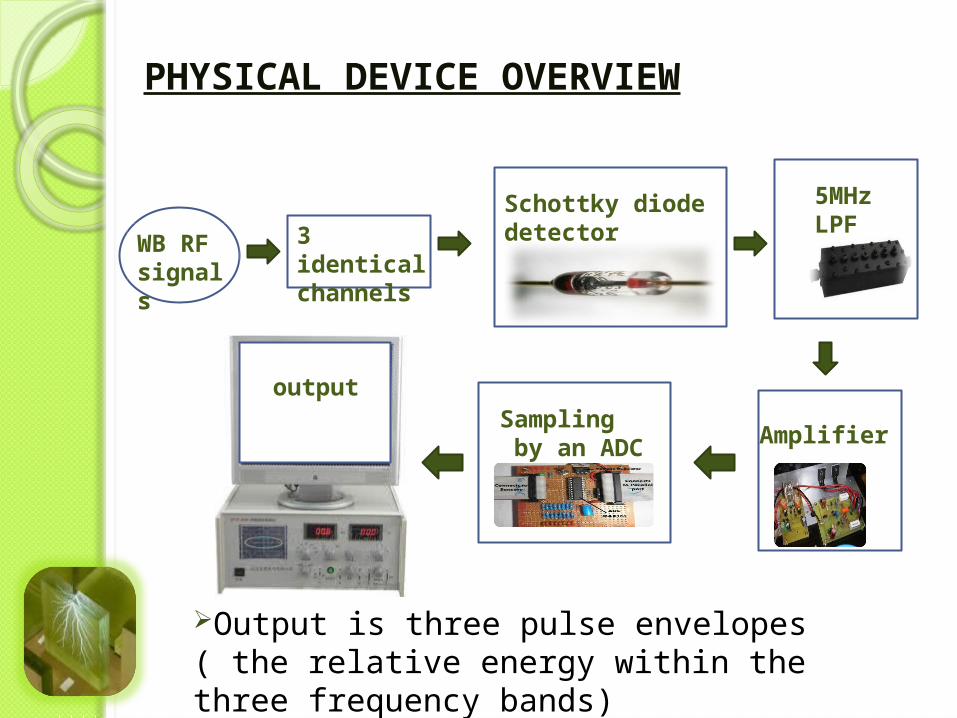
3 identical channels
Schottky diode detector
5MHz LPF
Amplifier
PHYSICAL DEVICE OVERVIEW
Sampling by an ADC
output
WB RF signals
Output is three pulse envelopes ( the relative energy within the three frequency bands)

OUTPUT DATA• Peak value of the PD envelope for three discrete frequency bands.
•Values are then normalized into a proportional form,
•It represents the relative spectral energies within the PD signal. •The total magnitude of the captured sample is also included as a feature, as the sum of the three channels.

Test tank with three monopole RF sensors.
Addition panel with RF PD sensor types.Three test cells.
A 50kV foster transformer, energized up to 15kV to generate PDs within each of the cells. Cells filled with SF6, pressurized at 2 bar .
Laboratory case study

Two of the test cells. On the left is the floating electrode in SF6 test cell, and on the right is the rolling particle in SF6 test cell..
Internal view of RF test tank,
Defect positions within the test tank

•Two positions are available within the test tank-in front of the sensor hatch and in the center of the test tank.
• limiting factors -position of the transformer and the length of the high-voltage cables .
•Safer operation directly beneath the sensor hatch, .
•The floating electrode test cell was oriented in three planes to simulate the RF emission of an individual defect propagating in different directions.

EXPERIMENTAL RESULTSProtrusion in sf6:
1

• The spectra varies in intensity betweenthe lower and middle bands, but have less than a 10% proportion of high-frequency content.
•The results fall into two distinct clusters, corresponding to two positions.
•That multiple protrusion defects in SF6 & can be distinguished based upon frequency spectra.

2

•PDs generated by this test cell were found to form a Tight cluster.
•The defect orientation have little effect on the recorded RF spectrum.
• higher proportion of spectral energy in the >700 MHz band, differentiating them from the floating particle and protrusion.

3 Rolling particle in sf6

•The results from both positions fall within the same region of the chart, with half the spectral energy falling within the middle 400MHz-750MHz band.
• The remaining spectral energy variesbetween the upper and lower bands based upon position.
•Results from each position are uniform with minor variance, falling in tight clusters.defect test cell is uniform, and the measured spectrum varies only with location.

CONCLUSION:
Novel approach to RF PD monitoring using a low-powered detector employing frequency-based technique.
Capable of determining the presence of multiple defects, & rudimentary defect classification.
Ternary plots have been used for the presentation and analysis of the PD data, allowing linear separation of defects

Reference
•P. C. Baker, S. D. J. McArthur, and M. D. Judd, “Data Management ofOn-Line Partial Discharge Monitoring Using Wireless Sensor NodesIntegrated with a Multi-Agent System”, Intern. Conf. IntelligentSystems Applications to Power Systems (ISAP), pp. 1–6, 2007.
•Z. Tang, C. Li, X. Cheng, W. Wang, J. Li, and J. Li, “Partial dischargelocation in power transformers using wideband RF detection”,
•IEEE Transactions on Dielectrics and Electrical Insulation Vol. 17, No. 1; February 2010 ”A Frequency-based RF Partial Discharge Detector for Low-power Wireless Sensing” P. C. Baker, M. D. Judd and S. D. J. McArthur

Thank you


