A Fundamental Study of Refrigerant Line Transients ACRCCR-4 For additional information: Air Conditioning and Refrigeration Center University of Illinois Mechanical & Industrial Engineering Dept. 1206 West Green Street Urbana, n.. 61801 (217) 333-3115 J. C. Shelton and A. M. Jacobi March 1995
Transcript
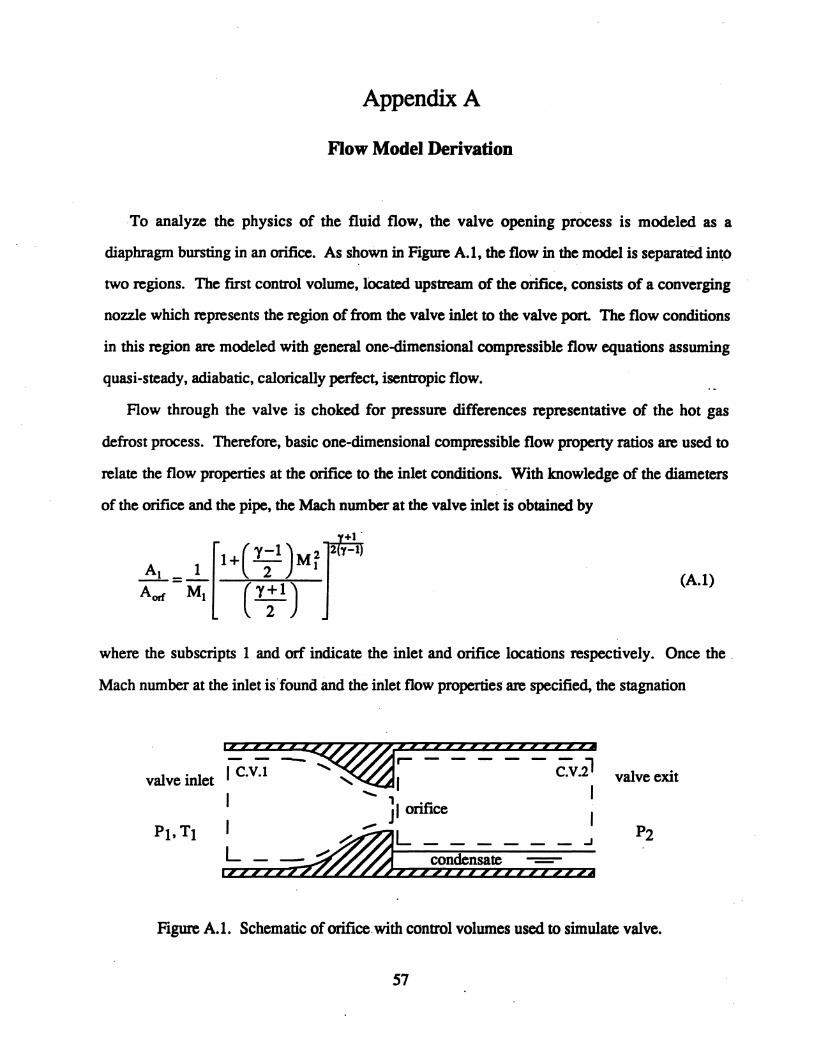
A Fundamental Study of Refrigerant Line Transients
ACRCCR-4
For additional information:
Air Conditioning and Refrigeration Center University of Illinois Mechanical & Industrial Engineering Dept. 1206 West Green Street Urbana, n.. 61801
(217) 333-3115
J. C. Shelton and A. M. Jacobi
March 1995
The Air Conditioning and Refrigeration Center was founded in 1988 with a grant from the estate of Richard W. Kritzer, the founder of Peerless of America Inc. A State of Illinois Technology Challenge Grant helped build the laboratory facilities. The ACRC receives continuing support from the Richard W. Kritzer Endowment and the National Science Foundation. The following organizations have also become sponsors of the Center.
Acustar Division of Chrysler Amana Refrigeration, Inc. Brazeway, Inc. Carrier Corporation Caterpillar, Inc. Delphi Harrison Thennal Systems E. I. du Pont de Nemours & Co. Eaton Corporation Electric Power Research Institute Ford Motor Company Frigidaire Company General Electric Company Lennox International, Inc. Modine Manufacturing Co. Peerless of America, Inc. U. S. Anny CERL U. S. Environmental Protection Agency Whirlpool Corporation
For additional information:
Air Conditioning & Refrigeration Center Mechanical & Industrial Engineering Dept. University of Illinois 1206 West Green Street Urbana IL 61801
2173333115
Executive Summary
Dangerous pressure excursion incidents in industrial refrigeration systems have been attributed to condensation-induced shock and vapor-propelled liquid slugging. Because of industry trends towards the use of alternate refrigerants and centralized systems and the resulting higher localized volumes of potentially dangerous refrigerants, the occurrence of hydraulic shocks in refrigeration systems has become a critical issue. Although the initiating mechanisms of condensation-induced shock and vapor-propelled liquid slugging are not well understood, these transients have important implications on system maintenance, repair costs, system downtime, and public safety. The purpose of this research was to provide system designers and operators with methods for avoiding these transients. This objective was accomplished through the review of two-phase flow regimes, the analysis of the generic causes and resulting pressure surges of condensation-induced shock and vapor-propelled liquid slugging, and by the study of the critical flow regimes that occur in industrial refrigeration systems.
After an introduction in Chapter 1, a review of two-phase flow regimes is presented in Chapter 2. This survey includes a study of variations in flow patterns due to flow configurations, alternate fluids, and refrigerant-oil effects. In Chapter 3 the characteristics of condensationinduced shock, including the effects of various flow properties on the magnitude of the shock, are discussed. A similar review of vapor-propelled liquid slugging is presented in Chapter 4, where a discussion of the initiating mechanisms is followed by an example· analysis of the potential shock due to slug impact. Critical flow regimes are discussed in the context of industrial refrigeration systems in Chapter 5. In Chapter 6, the results are applied to develop flow models and shock maps that indicate what design and operating conditions are susceptible to hydraulic shocks. Finally, in Chapter 7, we summarize recommendations for avoiding condensation-induced shock and vapor-propelled liquid slugging in refrigeration systems. These recommendations are given in condensed form below:
• Install valves or valve combinations that allow the gradual release of flow from high . to low pressure pipes.
• Do not depend on pressure relief valves for the prevention of hydraulic shock because the transient is too fast to trigger the opening of the valve.
• A void piping configurations that trap liquid in hot-gas or suction lines. Do not allow refrigerant to condense and stand in the hot-gas main.
• Carefully and completely pump out evaporators before the initiation of hot-gas defrost.
• Do not position check valves so that liquid can become trapped between the check valve and any other device.
• Do not operate a refrigeration system in the "susceptible" region of the flow and shock maps provided in this report.
• Check the mechanical integrity of the piping system (e.g., welds) to reduce the possibility of a system failure during a hydraulic shock.
The appendices of this report present the details of the flow model, a derivation of the handbook approach for predicting flow through a valve and graphical representations of the results, shock maps valid for a wide range of designs, a detailed annotated bibliography, and a discussion of experiments that can be used to verify this theoretical study.
Through this research we have developed a rational method for predicting and preventing the occurrence of condensation-induced shock and vapor-propelled liquid slugging in refrigeration systems. This contribution was achieved by developing a detailed understanding of the twophase flow and operating conditions, by developing a theoretical model based on this understanding, and by applying this model to relevant system scenarios.
Table of Contents
Nomenclature ..................................................................................................................... iii
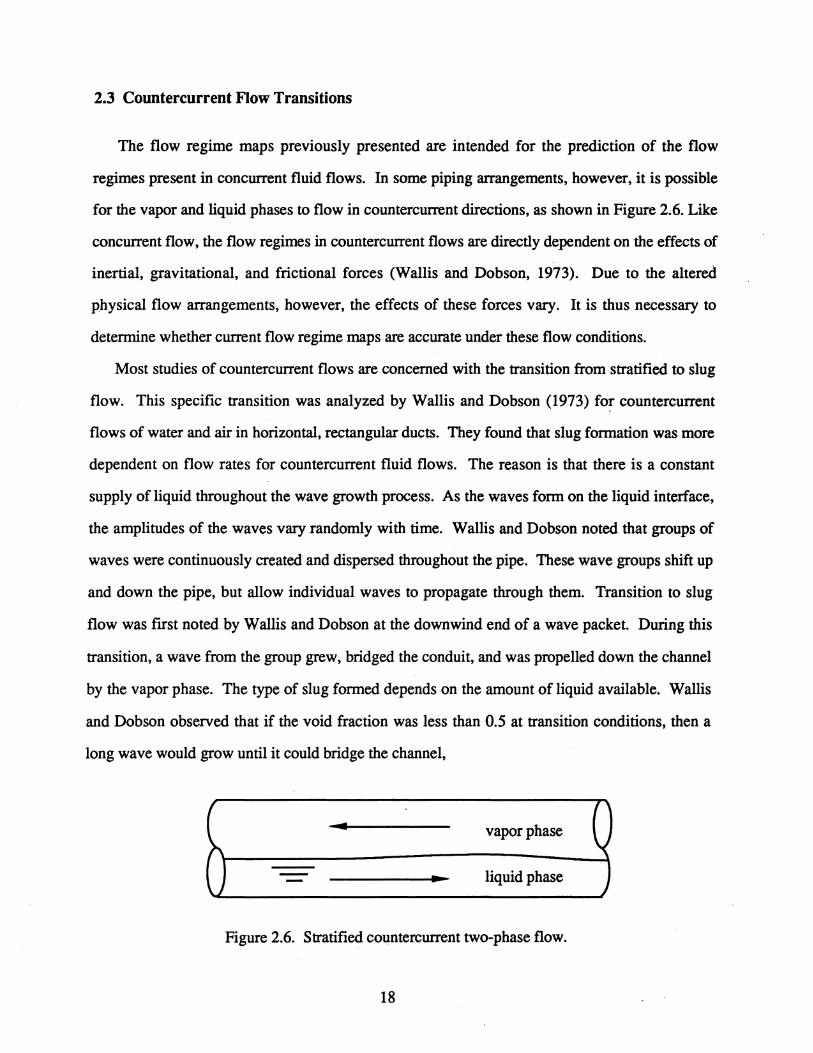
resulting in the transition to plug flow. However, if the void fraction of the flow was greater than
0.5, the higher vapor flow rates created rough liquid interfaces until a turbulent wave grew,
spanning the channel and rolling down the pipe, causing a transition to slug flow.
As part of their analysis of slug formation in countercurrent flows, Wallis and Dobson (1973)
developed their own semi-theoretical criterion for transition from stratified to slug flow. The
criterion was given as
Uo = 0.5 (2.19)
This equation provides the vapor velocity required to retain a slug of liquid as it is propelled
along a pipe. Wallis and Dobson found that this equation accurately predicts slug transition for
concurrent and countercurrent flows, as well as vapor flow over a stagnant liquid. This result is
important because it suggests that flow maps already developed for concurrent fluid flows may
also be accurate for countercurrent flows.
Bjorge (1982) also examined slug initiation in countercurrent flows using saturated steam
and subcooled water as the working fluids. The effect of condensation was noted to be an
important factor in determining the onset of liquid slugging. During the flows, as steam was
condensed onto the liquid the height of the liquid phase increased. The corresponding decrease
in the area of the vapor phase caus,ed the steam to accelerate. Thus, the critical vapor velocity
required for slug initiation was reached at lower inlet liquid flow rates. Bjorge also analyzed the
relative effects which various piping and fluid flow properties have on the onset of slugging.
The parameters that exhibited the most effect on slug transition are pipe length, pipe diameter,
and the amount of inlet liquid subcooling. Changes in each of these variables significantly
altered the amount of condensation that occured within the pipe and was thus directly related to
the phase velocities required for slug initiation.
Bjorge compared slug transition data for steam-water flows to the maps of Taitel and Dukler
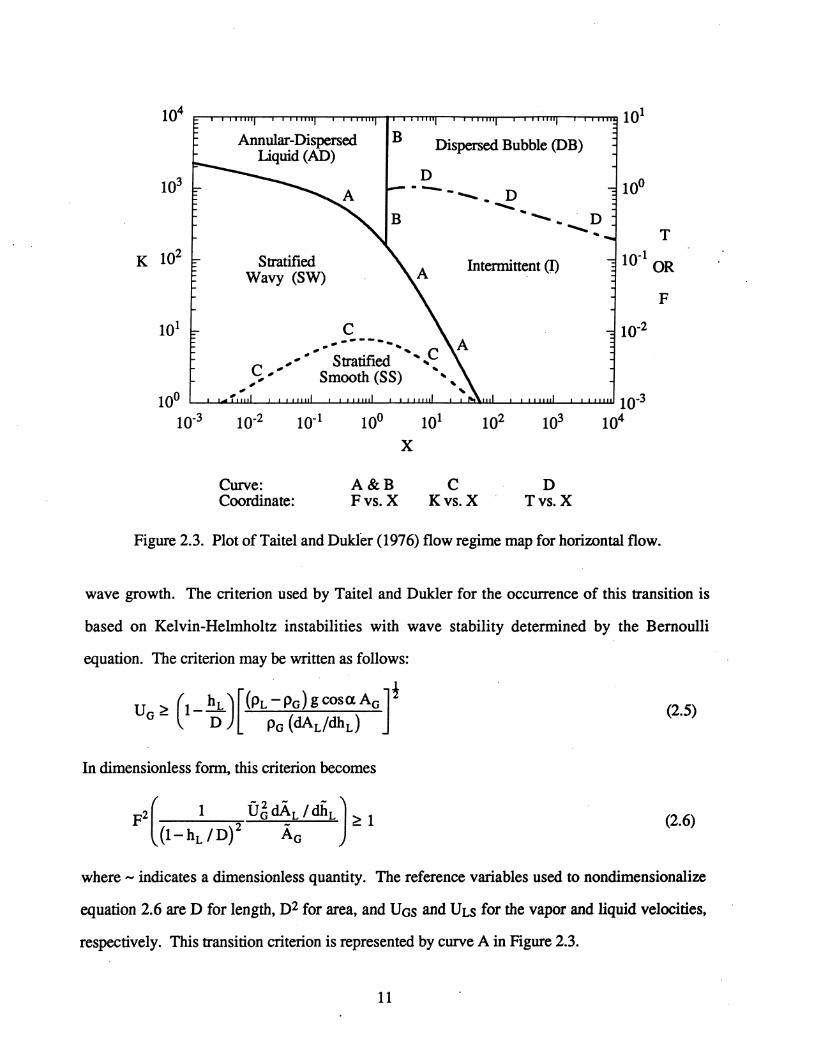
(1976) and Mishima and Ishii (1980). Equation 2.5 gives the Taitel and Dukler criterion for slug
formation. The criterion used by Mishima and Ishii is based on a theoretical analysis of wave
19
stability and is given by
(2.20)
It is interesting that this equation is similar to equation 2.19, the transition criterion of Wallis and
Dobson (1973), which was obtained from correlations of experimental data. The Taitel and
Dukler criterion for transition from stratified to slug flow more accurately predicted slug
initiation. Both criteria, however, were found to agree well with the experimental data. Thus,
Bjorge (1982) has also shown that transition criteria developed for concurrent fluid flows may be
used for countercurrent flow arrangements.
2.4 Applicability of Flow Maps
The purpose of flow regime maps is to allow the prediction of the flow regimes that exist for
given fluid properties, flow characteristics, and piping geometries. To develop these maps, many
authors have simply used correlations of empirical data from various flow regime experiments.
The flow maps of Baker (1954) and Mandhane et al. (1974) were developed in this fashion.
While these maps accurately predict the flow conditions upon which they were based, the
effectiveness of each map is uncertain for fluid and flow parameters beyond the original
parametric range (Dukler and Taitel, 1986). Other researchers have attempted to extend the
range of accuracy of these maps by modifying the coordinate systems to be more responsive to .
changes in fluid properties. Often, these modifications only consist of changing the coordinate
systems by a ratio of a specific fluid property such as the fluid densities or surface tensions. An
example of this type of map is the Schicht (1969) map as modified by Hashizume (1983). These
changes are usually effective in increasing the accuracy of the original map as well as increasing
the range over which the map is applicable. The other method of developing flow pattern maps
is based on theory. The flow map of Taitel and Dukler (1976) was developed in this manner.
This method attempts to create flow maps applicable to all ranges of fluids, flow conditions, and
piping geometries. The effectiveness of a theoretical map is dependent on the accuracy with
20
which the physical mechanisms of flow transitions are modeled.
Most flow regime maps have been developed with water as the working fluid. Transitions
between flow patterns, however, occur under different flow conditions for other fluids due to
differences in fluid properties. This raises a significant concern over the ability of the flow maps
to predict regimes for refrigerant flows. Presently, all of the flow maps have problems predicting
flow transitions for variable working fluids. Even the Taitel and Dukler map, considered by
many to be the best theoretical analysis of two-phase flow, can be highly inaccurate for a variety
of fluids and flow conditions (Manwell and Bergles, 1989). To demonstrate this problem,
analyses of several flow maps are presented for various refrigerants.
Tandon et al. (1983) plotted over 350 flow regime observations for condensing R-12 and R-
22 on the flow maps of Baker (1954), Soliman (1974), Breber et al. (1980), and Tandon et al.
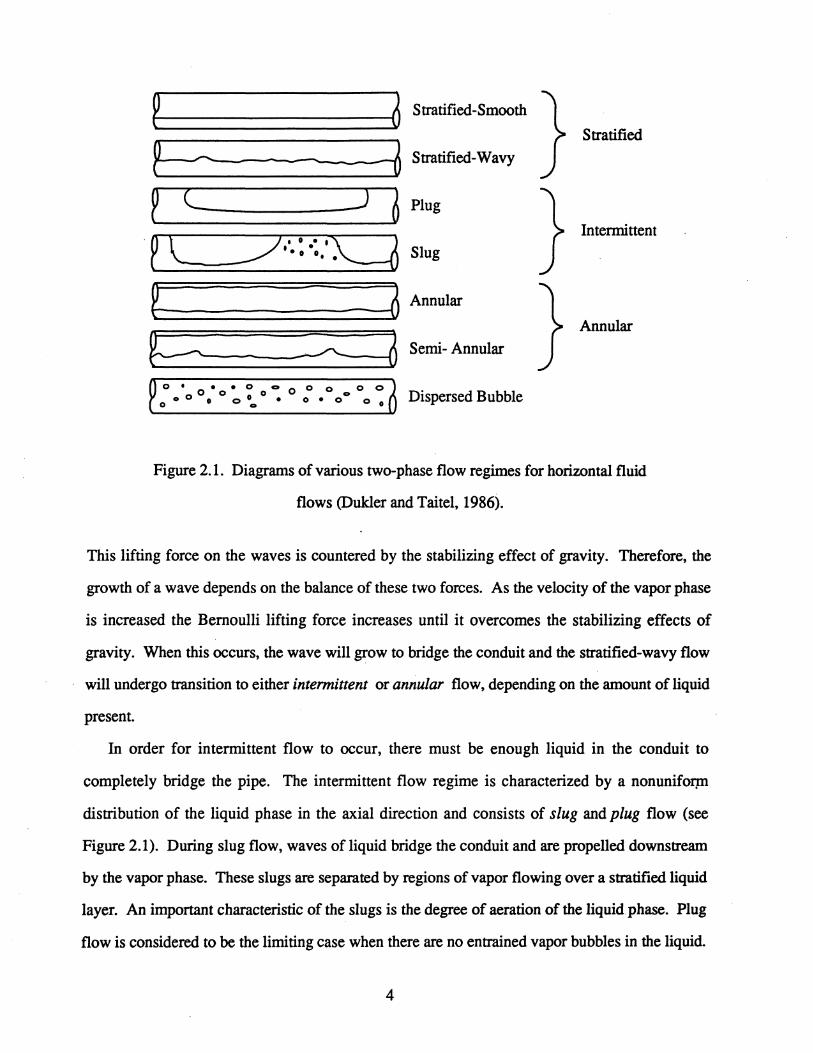
(1982). The slug, plug, wavy, annular, semi-annular, and spray flow regimes were observed.
The wavy flow regime is a combination of the stratified-wavy and the wavy-annular flow
regimes previously discussed. Spray flow consists mostly of vapor with the liquid phase
dispersed as a mist throughout the vapor. The Baker (1954) map is seen to have predicted slug
flow well and to have predicted annular and semi-annular flow with moderate success. There are
large discrepancies, however, between the map and the data for the wavy and spray flow. The
flow maps of Soliman (1974) and Breber et al. (1980) showed improved accuracy over the Baker
map in predicting flow regimes. The· map that demonstrated the most agreement with
experimental observations, however, was that of Tandon et al. (1982). The Tandon map was
able to accurately predict all of the flow regions for the R-12 and the R-22 data.
Weisman et al. (1979) used evaporating R -113 to examine the effectiveness of the Taitel and
Dukler (1976) and Mandhane et al. (1974) flow regime maps as well as to create their own map.
The flow patterns predicted by the Taitel and Dukler map agreed well with the experimental data
except for the transition between slug and annular flows. According to Taitel and Dukler,
transition between these two flow regimes occurs at a constant liquid depth. This criterion is
represented by the authors' flow regime map as a constant Lockhart-Martinelli parameter, X.
21
Weisman et al., however, found that transition followed a line more closely represented by a
constant modified Froude number, F. The map developed by Mandhane et al. (1974) also
predicted all of the flow patterns well, except at the annular-to-slug transition. This coincidence
suggests that the experimental data used to generate the slug-to-annular transition of their map
may be inaccurate. The flow map developed by Weisman et al. (1979) agreed with all of the
flow regimes for the R-113 data. Since this map is based on specific data, however, the' accuracy
of the map is uncertain for fluids and flow conditions beyond the original parametric ranges.
Manwell and Bergles (1989) analyzed the effectiveness of the Schicht (1969) map as
modified by Hashizume (1983) in predicting the experimental data of Tandon et al. (1982),
Weisman et al. (1979), and various other authors. In the various experiments, R-12, R-22, and
R -113 were tested in adiabatic flows and in flows where condensation and evaporation occurred
at low heat fluxes. For the Tandon et al. (1982) data, the Schicht and Hashizume map was in
agreement for the wavy and semi-slug flow regimes. Annular flow, however, consistently
occurred at vapor mass fluxes lower than predicted. The Schicht and Hashizume map was more
consistent for annular flow with the R-113 data of Weisman et al. (1979). Good agreement was
also attained for the wavy, slug, and semi-slug regimes. Much of the wavy data, however,
occurred at vapor mass fluxes well below the Hashizume transition line for stratified-wavy flow.
Another analysis of the Baker (1954) flow map was conducted by Shah (1975). This analysis
is the only one found in the literature that used ammonia as the working fluid. The Baker map
predicted most of the data correctly. However, the map was unable to predict points in the wavy
flow regime. These data points were predicted to be either slug, stratified, or annular flow. It
should be noted, however, that wavy flow occurs at the transitions between these three flow
regimes so that this type of error is not unexpected.
The effectiveness of each flow regime map varies substantially for different fluids and flow
conditions. Because of this, no one flow map has emerged as a universal standard. Therefore,
the choice of flow regime map should depend on the type of fluid in a system and the flow
conditions which occur in a system.
22
2.S Oil Concentration Effects
All of the flow regime maps reviewed have been for two-phase flows of a one component
fluid. In most vapor compression refrigeration systems, however, oil is present in the system.
The presence of oil in a two-phase flow has been found to have significant effects on the patterns
of the fluid flow. These changes in flow regimes can alter the heat transfer and pressure droP.
through the conduit. Thus, determining how oil affects flow regimes is an important issue for the
refrigeration industry.
Worsoe-Schmidt (1960) conducted one of the first investigations involving the effects of oil
on flow pattern transitions. For the experiments, a laboratory-made oil was used with R-12 in a
horizontal, smooth tube evaporator. The result of adding the oil was that a liquid film was
formed around the walls of the tubing. The upper part of this film had a high oil concentration
and thus a high viscosity. The lower portion of the film had oil concentrations which were
consistent with concentrations in the bulk liquid flow. Worsoe-Schmidt noted that the film had
the effect of increasing the wetted perimeter of the tube wall as well as promoting the transition
to annular flow. He also observed that at higher oil concentrations foaming occurs in the flow.
The results of Manwell and Bergles (1989) are similar to the those of Worsoe-Schmidt
(1960). Manwell and Bergles examined flow regime transitions for R-12 with varying
concentrations of a 300 SUS naphthenic mineral oil. The results were plotted on the Schicht
flow regime map as modified by Hashizume (1983) along with data for pure R-12. A
comparison showed that the presence of oil promoted transition to annular-wavy flow at
significantly lower vapor flow rates than those required for pure R-12 .. A similar shift was
observed in the transition from annular-wavy to semi-annular, especially at low qualities.
Manwell and Bergles attributed these premature transitions to foam roll waves that swept along
the walls of the piping. The physical explanation offered by Manwell and Bergles is that the
mechanical mixing of the two phases traps vapor in the liquid lattice, producing foam. The foam
travels along the walls of the pipe and not in the vapor core. Therefore, the amount of fluid
capable of wetting the perimeter is significantly increased. Due to the relatively low density of
23
the foam, a lower vapor core velocity is required to sweep the foam along the side walls. Thus,
annular-wavy flow is initiated at lower vapor flow rates. It should be noted that Manwell and
Bergles did not observe the non-homogeneous oil film around the piping perimeter that Worsoe
Schmidt noted. Manwell and Bergles offer the explanation that the apparatus used by Worsoe
Schmidt might have caused an uneven distribution of oil to be injected into the piping.
The changes in flow regime transition when oil is added to a fluid are partially due t~
changes in the properties of the fluid. Flow transition is significantly affected by fluid properties
such as density, viscosity, and surface tension, each of which is altered by the addition of oil to
the fluid. Schlager (1988) found that common oils are 20% to 50% less dense than CFC
refrigerants, 2 to 3 times more viscous than pure halocarbons, and have surface tensions 2 to 3
times greater than those of most refrigerants. Schlager also noted that although the concentration
of oil in the refrigerant may be only 2% to 5%, the concentration of oil in the liquid phase may
be much greater. The reason for this is that the vapor pressures of the oils are much lower than
for the refrigerants. Thus there is virtually no oil in the vapor phase of two-phase flows. All of
the oil is mixed in the liquid phase of the fluid. Therefore, at high qualities the oil concentration
in the liquid phase may be as high as 90% even though the overall oil concentration is only 5%.
Shah (1975) also studied the effects of oil concentration on two-phase flows. The working
fluid in Shah's research was ammonia. This is significant because the oils commonly used in
ammonia systems are immiscible. Therefore two separate liquid phases exist in the flow. Shah
did not quantitatively analyze the effects of oil concentration but rather reported visual
observations of the flow of ammonia-oil mixtures through a horizontal evaporator. The
magnitude of the effects of the oil differed for the boiling and non-boiling regions of the
evaporator. In the non-boiling region, Shah obse~ed a thick oil film around the circumference
of the pipe wall for high mass flow rates and low temperatures. This film was observed to either
remain stationary or to flow slowly down the pipe walls. At higher temperatures the oil f11m
became thinner and less prominent. Shah proposed that at low temperatures the oil was highly
viscous. When the temperature of the fluid was increased, however, the oil was less viscous and
24
thus unable to fonn the thick films. In the boiling region of the evaporator, the effects of oil are
much less noticeable. At the onset of boiling a small amount of oil generally flows along the
bottom of the pipe. As evaporation of the ammonia occurs, the refrigerant undergoes transition
to annular flow. The oil tends to follow this pattern, forming a semi-annular flow along the pipe
walls. An interesting result of Shah's observations is that there appears to be an unsteady hold up . .
of the oil in the non-boiling region of the evaporator. This result could playa significant role in
the detennination of the overall efficiency of an ammonia evaporator.
Although the research presented documents the effects of oil on the transition from stratified
to annular flows, no work in the literature was found which produced conclusive evidence of the
effect of oil on slug fonnation. Manwell and Bergles (1989) suggest that oil may suppress the
transition from stratified to semi-slug flow. There are not enough data concerning this transition,
however, to substantiate this observation.
25
Chapter 3
Condensation-Induced Shock
Condensation-induced shock results when a vapor bubble collapses with sufficient speed so as
to cause shock waves to propagate into the surrounding liquid. This type of hydraulic shock is
initiated when large pressure or temperature differences occur between the vapor and liquid phases.
Bjorge (1982) has shown that the initiation of condensation-induced shock corresponds with the
transition to the intermittent flow regime. During this transition, vapor bubbles are suddenly
entrapped by the liquid phase. Due to the speed of the bubble formation it is possible for pressure
and temperature differentials to exist between the two phases. The magnitude of the shock
produced by the bubble collapse is affected by many variables, such as the initial bubble size, the
properties of the fluid, and the flow conditions. The effects of condensation-induced shock are
limited in distance because the shock waves can only propagate through a pipe that is full of liquid.
The strength of the shock, though, is sufficient to cause severe damage to metals or other solids
(Hunter, 1960; Hickling and PIes set, 1964).
3.1 Liquid Inertia Limits
For a given pressure difference between the vapor and liquid phases, the strength of a
condensation-induced shock depends on the time it takes the bubble to collapse. Many properties
of the fluid and of the flow affect this collapse rate. The maximum shock occurs when the only
restraint on the collapse is the inertial limit of the liquid Under this condition, the rate of collapse
becomes a function of the speed at which the liquid phase can reach the center of the bubble.
3.1.1 Incompressible Limit
The upper bound of the liquid inertial limit occurs when the liquid phase is able to
instantaneously respond to flow changes and the bubble does not contain any vapor to resist the
inflow of liquid. Rayleigh (1917) modeled this scenario as the adiabatic collapse of a spherical
26
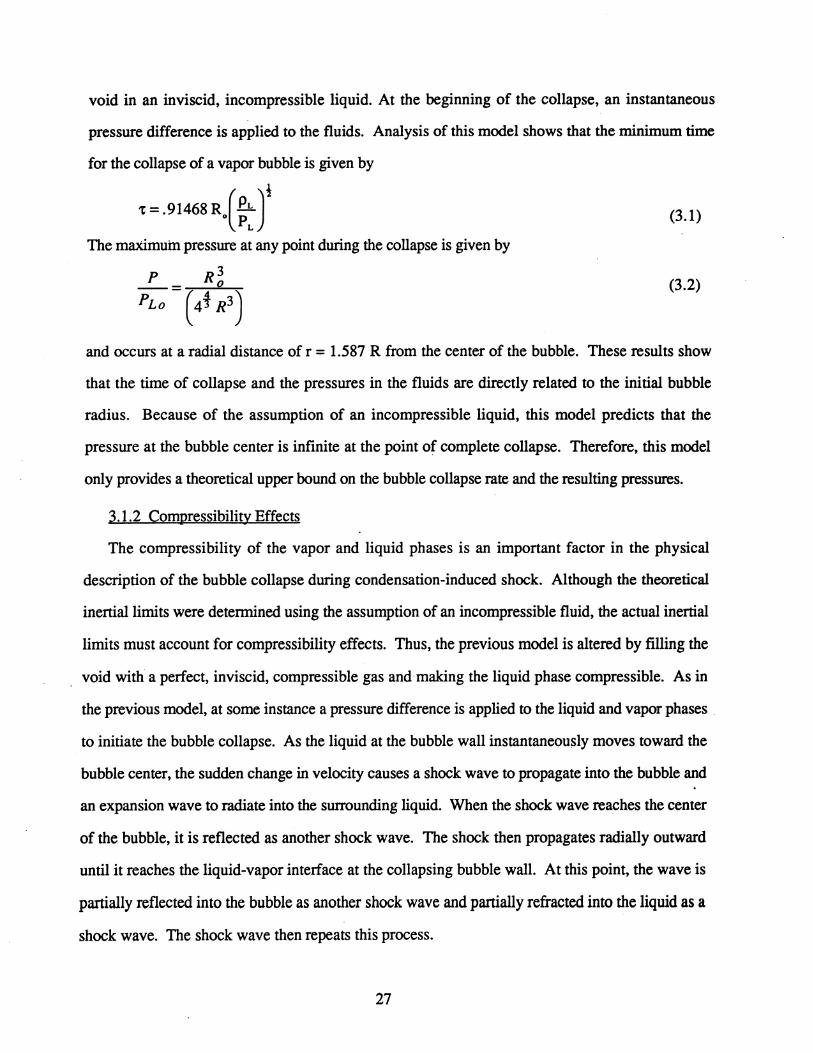
void in an inviscid, incompressible liquid. At the beginning of the collapse, an instantaneous
pressure difference is applied to the fluids. Analysis of this model shows that the minimum time
for the collapse of a vapor bubble is given by
• = .91468 R.( ~J (3.1)
The maximuin pressure at any point during the collapse is given by
P R3 __ = 0
PLo (4t R3) (3.2)
and occurs at a radial distance of r = 1.587 R from the center of the bubble. These results show
that the time of collapse and the pressures in the fluids are directly related to the initial bubble
radius. Because of the assumption of an incompressible liquid, this model predicts that the
pressure at the bubble center is infinite at the point of complete collapse. Therefore, this model
only provides a theoretical upper bound on the bubble collapse rate and the resulting pressures.
3.1.2 Compressibility Effects
The compressibility of the vapor and liquid phases is an important factor in the physical
description of the bubble collapse during condensation-induced shock. Although the theoretical
inertial limits were detennined using the assumption of an incompressible fluid, the actual inertial
limits must account for compressibility effects. Thus, the previous model is altered by filling the
void with a perfect, inviscid, compressible gas and·making the liquid phase compressible. As in
the previous model, at some instance a pressure difference is applied to the liquid and vapor phases .
to initiate the bubble collapse. As the liquid at the bubble wall instantaneously moves toward the
bubble center, the sudden change in velocity causes a shock wave to propagate into the bubble and
an expansion wave to radiate into the surrounding liquid. When the shock wave reaches the center
of the bubble, it is reflected as another shock wave. The shock then propagates radially outward
until it reaches the liquid-vapor interface at the collapsing bubble wall. At this point, the wave is
partially reflected into the bubble as another shock wave and partially refracted into the liquid as a
shock wave. The shock wave then repeats this process.
27
At the beginning of the collapse, the vapor phase condenses into liquid quickly enough to
maintain a constant vapor pressure in the bubble and hence does not interfere with the collapse
process (Hunter, 1960). As the collapse continues, the liquid-vapor interface accelerates towards
the bubble center. Once the interface velocities are near the speed of sound in the vapor phase, the
vapor does not have time to condense. The vapor inside the bubble the becomes compressed,
resulting in an increase in the vapor pressure. Eventually, the vapor pressure in the bubble
becomes large enough to overcome the momentum of the liquid and stops the collapse process.
The bubble will then rebound to a fraction of its original size and the collapse process will be
repeated (Trilling, 1952; Hunter, 1960).
A comparison between the incompressible and compressible flow models reveals substantial
differences in the results. A significant difference is that the incompressible flow model does not
account for the pressure pulses which propagate into the liquid during the collapse. This is
important because these pressure pulses are the cause of condensation-induced shock. Another
difference is that the pressures predicted by the compressible flow analysis are less than those
obtained from the incompressible flow model (Biasi, et al., 1972). This is especially noticeable at
the end of the collapse when incompressible flow theory allows the vapor pressure to go to infInity
(Rayleigh, 1917) but compressible flow theory gives a fmite pressure in the bubble (Hickling and
Plesset, 1964).
3.2 Heat Transfer Effects
Heat transfer is an important factor in determining the actual rate of bubble collapse.
Physically, in order for a bubble to collapse the vapor in the bubble must be condensed into the
liquid phase. During this process the heat of condensation is rejected at the liquid-vapor interface.
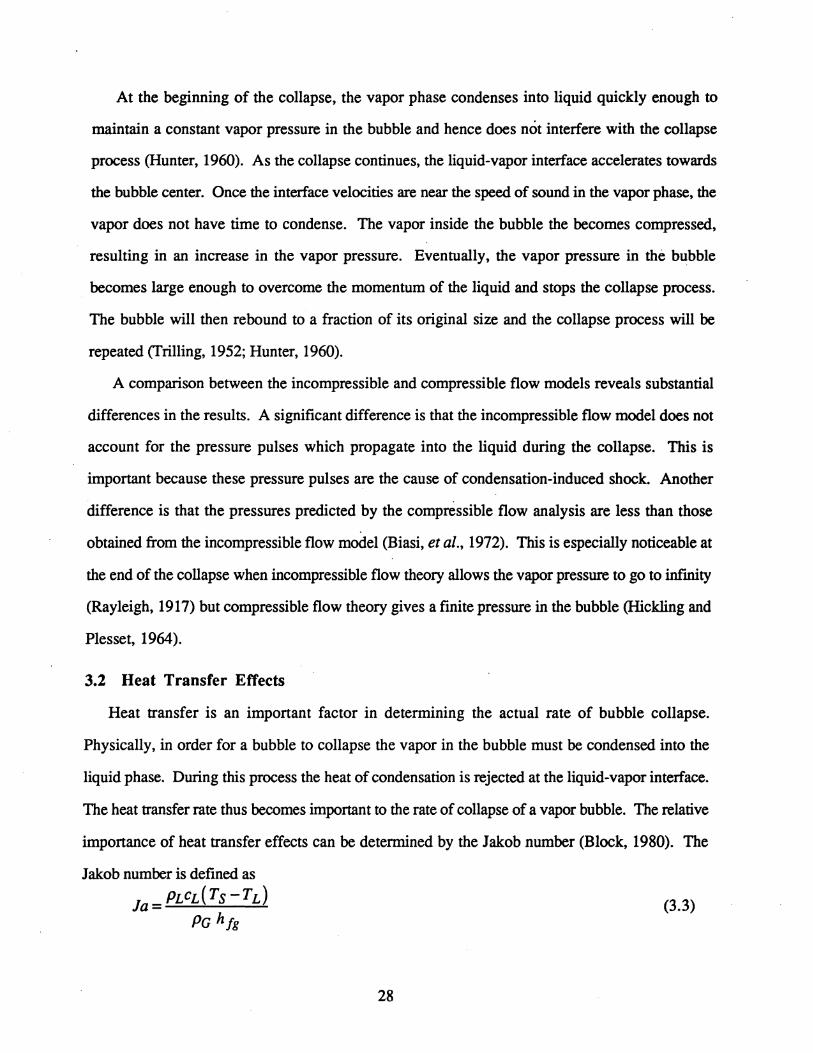
The heat transfer rate thus becomes important to the rate of collapse of a vapor bubble. The relative
importance of heat transfer effects can be determined by the Jakob number (Block, 1980). The
Jakob number is defined as
Ja= PLCL(Ts -TL )
PG hlg
28
(3.3)
and represents a ratio of the liquid's ability to absorb heat over the amount of heat transfer required
for phase change to occur. As the Jakob number increases, larger condensation rates are possible
and the rate of bubble collapse tends toward the inertial limits of the liquid. Decreases in the Jakob
number reflect a reduced ability of the liquid to remove heat from the vapor phase; the collapse
process is limited by the rate of heat transfer.
Physically, a high Jakob number corresponds to a large difference in temperature between the.
liquid and vapor phases. In this case, the liquid can absorb the heat required for condensation and
the collapse is limited by the inertial effects of the liquid. At low temperature differentials between
the liquid and vapor phases the collapse is represented by a low Jakob number. For this type of
collapse, the amount of heat that the liquid can absorb is limited. This results in a decrease in the
rate of condensation and thus a reduction in the rate at which the bubble collapses. Also, the
increase in the amount of vapor left in the bubble causes a greater increase in the vapor pressure.
Therefore, unlike the liquid inertia limited collapses where the collapse rates continue to increase,
the collapse rates of heat transfer limited cases are relatively slow and decrease as the collapse
progresses (Florschuetz and Chao, 1965).
During the collapse of a vapor bubble, heat is transferred from the vapor phase to the liquid
immediately surrounding the bubble. As the bubble collapse progresses, the absorbed heat
increases the temperature of the liquid near the bubble wall. This increased liquid temperature
causes a decrease in the transient Jakob number associated with the collapse, thus reducing the
condensation rate as well as the rate of the bubble collapse. If the liquid phase is moving past the
bubble, this translatory motion allows heat from the condensation process to be advected* away by
bulk fluid motion. This reduces the effect on the Jakob number due to local heating. Thus,
translatory motion enhances heat transfer from the vapor phase and promotes higher collapse rates
(Wittke and Chao, 1967).
* Advection of heat refers to energy carried with the flow; convection refers to energy ttansferred at a surface.
29
Chapter 4
Vapor-Propelled Liquid Slugging
As the name of the shock mechanism suggests, vapor-propelled liquid slugging is an
expression for the hydraulic shocks that occur during two-phase slug flow. The momentum of a·
slug is much greater than that of other types of two-phase flow because the slug has the greater
density of the liquid phase combined with the higher velocity of the vapor phase. This increased
momentum can create impact forces as high as 3000 psi in end caps, tees, and piping bends
(Loyko, 1992).
4.1 Influences on Vapor-Propelled Liquid Slug Initiation
The mechanisms that trigger transition to slug flow are influenced by many variables. The
characteristics of the fluid flow, the properties of the working fluid, and the physical parameters
of the piping system each have significant effects on the initiation of slug flow. Knowledge of
these effects is needed to determine the susceptibility of a system to vapor-propelled liquid
slugging.
4.1.1 Fluid Flow Effects
The characteristics of the fluid flow are an integral part of determining the transition to slug
flow. For a prescribed fluid and piping system, properties such as phase velocity, turbulent or
laminar effects, and liquid height determine when the transition to slug flow will occur. Two
characteristics of fluid flows which are significant in determining the onset of vapor-propelled
liquid slugging are heat transfer between the liquid and vapor phases and transient velocity
changes. During some operating scenarios in ammonia systems, saturated vapor is admitted
across subcooled liquid. As the vapor phase flows over the liquid some of the vapor condenses.
The condensation increases the height of the liquid phase, resulting in a reduction of the vapor
velocity required for the initiation of slug.flow. Therefore, any flow parameter that promotes
30
heat transfer between the phases increases the susceptibility of a system to vapor-propelled liqUid
slugging.
Most theories predict slug flow transition based on quasi-steady, equilibrium changes of the
phase velocities. Transition to slug flow may also result from the transient increase in phase
velocities. This type of slug initiation differs physically. Under equilibrium conditions, as the
vapor velocity increases the liquid height required for slug transition decreases. For fast
transients, the liquid depth required for transition decreases until it reaches a critical limit where
it is independent of the vapor velocity. This critical liquid height is based only on the viscosity
of the liquid. For rapid vapor transients, the liquid-vapor interface is covered by large-amplitude,
irregular waves. These waves do not grow, but rather coalesce along the liquid-vapor interface.
Transition to slug flow occurs when enough of these interfacial waves have combined to bridge
the pipe. Taitel et al. (1978) analyzed this mechanism of transition and argued that the same
criteria for slug transition are still applicable. The dependence of the flow properties on time and
position causes flow transition to occur at vapor and liquid velocities that vary greatly from those
predicted by equilibrium conditions (Dukler and Taitel, 1986).
4.1.2 Fluid Property Effects
Establishing the effects of fluid properties on the transition to slug flow allows an evaluation
of the relative susceptibility of various fluids to vapor-propelled liquid slugging. By
understanding how fluid properties affect slug fonnation, a working fluid may be chosen that is
not susceptible to slug flow for the given flow conditions. The important properties are vapor
density, liquid density, liquid viscosity, and surface tension. However, the effects that these
properties have on slug initiation are not completely understood.
Weisman et al. (1979) experimented with fluids of varying vapor density and reported no
significant effects on the transition from stratified to slug flow. However, the analysis of
Weisman et al. (1979) only involved the quasi-steady initiation of slug flow. Andritsos et al.
(1992) found that vapor density .mainly affects the transition to slug flow that occurs through
wave coalescence. Andritsos et al. reported that as the density of the vapor phase was increased,
31
the vapor velocity required for the transition to slug flow decreased. Physically, the va~r phase
affects the liquid phase through interfacial shearing forces. An expression for interfacial shear
stress used by Taitel and Dukler (1976) is
'to = f. Po(Uo - UJ2 I I 2 (4.1)
where f i is the interfacial friction factor. The equation indicates that the magnitude of the
shearing forces between the phases is directly proportional to the density of the vapor phase.
Thus increases in the vapor density magnify the influence of the vapor phase on the liquid phase,
allowing for transition to slug flow at reduced vapor velocities.
Increases in the density of the liquid phase produce an opposite effect on slug transition. As
the liquid density is increased, higher vapor or liquid velocities are required for transition to slug
flow (Weisman et al., 1979). Agreement with this conclusion can also be found in theory.
Kelvin-Helmholtz theory (Milne-Thomson, 1960) states that a wave will grow on the liquid
surface when
(4.2)
where he; is the height of the vapor phase. The equation also shows that the velocity of the vapor
phase required for wave formation is directly proportional to the density of the liquid phase.
Thus, theory and experimental evidence agree on the effect of liquid density on the initiation of
slug flow.
There is disagreement in the literature as to the effect that the viscosity of the liquid phase
has on vapor-propelled liquid slugging in separated flows. Kordyban (1993) and Weisman et al.
(1979) did not notice any changes in the formation of slugs due to changes in liquid viscosity.
However, Bamea (1991), Dukler and Taitel (1986), and Andritsos et al. (1992) found a
significant relationship between the viscosity of the liquid and the onset of liquid slugging. The
experiments of these authors demonstrate that at higher liquid viscosities, the height of the liquid
phase is increased and thus the liquid velocities required for slug initiation are greatly reduced.
32
Barnea (1991) also noted that at constant liquid height, increases in the liquid viscosity have a
stabilizing effect on the system and larger vapor velocities are required for transition to slug
flow. According to Dukler and Taitel (1986), the reason for the difference in results is the length
of the test section used by Weisman et al. (1979). As liquid viscosity is increased slugs take
longer to form. Therefore, if the pipe length is too short, transition to slug flow will not occ1:lf.
The effect that surface tension has on slug formation is even less clear than that of liquid
viscosity. Weisman et al. (1979) state that the surface tension of a fluid does not affect the
transition to slug flow. Kordyban and Okleh (1992), however, conclude that decreases in surface
tension significantly reduce wave growth and hence delay slug formation. This conclusion is
contrary to the results of Barnea et al. (1983), where the authors state that in small diameter pipes
surface tension causes the premature transition from stratified to slug flow. Experimental data
concerning surface tension do not consistently support any of the arguments. Therefore,
Andritsos et al. (1992) simply conclude that there is not substantial evidence at present to
determine the effects of surface tension on slug initiation.
4.1.3 Piping Configuration Effects
Various characteristics of a piping system affect the transition to slug flow. Wallis and
Dobson (1973) found that any sizable mechanical excitation of the liquid phase resulted in
premature slug initiation. Within a piping system, there exist many opportunities for such a
disturbance. In a study of flow through an evaporator, Barnhart and Peters (1992) found that the
return bends triggered the formation of slugs at velocities much lower than predicted by theory ..
Taitel (1977) found that rough piping creates disturbances at the vapor-liquid interface, causing
the premature transition to slug flow. In general, any nonideality in the piping system will
promote the onset of vapor-propelled liquid slugging.
The diameter of the pipe can effect the transition to slug flow in several different ways. For
saturated fluid flows, Andritsos et al. (1992) show that as the diameter of the pipe is decreased,
lower liquid velocities are required for slug initiation. This effect is reinforced if the liquid phase
is subcooled. Bjorge (1982) demonstrates that decreasing the pipe diameter increases the effect
33
of condensation on the flow, causing slugs to form at even lower liquid velocities. Finally, for
small diameter tubing, Barnea et al. (1983) found that surface tension effects become enhanced,
causing the liquid phase to climb the piping walls and to prematurely initiate slug flow. The
combination of these three effects makes the diameter of a pipe a potentially important parameter
in determining the initiation of vapor-propelled liquid slugging.
In adiabatic two-phase fluid flows, the only effect which pipe length has is to limit the
amount of space which slugs have to form. Thus a short pipe can prevent the formation of slugs
under normal flow conditions. In this case, to initiate slug flow requires higher than predicted
liquid velocities so that the slugs may form earlier (Andritsos, et al., 1992). When condensation
occurs in the flow, the length of the pipe is a significant parameter in determining the onset of
liquid slugging. Bjorge (1982) has shown that increases in pipe length increase the amount of
condensation in the pipe. Thus, the height of the liquid phase is increased and the corresponding
vapor velocity required for slug formation is decreased.
The largest effect which piping has on slug transition, however, is the angle of inclination of
the piping system. In piping systems with concurrent flow and small inclination angles (up-hill)
the stratified flow regime is greatly reduced and the transition to slug flow is almost immediate.
When the angle is adjusted to a small decline (down-hill), however, the liquid velocity for the
transition to slug flow is greatly increased (Dukler and Taitel, 1986; Barnea, et al., 1980).
Therefore, the incorrect installation of horizontal pipes greatly increases the risk of vapor
propelled liquid slugging.
4.2 Pressure Calculations
Current practice in the refrigeration industry is to design systems that avoid hydraulic shocks.
These systems are only designed for normal operating conditions. Therefore, the sudden
pressures surges associated with hydraulic shocks are a serious danger to the system. It is
important to know the magnitude of the pressures that may occur in a system so that operating
34
procedures and system designs may be altered to account for these shocks.
To this point, condensation-induced shock and vapor-propelled liquid slugging have been
discussed separately. In ammonia systems, the hydraulic shocks that occur are often a
combination of these two shock mechanisms (Loyko, 1992). A common scenario is for
transition to slug flow to occur, causing the onset of vapor-propelled liquid slugging. These
slugs of liquid are propelled down the pipe, pushing a region of vapor ahead of them. Once the .'
slug enters an end cap or other entrapping section of piping, the vapor region is compressed
between the slug and the piping wall. The momentum of the slug provides the pressure
differential required for bubble collapse. Thus, the resulting shock is a combination of vapor
propelled liquid slugging and condensation-induced shock.
Loyko (1992) presented a sample calculation of the pressures that can occur when these two
hydraulic shocks combine. This example is a representation of a possible shock scenario that
may occur at the termination of hot gas defrost. The scenario involves a piping configuration
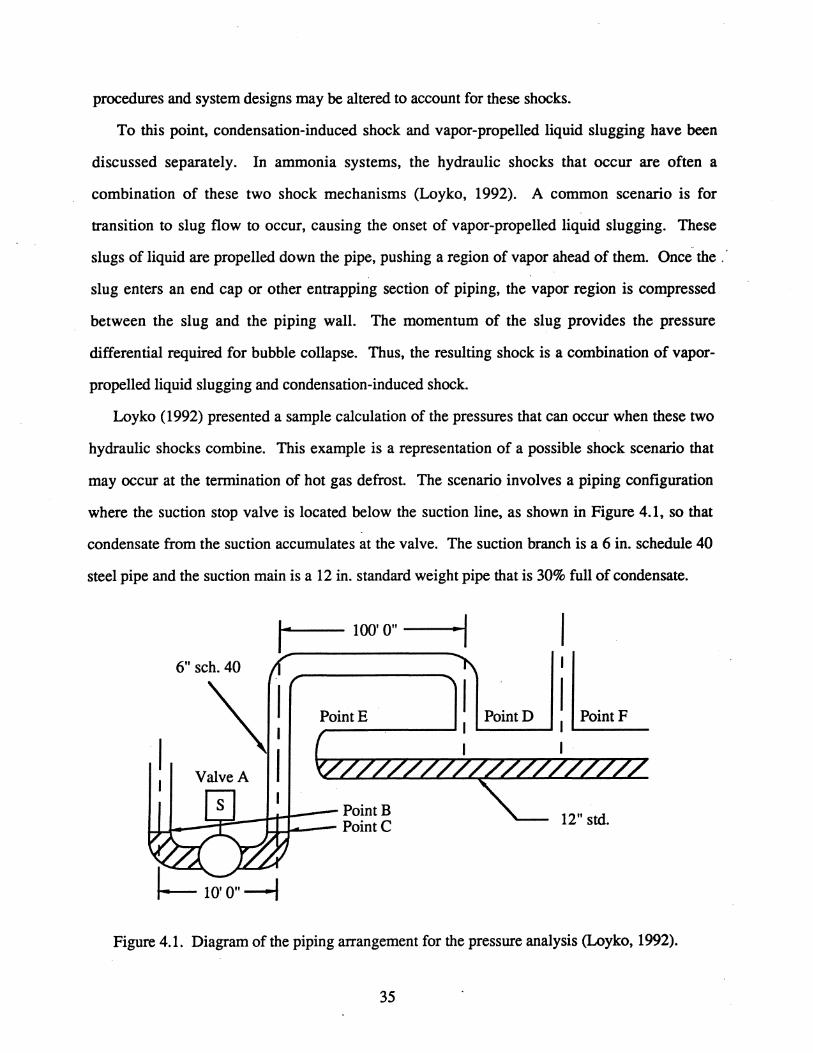
where the suction stop valve is located below the suction line, as shown in Figure 4.1, so that
condensate from the suction accumulates at the valve. The suction branch is a 6 in. schedule 40
steel pipe and the suction main is a 12 in. standard weight pipe that is 30% full of condensate.
I
6"sch.40
""! Valve A I
1== 100' 0" --f I
..... p_o_in_t_D----I i I ~t F PointE
Lu..~!::t=::L---1!1::= Point B I-I-~-- Point C 12" std.
Figure 4.1. Diagram of the piping arrangement for the pressure analysis (Loyko, 1992).
35
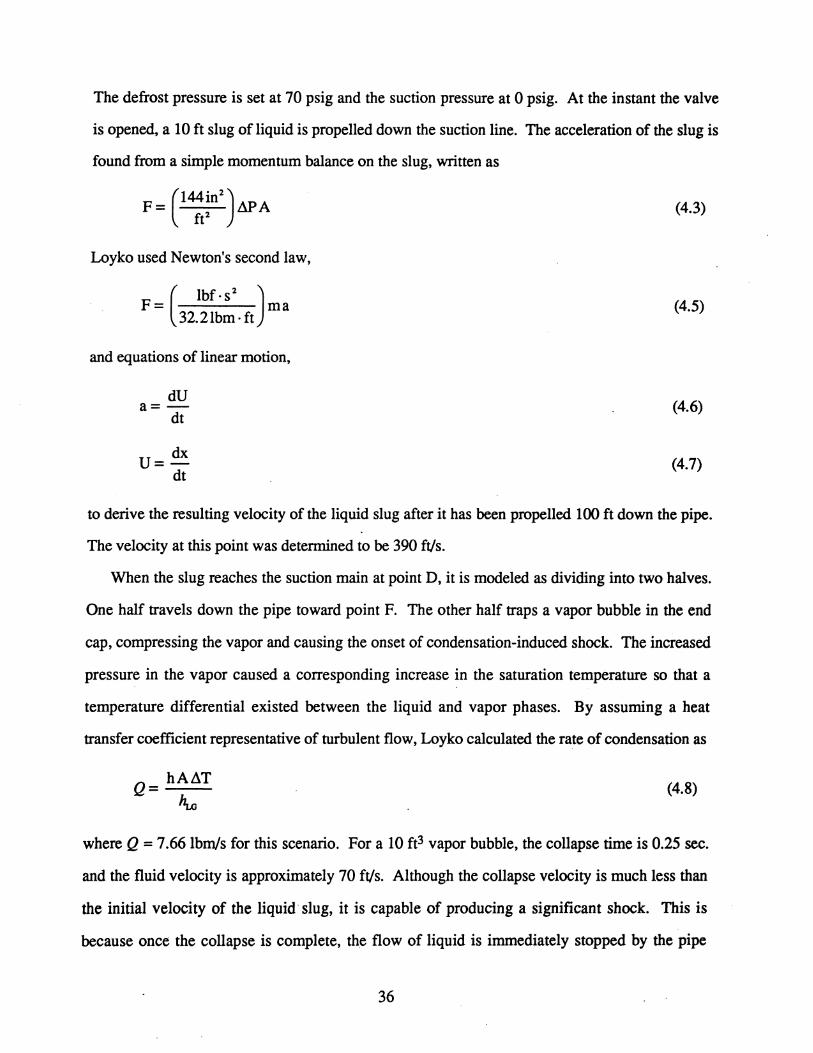
The defrost pressure is set at 70 psig and the suction pressure at 0 psig. At the instant the valve
is opened, alOft slug of liquid is propelled down the suction line. The acceleration of the slug is
found from a simple momentum balance on the slug, written as
F = (l44in2) M> A fe
Loyko used Newton's second law,
F ( lbf 'S2 J - ma 32.2Ibm·ft
and equations of linear motion,
dU a=-
dt
dx U=
dt
(4.3)
(4.5)
(4.6)
(4.7)
to derive the resulting velocity of the liquid slug after it has been propelled 100 ft down the pipe.
The velocity at this point was determined to be 390 ftls.
When the slug reaches the suction main at point D, it is modeled as dividing into two halves.
One half travels down the pipe toward point F. The other half traps a vapor bubble in the end
cap, compressing the vapor and causing the onset of condensation-induced shock. The increased
pressure in the vapor caused a corresponding increase in the saturation temperature so that a
temperature differential existed between the liquid and vapor phases. By assuming a heat
transfer coefficient representative of turbulent flow, Loyko calculated the rate of condensation as
Q= hA.1T
hw (4.8)
where Q = 7.66 lbm/s for this scenario. For a 10 ft3 vapor bubble, the collapse time is 0.25 sec.
and the fluid velocity is approximately 70 ftls. Although the collapse velocity is much less than
the initial velocity of the liquid· slug, it is capable of producing a significant shock. This is
because once the collapse is complete, the flow of liquid is immediately stopped by the pipe
36
wall. The Ioukowski equation is used to determine the magnitude of the pressures produced by
the shock. This equation is given as
(4.9)
where a is the speed of sound in liquid ammonia. For the example analyzed by Loyko, the
pressure surge created by the shock was 3149 psi. Loyko determined that this pressure transient
causes an axial stress in the suction main of approximately 26,000 psi. While this shock may not
seriously damage the piping system, repeatedly exposing the piping system to sudden large
stresses can cause the premature destruction of the piping components.
37
Chapter 5
Critical Flow Regimes in Refrigerant Piping
Several two-phase flow patterns may exist in industrial refrigeration systems. The only flow
regimes that are critical to this study, however, are those regimes that may initiate either vapor
propelled liquid slugging or condensation-induced shock. As shown in the previous chapters, the
occurrence of both types of hydraulic shocks corresponds to the transition to intermittent flow.
Therefore, establishing the parts of the refrigeration system that are susceptible to condensation
induced shock and vapor-propelled liquid slugging involves determining which parts of the
system are able to cause the transition to intermittent flow.
5.1 Hot Gas Defrost
The only documented occurrences of hydraulic shock in refrigeration systems are associated
with the initiation and termination of hot gas defrost in low-temperature ammonia evaporators
(Loyko, 1989). A sample schematic for a low-temperature evaporator during the hot gas defrost
process is given in Figure 5.1. At the initiation of hot gas defrost, the liquid line solenoid valve
(1) and the gas-powered suction stop (C) are each closed. The gas-powered suction stop valve is
closed in either of two manners, depending on whether the valve is normally open or closed. If .
the valve is normally open, then high pressure gas from the hot gas line is used to close the valve
by shutting the suction pilot (A) and opening the hot gas pilot (B). If the valve is normally
closed, then the high pressure gas that holds the valve open during normal operating conditions is
removed by closing the hot gas pilot (B) and allowing the gas to bleed off. This arrangement is
commonly used in ammonia systems (Cole, 1994) because it avoids the inherent.1P associated
with conventional solenoid valves.
Hot gas flow is initiated by the opening of the hot gas solenoid valve (1). The hot gas hand
expansion valve (K) shown in Figure 5.1 is typically used only to control the distribution of the
38
hot gas from the condenser to the various evaporators. The hot gas frrst enters the drain pan (M)
at the bottom of the evaporator. Then the hot gas check valve (E) opens to allow the hot gas to
flow into the suction header (F). Since the suction stop (C) has been closed the hot gas flows
through the evaporator (1,) in a path that is opposite the ammonia flow during normal evaporator
use. The hot gas then exits through the liquid header (G) and into a hot gas drainage line. A hot
gas relief regulator (D) on this line acts as a pressure relief valve that maintains a minimum
pressure in the evaporator during hot gas defrost. The purpose of maintaining a minimum
pressure in the evaporator is to ensure that the saturated ammonia in the evaporator remains at a
temperature sufficient for defrost.
In general, temperature or pressure sensors are not used to detennine the end of the hot gas
defrost cycle. This is because the conditioned room air is so cold that the ammonia typically
leaves the evaporator as a saturated fluid instead of a superheated vapor. Therefore, the pressure
and temperature of the ammonia will be almost constant. Thus, the hot gas defrost process is
I Y o· c-'
-
Liquid Line
-
Suction Line
Hot Gas Line
A - Suction Pilot B - Hot Gas Pilot C - Suction Stop D - Defrost Relief Regulator E - Hot Gas Check Valve F - Suction Header G - Liquid Header H - Liquid Hand Expansion
Valve I - Hot Gas Solenoid Valve J - Liquid Solenoid Valve
and Check Valve K - Hot Gas Hand Expansion
Valve L - Evaporator Coil M - Drain Pan
Figure 5.1. Schematic of low-temperature evaporator during hot gas defrost
39
controlled by timers that are preset by the system operator. When hot gas defrost is complete,
the hot gas solenoid valve (I) closes. In some systems, there is a· delay before the liquid line
solenoid (J) and the gas-powered suction stop (C) valves reopen. During this time a bleed valve
can reduce the pressure of the hot gas to decrease the pressure difference at the liquid solenoid
and the gas-powered suction stop valves. The extent of this delay is also set by the system
operator. After this time, the liquid line solenoid and suction stop valves are opened and normal
operating conditions are reestablished (Cole, 1994).
S.2 Hydraulic Shock During Hot Gas Defrost
At the beginning of the hot gas defrost cycle, hydraulic shock is associated with the opening
of the hot gas defrost valve. At this time, hydraulic shock may be initiated in two areas. First, if
there is enough condensate in the hot gas line, then the sudden flow of hot gas may cause a
transition to slug flow. The liquid slugs that are formed are propelled through the hot gas valve
and into the pan of the evaporator. This may lead to hydraulic shock in pipe caps and coil
headers with pressures exceeding 2000 psig (lIAR, 1992). The second manner in which
hydraulic shock may be initiated is due to condensate remaining in the pan coil or the evaporator
coil. This condensate may be the result of either a leaking check valve between the pan and the
suction header or an improperly drained evaporator. Similar to the previous incident, the sudden
flow of hot gas through the coil can cause the formation of liquid slugs resulting in hydraulic
shocks in the pan coil header or an evaporator header. The magnitude of these shocks may range
from 1000 to 2000 psig (lIAR, 1992).
At the termination of hot gas defrost, hydraulic shock corresponds with the opening of the
gas-powered suction stop. The manner in which hydraulic shock is initiated depends on piping
configuration. If the gas-powered suction stop is located below the level of the suction header,
condensate from the suction header will drain and collect at the suction stop valve. Therefore,
when the gas-powered suction ·stop is opened, the liquid slug has already formed and the
occurrence of hydraulic shock is a function of the amount of condensate collected and the speed
40
to which the vapor can accelerate the slug (Loyko, 1992). This scenario also occurs if the
suction line is allowed to slope down toward the suction stop. It is now recommended that the
suction stop be installed above the suction header to prevent the collection of liquid at the suction
stop valve (Loyko, 1992). For this recommended piping arrangement the transition to slug flow
results from hot gas flowing over condensate that has collected in the suction line during the hot
gas defrost cycle. Since the piping arrangement with the suction stop lower than the suction.'
header has already been analyzed (Loyko, 1992) and does not involve transition to slug flow
based on vapor flow over a liquid, this work will focus on the system with the suction stop
elevated above the suction header.
Although the large pressure differentials associated with hot gas defrost are usually the focus
of hydraulic shock discussions, the temperatures associated with the hot gas defrost process are
also important. First, the large temperature differential between the hot gas and the subcooled
condensate enhances heat transfer between the vapor and liquid phases. Thus, when a vapor
bubble becomes trapped by the liquid, the rate of bubble collapse becomes limited by liquid
inertia effects and the magnitude of the shock is increased. This analysis indicates that a shock
incident is not just vapor-propelled liquid slugging or condensation-induced shock, but rather a
combination of both types of shock acting together. The second manner in which temperature
promotes hydraulic shock concerns the piping system. Incidents of hydraulic shock in ammonia
systems have all been for systems with refrigerant temperatures below -20 F (Loyko, 1989). At
these temperatures, steel is below its nil ductility limit and becomes brittle (Loyko, 1989).
Therefore, not only does temperature increase the magnitude of hydraulic shocks, it also
decreases the ability of the piping system to handle shocks.
41
Chapter 6
Flow Analysis
Hydraulic shock in refrigeration systems is complicated by the number of scenarios through
which a shock may occur and by the wide range of pipes, valves, and system designs in use. An
analysis that covers every eventuality is impossible. The scenarios previously discussed involve
some speculation, but because the hydraulic shock initiation mechanisms are essentially the
same, a generalized analysis is developed for these situations. In each case, vapor-propelled
liquid slugging or condensation-induced shock occurred after a valve was rapidly opened and
vapor at a high pressure was emitted into a pipe partially filled with quiescent condensate at low
side pressure. It is this manifestation of a hydraulic shock that is under study. The analysis
consists of modeling the gas flow through the valve for a prescribed pressure difference to
determine the vapor velocity over the liquid, and then to use transition criteria from the literature
to determine whether a slug could form. This approach is consistent with the operation of the
system.
An instant after a valve is opened, the flow conditions are transient and the fluid is in a state
of nonequilibrium. It is during this time that, if the flow conditions are sufficient, a hydraulic
shock is initiated. The purpose of the model is to gain insight into the physics of the flow
through the valve. This allows comparison of the existing flow conditions to the initiating
mechanisms of hydraulic shocks to determine the susceptibility of the system to shock.
6.1 Flow Model
For the initial pressure differences across a typical hot-gas or suction-stop valve in a liquid
overfeed ammonia system, it is readily found that the flow through the valve is choked at the
throat when the valve opens. Limited empirical data may be used to predict the gas flow through
a specific valve under certain flow conditions. This situation is made more complicated by the
42
valve inlet
IZzzzzz~zzzzzzzzzzzzzzzza --- .------;, I C.V.1 " " I C.V.2
I ...... , I I ,... JI I ~L ______ ...
1;7Z7;7~777<;>Q1e~s:t;ZZ7Z777A
valve exit
Figure 6.1. Diagram of the orifice representation of a valve.
presence of liquid downstream of the valve. The generalized approach of the flow model is to
assume a simplified valve geometry, and that the liquid is initially unaffected by the sudden flow
of vapor through the valve.
The valve is assumed to consist of a smooth contraction with a sudden expansion at its
discharge, as shown in Figure 6.1. Only the flow conditions that occur immediately after the
valve is opened are analyzed. This is because the driving pressure differential and thus the phase
velocities immediately decrease as the flow continues. Thus, the flow conditions and fluid
properties immediately before the valve is opened are used to model the flow before any changes
can occur in the flow parameters. This allows the assumptions of adiabatic and steady flow.
For the flow upstream of the valve, the additional assumption of frictionless flow is made.
For the sake of developing a conservative estimate and because the event of interest has a short
time duration, the vapor pressure at the valve inlet is assumed to remain constant. The flow in
the control volume upstream of the valve throat can then be analyzed using well-known
equations for isentropic flow in a variable area duct (e.g., see Zucker, 1977). For the flow model,
the upstream pressure of the saturated vapor, the inner diameter of the pipe and the diameter of
the throat of the valve are prescribed. Imposing the choked flow condition at the valve throat,
which depends on operating conditions, all other flow properties in the control volume are then
determined.
The second control volume is analyzed to determine the flow conditions downstream of the
valve. Within this control volume, an aerodynamic boundary separates at the throat and attaches
............ u .. ·························t······u • n ••••• n ........................ t......................................... • .............. n ..... u ............ .
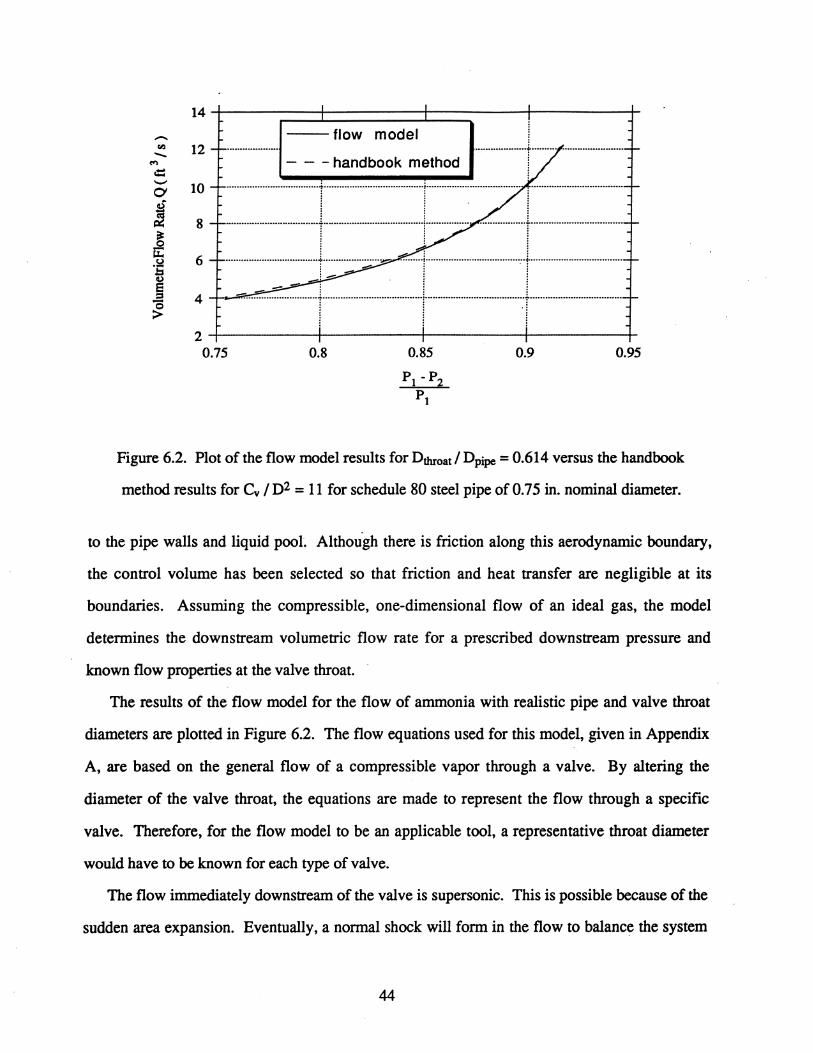
Figure 6.2. Plot of the flow model results for Dthroat / Dpipe = 0.614 versus the handbook
method results for Cv / D2 = 11 for schedule 80 steel pipe of 0.75 in. nominal diameter.
to the pipe walls and liquid pooL Althou·gh there is friction along this aerodynamic boundary,
the control volume has been selected so that friction and heat transfer are negligible at its
boundaries. Assuming the compressible, one-dimensional flow of an ideal gas, the model
determines the downstream volumetric flow rate for a prescribed downstream pressure and
known flow properties at the valve throat.
The results of the flow model for the flow of ammonia with realistic pipe and valve throat
diameters are plotted in Figure 6.2. The flow equations used for this model, given in Appendix
A, are based on the general flow of a compressible vapor through a valve. By altering the
diameter of the valve throat, the equations are made to represent the flow through a specific
valve. Therefore, for the flow model to be an applicable tool, a representative throat diameter
would have to be known for each type of valve.
The flow immediately downstream of the valve is supersonic. This is possible because of the
sudden area expansion. Eventually, a normal shock will form in the flow to balanc~ the system
44
pressures. The model, however, considers slug formation to occur before the normal shock can
be established. Unfortunately, the validity of the model becomes dubious in the supersonic cases
due to the breakdown of the one-dimensional flow assumption and the neglect of other
potentially important flow features. For example, because the flow at the throat is
underexpanded, expansion and compression waves will propagate down the pipe affecting the
vapor velocities as well as the vapor-liquid interface. The vapor at the throat is also subcooled,
causing the assumption of a perfect gas to be questionable. Furthermore, the asymmetrical
compliant boundary provided by the liquid pool will certainly have an effect on the flow. Lastly,
the gas flow has been assumed to be quasi-steady; the liquid depth and pressures are· assumed
constant. An increase in the complexity of the flow model is not warranted until experimental
data exist to evaluate the accuracy of the current model.
6.2 Handbook Method
The effectiveness of a method of flow analysis is partially determined by the ease with which
it may be used. Although the flow model allows for the exploration of the physical phenomena
that occur in the flow, this type of analysis is not commonly used in design and would be of
limited practical value. Current industry practice for analyzing the flow through valves consists
of using a handbook method where the flow is evaluated with a single flow equation. While this
analysis does not offer the physical insight of the flow model, the handbook method provides a
quick, simple tool for evaluating flow through valves.
The equation used by handbooks to determine the volumetric flow rate through a valve is
based on a general analysis of the head loss through a valve but is modified by flow factors to
account for various flow and piping conditions. The flow equation, which is derived in
Appendix B, is given as
(6.1)
where Cv is the flow coefficient, Fp is the piping geometry factor, x is the pressure drop ratio, Y
45
is the expansion factor, G is the gas specific gravity at standard conditions, and Z is the
compressibility factor. The flow coefficient is heavily dependent on the geometry of the valve
and is representative of a specific valve. The value of this coefficient is determined
experimentally for each valve and may be obtained from any valve sizing handbook. Other
geometrical characteristics are represented by the piping geometry factor, which is used to
account for any variations in the flow due to the addition of fittings and other physical
attachments to the valve. While formulas exist to approximate this factor, accurate values are
determined experimentally and listed in handbooks.
Other factors account for variations in the flow properties through the valve. The pressure
drop ratio, x, is a nondimensional expression of the pressure drop across the valve. This ratio is
defined by equation B.23 in Appendix B. Variables also account for compressibility effects
within the flow. The expansion factor, Y, is used to represent the changes in the fluid density
and the area of the vena conttacta created by the pressure variations. This factor may be
calculated from equations B.22 through B.24 in Appendix B.
The purpose of the remaining factors is to alter the general flow equation to represent the
working fluid. The gas specific gravity, G, specifies which fluid is being used. This factor is
defined as the ratio of the molecular weight of the gas over the weight of air at standard
conditions. Finally, the compressibility factor is a correction for the departure of the fluid from
the perfect gas state. The procedure for calculating this factor is to determine the reduced
pressure and temperature of the gas, using equations B.25 and B.26. Th~se values are then used
to find Z from a compressibility chart. Once all of these flow factors are calculated, the general
flow equation then becomes specific for a particular fluid through a given valve.
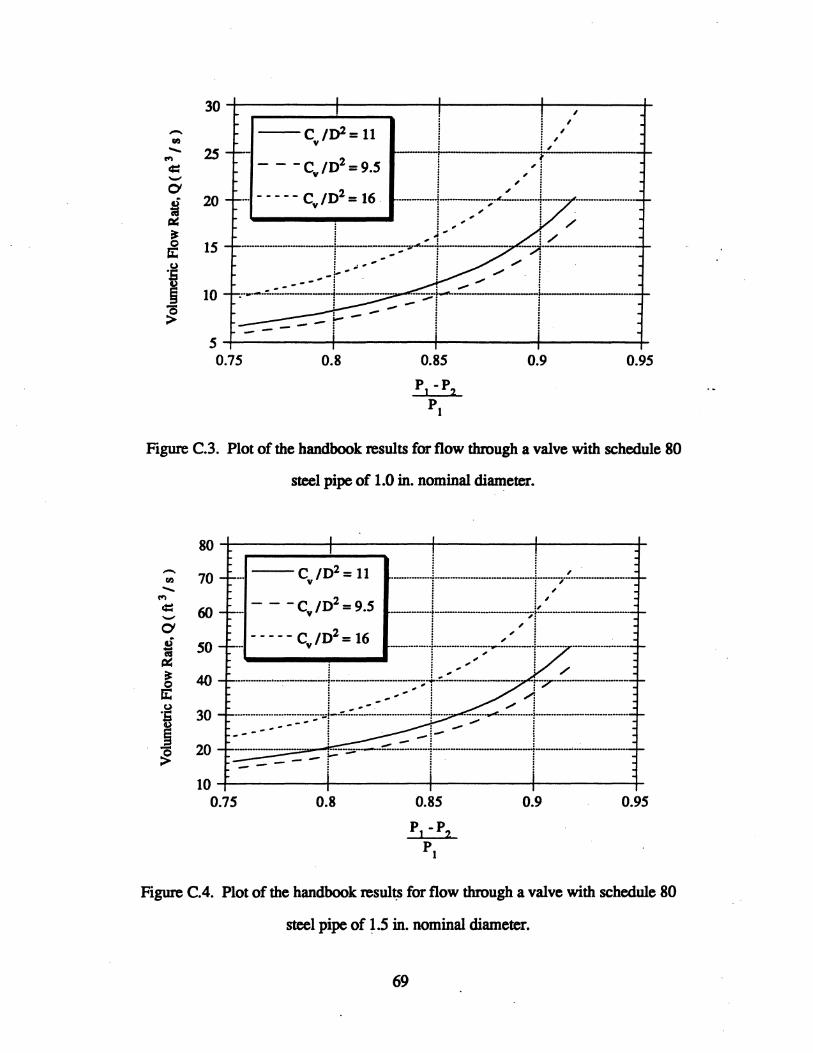
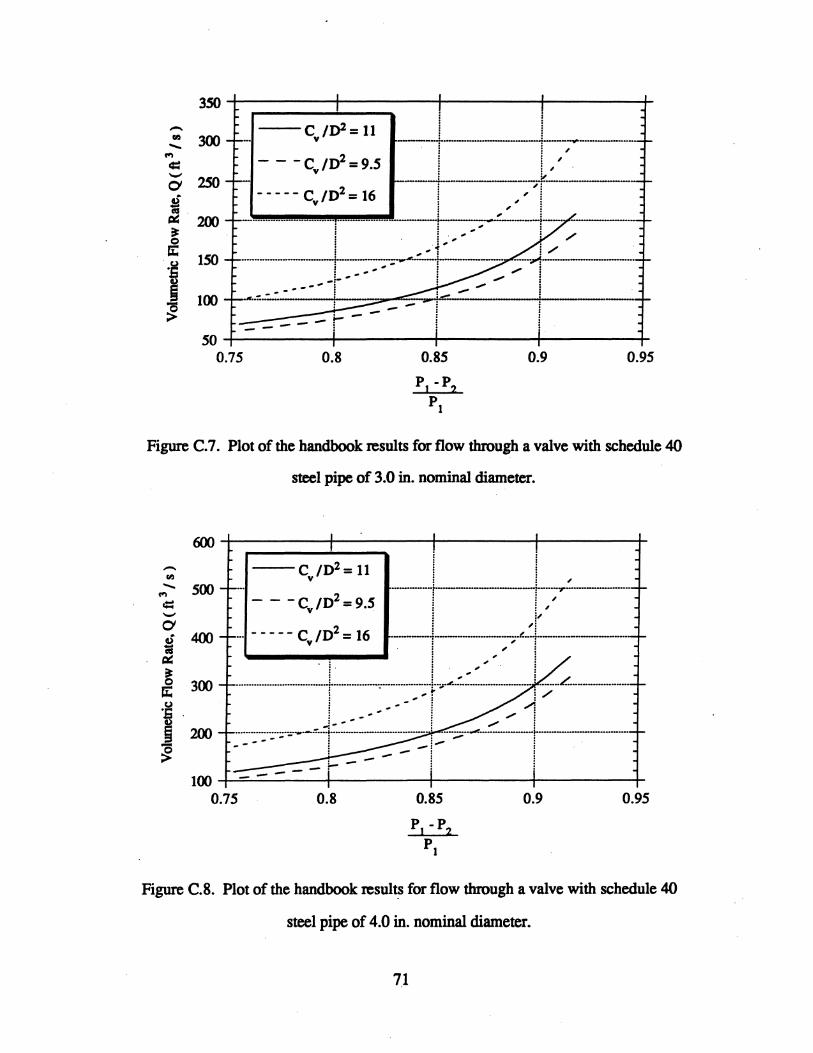
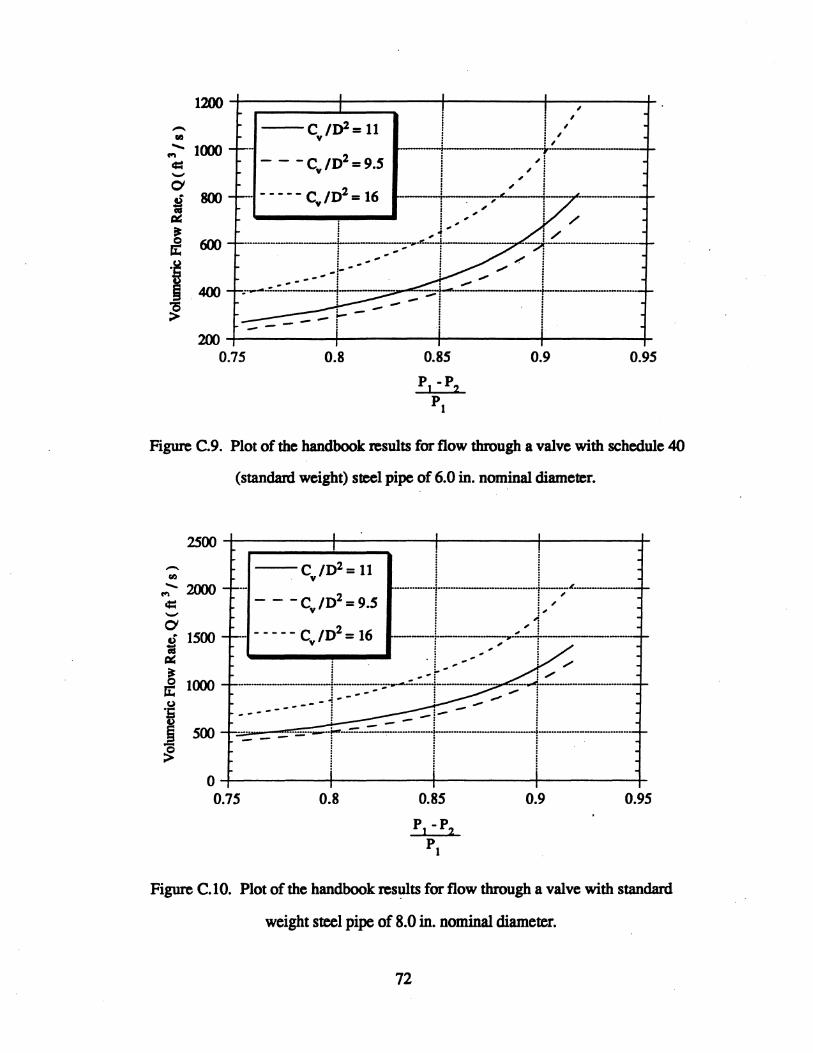
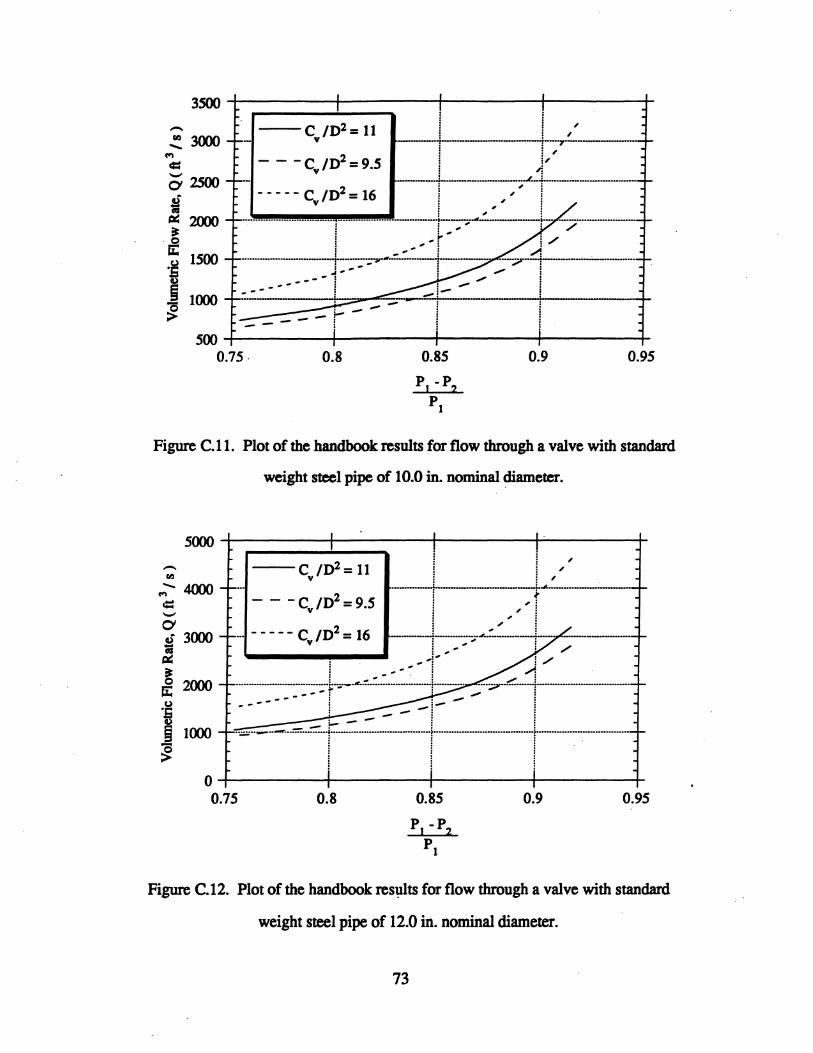
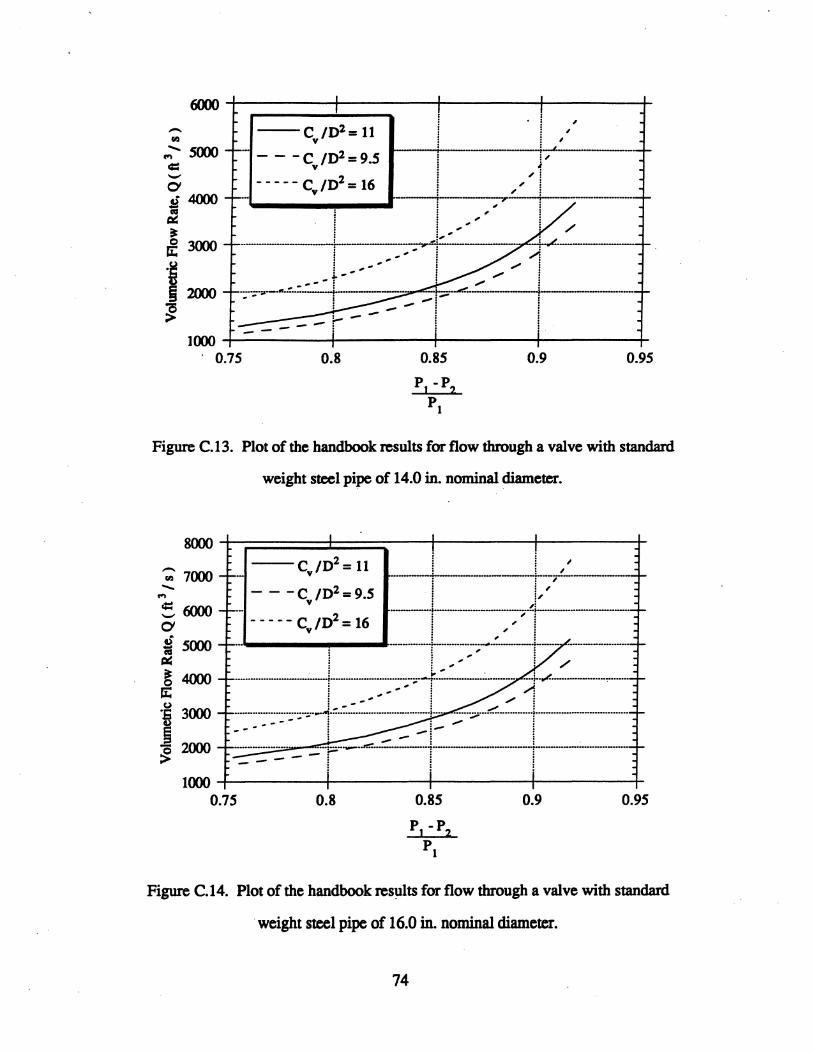
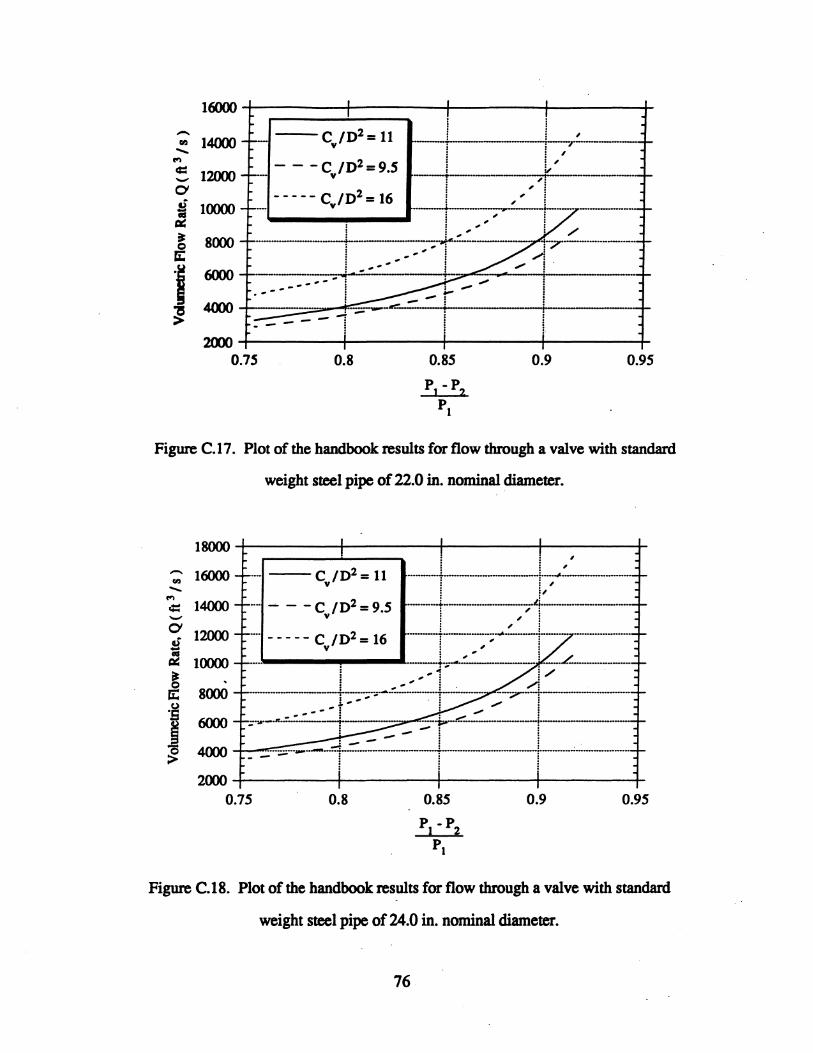
The results of the handbook method for the flow of ammonia through a valve are plotted in
Figure 6.2 and in Appendix C. The coordinates of this plot are the pressure drop ratio, x, versus
the volumetric flow rate, Q, and were chosen to correspond to the input and output of the general
flow equation. Figure 6.2 shows good agreement between the results of the handbook method
and the flow model. This indicates that the simpler handbook method may be substituted for the
46
flow model as part of the method for determining the susceptibility of a system to hydraulic
shock.
The handbook method has many of the same inaccuracies as the flow model. The general
flow equation is derived for the steady, incompressible flow of a perfect gas through a valve.
Although flow factors have been introduced into the equation to account for specific flow and
piping conditions, the handbook method still has the same difficulties as the flow model in .'
analyzing transient conditions and pressure waves. It is possible, however, that some of these
inaccuracies are accounted for by the modifications to the general flow equation.
6.3 Shock Maps
Flow regime maps provide excellent tools for predicting the possibility of a hydraulic shock.
A careful review of the literature, however, located no flow criteria directly applicable to the
situation under study. Most flow correlations are based on the steady, incompressible flow of
vapor over a moving liquid. The flow downstream of the valve, though, consists of the transient,
compressible, non-equilibrium flow of vapor over a stagnant liquid. Present flow maps are
sensitive to changes in system and fluid properties. Therefore, selection of an appropriate
transition criterion is challenging.
The flow transition criterion of Taitel, et al. (1978) was selected as the most suitable for the
existing flow conditions. This theory was chosen for several reasons. First, the transition criteria
is an extension of the original Taitel and Dukler flow regime map (Taitel and Dukler, 1976).
This map was derived from a theoretical analysis of slug formation rather than a correlation to
experimental data. Therefore, the transition requirements are less sensitive to changes in fluid
and system properties. Another reason for choosing this criterion is that it is the only analysis
found in the literature to address transient flow conditions. Taitel, et al. demonstrated that under
transient conditions the initiation of slug flow occurred at phase velocities different from those
predicted for normal flow conditions. The Taitel, et al. theory, though, was still able to
successfully predict the conditions for transition to slug flow. A third reason for selecting the
47
Taitel, et al. (1978) transition criteria is its ability to handle viscous effects. The original theory
was derived on the assumption of inviscid flow but was modified to include a viscous correction
factor. Barnea (1991) and Choe et al. (1978) found that, due to this correction factor, the Taitel
and Dukler (1976) transition theory worked well at low viscosities. The final reason for the
selection of the Taitel, et al. (1978) criterion is because of condensation effects. Although the
theory was derived for no mass transfer between the two phases, Bjorge (1982) found that the.
Taitel and Dukler (1976) transition criterion was able to successfully predict slug initiation for a
system containing condensing steam flowing over water. In ammonia systems, the vapor
upstream of the valve may be saturated. Therefore, the ability of a transition criterion to account
for condensation effects is a significant advantage.
The first part of the Taitel, et al. (1978) criterion for slug initiation is given in equation 2.5 as
(6.2)
where (l is zero for horizontal fluid flows, .the area of the vapor phase is
(6.3)
and the rate of change of the area of the liquid with respect to liquid depth is
(6.4)
Besides the vapor velocity criterion given in equation 6.2, there must also be enough liquid
available to bridge the pipe and form a stable slug. This condition is represented by the
requirement that hL / D ~ .5<1>, where <1> is the volume fraction of liquid in a slug. The volume
fraction varies from 0.7 to 1.0 due to the differences in the liquid requirements of the flow
regimes within the intermittent flow regime. No correlations have been found for determining <1>,
so the worst case scenario of <1> = .7 is used. At liquid depths near the worst case scenario the
flow regime may only be pseudo-slug (Andritsos, et al., 1992).
48
-.. u.I -ft'I
4:: --0 £' = .~
~ to)
·E
~ -~
102
101
10°
Figure 6.3. Graph of the criterion for transition to intermittent flow for schedule 80
steel and a nominal diameter of 0.75 in.
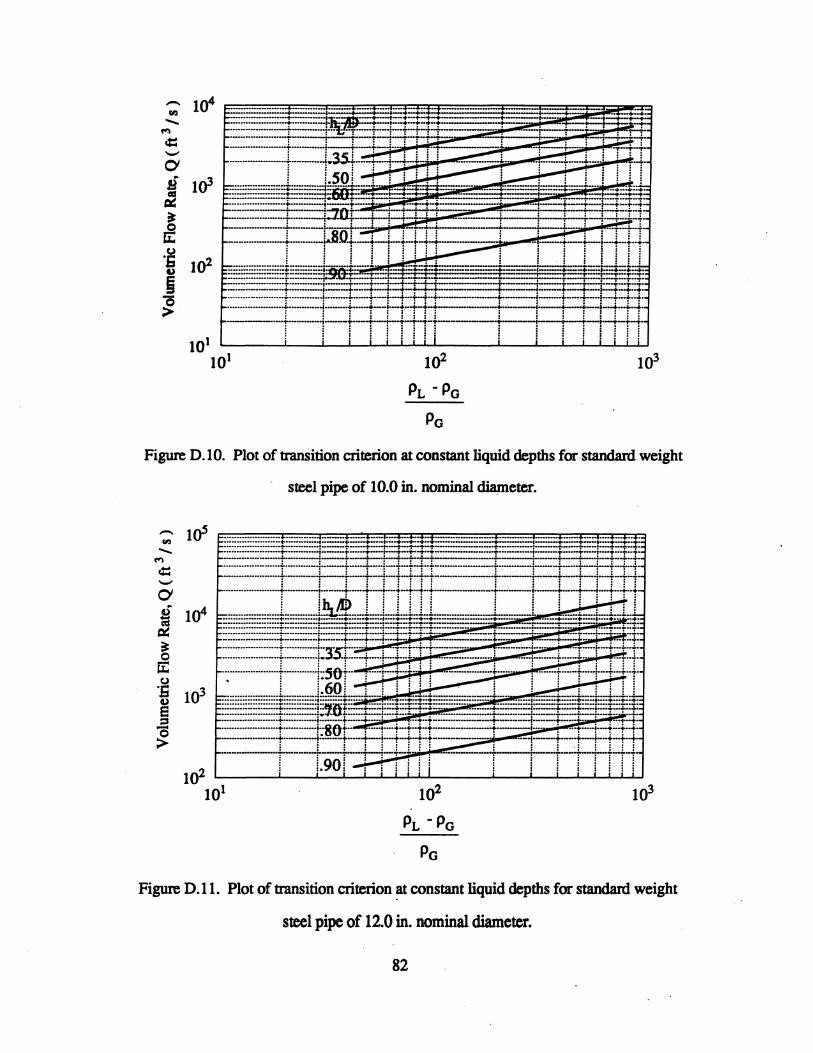
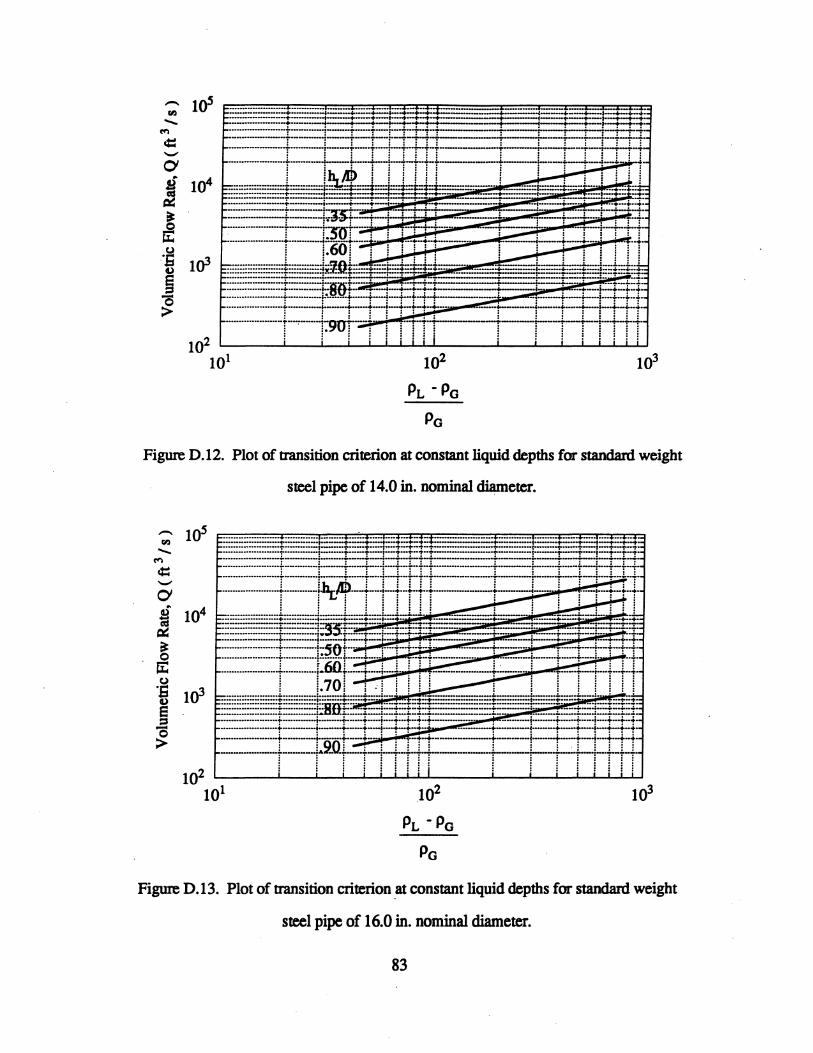
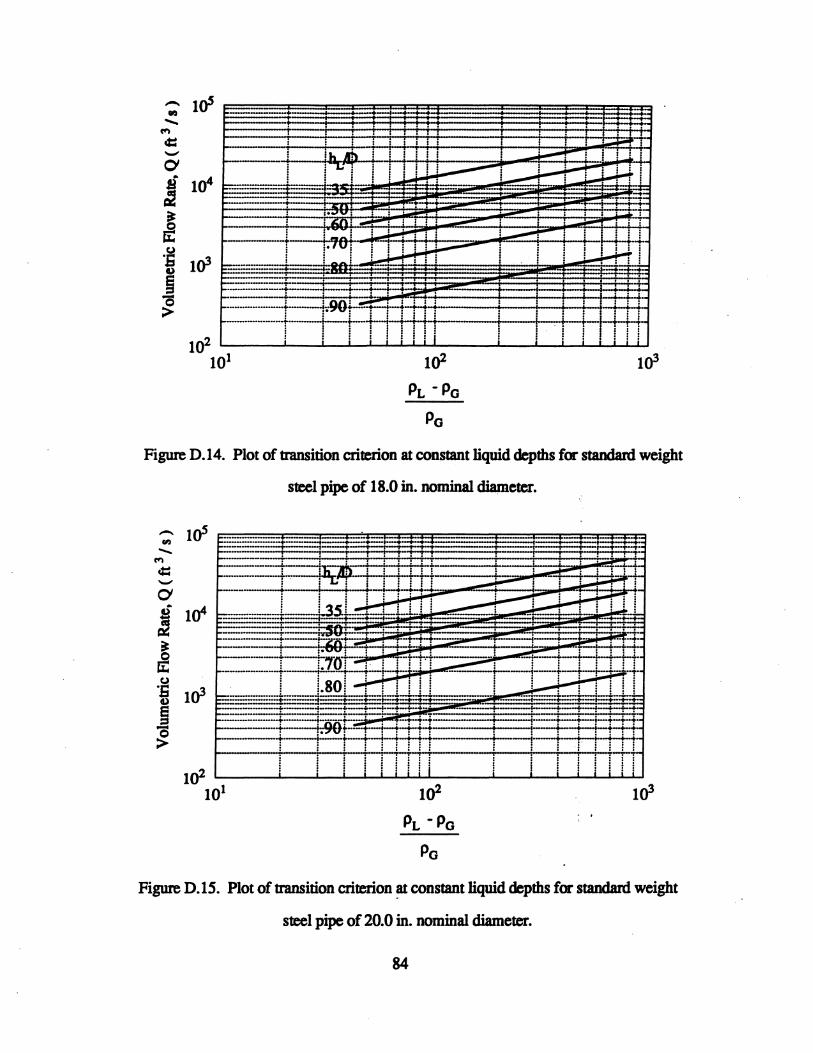
6.4 Use of the Shock Maps
The equations used to develop the shock maps have been given in this chapter and the
appendices. It is convenient to present the' transition criterion graphically for a particular pipe
diameter as shown in Figure 6.3. Such a representation allows the following graphical
procedure: for a given design, the volumetric flow rate is determined for a known defrost
pressure difference using a plot similar to Figure 6.2; this flow rate is then used to determine the
critical liquid depth using a plot like that of Figure 6.3. Condensate should not be allowed to
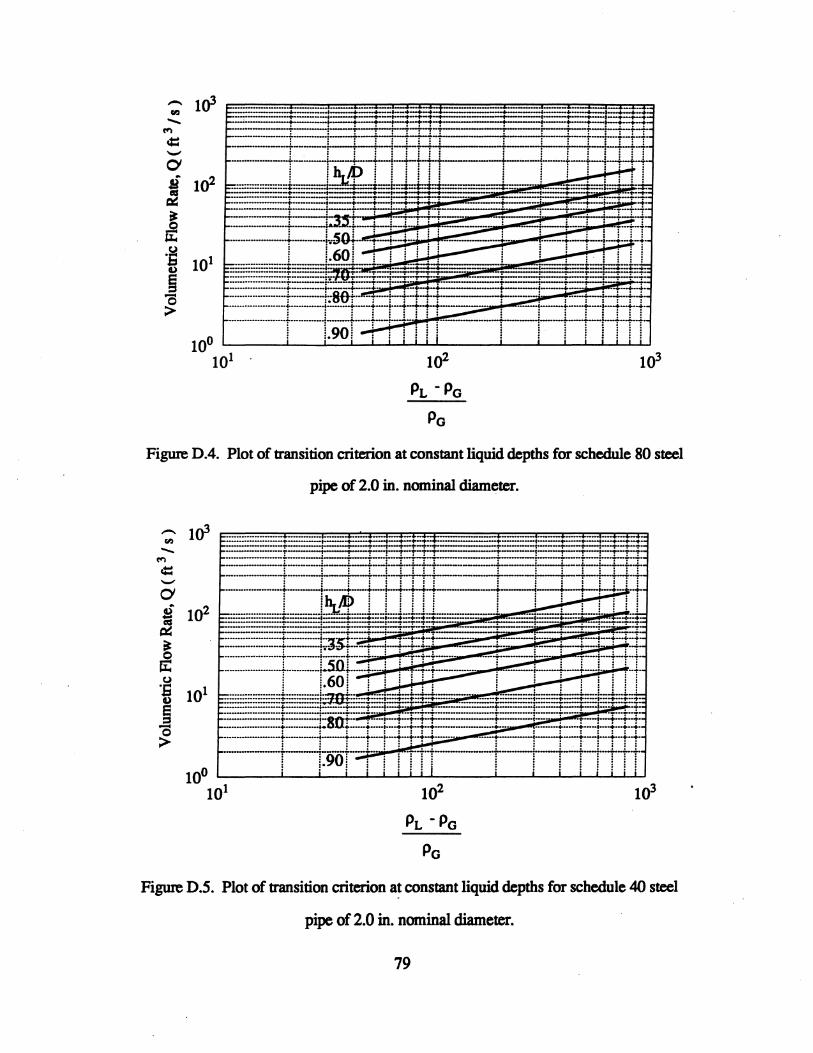
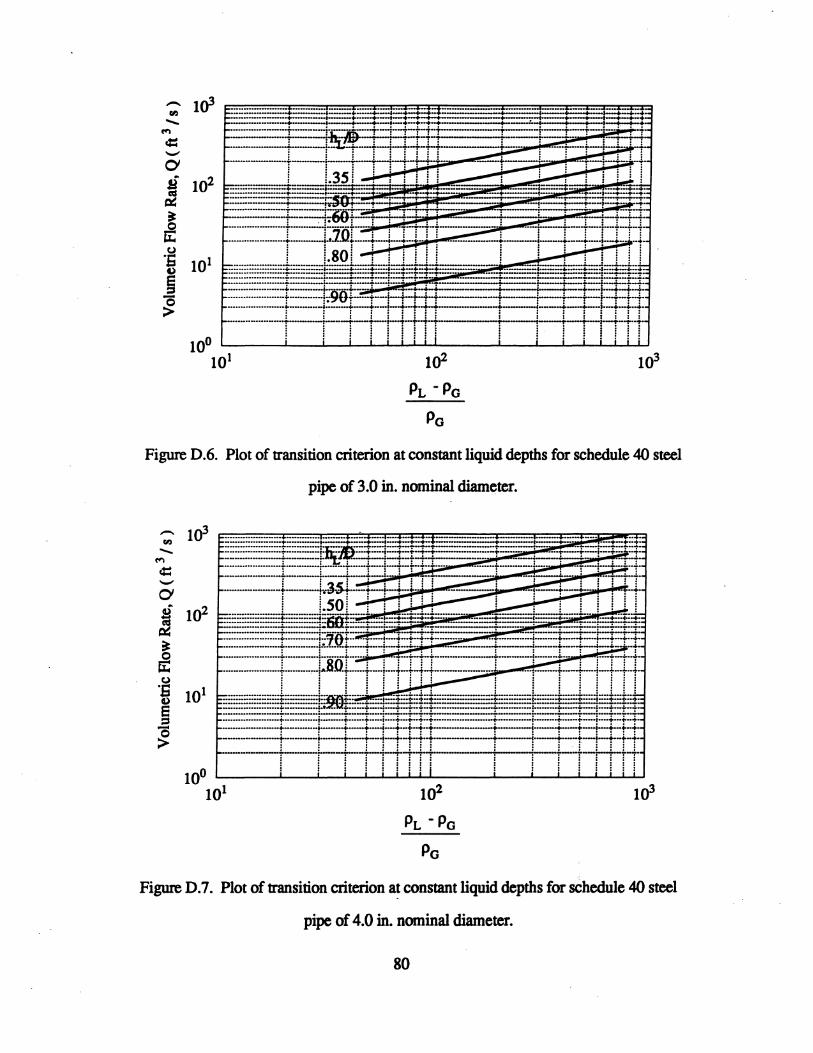
collect beyond this depth if hydraulic shock is to be avoided. Example plots of volumetric flow
rate versus pressure drop are given for several valves in appendix C. Plots of the Taitel, et al.
(1978) transition are given in Appendix D for various nominal pipe diameters commonly used in
ammonia refrigeration systems. Using these two appendices, the susceptibility to slug formation
and, therefore, hydraulic shock may be evaluated. For cases not given in the appendices, plots
similar to Figures 6.2 and 6.3 may be developed using the given equations.
49
Chapter 7
Conclusions and Recommendations
The focus of this work has been to develop a rational means to prevent the occurrence of
condensation-induced shock and vapor-propelled liquid slugging. ·This.was accomplished in the
previous chapters by reviewing two-phase flow, analyzing the initiating mechanisms of hydraulic
shocks, and determining the critical flow regimes that occur in industrial refrigeration systems.
In Chapter 2, the characteristics of two-phase flow were explored. This study analyzed the basic
flow regimes that occur in two-phase flow and established the effects which variations in flow
configuration, refrigerant, and oil concentration have on flow patterns. An important outcome of
this examination was that the flow maps were demonstrated to be an effective tool for predicting
flow regimes.
The properties of hydraulic shocks were presented in Chapters 3 and 4. Condensation
induced shock was analyzed in Chapter 3 by establishing the liquid inertial limits of the shock
and determining the effects that heat transfer has on the final pressure surge. A similar review of
vapor-propelled liquid slugging was presented Chapter 4. This chapter examined the effects
which fluid properties, flow conditions, and piping geometry have on the initiation mechanisms
of this hydraulic shock. Also, a practical example of a hydraulic shock scenario was analyzed to .
demonstrate the pressure surges that may occur.
The occurrence of these shocks in industrial refrigeration systems was studied in Chapter 5.
The parts of refrigeration systems that were susceptible to vapor-propelled liquid slugging and
condensation-induced shock were documented and descriptions of possible shock scenarios were
presented. A theoretical model of the initiation of these shocks was developed in Chapter 6.
From this model, flow maps were developed to provide a graphical tool for determining the flow
conditions present in a system. To make this tool more applicable, maps were also created using
a handbook method that is currently used in industry. Shock maps were developed' to establish
50
the flow conditions necessary for shock initiation. These shock maps were designed to be used
with the flow maps to provide a graphical technique for analyzing the susceptibility of a
refrigeration system to hydraulic shock.
Several changes in system designs and operating procedures are recommended to reduce the
susceptibility of a system to hydraulic shocks. As described previously, hydraulic shock occurs
during the hot gas defrost cycle when hot vapor from a region of high pressure is admitted into a
pipe containing condensate at low pressure. Therefore, to avoid occurrences of hydraulic shocks
in a system, the pressure differential and the amount of condensate in the pipes must be
minimized. Several system changes have been recommended by the International Institute of
Ammonia Refrigeration, Bulletin 116 (1992), and by L. Loyko (1989, 1992) and are summarized
as follows:
• Install valves or valve combinations that allow for the gradual release of
pressure into a low pressure pipe. .An example of this is the use of a small and a
large hot gas solenoid valve in parallel (Loyko, 1992). With this configuration, the
small solenoid valve opens fully at the initiation of hot gas defrost while the large
solenoid valve remains closed until the pressure differential across the valve has
been sufficiently reduced. An arr~gement similar to this is the installing of a small
bleed solenoid that bypasses the gas-powered suction stop (lIAR, 1992). For this
arrangement, the solenoid is opened first at the termination of hot gas defrost so that
the pressure in the evaporator may be bled down. Pressures should be bled down
such that the formation of a slug (per the shock maps) will not occur .
• Do not depend on pressure relief valves for the prevention of hydraulic shock.
During most shock incidents, the shock wave is reflected off the relief valve too fast
to trigger the opening of the valve. Therefore during most pressure transient
incidents pressure relief valves will never open (Loyko, 1989).
51
• Avoid the use of liquid traps in hot gas lines and suction lines (Loyko, 1989).
The trapped liquid becomes a triggering mechanism for the initiation of liquid slugs
and thus enhances the occurrences of hydraulic shock in a system. Liquid drains,
however, may be installed in the hot gas main at any low points that can not be
avoided (HAR, 1992).
• Evaporators should be pumped-out before the initiation of hot gas defrost. The
pipes in the liquid-overfeed evaporators used in low-temperature ammonia systems
are usually filled with liquid, especially during low-load periods. This allows any
compression waves created by hydraulic shocks to propagate through the pipes with
pressures up to 2000 psig (HAR, 1992)
• Minimize the condensation of hot gas in the hot gas main. To do this requires
the reduction of heat transfer from the hot gas main to the environment. This can be
accomplished in several ways. ~e hot gas main should be routed outside the
conditioned room when possible (Loyko, 1989). Insulation should be added to the
hot gas main (HAR, 1992). Also, the minimum size hot gas pipe that is required for
defrost should be used (lIAR, 1992).
• Examine the positioning of check valves throughout the hot gas defrost system.
Check valves should be on the downstream side of any device that can be
completely closed. This is so that liquid does not become trapped between the
device and the check valve (lIAR, 1992). Also, a check valve should be placed
between the evaporator and the pan coil so. that flow from the evaporator does not
enter the pan coil and become an instrument for slug initiation (Loyko, 1989).
• Ensure that welds are complete penetration (Loyko, 1992). Any notches,
grooves, or discontinuities that occur in a piping system magnify the effects of
52
hydraulic shock thereby increasing the chances of pipe damage or breaks. Also, end
caps should be used instead of fillet-welded flat plates whenever possible (Loyko,
1989).
The pwpose of this research has been to develop a rational means with which to prevent or at
least decrease the occurrence of vapor-propelled' liquid slugging and condensation-induced shock
in industrial refrigeration systems. Several changes in system designs and operating procedures
have been recommended which reduce the pressure and temperature discontinuities that cause
hydraulic shocks. Two techniques have been presented to determine the susceptibility of a
refrigeration system to hydraulic shocks under specific flow conditions. While these methods
should be verified with experimental data, the combination of these tools provides an effective
means with which to avoid hydraulic shocks in refrigeration systems.
53
References
Andritsos, N., Bontozoglou, V. and Hanratty, TJ., 1992, "Transition to Slug Flow in Horizontal Pipes," Chemical Engineering Communications, Vol. 118, pp. 361-385.
Baker, 0., 1954, "Simultaneous Flow of Oil and Gas~" The Oil and Gas Journal, July 26, pp. 185-195.
Bamea, D., 1991, "On the Effect of Viscosity on Stability of Stratified Gas-Liquid Flow -Application to Flow Pattern Transition at Various Pipe Inclinations," Chemical Engineering Science, Vol. 46 (8), pp. 2123-2131.
Bamea, D., Luninski, Y. and Taitel, Y., 1983, "Flow Pattern in Horizontal and Vertical Two Phase Flow in Small Diameter Pipes," CanDdian Journal of Chemical Engineering, Vol. 61, pp. 617-620.
Bamea, D., Shoham, 0., Taitel, Y. and Dukler, A.E., 1980, ''Flow Pattern Transition for GasLiquid Flow in Horizontal and Inclined Pipes," Inlernlltional Journal of Multiphase Flow, Vol. 6, pp. 217-226.
Bamhan, J.S. and Peters, J.E., 1992, "An Experimental Investigation of Flow Patterns and Liquid Entrainment in a Horizontal-Tube Evaporator," ACRC TR-28, University ofDlinois at Champaign-Urbana, Urbana, IL. .
Biasi, L., Prosperetti, A. and Tozzi, A., 1972, "Collapse of a Condensing Bubble in Compressible Liquids," Chemical Engineering Science, Vol. 27, pp. 815-822.
Bjorge, R.W., 1982, "Initiation of Water Hammer in Horizontal or Nearly-Horizontal Pipes Containing Steam and Subcooled Water," PhD Thesis, Massachusetts Institute of Technology, Cambridge, MA.
Breber, G., Palen, J.W. and Taborek, J., 1980, "Prediction of Horizontal Tubeside Condensation of Pure Components Using Flow Regime Criteria," Journal of Heat Transfer, Vol. 102, pp. 471-476.
Choe, W.G., Weinberg, L. and Weisman, J., 1978, "Observation and Correlation of Flow Pattern Transition in Horizontal, Co-Current Gas-Liquid Flow," In Two-Phase Transport and Reactor Safety, ed. by T.N. Veziroglu and S. Kakac, Hemisphere Publ. Co., Washington.
Cole, R.A., 1994, Cole R.A. & Associates, Personal communication.
Dulder, A.E. and Taitel, Y., 1986, "Flow Pattern Transitions in Gas-Liquid Systems: Measurement and Modeling," Multiphase Science and Technology, Vol. 2, ed. by G.F. Hewitt, J.M. Delbaye, and N. Zuber, Hemisphere Publ. Co., Washington, pp. 1-94.
Florschuetz, L.W. and Chao, B.T., 1965, "On the Mechanics of Vapor Bubble Collapse," Journal· . of Heat Transfer, Vol. 87 (2), pp. 209-220.
54
Hashizume, K., 1983, "Flow Pattern and Void Fraction of Refrigerant Two-Phase Flow in a Horizontal Pipe," Bulletin o/the JSME, Vol. 26 (219), pp. 1597-1602.
Hickling, R. and PIes set, M.S., 1964, "Collapse and Rebound of a Spherical Bubble in Water," Physics 0/ Fluids, Vol. 7 (I), pp. 7-14.
Hunter, C., 1960, "On the Collapse of an Empty Cavity in Water," Journal 0/ Fluid Mechanics, Vol. 8, pp. 241-262.
International Institute of Ammonia Refrigeration, 1992, "Guidelines for A voiding Component Failure in Industrial Refrigeration Systems Caused by Abnormal Pressure or Shock," BULLETIN 116.
Instrument Society of America, 1985, "Flow Equations for Sizing Control Valves," ANSI I ISAS75.01.
Kordyban, E., 1990, "Horizontal Slug Flow: A Comparison of Existing Theories," Journal 0/ Fluids Engineering, Vol. 112, pp. 74-83.
Kordyban, E. and Okleh, A.H., 1993, "The Effect of Surfactants on Wave Growth in the Transition to Slug Flow," Instability in Two-Phase Flow Systems, HID-Vol. 260 I FED-Vol. 169, ASME, pp. 73-84. .
Kordyban, E. and Okleh, A.H., 1992, "Growth of Interfacial Waves and the Transition to Slug Flow: Effect of Liquid Properties," Cavitation and Multiphase Flow Forum, FED-Vol. 135, ASME, pp. 17-21.
Loyko, L., 1992, "Condensation-Induced Hydraulic Shock," Presented at llAR 14th Annual Meeting, March 22-25.
Loyko, L., 1989, "Hydraulic Shock in Ammonia Systems," Presented at llAR 11th Annual Meeting, March 12-15.
Mandhane, I.M., Gregory, G.A. and Aziz, K., 1974, "A Flow Pattern Map for Gas-Liquid Flow in Horizontal Pipes," International Journal o/Multiphase Flow, Vol. 1, pp~ 537-553.
Manwell, S.P. and Bergles, A.E., 1989, "Gas-Liquid Flow Patterns in Refrigerant-Oil Mixtures;" Heat Transfer Laboratory Report #H1L-3, Rensselaer Polytechnic Institute, Troy, NY.
Milne-Thomson, L.M., 1960, Theoretical Hydrodynamics. MacMillan, New York, NY.
Mishima. K. and Ishii, M., 1980, "Theoretical Prediction of Onset of Horizontal Slug Flow", Journal o/Fluid Engineering, Vol., 102, pp. 441-445.
Moalem, D. and Sideman, S., 1973, "The Effect of Motion on Bubble Collapse," International Journal 0/ Heat and Mass Transfer, VoL 16, pp. 2321-2329.
Rayleigh, Lord, 1917, "On the Pressure Developed in a Liquid During the Collapse of a Spherical . Cavity," Philosophical Magazine, Vol. 34, pp. 94-98.
55
Schicl, H.H., 1969, "Flow Patterns for an Adiabatic Two-Phase Flow of Water and Air Within a Horizontal Tube," Ver/ahrenstechnilc, Vol. 3, pp. 153-161.
Schlager, L.M., 1988, "The Effect of Oil on Heat Transfer and Pressure Drop During Evaporation and Condensation of Refrigerant Inside Augmented Tubes," PhD Thesis, Iowa State University, Ames, IA.
Shah, M.M., 1975, "Visual Observations in an Ammonia Evaporator," ASHRAE Transactions, Vol. 81, pp. 295-301.
Soliman, H.M., 1974, "Analytical and Experimental Studies of Flow Patterns During Condensation Inside Horizontal Tubes," PhD Thesis, Kansas State University, Manhattan, KS.
Taitel, Y., 1977, "Flow Pattern Transition in Rough Pipes," International Journal of Multiphase Flow, Vol. 3, pp. 597-601.
Taitel, Y., Bamea, D. and Dulder, A.E., 1980, "Modelling Flow Pattern Transitions for Steady Upward Gas-Liquid Flow in Vertical Tubes," A1ChE Journal, Vol. 26 (3), pp. 345-354.
Taitel, Y. and Dukler, A.E., 1976, "A Model for Predicting Flow Regime Transitions in Horizontal and Near Horizontal Gas-Liquid Flow," A1ChE Journal, Vol. 22 (1), pp. 47-55.
Taitel, Y., Lee, N. and Dulder, A.E., 1978, "Transient Gas-Liquid Flow in Horizontal Pipes: Modeling the Flow Pattern Transitions," A1ChE Journal, Vol 24 (5), pp. 920-934.
Tandon, T.N., Vanna, H.K. and Gupta; C.P., 1983, "An Experimental Study of Flow Patterns During Condensation Inside a Horizontal Tube," ASHRAE Transactions, Vol. 89 (2A), pp. 471-482.
Trilling, L., 1952, "The Collapse and Rebound of a Gas Bubble," Journal of Applied Physics. Vol. 23 (1), pp. 14-17.
Wallis, G.B. and Dobson, I.E., 1973, "The Onset of Slugging in Horizontal Stratified Air-Water Flow," International Journal ofMuitiphase Flow, Vol. I; pp. 173-193.
Weisman, I., Duncan, D., Gibson, I. and Crawford, T., 1979, "Effects of Fluid Properties and Pipe Diameter on Two-Phase Flow Patterns in Horizontal Lines," International Journal of Multiphase Flow, Vol. 5, pp. 437-462.
Wittke, D.D. and Chao, B.T., 1967, "Collapse of Vapor Bubbles with Translatory Motion," Journal of Heat Transfer, Vol. 89 (1), pp. 17-24.
Worsoe-Schmidl, P., 1960, "Some Characteristics of Flow Pattern and Heat Transfer of Freon-12 Evaporationg in Horizontal Tubes," The Journal of Refrigeration, Vol. 3, pp. 40-44.
Zucker, R., 1977, Fundamentals of Gas Dynamics, Matrix Publishers Inc., Chesterland, OH.
56
Appendix A
Flow Model Derivation
. To analyze the physics of the fluid flow, the valve opening prOcess is modeled as a
diaphragm bursting in an orifice. As shown in Figure A.l, the flow in the model is separated in~
two regions. The first control volume, lOCated upstream of the orifice, consists of a converging
nozzle which represents the region of from the valve inlet to the valve port. The flow conditions
in this region are modeled with general one-dimensional compressible flow equations assuming
Figure C.18. Plot of the handbook results for flow through a valve with standard
weight steel pipe of 24.0 in. nominal diameter.
76
AppendixD
Shock Maps
The shock maps indicate when a system is susceptible to vapor-propelled liquid slugging and
condensation-induced shock. For each map. the criterion for shock occurrence is plotted for
various liquid depths. The ordinate is given as a ratio of the phase densities at the downstream
conditions. For a given amount of condensate in a pipe. if the volumetric flow rate detennined
from the flow map is above the transition line on the corresponding shock map then hydraulic
shocks may occur.
-- 102 fIl -C"'I
¢:: -0
1 101
~
~ (J
'S 10° v § "S >
. Figure 0.1. Plot of transition criterion at constant liquid depths for schedule 80 steel
pipe 0.75 in. nominal diameter.
77
==~:==:..-==+:===.:::::::.-+=:.::=,~- ======~-='-4--+--+-J=+-+-Io ... ----+-----t- I , I , , I • I---t, , .---r---! !! !!!!! !!!! f •••
I ! : : ! : : ! ! : : : : : . : . :
-+-+-+±..;-;
Figure D.2. Plot of transition criterion at constant liquid depths for schedule 80 steel
pipe of 1.0 in. nominal diameter.
- 102 WJ -~ ct:: -a
~ 101
~ 0 ti: to) ·s 10° 4.)
e = -0 >
i" i 10-1
: : :
101 102 103
PL -Po
Po
Figure D.3. Plot of transition criterion a~ constant liquid depths for schedule 80 steel
pipe of 1.5 in. nominal diameter.
78
- 103 co -tf'I ct: - i : : : :
Ci
J 102
~
if ·S 101 I)
§ ~
10° 101 102 103
PL -PO
Po
Figure D.4. Plot of transition criterion at constant liquid depths for schedule 80 steel
pipe of 2.0 in. nominal diameter.
- 103 co -tf'I c::: -Ci
! ~
102
~
~ u 'S I) 101
~ 10°
!.90!
101 102 103
PL -Po
Po
Figure D.S. Plot of transition criterion at constant liquid depths for schedule 40 steel
pipe of 2.0 in. nominal diameter.
79
• T ----=-t-- i
j 'j"i'1::t::.:...-_-_-_-=..L. I:' i ,--+l---i I --i-'-i-+-
i I
Figure D.6. Plot of transition criterion at constant liquid depths for schedule 40 steel
pipe of 3.0 in. nominal diameter.
Figure D.7. Plot of transition criterion a! constant liquid depths for schedule 40 steel
pipe of 4.0 in. nominal diameter.
80
- 104 ~ -«'I
ct:: -Ci
! 103
~
~ Co)
'E 102 4)
§ "0 >
101
101 102 103
PL -PO
Po
Figure D.8. Plot of transition criterion at constant liquid depths for schedule 40
(standard weight) steel pipe of 6.0 in. nominal diameter.
- lO4 ~ -«'I
ct:: -Ci as ~ 103 ~ ~ 0
f1:: Co)
'E lol 4)
e .a ~
101
101 102 103
PL -Po
Po
Figure D.9. Plot of transition criterion ~t constant liquid depths for standard weight
steel pipe of 8.0 in. nominal diameter.
81
-MI ...... ~
ct:: -o
! ~ u ·s i ~.
104 ._--_ ... _._ .. _ .. , .. -_. __ ._...... t
-i
103
102
Po
Figure 0.10. Plot of transition criterion at constant liquid depths for standard weight
steel pipe of 10.0 in. nominal diameter.
Po
Figure 0.11. Plot of transition criterion ~ constant liquid depths for standard weight
steel pipe of 12.0 in. nominal diameter.
82
Figure 0.12. Plot of transition criterion at constant liquid depths for standani weight
steel pipe of 14.0 in. nominal diameter.
Figure 0.13. Plot of transition criterion .at constant liquid depths for standani weight
steel pipe of 16.0 in. nominal diameter.
83
- lOS VJ I I ~ - t_ I-! ! ! !
tf'I
4:: I : : -CI
S 104
~ 'E i
103 I I
C)
;; I § : '0 I >
102 r
101 lol 103
PL -Po
Po
Figure D.14. Plot of transition criterion at constant liquid depths for standard weight
steel pipe of 18.0 in. nominal diameter.
- lOS rn ..... _ ....... _ ....... -_.--.---...-. ......=.-.... --_."-...--==::'--+---to-.--tf'I .---.--....... ~:::-: -::j:I"-=-::j:-:-::t' I ,.,.· .. 1'"'..----·-"1"---t I • I ! -r-r-r-r!! ---r----! ! !..!
4:: -CI £ ~
104
~ ()
'S 103 C)
.§ 0 >
103
Figure D.1S. Plot of transition criterion ~ constant liquid depths for standard weight
steel pipe of 20.0 in. nominal diameter.
84
- lOS 10 -. f"I
ct: -0
J 104 - ' ..
~ :
·S 103 I)
§ 15 >
102 101 102 103
PL -Po
Po
Figure D.16. Plot of transition criterion at constant liquid depths for standard weight
steel pipe of 22.0 in. nominal diameter.
Figure D.17. Plot of transition criterion ~ constant liquid depths for standard weight
steel pipe of 24.0 in. nominal diameter.
85
AppendixE
Experimental Design for the Study of Hydraulic Shocks
There are many variables significantly affecting the initiation of hydraulic shock in refrigeration
equipment, including effects due to the physical design of the piping system, the properties of the
working fluid, and the characteristics of the fluid flow. Although the theoretical work we have
reported provides a deeper understanding of these effects and recommendations for avoiding
hydraulic shock, experiments are needed to validate this work and to detennine the actual pressure
excursions during these events. In this appendix, these experiments are described in a fOnD that
may help extend this work.
E.1 TITLE
An experimental study of refrigerant line transients: condensation-induced shock and vapor
propelled liquid slugging.
E.2 BACKGROUND
On November 13, 1973, a reactor trip occUlTed at the Indi~ Point nuclear reactor station, and a
steam generator feedwater line was damaged by an accompanying water hammer event. The water
hammer event was subsequently attributed to condensation-induced shock (Bjorge, 1983). In the
years following this incident, the NRC initiated a series of water hammer research programs, and
designated water hammer Unresolved Safety Issue A-I. Condensation-induced shock and vapor
propelled liquid slugging emerged as the two most serious water-hammer initiating mechanisms in
the nuclear power industry. Chou (1988) classified 281 water hammer events reported to the NRC
over a nineteen-year period beginning in 1967 and found that these two mechanisms account for
the majority of all water hammer events reported in that industry.
86
The refrigeration industry faces similar difficulties with condensation-induced shock and
vapor-propelled liquid slugging. These mechanisms for hydraulic shock have reportedly
contributed to incidents and failures in refrigeration systems (Loyko, 1989, 1992), but they are not
well understood. As ozone depletion and global warming issues force the industry's move to
alternative refrigerants, including ammonia, and as the shift to centralized system designs
continues, the implications on public safety, system down-time, repair costs, and product loss'
make hydraulic shock in refrigeration lines a crucial issue.
ASHRAE sponsored a literature review and theoretical study of shock initiating mechanisms in
refrigerant lines (736-RP); that study provided convincing evidence that condensation-induced
shock and vapor-propelled liquid slugging can be important in refrigeration systems. Preliminary
recommendations for design and operating procedures to reduce the frequency of hydraulic shock
in refrigerant lines were also provided.
E.3 JUSTIFICATION OF NEED
The earlier ASHRAE-sponsored project significantly advanced our understanding of two-phase
transients in refrigerant lines. The results provide engineers and designers with preliminary
recommendations for how to avoid the dangerous risks associated with condensation-induced
shock and vapor-propelled liquid slugging. Unfortunately, a theoretical study is necessarily based
on a number of simplifying assumptions, and some of these assumptions may have important
impacts on the model accuracy. An experimental study is needed to assess the validity of the
existing theoretical model of shock initiation." The results of this project will validate (or correct)
the earlier study, and they will make a significant contribution to Chapter 4, "System Practices for
Ammonia," of the Refrigeration Handbook.
E.4 SCOPE
1) Measure the flow rate downstream of a fast-opening valve for conditions representative of
typical valves, piping arrangements, and operating conditions associated with the initiation
87
and tennination of hot-gas defrost in ammonia systems. These experiments are to include
situations in which the pipe downstream of the valve is partially filled with a standing liquid
(of varying depths). Realistic operating conditions must include cases for which the flow
is choked at the throat of the valve upon opening. It is expected that these experiments will
be conducted for several downstream piping arrangements (with elbows, tees, and end
caps) and for representative thermal conditions. The experiments should inclu~
observations in horizontal and vertical pipes. The maximum flow rate and time-dependent
behavior should be characterized and compared to analytical and/or handbook flow
predictions.
2) Detennine the two-phase flow regimes associated with the conditions descri~ in part (1). Of
particular interest is transition to intennittent flow during the rapid opening of a valve. Pipe
lengths must allow the development of slug flow. The results will be compared to existing
flow regime maps and dynamic (time dependent) criteria for the transition from wavy
stratified to slug flow.
3) Measure the pressure excursions and retaining forces exerted on the piping system during the
flow transients described in part (1). These measurements should be compared to existing
models (e.g., the Ioukowski equation) for pressure shocks associated with slug impact.
4) The results of this study must be used to validate the 'models developed through 736-RP or to
recommend alternative methods for characterizing the occurrence and outcome of
condensation-induced shock and vapor-propelled liquid slugging during the initiation or
tennination of hot-gas defrost.
E.S AN EXAMPLE EXPERIMENT DESIGN
Many approaches to experiment design can satisfy the scope derIDed in the previous section. A
simplified candidate design is shown schematically in Figure E.1
88
Controlled high-pressure reservoir
Controlled low-pressure reservoir
Test section
Simulated valve opening
Figure E.1. A representative experiment schematic
Termination -elbow, -tee, or -end cap
Experiments would be conducted for the conditions discussed above by setting the controlled
reservoirs to the desired states and simulating a valve opening by bursting a diaphragm located at
the throat of the simulated valve. Experiments with a few commercial valves would be undertaken
flI'St to allow sizing of the simulated valv~. Subsequent experiments would be conducted with the
simulated valve, as it will provide better repeatability. The test section would be of variable length,
diameter and orientation. It could be equipped with an elbow (as shown), a tee (with one branch
terminated by an end cap, and the other feeding the low-p reservoir), or an end-cap. All of the
measurements discussed above would be conducted in the test section.
89
AppendixF
Annotated Bibliograpby
The initial analysis of two-phase flow regimes, condensation-induced shock, vapor-propell¢
liquid slugging, and ammonia refrigeration systems was accomplished through a review of the
extant literature concerning these topics. In order to complete the review, over 240 articles related
to the subjects of this research were obtained. Each article was then reviewed and compiled into an
extensive annotated bibliography. Due to its size, the annotated bibliography has been divided into
four subject areas: two-phase flow, vapor bubble collapse, slug flow transition, and hydraulic
shock analysis.
90
Two-Phase Flow Regimes
Author l:ilk Source Comments
. Akagawa, K. Studies on the Fluctuation of Bulletin of the Japan Society of Mechanical Experimental study of the variance of Hamaguchi, H. Pressure Drop in Two Phase Engineers, Vol. 14 (71), 1971, pp. 447-454 pressure drop with time in a two-phase Sakaguchi, T. Slug Flow (1st Report) slug flow Ikari, T.
Akagawa, K. Studies on the Fluctuation of Bulletin of the Japan Society of Mechanical Theoretical analysis of the fluctuation Hamaguchi, H. Pressure Drop in Two Phase Engineers, Vol. 14 (71), 1971, PP.455-461 of pressure drop in two-phase slu.g Sakaguchi, T. Slug Flow (2nd Report) flow Ikari, T.
Akagawa, K. Fluctuation of Void Ratio in Two Bulletin of the Japan Society of Mechanical A study of the velocities associated Sakaguchi, T. Phase Flow Engineers, Vol. 9 (33), 1966, pp.I11-120 with gas and liquid slugs
Akai,M. A Co-Current Stratified Air-Mercury International Journal of Multiphase Flow, Analytical and experimental study of Inoue, A. Flow with Wavy Interface Vol. 6 (3), 1980, pp. 173-190. a concurrent, stratified, air-mercury Aoki, S. flow in a horizontal channel Endo, K.
Andritsos, N. Influence of Interfacial Waves in AIChE Journal, Vol. 33 (3), 1987, An improved method for predicting Hanratty, T.J. Stratified Gas-Liquid Flows pp. 444-454. frictional pressure drop and liquid
height in a horizontal, stratified flow
Ardron, K.H. One Dimensional Two Fluid International Journal of Multiphase Flow, Comparison of calculated wave Equations for Horizontal Stratified Vol. 6 (4), 1980, pp. 295-304. propagation speeds and stability Two Phase Flow limits for horizontal stratified two
phase flow with an exact solution
91
Azzopardi, BJ. The Effect of Flow Patterns on International Journal of Multiphase Flow, Study of the effect of upstream flow Whalley, P .B. Two Phase Flow in a T Junction Vol. 8 (5), 1982, pp. 491-507. patterns on two phase flow in sharp
edged T junctions
Baker, O. Simultaneous Flow of Oil and Gas Thge Oil and Gas Journal, July, 26, 1954 Develops a flow map for horizontal pp. 185-195. flow regimes
Banerjee, S. Film Inversion of Cocurrent Two AlChE Journal, Vol. 13 (1), 1967, Experimental results concerning the Rhodes, E. Phase Flow in Helical Coils pp. 189-191. occurance of film inversion in Scott, D.S. cocurrent two phase flow in helical
coils
Bankoff, S.G. Some Condensation Studies International·Journal of Multiphase Flow, Discussion of steady-state turbulent Pertinent to L WR Safety Vol. 6 (1-2), 1980, pp. 51-67. stratified flows and of bubble studies
as applied to reactor safety.
Bell, M.K. Two-Phase flow in Sloped ASH RAE Transactions, Vol.87 (2), Study of bubble flow, plug flow, Howell, R.H. Gravity-Driven Condensate Return 1981, pp. 61-78.' stratified flow, and slug flow in Sauer, Jr., H.J. Lines of Steam Systems condensate return lines of steam Bosch, JJ. systems.
Boure, J.A. On the Form of the Pressure International Journal of Multiphase Flow, Discussion of the proper forni of the Tenns in the Momentum and Vol. 5 (2), 1979, pp. 159-164. pressure terms in the momentum and Energy Equations of Two Phase energy equations of two phase flow Flow Models models.
Butterworth, D. An Analysis of film Flow and Its International Journal of Multiphase Flow, Analysis of turbulent flow in a liquid Application to Condensation in a Vol. 1 (5), 1974, pp. 671-682. film with motion due to axial shear Horizontal Tube in a horiZontal tube.
92
Caetano, E.F. Upward Vertical Two Phase Flow Journal of Energy Resources Technology, Analysis of upward two phase flows Shoham, O. Through an Annulus -- Part I: Vol. 114 (1), 1992, pp. 1-13. in vertical concentric and eccentric Brill, J.P. Single Phase Friction Factor, annuli. Also the study includes the
Taylor Bubble Rise Velocity, and development of flow pattern maps Flow Pattern Prediction
Caetano, E.F. Upward Vertical Two Phase Flow Journal of Energy Resources Technology, Develops models for two phase flow in Shoham, O. Through an Annulus -- Part IT: Vol. 114 (1), 1992, pp. 14-30. an annulus for bubble flow, slug flow, Brill, J.P. Modeling Bubble, Slug, and and annular flow
Annular Flow
Cardle, J .A. Measurements of Mixed Journal of Hydraulic Engineering, Investigation of the transition between Song, C.C.S. Transients Flows Vol. 115 (2), 1989, pp. 169-182. free-surface flow and pressurized flow
. Yuan, M. in pipes and of the transition between positive and negative surges
Chang, H.C. Nonlinear Waves on Liquid Film Chemical Engineering Science, Vol. 41 (10), An examination of flooding in two Surfaces--I: Flooding in a 1986, pp. 2463-2476. phase annular flow in vertical tubes Vertical Tube including the interfacial stress created
by the gas phase
Chen, S.S. Flow Induced Vibrations in Two Journal of Pressure Vessel Technology, Review of the vibration of circular Phase Flow Vol. 113 (2), 1991, pp. 234-241. cylinders in quiescent fluid, cross-
flow, and axial flow. Also presents a model to describe cylinder oscillations for different flQw conditions
Chrisholm, D. Pressure Gradients Due to Friction . International Journal of Heat and Mass Develops equations for predicting local During the Flow of Evaporating Transfer, Vol. 16 (2), 1973, pp. 347-358. pressure gradients in evaporating flow Two Phase Mixtures in Smooth for two phase mixtures Tubes and Channels
93
Coad, W.J. A Re-Evaluation of Two Phase ASHRAE Transactions, Vol. 87 (1), Discussion of the characteristics of Technology in Thennal Fluid 1981, pp. 943-953. steam systems and their use Systems
Cohen, L.S. Effect of Waves at a Gas Liquid Journal of Fluid M echamcs, Vol. 31 (3), Study of the resistance experienced by Hanratty, T.J. Interface on a Turbulent Air Flow 1968, pp. 467-479. air flowing co-currently over a liquid
surface in a closed channel.
Dulder, A.E. Flooding and Upward Film Flow International Jownal of Multiphase Flow, Experimental study of flooding and Smith, L. in Tubes--I: Experimental Studies Vol. 10 (5), 1984, pp. 585-597. upward ftIm flow, including film Chopra, A. and entrainment flow rates and
pressure drop.
Dulder, E.D. A Model for Gas-Liquid Slug Industrial and Engineering Chemistry Presentation of a model to predict the Hubbard, M.G. Flow in Horizontal and Near Fundamentals, Vol. 14 (4), 1975, hydrodynamic behavior of gas-liquid
Horizontal Tubes pp. 337-347. slug flow.
Fabre, J. Modeling of Two Phase Slug Annual Review of Fluid Mechanics, Theoretical model and analysis of gas-Line, A. Flow Vol. 24, 1992, pp. 21-46. liquid slug flow.
Fan, Z. A Model for Stationary Slugs International Journal of Multiphase Flow, Development of a model for stationary Jepson, W.P. Vol. 18 (4), 1992, pp. 477-494. slugs. Hanratty, T.J.
Fan, Z. Pressure Profiles for Slugs in International Journal of Multiphase Flow, Experimental measurement of the Ruder, Z. Horizontal Pipelines Vol. 19 (3), 1993, pp. 421-437. variation of pressure caused by stable Hanratty, T.J. and unstable slugs in horizontal two
phase flows.
. Fleschner, R.A. Two-Phase Flow in Horizontal ASH RAE Transactions, Vol. 86 (1), Comparison of different methods for Howell, R.H. Condensate Return Lines of Steam 1980, pp. 440-459. calculating pressure drop in two phase Sauer, Jr., H.J. Thennal Systems flows.
94
Forster, K.E. Growth of a Vapor Filled Cavity Physics of Fluids, Vol. 4 (4), 1961, Analysis of the conditions that exist in Near a Heating Surface and Some pp. 448-455. in the local vicinity of a heating element Related Questions in a boiling liquid.
Fowler, A.C. Flooding and Flow Reversal in SIAM Journal of Applied Mathematics, Presentation of a two-fluid model to Lisseter, P.E. Annular Two Phase Flows Vol. 52 (I), 1992, pp. 15-33. predict flooding and flow reversal in
annular flows.
Geraets, 1.J .M. A Capacitance Sensor for Two International Journal of Multiphase Flow, Development of a capacitance sensor Borst, I.C. Phase Void Fraction Measurement Vol. 14 (3), 1988, pp. 305-320. with which to measure time-averaged
and Flow Pattern Identification void fractions in two phase flow.
Gould, T.L. Two Phase Flow Through Journal of Petroleum Technology, Presentation of a computerized method Tek, M.R. Vertical, Inclined, or Curved Vol. 26, August 1974, pp. 915-926. designed to detennine the flow regime Katz, D.L. Pipes and its properties for a given section
of pipe.
Grace, I.R. Dependence of Slug Rise Velocity Chemical Engineering Science, Vol. 34 (11), Development of an equation for the Clift, R. on Tube Reynolds Number in 1979,pp.1348-1350. velocity of gas slugs rising in a vertical
Vertical Gas-Liquid Flow column.
Gregory, G.A. Correlation of the Liquid Volume International Journal of Multiphase Flow, Development of an empirical conelation Nicholson, M.K. Fraction in the Slug for Vol. 4 (1), 1978, pp. 33-39. for gas holdup in liquid slugs for two Aziz, K. Horizontal Gas Liquid Slug phase horizontal slug flow.
Flow
Griffith, P. The Prediction of Low Quality Journal of Heat Transfer, Vol. 86 (2), Experimental measurements of bubble Boiling Voids 1964, pp. 327-333. rise velocity and the use of slug flow
theory to predict fluid density in heated channels.
95
Griffith, P. Multiphase Flow in Pipes Journal of Petroleum Technology, Review of two phase flow and related March 1984, pp. 361-367. issues and problems.
Griffith, P. Two-Phase Slug Flow Journal of Heat Transfer, Vol. 83 (3), Comparison of an expression Wallis, G.B. 1961, pp. 307-320. developed for the mean density and a
method for predicting pressure drop in slug flows with experimental data.
Gudushauri, E.G. Interrelation Between Pressure Thermal Engineering, Vol. 38 (4), Experimental study of the relationship Medvedev, A.E. Oscillations and Flow Rate of 1991, pp. 216-218. between pressure oscillations and liquid Selifanov, I. V. Liquid in the Film for an film flow rates for an oscillating
Hand, N.P. The Effect of Surface Tension on Chemical Engineering Journal, Vol. 48, Experimental study of the effects of Spedding, P.L. Flow Pattern, Holdup and 1992, pp. 197-210. surface tension on flow pattern, Ralph, S.l. Pressure Drop During Horizontal holdup,and pressure drop in cocurrent
Air-Water Pipe Flow at two-phase flows. Atmospheric Conditions
Hashizume, K. Flow Pattern, Void Fraction and International Journal of Multiphase Flow, Presentation of experimental data on Pressure Drop of Refrigerant Vol. 9 (4), 1983, pp. 399-410. flow pattern, void fraction, and Two Phase Flow in a Horizontal pressure drop in two phase flows of Pipe -- I : Experimental Data refrigerants R12 and R22.
Hashizume, K. Flow Pattern, Void Fraction and International Journal of Multiphase Flow, Analysis of annular and stratified two Hiroyasu, O. Pressure Drop of Refrigerant Vol. 11 (5), 1983, pp. 643-658. phase horizontal flows and calculation Taniguchi, H. Two Phase Flow in a Horizontal of the frictional pressure drop.
Pipe -- IT: Analysis of Frictional Pressure Drop
96
Hatfield, F.J. Fluid Structure Interaction in Journal 0/ Fluids Engineering, Vol. 104, Modeling of the interaction of the Wiggert, D.C. Piping by Component Synthesis 1982, pp. 318-325. liquid and piping during a pressure Otwell, R.S. transient by analyzing the liquid and
solid component separately and then comb~g the solutions.
Hewitt, O.F. Prediction of Film Inversion in Journal 0/ Fluid Mechanics, Vol. 236, Analytical study of film inversion and Jayanto, S. Two Phase Flow in Coiled Tubes 1992, pp. 497-511. presentation of a new criterion to
predict its occurrence.
Hooper, A.P. Nonlinear Instability at the Physics 0/ Fluids, Vol. 28 (1), 1985, Examination of the nonlinear instability Grimshaw, R. Interface Between Two Viscous pp.37-45. of cocurrent superposed viscous fluids.
Fluids
Howell, R.H. Evaluation of Sizing Methods for ASHRAE Transactions, Vol. 91 (IA), Review of present techniques used to Steam Condensate Systems 1985, pp. 370-390. size condensate return lines and
development of a procedure for pipe sizing based on the review.
Howell, R.H. Validation of Steam Condensate ASHRAE Transactions, Vol. 87 (1), Experimental examination of two phase Sauer, Jr., H.J. System Flow Theories 1981, pp. 963-982. flow in condensate flow lines and Bell, M.K. development of a model of the Bosch, J.J. condensate carrying capacity of the Fleschner, R.A. return lines.
Imura, H. Flooding Velocity in a Counter- Chemical Engineering Science, Vol. 32 Derivation of a theoretical equation Kusuda, H. Current Annular Two-Phase Flow 1977, pp. 79-87. to describe the velocity of a falling Funatsu, S. liquid film relative to a counter-current
gas at which flooding occurs.
Isbin, H.S. Some Observations on the Status International Journal o/Multiphase Flow, A critique of different models for of Two Phase Critical Flow Models Vol. 6 (1-2), 1980, pp. 131-137 . critical two ·phase flows. .
97
Jelev, I. The Damping of Flow and Journal of Hydraulic Research, Vol. 27 (1), Mathematical analysis of flow and Pressure Oscillations in Water 1989, pp. 91-114. pressure oscillation damping based Hammer Analysis on structural friction forces.
Jepson, W.P. Slug Flow and Its Transitions in International Journal of Multiphase Flow, Compilation of a flow regime map for Taylor, R.E. Large Diameter Horizontal Pipes Vol. 19 (3), 1993, pp. 411-420. two phase horizontal flow in large
diameter pipes and analysis of the effect of pipe diameter.
Jones, A.V. On the Suitability of First Order International Journal of Multi phase Flow, Analysis of the stability features of Properetti, A. Differential Models for Two Phase Vol. 11 (2). 1985, pp. 133-148. one-dimensional first-order flow
Flow Prediction models.
Jones, Jr., O.C. The Interrelation Between Void International Journal of Multi phase Flow, Study of the use of the probability Zuber, N. Fraction Fluctuations and Flow Vol. 2 (3), 1975, pp. 273-306. density function of void fraction
Patterns in Two Phase Flow fluctuations to detennine flow regime.
Karney, B.W. Energy Relations in Transient Journal of Hydraulic Engineering, Development of an alternative Closed-Conduit Flow Vol. 116 (10), 1990, pp. 1180-1196. mathematical representation of transient
conditions based on integrated energy relations.
Klausner, J.F. An Improved Correlation for Two Proceedings, Institution of Mechanical Development of a correlation for Chao, B.T. Phase Frictional Pressure Drop in Engineers, Vol. 205 (C5), 1991, detennining the frictional pressure Soo, S.L. Boiling and Adiabatic Downflow pp. 317-328. drop in annular, two phase, vertical
in the Annular Flow Regime downflow.
Kokal, S.L. An Experimental Study of Two Chemical Engineering Sciences, Vol. 44, Development of models for stratified, Stanslav, J.F. Phase Flow in Slightly Inclined 1989, pp. 681-693. dispersed bubble, and annular flows
Pipes--II. Liquid Holdup and to predict the pressure drop and liquid Pressure Drop holdup in inclined pipes.
98
Kordyban, E.S.
Kvemold, O. Vindoy, V. Sontvedt, T. Saasen, A. Selmer-Olsen, S.
Laurinat, J .E. . Hanratty, T.J. Dallman, J.C.
Lesmez, M.W. Wiggert, D.C. Hatfield, F.J.
Liu, T.J.
Liu, T.J. Bankoff, S.G.
Some Characteristics of High Waves in Closed Channels Approaching Kelvin-Helmholtz Instability
Velocity Distribution in Horizontal Slug Flow
Pressure Drop and Film Height Measurements for Annular Gas-Liquid Flow
Modal Analysis of Vibrations in Liquid Filled Piping Systems
Bubble Size and Entrance Length Effects on Void Development in a Vertical Channel
Structure of Air-Water Bubble Flow in a Vertical Pipe--I. Liquid Mean Velocity and Turbulence Measurements
Journal of Fluid Mechanics, Vol. 99, 1977, pp. 339-346.
International Journal of Multi phase Flow, Vol. 10 (4), 1984, pp. 441-457.
International Journal of Multi phase Flow, Vol. 10 (3), 1984, pp. 341-356.
Journal of Fluids Engineering, Vol. 112, 1990, pp. 311-318.
International Journal of Multiphase Flow, Vol. 19 (1), 1993, pp. 99-113.
International Journal of Heat and Mass Transfer, Vol. 36 (4), 1993, pp. 1049-1060.
99
Analysis of the characteristics of water waves produced at the gasliquid interface to detennine the effects of surface variation.
Development of a device to measure the velocity distribution in a two phase slug. Velocity profIles of the film and the liquid slug are given.
Experimental measurement of the fIlm height and pressure drop for horizontal two phase annular flow.
Comparison of a modal analysis method for predicting piping and liquid motion and the related forces with experimental results.
Experimental study of the effects of bubble size and entrance length have on the void distribution in a vertical
upward cocurrent two phase flow.
Experimental investigation of the liquid phase turbulent structure in a two phase bubbly upflow in a circular pipe.
Liu, T.l. Structme of Air-Water Bubble International Journal of Heat and Mass Experimental measurements of the Bankoff, S.G. Flow in a Vertical Pipe--n. Void Transfer, Vol. 36 (4), 1993, pp. 1061-1072. radial profiles of void fraction, bubble
Fraction, Bubble Velocity and velocity and bubble size. Bubble Size Distribution
Ma, Y.P. Two Simplified Methods to Nuclear Technology, Vol. 94 (1), The development and discussion of two Chung, N.M. Detennine Void Fractions for 1991, pp. 124-133. techniques to detennine void fraction in Pei, B.S. Two Phase Flow two phase flows. Lin, W.K. Hsu, Y.Y.
Mandhane,l.M. A Flow Pattern Map for International Journal of Multiphase Flow, Comparison of flow regime maps for Gregory, G.A. Gas-liquid Flow in Horizontal Vol. 1, 1974, pp. 537-553. two phase flow in horizontal pipes as Aziz, K. Pipes well as the presentation of a new flow
regime correlation.
Manwell, S.P. Gas-liquid Flow Patterns in ASH RAE Transactions, Vol. 96 (2), Experimental study of the refrigerant Bergles, A.E. Refrigerant-Oil Mixtmes 1990, pp. 456-464. flow patterns that occur in smooth and
in micro-fm tubes. Maron,D.M. Flooding and Upward Film Flow International Journal of Multiphase Flow, Discussion of different mechanisms for Dukler, A.B. in Vertical Flow--n: Speculations Vol. 10 (5), 1984, pp. 599-621. flooding and upward fllm flow in
on Film Flow Mechanisms vertical tubes.
Martin, C.S. Vertically Downward Two Phase Journal of Fluids Engineering, Vol. 98 (4), Experimental investigation of vertically Slug Flow 1976, pp. 715-722. downward slug flow of air-water
mixtures in circular pipes.
McAdams, W.H. Vaporization Inside Horizontal ASME Transactions, Vol. 63, 1941, Experimental study of changes in the Woods, W.K. Tubes pp.545-552. coefficient of heat transfer for Bryan, R.L. evaporation of a liquid inside a heated
Condensation Heat Transfer: Comments on Non-Equilibrium Temperature Profiles and the Engineering Calculation of Mass Transfer
Studies of the Behavior of . Disturbance Waves in Annular Two-Phase Flow
Intermittent Two Phase Flow in Horizontal Pipes: Predictive Models
Influence of Tube Inclination on the Flow Regime Boundaries of Condensing Steam
Stratified Two Phase Flow in Circular Pipes
ASME Transactions, Vol. 64, 1942, pp. 193-200.
International Journal of Multiphase Flow, Vol. 6 (1-2), 1980, pp. 41-50.
The Canadian Journal of Chemical Engineering, Vol. 60, August 1982, pp. 459-465.
The Canadian Journal of Chemical Engineering, Vol. 56, December 1978, pp. 653-663.
Canadian Journal of Chemical Engineering, Vol. 71, February 1993, pp. 35-41.
International Journal of Heat and Mass Transfer, Vol. 27 (8), 1984, pp. 1227-1234.
101
Experimental investigation of the heat transfer coefficients and the pressure drops for mixtures of benzene and lubricating oils inside heated horizontal tubes.
Review of a theory on non-equilibrium phase change and of methods by which to calculate mass transfer as they apply to condensation heat transfer.
Experimental investigation of downward annular two phase flow. Development of statistical methods to calculate the flow rates of substrate and large wave flow.
Extension of a previous model for two phase slug flow to include the entire intermittent flow regime.
Presentation of experimental data on flow regime of condensing steam in inclined and declined two phase flows.
Discussion of stratified two phase flow in circular pipes and the development of equations for the pressure drop and the shape of the interphase.
Persen, L.N. On the Stability of Stratified International Journal of Heat and Mass Presentation of the determination of Flow and Its Transition to Transfer, Vol. 36 (7), 1993, pp. 1969-1980. the normal depth of stratified two phase Other Flow Regimes flow and the conditions of its stability.
Rahman, M.M. Flow Pattern Boundaries During Canadian Journal of Chemical Engineering, Experimental study of flow patterns Fathi, A.M. Condensation: New Experimental Vol. 63, August 1985, pp. 547-552. of condensing steam in horizontal Soliman, H.M. Data tubes.
Rice, C.K. The Effect of Void Fraction ASHRAE Transactions, Vol. 93 (1), 1987, Evaluation of the effect on refrigerant Correlation and Heat Flux pp. 341-367. charge inventory predictions of various Assumption on Refrigeration void fraction correlations and heat flux Charge Inventory Predictions assumptions.
Richards, W.V. Some Guides for Safe and ASHRAE Transactions, Vol. 96 (1), 1990, Presentation of a method to obtain good Successful Refrigerant Circulation pp. 1332-1338. heat transfer with acceptable pressure
drop'in multiple tube overfeed evaporators.
Ruskin, R.P. Calculating Line Sizes for Chemical Engineering, Vol. 82, August 1975, Presentation of a ,method for sizing Flashing Steam-Condensate pp. 101-103. flashing steam-condensate lines and
deriving the flow velocities.
Shearer, C.l. Pressure Gradient and Liquid Film Chemical Engineering Science, Vol. 20, 1965, Development of expressions for liquid Nedderman, R.M. Thickness in Cocurrent Upwards pp. 671-683. film thickness and pressure drop in
Flow of Gas Liquid Mixtures: upwards annular cocurrent annular Application to Film Cooler Design flow.
Shekriladze', I. High Rate Condensation Process International Journal of Heat and Mass Analysis of film condensation of Mestvirishvili, S.H. Theory of Vapour Flow Inside a Transfer, Vol. 16 (4), 1973, pp. 715-724. a gas flow in a vertical circular pipe.
Vertical Cylinder
102
Shoham, O. Stratified Turbulent-Turbulent AlChE Journal, Vol. 30 (3), 1984, Development of a two-dimensional Taitel, Y. Gas Liquid Flow on Horizontal pp. 377-385. model for stratified turbulent-turbulent
and Inclined Pipes two phase flow in inclined pipes.
Simpson, A.R. Large Water-Hammer Pressures Journal of Hydraulic Engineering, Investigation of the variation of shape . Wylie, E.B. for Column Separation in Pipelines Vol. 117 (10), 1991, pp.1310-1316. and magnitude of short-duration
pressure pulses for a reservoir-valve system.
Sisson, W. Nomogram Sizes Condensate Power Engineering, December 1975, Presentation of a nomogram for sizing Return Lines pp.68. a condensate return line or for fmding
fluid velocity in existing piping systems.
Spalding, n.B. Multiphase Flow Prediction in International Journal of Multiphose Flow, A discussion of the requirements for Power System Equipment and Vol. 6 (1-2), 1980, pp. 157-168. the prediction of multiphase flows in Components equipment and components.
Spedding, P.L. Flow Regimes in Two Phase International Journal of Multi phose Flow, Comparison of experimental results Spence, n.R. Gas-Liquid Flow Vol. 19 (2), 1993, pp. 245-280. with existing flow regime maps and
flow transition maps for co-current air-water horizontal flow.
Stuhmiller, J .H. The Influence of Interfacial International Journal of Multi phose Flow, Development of equations for two Pressure Forces on the Character of Vol. 3 (6), 1977, pp. 551-560. phase flow based on interfacial Two Phase Flow Model Equations pressure.
Suzuki, S. Behavior of Liquid Films and International Journal ofMultiphose Flow, Experimental study of the flooding Ueda, T. Flooding in counter Current Vol. 3 (6), 1977, pp. 517-532. gas velocity for counter-current
Two Phase Flow--Part I. two phase flow in pipes. Flow in Circular Tubes
103
Taitel, Y. A Film Model for the Prediction International Journal of MultiphDse Flow, Presentation of a model which predicts Bamea,D, of Flooding and Flow Reversal Vol. 8 (1), 1982, pp. 1-10. the gas flow rate which initiates Dulder,A.E for Gas Liquid Flow in Vertical flooding and flow reversal and the
Tubes liquid flow rate at which they end for a vertical two phase flow.
Tandon, T.N. An Experimental Study of Flow ASH RAE Transactions, Vol. 86 (2A), Experimental analysis of two phase Varma, H.K. Patterns During Condensation 1983, pp. 471-482. flow patterns during condensation Gupta, C.P. Inside a Horizontal Tube inside horizontal tubes for R12 and R22.
Tandon, T.N. A Void Fraction Model for . International Journal of Heat and Mass Development of an analytical model for Varma, H.K. Annular Two Phase Flow Transfer, Vol. 28 (1), 1985, pp. 191-198. the prediction of void fraction in two Gupta, C.P. phase annular flow.
Tichy, I.A. An Experimental Investigation of ASH RAE Transactions, Vol. 92 (2A), Comparison of experimental measure-Duque-Rivera, I. Pressure Drop in Forced 1986, pp. 461-472. ments of pressure drop in forced-Macken, N.A. Convection Condensation and convection evaporation and oonden-Duval, W.M.B. Evaporation of Oil-Refrigerant sation of oil-refrigerant mixtwes in
Mixtures horizontal tubes to theoretical relation-ships of frictional pressure d10p and void fraction.
Traviss, D.P. The Influence of Return Bends ASH RAE Transactions, Vol. 79 (1), Investigation of the heat transfer and Rohsenow, W.M. on the Downstream Pressure 1973, pp. 129-137. pressure drop in condensers and the
Drop and condensation Heat effect of return bends on condenser Transfer in Tubes performance.
Troniewski, L. The Analysis of Flow Regime Chemical Engineering Science, Vol. 39 (7/8), Analysis and comparison of two phase Ulbrich, R. Maps of Two Phase Gas Liquid 1984,pp.1213-1224. flow regime maps for horizontal and
Flow in Pipes vertical flows.
104
Tutu, N.K. Pressure Fluctuations and Flow International Journal of Multiphase Flow, Experimental study of wall pressure Pattern Recognition in Vertical Vol. 8 (4), 1982, pp. 443-447. fluctuations and pressure drop Two Phase Gas-Liquid Flows fluctuations for bubbly, slug, churn,
and annular flows to establish objective methods for detennining flow pattern.
Wallis, G.B. Critical Two-Phase Flow International Journal of Multiphase Flow, Review of the present theories on Vol. 6, 1980, pp. 97-112. critical two phase flow and the direction
in which research in this area should head.
Wallis, G.B. Conditions for a Pipe to Run Full Journal of Fluids Engineering, 1977, Experimental study of the conditions Crowley, C.I. When Discharging Liquid into a pp. 405-413. necessary for a vertical or horizontal Hagi, Y. . Space Filled with Gas tube to run full.
Wallis, G.B. The Behavior of Gas-Liquid International Journal of Multiphase Flow, Experimental study on the interface Kuo, I.T. Interfaces in Vertical Tubes Vol. 2 (5-6), 1976, pp. 521-536. behavior when a gas flows past a
stationary liquid in a confined vertical flow.
Whalley, P.B. Air Water Two Phase Flow in a International Journal of Multiphase Flow, Experimental study of two phase flow Helically Coiled Tube Vol. 6 (4), 1980, pp. 345-356. in helically coiled tube, including the
study of transition between stratified and a,nnular flows.
White, E.T. The Velocity of Rise of Single Chemical Engineering Science, Vol. 17, Correlation of experimental measure-Beardmore, R.H. Cylindrical Air Bubbles Through 1962, pp. 351-361. ments on single cylindrical bubbles
Liquids Contained in Vertical rising in a vertical tube. Tubes
Zahn, W.R. A Visual Study of Two-Phase Journal of Heat Transjer, Vol. 86 (3), Experimental study of the flow patterns Flow While Evaporating in 1964, pp. 417-429. of evapor~tiong R-22 in horizontal Horizontal Tubes tubes.
105
Zekind, J.C.
Zukoski, B.B.
Reduced Load Dynamics in Steam Heat Exchangers
Influence of Viscosity, Surface Tension, and Inclination Angle on Motion of Long Bubbles in OosedTubes
ASHRAE Transactions, Vol. 87 (1), 1981, pp. 954-962.
Journal of Fluid Mechanics, Vol. 25 (4), 1966, pp. 821-837.
106
Presentation of results of research in the dynamics of steam condensate systems and the interrelationship between load control and the condensate return system.
Experimental study on the effects of viscosity and surface tension on motion of long bubbles in closed tubes. Also, development of correlation of bubble velocities in vertical flows.
Flow Regime Transition and Slug Initiation
Author Iilk Source Comments
Ahmed,R. Finite Amplitude Waves in Stratified AlChE Journal, Vol. 31 (9), 1985, Study of the effects of the nonlinear Banerjee, S. Two-Phase Flow: Transition to pp. 1480-1487. instability of finite amplitude
Slug Flow interfactial waves on transition to slug flow in horizontal two phase flow
Andreussi, P. Initiation of Roll Waves in AlChE Journal, Vol. 31 (1), 1985, Investigation of the effect of liquid Asali, J.C. Gas-Liquid Flows pp. 119-126. . viscosity on the initiation of roll waves Hanratty, T J. in horizontal flow
Andritsos, N. Transition to Slug Flow in Chemical Engineering Communications, Study of the effects that physical Bontozoglou, V. Horizontal Pipes Vol. 118, 1992, pp. 361-385. properties and pipe diameter have on Hanratty, T.J. the transition to slug flow in horizontal
pipes
Andritsos, N. Effect of Liquid Viscosity on the International Journal of Multiphase Flow, Study of the effect that viscosity has Williams, L. Stratified-Slug Transition in Vol. 15 (6), 1989, pp. 877-892. on the initiation of slug flow in Hanratty, T.J. Horizontal Pipe Flow horizontal pipes
Bankoff, S.G. Some Condensation Studies International Journal of Multiphase Flow, Discussion of steady-state turbulent Pertinent to L WR Safety Vol. 6 (1-2), 1980, pp. 51-67. stratified flows and review bubble
studies applied to reactor safety
Barnea, D. On the Effect of Viscosity on Chemical Engineering Science, Vol. 46 (8), An analysis of the stability of stratified Stability of Stratified Gas-Liquid 1991, pp. 2123-2131. flows at varying inclinations. Also Flow -- Application to Flow Pattern develops a model to predict the Transition at Various Pipe Inclinations transition to slug and annular flows
107
Barnea, D. Flow Pattern in Horizontal and Canadian Journal o/Chemical Engineering, Experimental study of two phase Luninski, Y. Vertical Two-Phase Flow in Vol. 61, October 1983, pp. 617-620. flow transition in small diameter pipes Taitel, Y. Small Diameter Pipes for vertical and horizontal flows
Barnea, D. Flow Pattern Transition for Chemical Engineering Science, Vol. 37 (5), Developed model for transition in Shoham, O. Downward Inclined Two Phase 1982, pp. 735-740. downward flowing two phase Taitel, Y. Flow: Horizontal to Vertical inclined pipe flow. Model compared
with experimental results.
Barnea, D. Flow Pattern Transition for Chemical Engineering Science, Vol. 37 (5), Presentation of results of experiments Shoham, O. Vertical Downward Two Phase 1982, pp. 741-744. on flow patterns of vertical downward Taitel, Y. Flow gas-liquid flows. Also presents
transition criteria for flow patterns.
Barnea, D. Flow Pattern Transition for Internmional Journal 0/ Multiphase Flow, Comparison of experimental measure-Shoham, O. Gas-Liquid Flow in Horizontal Vol. 6, , 1980, pp. 217-225. ments of flow patterns for two phase Taitel, Y. and Inclined Pipes flows with theories of flow pattern Dukler, A.E. prediction.
Barnea, D. Transitional Formulation Modes Chemical Engineering Science, Vol. 44 (2), Develops criterio~ for stability in . Taitel, Y. and Stability of Steady State pp. 325-332. cocurrent and countercurrent two phase
Annular Flow annular flows.
Bendikson, K.H. Onset of Slugging in Horizontal International Journal 0/ Multiphase Flow, Quantitative examination of the relation Espedal, M. Gas-Liquid Pipe Flow Vol. 18 (2), 1992, pp. 237-247. between wave appearance, slug
formation, and transition to stable slug flow in horizontal pipes.
Hall-Taylor; N. The Motion and Frequency of Chemical Engineering Science, Vol. 18, Examination of the initiating conditions, Hewitt, G.F. Large Disturbance Waves in 1963, pp. 537-552. velocity, separation, and frequency of Lacey, P.M.C. Annular Two Phase flow of Air large disturbance waves in annular two
Water Mixtures phase flows.
108
Ishii, M. Wave Phenomena and Two Handbook of Multiphase Systems, Discussion of wave formation and Phase Flow Instabilities Ed. G. Hetsroni, 1982, pp. 2.95-2.122 flow instabilities for two phase flows.
Jayanti, S. Observation of Flooding in the International Journal of Multiphase Flow, Experimental study of flooding in the Hewitt, G.F. Taylor Bubble of Co-Current Vol. 19 (3), 1993, pp. 531-534. Taylor bubble of cocurrent upwards Low,D.E.F. Upwards Slug Flow slug flow and its relation to transition . Hervieu, E. to churn flow.
Kordyban, E.S. The Transition of Slug Flow in International Journal of Multiphase Flow, Experimental study of wave instability the Presence of Large Waves Vol. 3, 1977, pp. 603-607. as a cause of slug formation and
comparison of experimental transition data to previous theoretical models.
Kordyban, E.S. Some Details of Developing Slugs A1ChE Journal, Vol. 31 (5), 1985, Photographic study of slug development in Horizontal Two Phase Flow pp. 802-806 .. in horizontal two phase flows to explore
the physical reasons for slug initiation.
Kordyban, E.S. Horizontal Slug Flow: A Journal of Fluids Engineering, Vol. 112, A review of the accuracy of various Comparison of Existing Theories 1990, pp. 74-83. theories concerning the transition to
slug flow in horizontal two phase flow.
Kordyban, E.S. The Effect of Surfactants on Wave ASME, HID-Vol. 260 I FED-Vol. 169, Study of the effect of surfactants on the Okleh, A.H. Growth in the Transition to Slug 1993, pp. 73-84. transition to slug flow.
Flow
Kordyban, E.S. Growth of Interfacial Waves and Cavitation and Multiphase Flow Forum, Study of the effects of viscosity and Okleh, A.H. the Transition to Slug Flow: FED-Vol. 135, 1992, pp. 17-21. surface tension on wave growth and
Effect of Fluid Properties thus on slug initiation.
Kordyban, E.S. Mechanism of Slug Formation in Journal of Basic Engineering, Vol. 92 (4), Theory that transition to slug flow is Ranov, T. Horizontal Two Phase Flow 1970, pp. 857-864. due to Kelvin-Helmholtz instability.
109
Minato, A. Mechanistic Model of Slugging Journal of Nuclear Science and Technology, Development of a model of the Ikeda, T. Onset in Horizontal Circular Tubes Vol. 23 (9), September 1986, pp. 761-768. mechanism of transition from stratified Masanori, N. to slug flow in horizontal two phase
flows.
Mishima, K. Theoretical Prediction of Onset Journal of Fluid Engineering, Vo1.l02, Theoretical derivation of a criterion for Ishii, M. of Horizontal Slug Flow 1980, pp. 441-445. the initiation of slug flow in horizontal
two phase flow.
Moissis, R. The Transition from Slug to Journal of Heat Transfer, Vol. 85 (4), Analysis of the transition from non-Homogeneous Two Phase Flows 1963, pp. 366-370. homogeneous slug flow to homo-
geneous frothy flow in two phase vertical flows in pipes.
Moissis, R. Entrance Effects in a Two Phase Journal of Heat Transfer, Vol. 84 (1), Quantitative description of the Griffith, P. Slug Flow 1962, pp. 29-38. developing slug flow regime.
Ruder, Z. Necessary Conditions for the International Journal of Multiphase Flow, Experimental investigation of the Hanratty, P.J. Existence of Stable Slugs Vol. 15 (2), 1989, pp. 209-226. minimum fIlm heights and gas velocities Hanratty, T.J. required to initiate a slug in two phase
flows.
Ruder, Z. A Definition of Gas-Liquid Plug International Journal of Multiphase Flow, Experimental study of the transition Hanratty, T.J. Flow in Horizontal Pipes Vol. 16 (2), 1990, pp. 233-242. from slug flow to plug flow for
horizontal two phase flows
Spedding, P.L. Flow Regimes in Two Phase International Journal of Multiphase Flow, Comparison of experimental results Spence, D.R. Gas-Liquid Flow Vol. 19 (2), 1993, pp. 245-280. with existing flow regime maps and
flow transition maps for co-current air-water horizontal flow.
110
Taitel, Y. Flow Pattern Transition in Rough International Journal of Multiphase Flow, Extension of a previous model for the Pipes Vol. 3, 1977, pp. 597-601. prediction of flow transition in
horizontal pipes to include rough pipes.
Taitel, Y. Modeling Flow Pattern AIChE Journal, Vol. 26 (3), 1980, Development of models for predicting Bamea,D. Transitions for Steady Upward pp. 345-354. flow transition in steady two phase Dulder,A.E Gas-liquid Flow in Vertical Tubes vertical flows.
Taitel, Y. A Model for Predicting Flow AIChE Journal, Vol.22 (1), 1976, Presentation of models and a flow Dulder, A.E. Regime Transitions in Horizontal pp. 47-55. regime map for flow transition in
and Near Horizontal Gas-Liquid horizontal and near horizontal two Flow phase flows .
. Taitel, Y. A Model for Slug Frequency International Journal of Multiphase Flow, Modeling of the frequency of the local Dulder, A.E. During Gas-liquid Flow in Vol. 3. 1977,.pp. 585-596. liqui4 film motions during slug
Horizontal and Near Horizontal formation. Pipes
Wallis, G.B. The Onset of Slugging in International Journal of Multiphase Flow, Presentation of a criterion for the Dobson, J .E. Horizontal Stratified Air-Water Vol. 1, 1973, pp. 173-193. transition from stratified to slug ~
Flow plug flow in horizontal rectangular ducts.
111
Condensation and Bubble Collapse
Author Iillc Source Comments
Akagawa, K. Studies on the Fluctuation of Bulletin of the Japan Society of Mechanical Study of the pressure recovery behind Hamaguchi, H. Pressure Drop in Two Phase Engineers, Vol. 14 (71), 1971, pp.462-469 a bubble rising in still water in a tube Sakaguchi, T. Slug Flow (3rd Report)
Bankoff, S.O. Some Condensation Studies International Journal of Multiphase Flow, Discussion of steady-state turbulent Pertinent to L WR Safety Vol. 6 (1-2), 1980, pp. 51-67. stratified flows and of bubble studies
as applied to reactor safety.
Bendikson, K.H. An Experimental Investigation of International Journal of Multi phase Flow, Study of the relative motion of single the Motion of Long Bubbles in Vol. 10, (4), 1984, pp. 467-483. long air bubbles in fluid flows in Inclined Tubes inclined tubes.
Bendikson, K.H On the Motion of Long Bubbles International Journal of Multi phase Flow, Examination of the effects of surface in Vertical Tubes Vol. 11 (6), 1985, pp. 797-812. tension and external forces on infinitely
long bubbles in vertical pipes.
Biasi, L. Collapse of a Condensing Bubble Chemical Engineering Science, Vol. 27 Analysis of bubble condensation Prosperetti, A. in Compressible Liquids 1972, pp. 815-822. in compressible fluids. Tozzi, A.
Biesheuvel, A. Two Phase Flow Equations for a Journal of Fluid Mechanics, Vol. 148, Development of fIrst order equations van Wijngaarden, L. Dilute Dispersion of Oas 1984, pp. 301-318 of motion for the dispersion of bubbles
. Bubbles in Liquid in liquids.
112
Block, J.A. Condensation Driven Fluid International Journal of Multiphase Flow, Study of the interrelationship between Motions Vol. 6 (1-2), 1980, pp. 113-129. condensation processes and fluid
motions with references to specific industrial application ..
Board, S.J. Spherical Vapour Bubble Collapse Chemical Engineering Science, Vol. 29, Experimental study of spherical bubble Kimpton, A.D. 1974, pp. 363-371. collapse in a subcooled fluid. Develop-
ment of an incompressible equilibrium model of bubble collapse based on fmite difference techniques.
Bornhorst, W.J. Analysis of a Liquid Vapor Journal of Applied Mechanics, Vol. 34 (4), Theoretical development of equations Hatsopoulos, G.N. Phase Change by the Methods of 1967, pp. 840-846. based on irreversible thermodynamics
Irreversible Thermodynamics that predict fluid behavior during phase change.
Bornhorst, W.J. Bubble Growth Calculation Journal of Applied Mechanics, Vol. 34 (4), A theoretical investigation of the Hatsopoulos, G.N. Without Neglect of Interfacial 1967, pp. 847-853. importance of the nonequilibrium
Discontinuities region at the bubble wall on the growth of a vapor bubble.
Chou, Y. Admitting Cold Water into Steam Transient Thermal-Hydraulics in Vessel Development of stability maps for Griffith, P. Filled Pipes Without Water Hammer and Piping Systems, PVP Vol. 190, ASME, various geometries for the addition
Due to Steam Bubble Collapse NY, 1989, pp. 63-71. of subcooled water to steam filled pipes.
Florschuetz, L.W. On the Mechanics of Vapor Journal of Heat Transfer, Vol. 87 (2), Study of the importance of the effects Chao, B.T. Bubble Collapse 1965, pp. 209-220. of liquid inertia and heat transfer during
the collapse of a bubble.
113
Guevara, E. Entrainment in Condensing International Journal of Multi phase Flow, Comparison of experimental Gotham, D.H.T. Annular Flow Vol. 9 (4), 1983, pp. 411-419. measurements of liquid film flow rates
in condensing, horizontal, annular flow with correlations for entrainment based on previous studies.
Hawtin, P. On the Collapse of Water Vapour Chemical Engineering Science, Vol. 25, Development of a mathematical Henwood, G.A. Cavities in a Bubble Analogue 1970, pp. 1197-1209. model to predict the rate of collapse Huber, R.A. Apparatus of a vapor cavity in a bubble
analogous apparatus.
Hickling, R. Collapse and Rebound of a The Physics of Fluids, Vol. 7 (1), 1964, Theoretical study of bubble collapse Plesset, M.S. Spherical Bubble in Water pp. 7-14. in a compressible fluid.
Hunter, C. On the Collapse of an Empty Cavity Journal of Fluid Mechanics, Vol. 8, 1960, Theoretical study of the collapse of a in Water pp. 241-263. vapor bubble, modeled as a spherical
void, in a compressible fluid.
Leung, J.C. Size Safety Relief Valves for Chemical Engineering Progress, Vol. 88 (2), Discussion of the homogeneous Flashing Liquids 1992, pp. 70-75. equilibrium model as a sizing method
for flashing liquids
Linehan, J.H. On the Interface Shear Stress in Journal of Heat Transfer, Vol. 91 (3), Discussion of models used to evaluate Petrick, M. Annular Flow Condensation 1969, pp. 450-452. the interfacial shear stress in annular EI-Wakil, M.M. flim condensation.
Loyko, L.L. Hydraulic Shock in Ammonia Presented at llAR 11th Annual Meeting, Discussion of hydraulic shock and Systems March 12-15 1989. the conditions that cause hydraulic
shock in ammonia systems
114
Loyko, L.L.
Moalem,D. . Sideman, S.
Rayleigh
Trilling, L.
Wittke, D.O. Chao, B.T.
Condensation Induced Hydraulic Shock
The Effect of Motion on Bubble Collapse
On the Pressure Developed in a Liquid During the Collapse of a Spherical Cavity
The Collapse and Rebound of a Gas Bubble
Collapse of Vapour Bubbles with Translatory Motion
Presented at llAR 14th Annual Meeting, March 22-25 1992.
International Jownal of Heat and Mass Transfer, Vol. 16 (12), 1973, pp. 2321-2329
Philosophical Magazine, Vol. 34 (200), August 1917, pp. 94-98
Journal of Applied Physics, Vol. 23 (1), January 1952; pp. 14-17.
Journal of Heat Transfer, Vol. 89 (1), 1967, pp. 17-24.
115
A discussion of condensation-induced shock and how to vary system designs to help prevent its occurrence
Study of the effects of translational bubble velocity on the rate of bubble collapse.
Theoretical study of the time of collapse of a spherical void in an incompressible fluid.
Theoretical study of the collapse and rebound of a vapor bubble in a compressible fluid.
Study of the collapse of vapor bu'bles where heat transfer is the controlling factor. Includes effects of translak>ry motion and noncondensable gas
Water Hammer: Causes, Impact, and Prevention
Author I.i1k Source Comments
Akselrod, A.F. Condensation Induced Fluid Transients and Fluid-Structure A study of the effects of pipe inclination Esselman, T.C. Water hammer in Steam Interaction, PVP-Vol. 224/ FED-Vol. 126, on condensation induced water hammer. Griffith, P.G. Distribution Systems ASME, NY, 1991, pp. 29-31. Min, E.B.
Anand, N.K. Effects of Outdoor Coil Fan ASH RAE Transactions, Vol. 95 (2), 1989, Experimental investigation of the Schliesing, J.S. Pre-Start on Pressure Transients pp. 699-704. effects on refrigerant pressure O'Neal, D.L. During the Reverse Cycle Defrost transients when the outdoor coil fan Peterson, K.T. of a Heat Pump is started prior to the termination of
defrost
ANSIIASHRAE Safety Code for Mechanical ANSII ASHRAE 15 - 1992 Sets design and operation standards Refrigeration for mechanical refrigeration systems
to promote system safety
ANSI/IIAR Equipment, Design, and Installation ANSI/IIAR, 1978. Determines the standards for the of Ammonia Mechanical design and operation of Refrigeration Systems ammonia refrigeration systems.
Belytschko, T. Fluid Structure Interaction in Journal of Pressure Vessel Technology, Analysis of fluid-structure interaction Karabin, M. Water Hammer Response of Vol. 108, 1986, pp. 249-255. for water hammer type flow conditions Lin, J.I. Flexible Piping assuming incompressible flow.
Bergant, A. Quadratic Equation Inaccuracy Journal of Hydraulic Engineering, A comparison of two quadratic solution Simpson, A. for Water Hammer Vol. 117 (11), 1991, pp. 1572-1574. techniques used to solve the boundary
conditions of a piping system ..
116
Bjorge, R.W. Initiation of Water hammer in Journal of Heat Transfer, Vol. 106, Presentation of experimental results Griffith; P. Horizontal and Nearly Horizontal 1984, pp. 835-840. concerning water hammer in horizontal
Pipes Containing Steam and pipes. Development of an analytical Subcooled Water model for the prediction of water
hammer initiation.
Bozkus, Z. Slug Motion and Impact in a Fluid Transients and Fluid-Structure Study of the motion and impact of slugs Wiggert, D.C. Voided Line Interaction, PVP-Vol. 224/ FED-Vol. 126, through a voided line. Measurement of
ASME, NY, 1991, pp. 25-27. pressure forces exerted during slug impact at an elbow joint.
Budny, D.O. An Experimental Study on the Journal of Fluid Mechanics, Vol. 112, An experimental study of the effect that Hatfield, FJ. Influence of StructmaI Damping 1990, pp. 284-290. structural damping has on fluid pressure .Wiggert, D.C. on Internal Fluid Pressure transients.
During a Transient Flow
Cabrera, E. Influence of Liquid Length Journal of Hydraulic Engineering, Study of the effect liquid column length Abreu, J. Variation in Hydraulic Transients Vol. 118 (12), 1992, pp. 1639-1650. has on peak pressure of a system with Perez, R. entrapped air Vela, A.
Chaudhry, M.H Second-Order Accurate Explicit Journal of Fluids Engineering, Vol. 107, Comparison of three second-order Hussaini, M.Y. Finite-Difference Schemes for 1985, pp. 523-529. accurate explicit finite-difference
Waterhammer Analysis schemes used to solve the partial differential equations describing water hammer
Chiu, C. Water Hammer in a PWR Transactions of ANS, Vol. 52, Reno, Discussion of a water hammer incident Tuttle, D. Horizontal Feedwater Line Nevada, June 15-19 1986, pp. 589-590. in a main feedwater line and an analysis Serkiz, A.W. of the conditions needed to initiate water
hammer in horizontal feedwater lines
117
Clarke, D. Water Hammer: 1 The Chemical Engineer, No. 452, Presents procedure on analyzing a September 1988, pp. 34-35. system for potential water hammer and
suggests some design changes to help prevent water hammer
Clarke, D. Water Hammer: 2 The Chemical Engineer, No. 457, Discussion on the use of surge February 1989, pp. 14-15. suppression to avoid water hammer
Fleming, A.J. Cost-Effective Solution to a Water Public Works, Vol. 121, July 1990, Discussion of water hammer that occurs Hammer Problem pp.42-44. . when a large pump in a force main is
suddenly stopped.
Gillessen, R. Water Hammer Production and International JoW1Ull of Pressure Vessel and Discussion of methods by which to Lange, H. Design Measures in Piping Piping Systems, 1988, pp. 219-234. alter fluid dynamic conditions or
Systems piping systems designs so as to reduce the effects of water hammer.
Gray, C.A.M. Analysis of Water Hammer by Proceedings, ASCE, Vol. 79, 1953, Analysis of the effects of kinetic energy, Characteristics Paper 274. friction, and change in wave form on the
solution to the equations that describe water hammer.
Hatfield, F.J. Water Hammer Response of Journal of Pressure Vessel Technology, Presentation of an alternative method Wiggert, D.C. Flexible Piping by Component Vol. 113, 1991, pp. 115-119. of calculating dynamic pressures and
Synthesis pipe displacements for water hammer conditions.
Huber, W.T. Design Considerations for ASHRAE Transactions, Vol. 89 (2B), Discussion on the use of certain seals as Barton, R.N. Mechanical Joints in Preinsulated 1983, pp. 858-865. joints in preinsulated underground
Underground Piping Systems piping systems as well as some of the design considerations involved.
118
International Bulletin No. 116: Guidelines for llAR, October 31, 1992 (Draft) Presentation of guidelines for ammonia Institute of Avoiding Component Failure in refrigeration system design and Ammonia Industrial Refrigeration Systems operation in order to decrease the Refrigeration Caused by Abnormal Pressure occurrence of pressure transients. (lIAR) Shock
Kim, J.H. Water-Hammer Prevention, EPRI, 1987, pp. 733-734. Report on the frequency and cost of Mitigation, and Accommodation: the occurrence of water hammer in A Perspective industry.
Kim, J.H. Two-Phase Water Hammer in Cavitation and Multiphase Flow Forum -- . Discussion of the effects of water Nuclear Power Plants 1987, O. Furuya, Ed., Cincinnati, OH, hammer on industry and the research
AS ME, June 1987, pp. 117-120. needs in this area for the future.
Kroon, J.R. Water Hammer: Causes and Effects American Water Works Association Journal, Review of the principles and causes Stoner, M.A. Vol. 76, November 1984, pp. 39-45. of water hammer. Hunt, W.A.
Loyko, L.L. Hydraulic Shock in Ammonia Presented at lIAR 11th Annual Meeting, Discussion of hydraulic shock and Systems March 12-15 1989. the conditions that cause hydraulic
shock in ammonia systems
Loyko, L.L. Condensation Induced Hydraulic Presented at lIAR 14th Annual Meeting, A discussion of condensation-induced Shock March 22-25 1992. shock and how to vary system designs
to help prevent its occurrence
Martin, C.S. Status of Fluid Transients in Journal o/Fluids Engineering, Vol. 95 (2), A critique of the research efforts in Western Europe and the United 1973, pp. 301-318. Western Europe and the United Kingdom. Report on Laboratory Kingdom in the area of fluid transients. Visits by Freeman Scholar
119
Moody, F.J. A Survey of Fluid Transient Journal of Pressure Vessel Technology, Discussion of various topics concerning Studies -- 1991 Vol. 113, 1991, pp. 228-233. fluid transients
Mosshart, Jr., DJ. A Contractor's View of HVAC ASHRAE Transactions, Vol. 86 (1), Discussion of noise and vibration Noise and Vibration Problems 1980, pp. 559-564. problems that occur in HV AC systems
and some fundamental guidelines that can prevent such problems.
Neckowicz, T.S. A Note on One Aspect of the ASH RAE Transactions, Vol. 96 (2), Discussion of the relation of flooding of Murphy, W.E. Transient Response of Package 1984, pp. 179-184. the liquid line at start-up to the transient Goldschmidt, V.W. Air Conditioners: Flooding of the response in the evaporator of an air Johnston, R.C.R. Liquid Line conditioner.
Sibetheros, I.A. Spline Interpolations for Water Journal of Hydraulic Engineering, Investigation of the application of the Holley, E.R. Hammer Analysis . Vol. 117 (10), 1991, pp. 1332-1351. method of characteristics with spline Branski, J .M. polynomials for interpolations for
numerical water hammer analysis of horizontal pipes.
Singh, R. Modeling of Fluid Transients in Shock and Vibration Digest, Literature review of the mathematical Machines--Part I: Basic Vol. 12 (6), 1980, pp. 7-14. modeling of fluid transients in Considerations machines.
Singh, R. Modeling of Fluid Transients in Shock and Vibration Digest, Literature review of the applications Machines--Part IT: Advanced Vol. 12 (7), 1980, pp. 11-17. and advanced considerations of Considerations mathematical models of fluid transients
in machinery.
Singh, R. An Investigation of the ASH RAE Transactions, Vol. 92 (1B), Study of the overpressures caused by Nieter, J.J. Compressor Slugging 1986, pp. 250-258. liquid slugging that occur in . Prater, Jr., G. Phenomenon refrigeration compressors
120
Streeter, V.L. Wylie, E.B.
Suo, L. Wylie, E.B.
Swierzawski, T.l. Griffith, P.
Walker, 1.S. Phillips, 1.W.
Wang, T. Shah, V.I. Nieh, L.C.S.
Wedekind, G.L. Bhatt, B.L. Beck, B.T.
Weisman, 1. Duncan, D. Gibson, 1. Crawford, T.
Waterhammer and Surge Control
Impulse Response for Frequency-Dependent Pipeline Transients
Preventing Water Hammer in Large Horizontal Pipes Passing Steam and Water
Pulse Propagation in Fluid Filled . Tubes
Waterhammer in a Stream Line Partially Filled with Trapped Condensate
A System Mean Void Fraction Model for Predicting Various Transient Phenomena Associated with Two Phase Evaporating and Condensing Flows
Effects of Fluid Properties and Pipe Diameter on Two-Phase Flow Patterns in Horizontal Lines
Annual Review of Fluid Mechanics, Vol. 6, 1974, pp. 57-73.
Journal of Fluid Engineering, Vol. 111, 1989, pp. 478-483.
Journal of Heat Transfer, Vol. 112, 1990, pp. 523-524.
Journal of Applied Mechanics, Vol. 44 (1), 1977, pp. 31-35.
Transient Thermal-Hydraulics in Vessel and Piping Systems, PVP-Vol. 156, ASME, NY, 1989, pp. 23-27.
International Journal of Multiphase Flow, Vol. 4 (1), 1978, pp. 97-114.
International Journal of Multiphase Flow, Vol. 5, 1979, pp. 437-462.
121
Analysis of various numerical methods for computing system transients.
Presentation of a numerical method for computing transients in piping systems. Frequency-dependent parameters are included.
Technical note on preventing water hammer in horizontal pipes having countercurrent flows of steam and subcooled water.
Presentation of a theory on the propagation of pressure pulses in an inviscid compressible pipe flow.
Investigation of a water hammer incident in a nuclear power plant and an analysis of the interface between steam and a liquid phase
Presentation of a system mean void fraction model for analyzing transients when complete vaporization or condensation occur in a two phase flow.
Presentation of experimental data on transitions in cocurrent, horizontal, two phase flows.
Wiggert, D.C. Otwell, R.S. Hatfield, F.J.
Wood, D.J.
Yeung, W.S Wu, J. Fernandez, R. T. Sundaram R.K.
The Effect of elbow Restraint on Pressure Transients
A Study of the Response of Coupled Liquid Flow Structural Systems Subjected to Periodic Disturbances
RELAPS/MOD3 Simulation of the Water Cannon Phenomenon
Journal of Fluids Engineering, Vol. 107, 1985, pp. 402-406.
Journal of Basic Engineering, Vol. 90 (4), 1968, pp. 532-540.
Nuclear Technology, Vol. 101 (2), 1993, pp. 224-251.
122
Analysis of the effect that the type of elbow restraint has on the propagation of pressure transients.
An analysis of the coupled responses of liquid flow systems and structural supports to pressure and flow pertubations.
Investigation of the ability of the RELAP5/MOD3 computer code to analyze the transient behavior of water cannon phenomenon.