Page 1
Accepted Manuscript
A Fuzzy Sequential Model for Realization of Strategic Planning in Manufac-
turing Firms
Merve Cengiz toklu, Mehmet Bilgehan Erdem, Harun Taşkin
PII: S0360-8352(16)00004-8
DOI: http://dx.doi.org/10.1016/j.cie.2016.01.002
Reference: CAIE 4225
To appear in: Computers & Industrial Engineering
Received Date: 18 September 2015
Revised Date: 20 December 2015
Accepted Date: 4 January 2016
Please cite this article as: Cengiz toklu, M., Erdem, M.B., Taşkin, H., A Fuzzy Sequential Model for Realization of
Strategic Planning in Manufacturing Firms, Computers & Industrial Engineering (2016), doi: http://dx.doi.org/
10.1016/j.cie.2016.01.002
This is a PDF file of an unedited manuscript that has been accepted for publication. As a service to our customers
we are providing this early version of the manuscript. The manuscript will undergo copyediting, typesetting, and
review of the resulting proof before it is published in its final form. Please note that during the production process
errors may be discovered which could affect the content, and all legal disclaimers that apply to the journal pertain.
Page 2
A Fuzzy Sequential Model for Realization of Strategic Planning in Manufacturing Firms
Merve CENGIZ TOKLU
a, Mehmet Bilgehan ERDEM
a*and Harun TAŞKIN
a,
a Department of Industrial Engineering, Sakarya University, Sakarya, Turkey
1) Corresponding Author’s Name: Merve CENGİZ TOKLU
Sakarya University, Department of Industrial Engineering Esentepe Campus, M5 Block,
Serdivan / Sakarya, Turkey
Email: [email protected]
Tel:+9002642957416
2) Mehmet Bilgehan ERDEM(Co-author)
Sakarya University, Department of Industrial Engineering Esentepe Campus, M5 Block,
Serdivan / Sakarya, Turkey
Email: [email protected]
3) Harun TAŞKIN (Co-author)
Sakarya University, Department of Industrial Engineering Esentepe Campus, M5 Block,
Serdivan / Sakarya, Turkey
Email: [email protected]
Page 3
A Fuzzy Sequential Model for Realization of Strategic Planning in Manufacturing Firms
Abstract
Strategic planning is a vital management tool for projecting the long-range business goals and
is not only for big businesses, but also applicable to small businesses in spite of their limited
resources. To do this effectively, organizations should determine their strengths and
weaknesses. Organizations have to produce appropriate action plans to overcome these
weaknesses and it is very important to prioritize the action plans according to limited
resources. In the current practice, a sequential model for overcoming this prioritization
problem has not been studied in the related literature. Therefore we proposed a fuzzy
sequential model (FSM) to help organizations in strategic planning process. This model
includes four steps which are; determining open to improvement areas (OIAs), determining
the root cause, developing action plans for each root cause and determining priority of OIAs
hence action plans respectively. The proposed model was applied in a local manufacturing
small medium enterprise (SME) as a real world case study. Results of the case study show
that relatively more prioritized OIAs for the SME are, “mid-level managers take inadequate
initiatives”, “failure to comply with the design calendar in Research & Development (R&D)
and Product Development (P&D) processes”, “small lot sizes”, respectively.
Keywords: Strategic planning, multi criteria decision-making, SWOT analysis, Bolden’s
taxonomy, fuzzy ANP, manufacturing SMEs
1. Introduction
Strategic planning is a management tool that enables employees to canalize the organization's
targets. Strategic planning approach helps to identify long-term goals, current status and
future plans of the organization via identifying root causes of problems in all levels of the
entire organization. Organizations define visions after determining strategies and goals that
help achieve objectives which are related to the vision with strategic planning. Also
organizational performance are monitored with measurable criteria. The first step of strategic
planning is the situation analysis. This analysis is aimed at identifying the current situation.
Organizations can clearly see open to improvement areas (OIAs) by analyzing internal and
external environment through SWOT (strengths, weaknesses, opportunities and threats)
analysis.
Heuristic techniques are applied in strategic planning process in the related literature.
Moynihan, Raj, Sterling, & Nichols (1995), described the design of a microcomputer-based
decision support system that utilizes heuristic simulation techniques to planning at a strategic
level. Also, Li, Ang, & Gay (1997), proposed a neural networks application, which consists of
scenario generation for strategic business planning. There are studies of multi-criteria decision
making (MCDM) methods with specific strategic decisions such as supplier evaluation and
selection (Dulmin & Mininno, 2003; Chen, Lin, & Huang, 2006; Razmi, Rafiei, & Hashemi,
2009; Zeydan, Çolpan, & Çobanoğlu, 2011; Büyüközkan & Çifçi, 2012; Arabzad, Ghorbani,
Razmi, & Shirouyehzad, 2015; Ayhan & Kılıç, 2015), however the number of studies on
strategic planning are limited. Chiou, Tzeng, & Cheng (2005) proposed a fuzzy hierarchical
analytic process to derive the weight of considered criteria and rank the importance of the
criteria for sustainable development strategies. Dodangeh, Yusuff, & Jassbi (2010) proposed a
model for selection and ranking of strategic plans in balanced scorecard using TOPSIS
method and goal programming model. Perçin (2010) used ANP for selecting appropriate
knowledge management strategies. Wu, Lin, & Lee (2010) proposed the marketing strategy
decision making model by using ANP and TOPSIS method. Azimi, Yazdani-chamzini,
Fooladgar, & Basiri (2011) proposed an integrated model for prioritizing the strategies of
Page 4
Iranian mining sector. They applied ANP in order to obtain the weight of SWOT factors and
ranked the strategies by using VIKOR technique. Zavadskas, Turskis, & Tamosaitiene (2011)
developed a methodology for determining management strategies in construction enterprises
management by applying SWOT and MCDM methods, analytic hierarchy process (AHP) and
permutation. Baby (2013) proposed a model to optimize the strategies built by SWOT -
QSPM (Quantitative Strategic Planning Matrix). The optimizing and rationalizing of the
strategies were performed with the concept of AHP /ANP utilizing MCDM software.
Ocampo, Clark, & Tanudtanud (2015) presented a decision framework that integration of
manufacturing strategy by using probabilistic F-ANP method.
In this study we proposed a sequential model which consists of SWOT analysis, Root Cause
Analysis (RCA), modified Bolden’s taxonomy and fuzzy ANP methodologies. We used
SWOT analysis to determine the strengths and weaknesses of the company. We used RCA to
define main and sub-causes of the weaknesses. We improved Bolden’s taxonomy by adding a
new aspect (a fifth row) that helps to evaluate problems from social point of view. We used
the modified Bolden’s taxonomy to match OIAs, which was derived from the root causes of
weakness, with probable action plans. Finally, we used fuzzy ANP to prioritize these action
plans according to importance of OIAs. Fuzzy Sequential Model (FSM) helps in identifying
which action plan will affect organization more. Thus FSM supports managers while making
decisions on realization of strategic planning. Our contributions to the related literature are the
development of a sequential model which enables effective usage of limited resources in
strategic planning and extending Bolden’s manufacturing taxonomy with the aspect of social
impact.
2. Methodology
In this section we briefly described SWOT analysis, RCA, modified Bolden’s taxonomy and
F-ANP method that are used in the proposed model.
2.1. SWOT analysis
SWOT is an acronym for strengths, weaknesses, opportunities, and threats. SWOT analysis is
a useful method for assessing organizations’ internal factors (strengths and weaknesses) and
external factors (opportunities and threats) in strategic planning process. The SWOT
framework as a specific strategic tool was developed by Learned, Christensen, Andrews, &
Guth (1965), from earlier efforts at the Harvard Business School to analyze case studies
(Chermack & Kasshanna, 2007). The basic framework of SWOT analysis is shown in Table
1.
Table 1
The basic framework of SWOT (Chermack & Kasshanna, 2007)
Strengths Weaknesses
Opportunities Achieve opportunities that greatly match the company's strengths
Overcome weaknesses to attain opportunities
Threats Use strengths to reduce the company's vulnerability to threats
Prevent weaknesses to avoid making the company more susceptible to threats
2.2. Root cause analysis
Root causes are the real reason behind the problems. RCA is a process application that
focuses on permanent solutions to the problems rather than smooth over the cracks. Root
cause analysis techniques can be listed as; failure mode and effect analysis, Ishikawa diagram,
change analysis, Pareto analysis and fault tree analysis. In this study, Ishikawa diagram is
Page 5
used in determining the root causes. The Ishikawa diagram which is also known as fishbone
diagram, was proposed by Kaoru Ishikawa in the 1960s, who founded quality management
processes in Kawasaki shipyards (Jayswal, Li, Anand, Loua, & Huang, 2011).
2.3. Modified Bolden’s taxonomy
Bolden, Waterson, Warr, Clegg, & Wall (1997) proposed a taxonomy to provide a multi-
disciplinary overview of the manufacturing fields. They contribute to the literature with an
overall framework, summarizing and interrelating all the principal activities found within
current manufacturing organizations as seen in Table 2.
Table 2 Modified Bolden’s taxonomy
Primary
Domain of
App.
Business-focus Organizational Focus
Improved
quality (A)
Reduced
cost (B)
Responsiveness to
customers (C)
Improved
technology (D)
Employee
development (E)
Desi
gn
an
d
pro
du
cti
on
(I)
1. Quality standards
2. Statistical process
control
3. Total productive
maintenance
4. Quality function
deployment
5. Mistake proofing
1. Reduced work in
progress
2. Just-in-time
production
3. Process mapping
4. Smart design
5. Re-usability
6. Product
rationalization
1. Rapid
prototyping
2. Concurrent
engineering
3. Customer
involvement in
design
4. Lead time
reduction
5. Agile
manufacture
1. Computer-aided
process planning and
control
2. Computer-integrated
manufacturing systems
3. Automation
4. Computer-aided design
and engineering
1. Job rotation
2. Multi-skilling
3. Psychometrics
4. Appraisal
5. Training and
development
6. Suggestion schemes
7. Attitude surveys
8. Secondments
9. Safety management
Inv
en
tory
an
d
sto
ck
(II
) 1. Supply chain
partnering
2. Customer feedback
3. Conformance checks
1. Reduced inventory
2. Single sourcing
3. Just in time
inventory control
4. Forecasting
5. Logistics
management
1. Predicting
customer
requirements
2. Maintaining
stock levels
1. Automated storage and
retrieval systems
2. Electronic data
interchange
1. Product team
responsibility for
purchasing and
distribution
Wo
rk
org
an
iza
tio
n (
III)
1. Quality improvement
teams
2. Operator
responsibility for quality
3. Quality feedback to
operators
4. Quality training
5. Ergonomic design
1. Downsizing
2. Delayering
3. Outsourcing
4. Casual labor
1. Flexible work
organization
2. After sales
support
3. Cellular
manufacture
1. Flexible manufacturing
systems
2. Group technology
3. Computer supported
management co-operative
work
4. Manufacturing resource
planning
1. Harmonization
2. Team-based work
3. Job enrichment
4. Boundary
Wid
er o
rg
an
iza
tio
n o
f
ma
nu
factu
rin
g (
IV) 1. Total quality
management
2. Quality awards
3. Quality gurus
4. World class
manufacturing
5. Benchmarking for
quality
1. Lean production
2. Cost management
3. Financial
performance measures
4. Time-based
management
5. Benchmarking for
costs
1. Priority given to
customers
2. Market research
3. Customer surveys
4. Benchmarking
for customer
responsiveness
5. Business process
re-engineering
1. Technology strategy
for entire company
2. Computer-based
management tools
3. Benchmarking for
technology
1. Explicit company
2. HRM strategy
3. Employee
empowerment
4. Performance-related
pay
5. Culture change
6. Learning climate
7. Investors in people
8. Benchmarking for
employee
effectiveness
So
cia
l
imp
act
(V)
1. Paperless production
2. Recyclable package
1. Green supply chain
management
1. New media
2. Branding and
marketing
1. Renewable energy
2. HVAC Systems
3. Cogeneration Systems
4. Waste management
5. E-commerce
1. Training of
employees' family
2. Family day
The benefits of a manufacturing practices taxonomy according to Bolden et al. include the
following;
Enables the identification of inter-relationships between practices in a clear manner.
Page 6
Assists in the identification of the differences and commonalities between practices.
Enhances the identification of practices for researchers and practitioners from a variety
of backgrounds.
Promotes the identification of gaps between theory and practice (Walden, 2007).
Bolden's taxonomy helps to find out which areas to focus on, for related problems of the
company. Bolden’s classification scheme for development of their taxonomy is shown in
Table 2. For instance, if a company is dealing with inventory and stock problems, and wants
to reduce costs they should seek solution in those 5 practices (IIB1-Reduced inventory, IIB2-
Single sourcing, IIB3-Just in time inventory control, IIB4-Forecasting, IIB5-Logistics
management) listed in second row (row II), second column (column B).
Bolden et al. proposed this taxonomy in 1997. However, with the help of rapidly developing
internet and communication technologies (ICT), social aspect is crucial for the companies in
today's competitive world. Both internal and external stakeholders of the company have
arising awareness to their new responsibilities to each other and to the environment.
Organization for Economic Co-operation and Development (OECD) reports indicate that ICT,
green growth and social impact are prioritized areas (OECD Innovation strategy 2015 An
agenda for policy action, 2015). For these reasons, our contribution to this taxonomy with the
aspect of social impact can be seen in the fifth row.
2.4. Fuzzy analytic network process (F-ANP)
MCDM is a sub-discipline of operations research that explicitly considers multiple criteria in
decision making environments (Achillas, Moussiopoulos, Karagiannidis, Banias, &
Perkoulidis, 2013). These methods deal with decision making processes and are appropriate
research methods that can be used in selecting and sorting out alternatives. In the decision
process, objectives, quantitative or qualitative criteria are assessed for each alternative at the
same time. AHP is one of the popular MCDM methods which works on priority theory and
was developed by Saaty (1980). ANP is the general form of AHP (Saaty, 1996).
The first phase of ANP compares the measuring criteria in the overall system to form a super-
matrix. This can be accomplished using pair-wise comparisons (Liou, Tzeng, & Chang,
2007). Triangular fuzzy numbers and fuzzy linguistic terms for using pairwise comparisons
are given in Table 3. Experts use linguistic expressions while evaluating criteria. For this
reason, the fuzzy linguistic scale shown in Table 3 is used in the experts’ opinions.
Table 3
The triangular fuzzy numbers and linguistic variables
Linguistic variables Fuzzy number Triangular fuzzy
numbers
Triangular fuzzy
reciprocal numbers
Equally Important (EI) (1; 1; 1) (1; 1; 1)
Weekly Important (WI) (1; 3; 5) (1/5; 1/3; 1)
Strongly Important (SI) (3; 5; 7) (1/7; 1/5; 1/3)
Very Important (VI) (5; 7; 9) (1/9; 1/7; 1/5)
Absolutely Important (AI) (7; 9; 9) (1/9; 1/9; 1/7)
We used a simple extent analysis method proposed by Chang, (1996) for F-ANP weight
derivation. Extent analysis method is selected in this study because of a broader use in related
literature and also it has less computational complexity by using triangular fuzzy numbers.
We described extent analysis method below.
Page 7
Let be an object set, and be a goal set.
where all the
are triangular fuzzy
numbers.
Step 1: The value of fuzzy synthetic extent with respect to the ith object is defined as
(1)
To obtain
, perform the fuzzy addition operation of m extent analysis values for a
particular matrix such that
(2)
and to obtain
, perform the fuzzy addition operation of
values such that
(3)
(4)
Step 2: The degree of possibility of is defined as
and can be equivalently expressed as follows:
(5)
where d is the ordinate of the highest intersection point d between and
. Both values of
and are required in order to compare and .
Step 3: The degree possibility for a convex fuzzy number to be greater than k convex fuzzy
numbers can be defined by
(6)
Assume that
for . (7)
Then the weight vector is given by
(8)
where are n elements.
Step 4: Via the normalization, the normalized weight vectors are
where is a non-fuzzy number. (9)
Page 8
3. Proposed model and application
In this section we described proposed model and the application of the model in a
manufacturing small medium enterprise (SME).
3.1. Fuzzy sequential model
FSM consists of four consecutive methodologies. As shown in Figure 1, first step is
identifying OIAs through SWOT analysis. The second step is identifying the root cause of
problems in OIAs by RCA. The subsequent step is developing action plans for each root
cause through Bolden's taxonomy of modern manufacturing practices. We enhanced Bolden’s
best practice taxonomy by a modest modification of adding social impact aspect. All action
plans are recommended with respect to the limited resources such as time, cost and
workforce. We believe action plans should be prioritized and applied in a particular order
because most of the SMEs have major problems with limited resources. At this point problem
priorities were determined by using fuzzy analytic network process (F-ANP) method.
Furthermore, we applied this fuzzy approach to continuous improvement model, in a
manufacturing SME as a real world case study.
Determining areas of
improvement
(SWOT Analysis)
Determining the root
cause
(RCA)
Developing action
plans (Modified
Bolden's Taxonomy)
Determining priority of
recommendations
(F-ANP)
Fig. 1. Steps of proposed fuzzy sequential model
3.2. Application of FSM in a manufacturing firm
Proposed model was applied in a manufacturing SME. In order to preserve confidentiality,
this company is referred to as ABC company. ABC is an SME that produces manual, semi-
automatic and automatic band saw machines since 1994. The company employs around 75
people. The major activities in the company include engineering (Research & Development,
Product Development), manufacturing, purchasing, export and import. We examined the ABC
company on the basis of departments. In total, eight departments were evaluated. These
departments are production planning, product development, manufacturing, quality assurance,
purchasing-procurement, management and organization, accounting and finance, human
resources and sales and marketing.
Page 9
Lesser Market Share
Insufficient Manufacturing Area
Missing Updates of Strategic Plan
No CRM module in Current Used Software
Lack of Foreign Language Not Enough
Training on Modern Marketing MethodsIneffective use
of the New Media
Fig. 2. Root cause analysis of OIA 1.5 Lesser market share
We organized meetings with attendees of relevant department managers, for determining
strengths and OIAs of departments. We identified root causes with a core team consisting of
senior manager, unit supervisor and blue-collar workers. Ishikawa diagram as shown in
Figure 2 is used for determining the root cause of each area with the core team. "Lesser
market share" problem (OIA 1.5) has been selected and shown in Figure 2 as an illustrative
example for RCA. Four major causes were determined by the ABC company professionals.
These are "insufficient marketing strategies", "lesser product diversity", "lack of customer
relationship management (CRM)" and "inadequate marketing department". Inadequate
marketing department was evaluated as the most important cause of lesser market share for
the ABC company. Root cause of inadequate market department was determined as
ineffective use of the new media. As a result of the meetings 12 OIAs were determined and
were matched with root causes. 18 different action plans for ABC company are shown in
Table 4. Open to improvement areas are determined in three levels which are strategic,
tactical and operational in the Table 4. For instance, OIA 1.5 was evaluated in strategic level.
"Ineffective use of new media" was determined as a root cause of OIA 1.5. As a result of the
discussions in ABC company, VC1 (New media) and VC2 ( Branding and marketing) were
selected in modified Bolden's taxonomy as shown in Table 2 for action plans of OIA 1.5.
Table 4
Open to improvement areas in ABC company
Level No Open to improvement areas Root cause Action plans
S1. Strategic
OIA 1.1 Inconsistency of the annual budget plan Ineffective cost management IVB2 OIA 1.2 Lack of CRM Lack of workforce and software IVC1-IVC3
OIA 1.3 Lack of E-commerce Lack of technological infrastructure
VD5
OIA 1.4 The inability to forecast demand Inadequate market information IVC2-IIB4 OIA 1.5 Lesser market share Ineffective use of new media VC1-VC2
S2. Tactical
OIA 2.1
Failure to comply with the design calendar in Research & Development (R&D) and Product Development (P&D) processes
Market profile IIC1
OIA 2.2 Late arriving purchase parts Ineffective purchasing management
IIE1-IID2
OIA 2.3 Mid-level managers take inadequate initiatives
Lack of organizational culture IVE5-IIIE3
S3. Operational
OIA 3.1 Lack of standard operating times Lack of necessary labor IVE3-IVE4 OIA 3.2 Small lot sizes High diversity of parts IB4-IIID2
OIA 3.3 Unknown location of materials in storage
yard Disorder of storage yard IID1
OIA 3.4 Inadequate assembly yard Ineffective layout IIID2
Page 10
4. Results
We aimed at better usage of resources for realization of strategic planning. Therefore we
prioritized the OIAs by using F-ANP method. According to F-ANP method first we gathered
expert opinions. Determining prioritization of OIAs provides prioritization of action plans
based on OIAs. In our study we have gathered 5 experts’ opinion. The impact relation map for
the levels according to company managers is shown in Figure 3.
Strategic
level
Tactical
levelOperational
level
Fig. 3. Impact relation map
Pairwise comparisons were carried out to determining impact relation map. First expert’s
opinions are given in Table 5. According to the expert opinions, the weights of the sub-criteria
are calculated. For example, since S1 (strategic level) affects S2 (tactical level) as shown in
Figure 3, the fuzzy evaluation of importance of sub-criteria of S2 (OIA 2.1, OIA 2.2 and OIA
2.3) in terms of OIA 1.1, OIA 1.2, OIA 1.3, OIA 1.4 and OIA 1.5 are given in Table 5.
Fig. 4. Network structure of FSM in ABC company
As seen in Figure 4 and Figure 3 there are 6 relationships between the levels. Strategic level
effects both tactical level and operational level. Operational level effects tactical level.
Tactical level effects strategic level, operational level and also effects itself. Strategic, tactical
and operational levels include; 5 OIAs, 3 OIAs and 4 OIAs, respectively.
Page 11
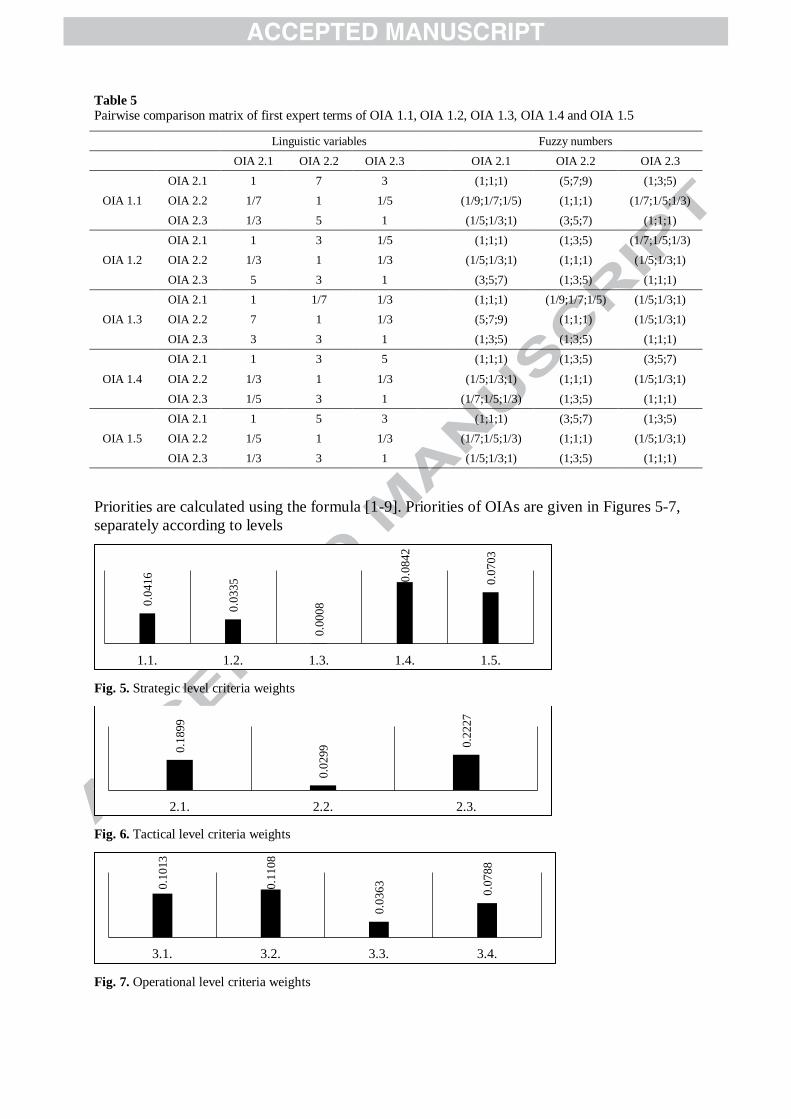
Table 5
Pairwise comparison matrix of first expert terms of OIA 1.1, OIA 1.2, OIA 1.3, OIA 1.4 and OIA 1.5
Linguistic variables Fuzzy numbers
OIA 2.1 OIA 2.2 OIA 2.3 OIA 2.1 OIA 2.2 OIA 2.3
OIA 1.1
OIA 2.1 1 7 3
(1;1;1) (5;7;9) (1;3;5)
OIA 2.2 1/7 1 1/5
(1/9;1/7;1/5) (1;1;1) (1/7;1/5;1/3)
OIA 2.3 1/3 5 1 (1/5;1/3;1) (3;5;7) (1;1;1)
OIA 1.2
OIA 2.1 1 3 1/5
(1;1;1) (1;3;5) (1/7;1/5;1/3)
OIA 2.2 1/3 1 1/3
(1/5;1/3;1) (1;1;1) (1/5;1/3;1)
OIA 2.3 5 3 1 (3;5;7) (1;3;5) (1;1;1)
OIA 1.3
OIA 2.1 1 1/7 1/3
(1;1;1) (1/9;1/7;1/5) (1/5;1/3;1)
OIA 2.2 7 1 1/3
(5;7;9) (1;1;1) (1/5;1/3;1)
OIA 2.3 3 3 1 (1;3;5) (1;3;5) (1;1;1)
OIA 1.4
OIA 2.1 1 3 5
(1;1;1) (1;3;5) (3;5;7)
OIA 2.2 1/3 1 1/3
(1/5;1/3;1) (1;1;1) (1/5;1/3;1)
OIA 2.3 1/5 3 1 (1/7;1/5;1/3) (1;3;5) (1;1;1)
OIA 1.5
OIA 2.1 1 5 3
(1;1;1) (3;5;7) (1;3;5)
OIA 2.2 1/5 1 1/3
(1/7;1/5;1/3) (1;1;1) (1/5;1/3;1)
OIA 2.3 1/3 3 1 (1/5;1/3;1) (1;3;5) (1;1;1)
Priorities are calculated using the formula [1-9]. Priorities of OIAs are given in Figures 5-7,
separately according to levels
Fig. 5. Strategic level criteria weights
Fig. 6. Tactical level criteria weights
Fig. 7. Operational level criteria weights
0.0
416
0.0
335
0.0
008
0.0
842
0.0
703
1.1. 1.2. 1.3. 1.4. 1.5.
0.1
899
0.0
299
0.2
227
2.1. 2.2. 2.3.
0.1
013
0.1
108
0.0
363
0.0
788
3.1. 3.2. 3.3. 3.4.
Page 12
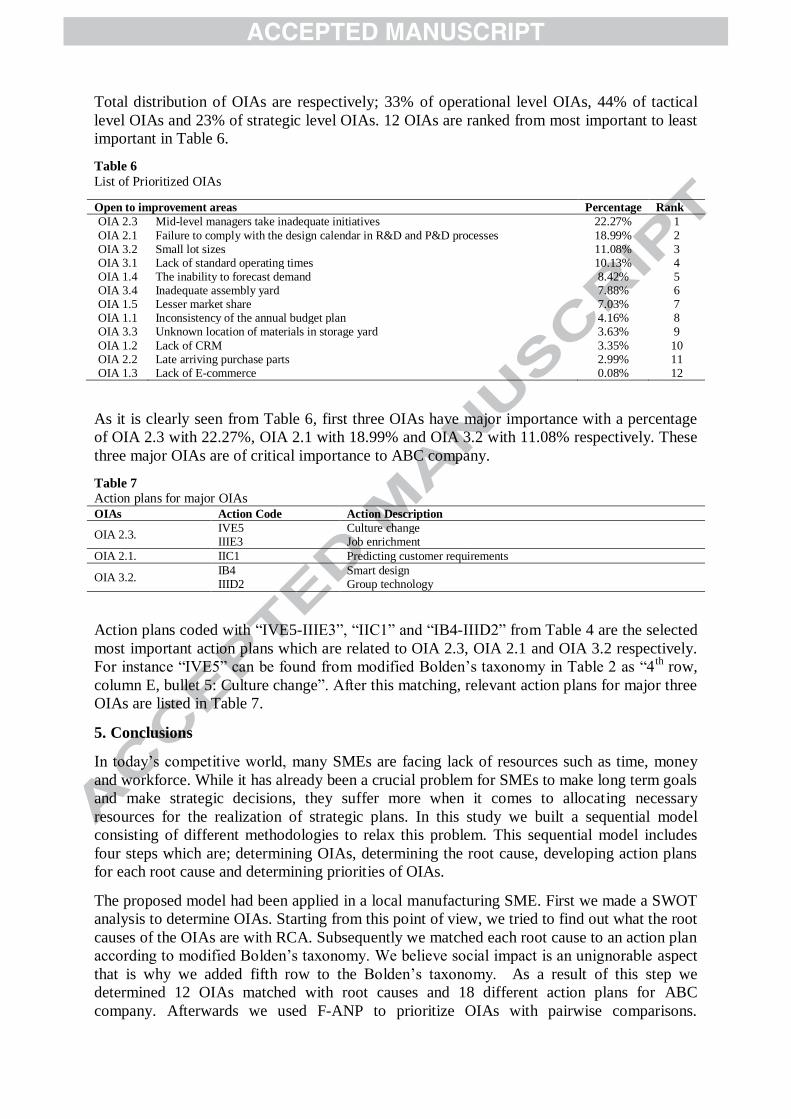
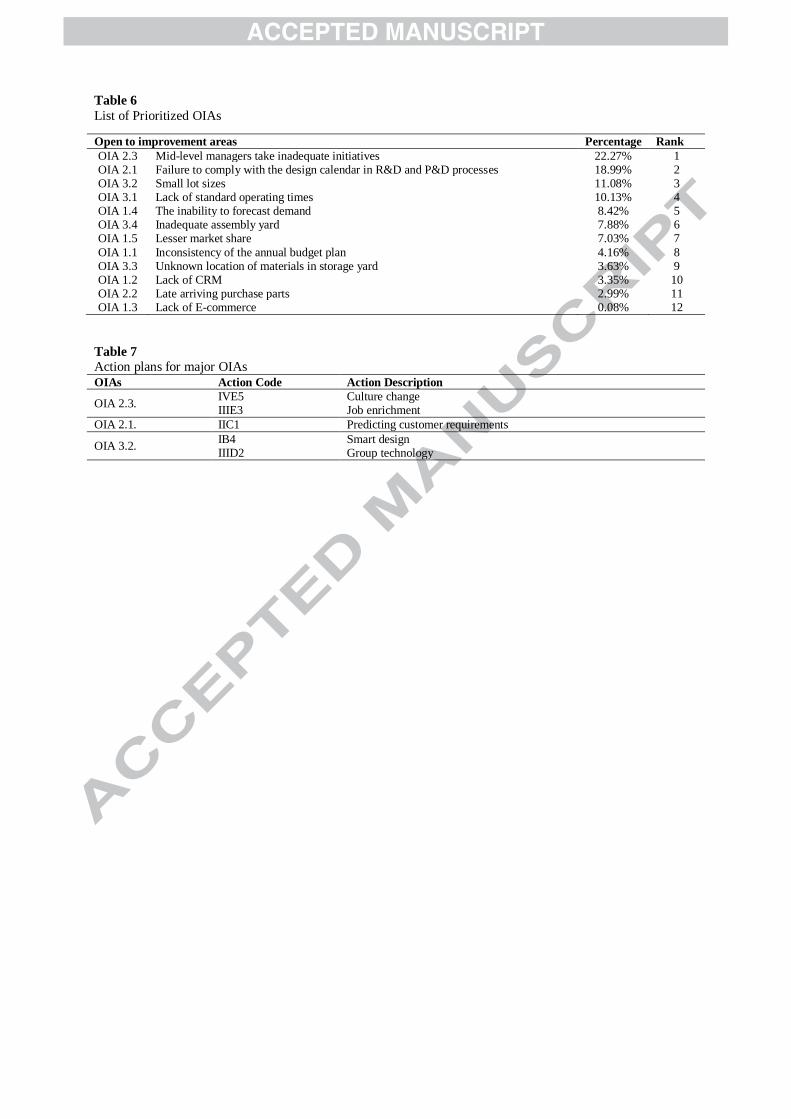
Total distribution of OIAs are respectively; 33% of operational level OIAs, 44% of tactical
level OIAs and 23% of strategic level OIAs. 12 OIAs are ranked from most important to least
important in Table 6.
Table 6
List of Prioritized OIAs
Open to improvement areas Percentage Rank
OIA 2.3 Mid-level managers take inadequate initiatives 22.27% 1
OIA 2.1 Failure to comply with the design calendar in R&D and P&D processes 18.99% 2 OIA 3.2 Small lot sizes 11.08% 3 OIA 3.1 Lack of standard operating times 10.13% 4 OIA 1.4 The inability to forecast demand 8.42% 5 OIA 3.4 Inadequate assembly yard 7.88% 6 OIA 1.5 Lesser market share 7.03% 7 OIA 1.1 Inconsistency of the annual budget plan 4.16% 8 OIA 3.3 Unknown location of materials in storage yard 3.63% 9
OIA 1.2 Lack of CRM 3.35% 10 OIA 2.2 Late arriving purchase parts 2.99% 11 OIA 1.3 Lack of E-commerce 0.08% 12
As it is clearly seen from Table 6, first three OIAs have major importance with a percentage
of OIA 2.3 with 22.27%, OIA 2.1 with 18.99% and OIA 3.2 with 11.08% respectively. These
three major OIAs are of critical importance to ABC company.
Table 7
Action plans for major OIAs
OIAs Action Code Action Description
OIA 2.3. IVE5 Culture change IIIE3 Job enrichment
OIA 2.1. IIC1 Predicting customer requirements
OIA 3.2. IB4 Smart design IIID2 Group technology
Action plans coded with “IVE5-IIIE3”, “IIC1” and “IB4-IIID2” from Table 4 are the selected
most important action plans which are related to OIA 2.3, OIA 2.1 and OIA 3.2 respectively.
For instance “IVE5” can be found from modified Bolden’s taxonomy in Table 2 as “4th
row,
column E, bullet 5: Culture change”. After this matching, relevant action plans for major three
OIAs are listed in Table 7.
5. Conclusions
In today’s competitive world, many SMEs are facing lack of resources such as time, money
and workforce. While it has already been a crucial problem for SMEs to make long term goals
and make strategic decisions, they suffer more when it comes to allocating necessary
resources for the realization of strategic plans. In this study we built a sequential model
consisting of different methodologies to relax this problem. This sequential model includes
four steps which are; determining OIAs, determining the root cause, developing action plans
for each root cause and determining priorities of OIAs.
The proposed model had been applied in a local manufacturing SME. First we made a SWOT
analysis to determine OIAs. Starting from this point of view, we tried to find out what the root
causes of the OIAs are with RCA. Subsequently we matched each root cause to an action plan
according to modified Bolden’s taxonomy. We believe social impact is an unignorable aspect
that is why we added fifth row to the Bolden’s taxonomy. As a result of this step we
determined 12 OIAs matched with root causes and 18 different action plans for ABC
company. Afterwards we used F-ANP to prioritize OIAs with pairwise comparisons.
Page 13
Eventually we managed to prioritize possible action plans to those OIAs. Therefore this
model gives rankings and insights about which problem/OIA has more important role for the
SME according to strategic planning. We believe this study has two distinguished
contributions to the related literature. The first one is the development of a sequential model
which enables effective usage of limited resources in strategic planning. The second one is
enhancing Bolden’s manufacturing taxonomy with the aspect of social impact. This study can
be used by both researchers and industrial practitioners in the field of strategic planning and
decision making. For the future studies, action plan prioritizing method used in the FSM can
be compared and improved with other MCDM methods.
References
Achillas, C., Moussiopoulos, N., Karagiannidis, A., Banias, G., & Perkoulidis, G. (2013). The
use of multi-criteria decision analysis to tackle waste management problems: a literature
review. Waste Management & Research, 31(2), 115–129.
doi:10.1177/0734242X12470203
Arabzad, S. M., Ghorbani, M., Razmi, J., & Shirouyehzad, H. (2015). Employing fuzzy
TOPSIS and SWOT for supplier selection and order allocation problem. The
International Journal of Advanced Manufacturing Technology, 76(5), 803–818.
doi:10.1007/s00170-014-6288-3
Ayhan, M. B., & Kılıç, H. S. (2015). A two stage approach for supplier selection problem in
multi-item multi-supplier environment with quantity discounts. Computers & Industrial
Engineering, 85, 1–12. doi:10.1016/j.cie.2015.02.026
Azimi, R., Yazdani-chamzini, A., Fooladgar, M. M., & Basiri, M. H. (2011). Evaluating the
strategies of the Iranian mining sector using a integrated model. International Journal of
Management Science and Engineering Management, 6(6), 459–466.
doi:10.1080/17509653.2011.10671196
Baby, S. (2013). AHP modeling for multicriteria decision-making and to optimise strategies
for protecting coastal landscape resources. International Journal of Innovation,
Management and Technology, 4(2), 218–227. doi:10.7763/IJIMT.2013.V4.395
Bolden, R., Waterson, P., Warr, P., Clegg, C., & Wall, T. (1997). A new taxonomy of modern
manufacturing practices. International Journal of Operations & Production
Management, 17(11), 1112–1130. doi:10.1108/01443579710177879
Büyüközkan, G., & Çifçi, G. (2012). A novel hybrid MCDM approach based on fuzzy
DEMATEL, fuzzy ANP and fuzzy TOPSIS to evaluate green suppliers. Expert Systems
with Applications, 39(3), 3000–3011. doi:10.1016/j.eswa.2011.08.162
Chang, D.-Y. (1996). Applications of the extent analysis method on fuzzy AHP. European
Journal of Operational Research, 95(3), 649–655. doi:10.1016/0377-2217(95)00300-2
Chen, C.-T., Lin, C.-T., & Huang, S.-F. (2006). A fuzzy approach for supplier evaluation and
selection in supply chain management. International Journal of Production Economics,
102(2), 289–301. doi:10.1016/j.ijpe.2005.03.009
Chermack, T. J., & Kasshanna, B. K. (2007). The use and misuse of SWOT analysis and
implications for HRD professionals. Human Resource Development International, 10(4),
383–399. doi:10.1080/13678860701718760
Chiou, H. K., Tzeng, G. H., & Cheng, D. C. (2005). Evaluating sustainable fishing
development strategies using fuzzy MCDM approach. Omega, 33(3), 223–234.
doi:10.1016/j.omega.2004.04.011
Page 14
Dodangeh, J., Yusuff, R. B. M., & Jassbi, J. (2010). Using Topsis Method with Goal
Programming for Best selection of Strategic Plans in BSC Model. Jurnal of American
Science, 6(3).
Dulmin, R., & Mininno, V. (2003). Supplier selection using a multi-criteria decision aid
method. Journal of Purchasing and Supply Management, 9(4), 177–187.
doi:10.1016/S1478-4092(03)00032-3
Hu, H. Y., Chiu, S.-I., Yen, T.-M., & Cheng, C.-C. (2015). Assessment of supplier quality
performance of computer manufacturing industry by using ANP and DEMATEL. The
TQM Journal, 27(1), 122–134. doi:10.1108/TQM-11-2012-0091
Jayswal, A., Li, X., Anand, Z., Loua, H. H., & Huang, Y. (2011). A sustainability root cause
analysis methodology and its application. Computers and Chemical Engineering,
35(2011), 2786–2798.
Learned, E., Christensen, C. R., & Andrews, K. R. (1965). Business policy: Text and cases.
Li, X., Ang, C. L., & Gay, R. (1997). An intelligent scenario generator for strategic business
planning. Computers in Industry, 34(3), 261–269. doi:10.1016/S0166-3615(97)00062-6
Liou, J. J. H., Tzeng, G.-H., & Chang, H.-C. (2007). Airline safety measurement using a
hybrid model. Journal of Air Transport Management, 13(4), 243–249.
doi:10.1016/j.jairtraman.2007.04.008
Moynihan, G. P., Raj, P. S., Sterling, J. U., & Nichols, W. G. (1995). Decision support system
for strategic logistics planning. Computers in Industry, 26(1), 75–84. doi:10.1016/0166-
3615(95)80007-7
Ocampo, L., Clark, E., & Tanudtanud, K. V. (2015). A Sustainable Manufacturing Strategy
from Different Strategic Responses under Uncertainty. Journal of Industrial
Engineering, 2015. doi:http://dx.doi.org/10.1155/2015/210568
OECD Innovation strategy 2015 An agenda for policy action. (2015). Paris. Retrieved from
http://www.oecd.org/innovation/OECD-Innovation-Strategy-2015-CMIN2015-7.pdf
Perçin, S. (2010). Use of analytic network process in selecting knowledge management
strategies. Management Research Review, 33(5), 452–471.
doi:10.1108/01409171011041893
Razmi, J., Rafiei, H., & Hashemi, M. (2009). Designing a decision support system to evaluate
and select suppliers using fuzzy analytic network process. Computers and Industrial
Engineering, 57(4), 1282–1290. doi:10.1016/j.cie.2009.06.008
Saaty, T. L. (1980). The Analytic Hierarchy Process. New York, USA: McGraw-Hill.
Saaty, T. L. (1996). Decision Making with Dependence and Feedback: The Analytic Network
Process. Pittsburgh: RWS Publications. Retrieved from
http://www.rwspublications.com/books/anp/decision-making-with-dependence-and-
feedback/
Walden, C. T. (2007). A Taxonomy Based Assessment Methodology for Small and Medium
Size Manufacturers. Mississippi State University. Retrieved from
http://scholar.google.com/scholar?hl=en&btnG=Search&q=intitle:No+Title#0
Wu, C. S., Lin, C. T., & Lee, C. (2010). Optimal marketing strategy: A decision-making with
ANP and TOPSIS. International Journal of Production Economics, 127(1), 190–196.
doi:10.1016/j.ijpe.2010.05.013
Zavadskas, E. K., Turskis, Z., & Tamosaitiene, J. (2011). Selection of construction enterprises
Page 15
management strategy based on the SWOT and multi-criteria analysis. Archives of Civil
and Mechanical Engineering, 11(4), 1063–1082. doi:10.1016/S1644-9665(12)60096-X
Zeydan, M., Çolpan, C., & Çobanoğlu, C. (2011). A combined methodology for supplier
selection and performance evaluation. Expert Systems with Applications, 38(3), 2741–
2751. doi:10.1016/j.eswa.2010.08.064
Page 16
Table 1
The basic framework of SWOT (Chermack & Kasshanna, 2007)
Strengths Weaknesses
Opportunities Achieve opportunities that greatly match
the company's strengths
Overcome weaknesses to attain opportunities
Threats Use strengths to reduce the company's
vulnerability to threats
Prevent weaknesses to avoid making the company
more susceptible to threats
Table 2 Modified Bolden’s taxonomy
Primary
Domain of
App.
Business-focus Organizational Focus
Improved
quality (A)
Reduced
cost (B)
Responsiveness to
customers (C)
Improved
technology (D)
Employee
development (E)
Desi
gn
an
d
pro
du
cti
on
(I)
1. Quality standards
2. Statistical process
control
3. Total productive
maintenance
4. Quality function
deployment
5. Mistake proofing
1. Reduced work in
progress
2. Just-in-time
production
3. Process mapping
4. Smart design
5. Re-usability
6. Product
rationalization
1. Rapid
prototyping
2. Concurrent
engineering
3. Customer
involvement in
design
4. Lead time
reduction
5. Agile
manufacture
1. Computer-aided
process planning and
control
2. Computer-integrated
manufacturing systems
3. Automation
4. Computer-aided design
and engineering
1. Job rotation
2. Multi-skilling
3. Psychometrics
4. Appraisal
5. Training and
development
6. Suggestion schemes
7. Attitude surveys
8. Secondments
9. Safety management
Inv
en
tory
an
d
sto
ck
(II
) 1. Supply chain
partnering
2. Customer feedback
3. Conformance checks
1. Reduced inventory
2. Single sourcing
3. Just in time
inventory control
4. Forecasting
5. Logistics
management
1. Predicting
customer
requirements
2. Maintaining
stock levels
1. Automated storage and
retrieval systems
2. Electronic data
interchange
1. Product team
responsibility for
purchasing and
distribution
Wo
rk
org
an
iza
tio
n (
III)
1. Quality improvement
teams
2. Operator
responsibility for quality
3. Quality feedback to
operators
4. Quality training
5. Ergonomic design
1. Downsizing
2. Delayering
3. Outsourcing
4. Casual labor
1. Flexible work
organization
2. After sales
support
3. Cellular
manufacture
1. Flexible manufacturing
systems
2. Group technology
3. Computer supported
management co-operative
work
4. Manufacturing resource
planning
1. Harmonization
2. Team-based work
3. Job enrichment
4. Boundary
Wid
er o
rg
an
iza
tio
n o
f
ma
nu
factu
rin
g (
IV) 1. Total quality
management
2. Quality awards
3. Quality gurus
4. World class
manufacturing
5. Benchmarking for
quality
1. Lean production
2. Cost management
3. Financial
performance measures
4. Time-based
management
5. Benchmarking for
costs
1. Priority given to
customers
2. Market research
3. Customer surveys
4. Benchmarking
for customer
responsiveness
5. Business process
re-engineering
1. Technology strategy
for entire company
2. Computer-based
management tools
3. Benchmarking for
technology
1. Explicit company
2. HRM strategy
3. Employee
empowerment
4. Performance-related
pay
5. Culture change
6. Learning climate
7. Investors in people
8. Benchmarking for
employee
effectiveness
So
cia
l
imp
act
(V)
1. Paperless production
2. Recyclable package
1. Green supply chain
management
1. New media
2. Branding and
marketing
1. Renewable energy
2. HVAC Systems
3. Cogeneration Systems
4. Waste management
5. E-commerce
1. Training of
employees' family
2. Family day
Page 17
Table 3
The triangular fuzzy numbers and linguistic variables
Linguistic variables Fuzzy number Triangular fuzzy
numbers
Triangular fuzzy
reciprocal numbers
Equally Important (EI) (1, 1, 1) (1, 1, 1)
Weekly Important (WI) (1, 3, 5) (1/5, 1/3, 1)
Strongly Important (SI) (3, 5, 7) (1/7, 1/5, 1/3)
Very Important (VI) (5, 7, 9) (1/9, 1/7, 1/5)
Absolutely Important (AI) (7, 9, 9) (1/9, 1/9, 1/7)
Table 4
Open to improvement areas in ABC company
Level No Open to improvement areas Root cause Action plans
S1. Strategic
OIA 1.1 Inconsistency of the annual budget plan Ineffective cost management IVB2 OIA 1.2 Lack of CRM Lack of workforce and software IVC1-IVC3
OIA 1.3 Lack of E-commerce Lack of technological infrastructure
VD5
OIA 1.4 The inability to forecast demand Inadequate market information IVC2-IIB4 OIA 1.5 Lesser market share Ineffective use of new media VC1-VC2
S2. Tactical
OIA 2.1
Failure to comply with the design calendar in Research & Development (R&D) and Product Development (P&D) processes
Market profile IIC1
OIA 2.2 Late arriving purchase parts Ineffective purchasing management
IIE1-IID2
OIA 2.3 Mid-level managers take inadequate initiatives
Lack of organizational culture IVE5-IIIE3
S3. Operational
OIA 3.1 Lack of standard operating times Lack of necessary labor IVE3-IVE4 OIA 3.2 Small lot sizes High diversity of parts IB4-IIID2
OIA 3.3 Unknown location of materials in storage
yard Disorder of storage yard IID1
OIA 3.4 Inadequate assembly yard Ineffective layout IIID2
Table 5
Pairwise comparison matrix of first expert terms of OIA 1.1, OIA 1.2, OIA 1.3, OIA 1.4 and OIA 1.5
Linguistic variables Fuzzy numbers
OIA 2.1 OIA 2.2 OIA 2.3 OIA 2.1 OIA 2.2 OIA 2.3
OIA 1.1
OIA 2.1 1 7 3
(1;1;1) (5;7;9) (1;3;5)
OIA 2.2 1/7 1 1/5
(1/9;1/7;1/5) (1;1;1) (1/7;1/5;1/3)
OIA 2.3 1/3 5 1 (1/5;1/3;1) (3;5;7) (1;1;1)
OIA 1.2
OIA 2.1 1 3 1/5
(1;1;1) (1;3;5) (1/7;1/5;1/3)
OIA 2.2 1/3 1 1/3
(1/5;1/3;1) (1;1;1) (1/5;1/3;1)
OIA 2.3 5 3 1 (3;5;7) (1;3;5) (1;1;1)
OIA 1.3
OIA 2.1 1 1/7 1/3
(1;1;1) (1/9;1/7;1/5) (1/5;1/3;1)
OIA 2.2 7 1 1/3
(5;7;9) (1;1;1) (1/5;1/3;1)
OIA 2.3 3 3 1 (1;3;5) (1;3;5) (1;1;1)
OIA 1.4
OIA 2.1 1 3 5
(1;1;1) (1;3;5) (3;5;7)
OIA 2.2 1/3 1 1/3
(1/5;1/3;1) (1;1;1) (1/5;1/3;1)
OIA 2.3 1/5 3 1 (1/7;1/5;1/3) (1;3;5) (1;1;1)
OIA 1.5
OIA 2.1 1 5 3
(1;1;1) (3;5;7) (1;3;5)
OIA 2.2 1/5 1 1/3
(1/7;1/5;1/3) (1;1;1) (1/5;1/3;1)
OIA 2.3 1/3 3 1 (1/5;1/3;1) (1;3;5) (1;1;1)
Page 18
Table 6
List of Prioritized OIAs
Open to improvement areas Percentage Rank
OIA 2.3 Mid-level managers take inadequate initiatives 22.27% 1 OIA 2.1 Failure to comply with the design calendar in R&D and P&D processes 18.99% 2 OIA 3.2 Small lot sizes 11.08% 3 OIA 3.1 Lack of standard operating times 10.13% 4 OIA 1.4 The inability to forecast demand 8.42% 5 OIA 3.4 Inadequate assembly yard 7.88% 6 OIA 1.5 Lesser market share 7.03% 7
OIA 1.1 Inconsistency of the annual budget plan 4.16% 8 OIA 3.3 Unknown location of materials in storage yard 3.63% 9 OIA 1.2 Lack of CRM 3.35% 10 OIA 2.2 Late arriving purchase parts 2.99% 11 OIA 1.3 Lack of E-commerce 0.08% 12
Table 7
Action plans for major OIAs
OIAs Action Code Action Description
OIA 2.3. IVE5 Culture change IIIE3 Job enrichment
OIA 2.1. IIC1 Predicting customer requirements
OIA 3.2. IB4 Smart design IIID2 Group technology
Page 19
Highlights
A sequential model for effective resource usage realization of strategic planning.
Consists of four different techniques; SWOT, RCA, Bolden’s taxonomy and Fuzzy
ANP.
Applied in a local manufacturing SME.
Action plans are ranked due to their importance levels.
Suitable model for both researches and industrial practitioners.
Page 20
Graphical abstract