McGinley A GIS APPROACH TO BUS SERVICE PLANNING Dr. Francis McGinley The Transport Research Centre Royal Melbourne Institute of Technology Melbourne, Victoria, Australia ABSTRACT This paper overviews a study conducted for the Victorian Department of Infrastructure which set out to develop and demonstrate a practical analytical methodology for evaluating new bus service proposals. The paper describes the development of a GIS framework based on the State Cadastre. The approach first makes use of various electronic information sources including the Census, new dwelling approvals, State Planning Scheme and various address files to pin-point the likely location of dwellings in Melbourne and to estimate local area demographics. In the second step, the Victorian Activity and Travel Survey (VATS) and public transport networks are used to estimate the demand for bus travel in each local area. GIS methods are then used to identify and rank areas in greatest need of additional service. Finally, GIS tools are used to estimate patronage changes for new service proposals by aggregating travel demand for residential populations in walk catchments around the routes. This technique enables tactical bus service planning to be made responsive to on-going residential development across metropolitan areas and is sufficiently precise to enable meaningful catchment analysis to be performed in the narrow walk-only catchments which define the major market segment for buses. The methodology is also readily adaptable to other issues in public transport which are discussed.
Transcript
McGinley
A GIS APPROACH TO BUS SERVICE PLANNING
Dr. Francis McGinleyThe Transport Research Centre
Royal Melbourne Institute of TechnologyMelbourne, Victoria, Australia
ABSTRACT
This paper overviews a study conducted for the Victorian Department of Infrastructure whichset out to develop and demonstrate a practical analytical methodology for evaluating new busservice proposals.
The paper describes the development of a GIS framework based on the State Cadastre. Theapproach first makes use of various electronic information sources including the Census, newdwelling approvals, State Planning Scheme and various address files to pin-point the likelylocation of dwellings in Melbourne and to estimate local area demographics. In the secondstep, the Victorian Activity and Travel Survey (VATS) and public transport networks are usedto estimate the demand for bus travel in each local area. GIS methods are then used to identifyand rank areas in greatest need of additional service. Finally, GIS tools are used to estimatepatronage changes for new service proposals by aggregating travel demand for residentialpopulations in walk catchments around the routes.
This technique enables tactical bus service planning to be made responsive to on-goingresidential development across metropolitan areas and is sufficiently precise to enablemeaningful catchment analysis to be performed in the narrow walk-only catchments whichdefine the major market segment for buses. The methodology is also readily adaptable toother issues in public transport which are discussed.
A Methodology for Evaluating Bus Service Proposals
Introduction
This paper reports on a project conducted for the Victorian Department of Infrastructure in2000.
The aim was to develop and demonstrate a practical analytical methodology for evaluatingand ranking new bus service proposals, and particularly those involving the introduction ofservices into new areas. Two typical scenarios might be the extension of an existing weekdayservice into a developing area, or the introduction of ‘in-fill’ services in established areas onweekends.
The project was given a short timeframe owing to a backlog of proposals needing to beanalysed in time for the capital bidding process. The emphasis, therefore, was on developing asimple approach, based on currently available data sources, which could be used as a planningaide by experienced operational planners to evaluate proposals in the metropolitan area.
The methodology also needed to be sufficiently responsive to cope with the ongoing influx ofproposals from various stakeholder groups, and to provide a more uniform, objective andtransparent basis for ranking proposals and handling competing internal and externalpriorities.
Ideally, the methodology would provide a basis for developing more robust approaches in thefuture covering the whole of Victoria.
The project offered three important challenges of general relevance to public transportagencies in major cities:� To find a way to respond quickly to new urban developments in advance of traditional
data sources (e.g. Census) becoming available,� To fill a gap with a system that comes to grips with service design at the small-area level
while reviewing and comparing needs over much broader areas, and� To make bus route planning more responsive to latent demand which by its nature is more
difficult to do than reacting to demonstrated demand (e.g. overcrowding).
Assumptions and simplifications
It was assumed that the service proposals could be valued on patronage changes andimplementation costs. Other factors such as policy objectives and political issues would needto be dealt with separately.
This assumption reduced the scope of the problem to that of estimating patronage becausecosts can be calculated using existing techniques such as unit cost methods or schedules-based costing. In practice, however, patronage will depend on many factors concerning themarkets and activity generators served, the quality of the service provided and the level ofcompetition, particularly from cars, but also from other public transport.
For the purpose of achieving a meaningful ‘first-cut’ evaluation and ranking of proposals, abasic trip generation model with sensitivity to residential accessibility, population density,service frequency and age/employment profile was considered adequate.
The approach chosen reflects the fact that most bus trips in Melbourne are made to or fromhome and that access is largely by walking. Empirical analysis of travel data shows that, onaverage, around 64% of all bus passenger trips involve home-based, walk access/egress(Victorian Activity and Travel Survey, 1994-1998). This figure rises to approximately 75%when additional linked bus trips are also included.
McGinley
This implies that patronage on a typical bus route, existing or proposed, depends substantiallyon the presence of demand from a residential population within a tightly defined walkingcatchment. Such populations are readily identified and measured. On the other hand, becauseservices are always proposed on the basis of serving a selection of schools, employment,shopping areas and transit interchanges, sufficient attraction is likely to be present and can beverified in the evaluation process. This lessens the need to model attraction explicitly.
Finally, it was assumed that residential demand would depend on demographic factors such asage and employment status, and on the service frequency. Other variables, such as householdincome, will also affect demand and may be included in the model at a later stage.
Analytical framework
Figure 1 illustrates the analytical framework described above. The diagram shows howcharacteristics of the population and bus service interact to influence two importantdeterminants of patronage - residential accessibility to bus services and travel demand. Costs,on the other hand, depend more directly on service characteristics. Although not pursued inthe project, this formulation could be further refined to relate frequencies to loading levels,waiting times and other service design standards. It was assumed for the project that thesefactors would be taken into account, externally, in the service design and costing process.
ACCESSIBILITY(To Buses)
POPULATION SERVICES
LOCATION(Dwellings)
DEMOGRAPHICS
LOCATION(Routes)
ROUTES,FREQUENCIES
DEMAND(Trip Rates)
Patronage CostCOST-EFFECTIVENESS
Figure 1. Analytical Framework
A Methodology for Evaluating Bus Service Proposals
Despite its limitations, this framework was considered adequate for the intended applicationof the model. For a broader discussion, Richardson (1994) presents a comprehensive modelfeaturing a wide range of factors influencing public tranport planning and operations.
The framework for this project describes a catchment analysis. It suggests that a majorcomponent of patronage can be estimated by totalling residential demand within walkingcatchments around bus routes. Two development tasks were necessary to achieve this. First,the residential population needed to be located precisely enough to enable accessibility to busservices (i.e. inclusion in walking catchments) to be determined. Second, trip rates wererequired to arrive at demand estimates within each catchment.
The project also required an evaluation methodology based on the framework to bedemonstrated. A two-tiered approach was adopted for this. First, areas in greatest need of new‘baseline’ services were identified. These are termed ‘priority areas’. Then, the frameworkwas used to directly evaluate several types of service proposals using computer-basedcatchment analysis.
The four tasks needed to construct and demonstrate the framework are discussed next. It willbe seen that many features of the work are not unique to this project. Patronage predictionusing basic GIS (Geographic Information System) methods has been with us for many years(e.g. Hunt, Still, Carroll and Kruse (1986)). Over time, these methods have becomewidespread and considerably improved with advances in technology and data availability. Forexample, Hsaio (1997) describes a GIS, used to analyse pedestrian access issues, whichaccurately delineates pedestrian catchments in terms of the portions of the street networkwithin 400m walking distance of the closest bus stop. Nevertheless, the present project shouldbe of interest for its use of the State Cadastre as a spatial framework for the analysis, and forthe approach used to estimate the current distribution of population. Sekhar (2000) asserts theaccuracy of population estimates based on the Cadastre, and demonstrates the sizeabledifferences that alternative methods can sometimes produce.
Population – distribution and characteristics
The Cadastre as a framework
The State Digital Map Base (SDMB) Cadastre provided the spatial framework for the project.The Cadastre electronically maps all titled land parcels in Victoria, and can be used to storeinformation about residential and other land-uses. Because the Cadastre is widely used inGovernment, it is well resourced and maintained, and constantly undergoing qualityimprovements and value-adding. The Cadastre provides an ideal framework for spatialanalysis in land-use/transport planning. An excerpt from the Cadastre is shown in Figure 2.
The aim of the first task was to determine the distribution of population. This was achievedindirectly by estimating the number of dwellings in each parcel of the Cadastre. Storing thisinformation in a copy of the Cadastre enabled catchment analysis to be performed with GIStechniques. The main steps in this computer-based process are outlined below.
Aggregate numbers of occupied private dwellings in each CCD
The Census was used to provide numbers of occupied private dwellings (OPDs) in eachCensus Collection District (CCD) in 1996. Quarterly ABS new dwelling approvals, post-Census, were then aggregated and added to the Census figures to give updated estimates,excluding caravans and improvised dwellings, for each CCD.
Figure 2. Excerpt from the SDMB Cadastre showing Parcels of Land
Private dwellings
In the next step, parcels in the Cadastre were ‘prioritised’ according to the likelihood ofcontaining private dwellings. This was done using the State Planning Scheme, telephone1 andpostal2 residential address files and information contained in the Cadastre itself. In thisprocess, it was also possible to estimate the numbers of known or potential dwellings on manymulti-dwelling parcels. Finally, business telephone addresses were used to indicate thoseparcels with a lesser likelihood of containing dwellings. Figure 3 illustrates the type ofcomposite 'picture' resulting when this information is brought together in a GIS.
This process results in each parcel being tagged with one of seven priority ratings, rangingfrom "known to contain dwellings" to "unlikely to contain dwellings", and the estimateddwelling capacity. Figure 4 below provides a simplified illustration of how priority categorieswere assigned.
1 DtMS MARKETING PRO2 The 'Postal Address' file includes known residential addresses and was produced with theassistance of both Australia Post and the Australian Electoral Commission (AEC). The addresses werevalidated as residential and accurate by confirming that they existed in Australia Post's postal address file andwere flagged as having active enrolled voters according to the AEC's residential address database which wasupdated in mid-1999 just prior to Referendum 99.
A Methodology for Evaluating Bus Service Proposals
Geocoded Addresses
Business Telephone AddressResidential Telephone Address
Residential Postal Address
Figure 3. Cadastre overlayed with Planning Scheme and Geocoded Addresses
No dwelling expected
"Known" single dwelling
"Known" multiple dwellings
Most likely to contain dwelling
Least likely to contain dwelling
Figure 4. Priority Categories(estimated numbers of dwellings in each parcel not shown)
McGinley
Non-private dwellings
To the extent possible, businesses operating non-private dwellings were also located on theCadastre using business telephone addresses3 and associated industry classifications (e.g.hostels, guesthouses, B&Bs, etc). These businesses are often associated with large numbers ofnon-private dwellings, which are not comparable with the private dwellings reported in theCensus at the CCD level. Parcels containing such businesses were each arbitrarily assigned asingle private dwelling (e.g. a caretaker), and any available estimates of non-private dwellingnumbers were recorded separately.
Assignment of dwellings
Next, the numbers of OPDs calculated earlier for each CCD were assigned to parcels in thearea. This was achieved by sorting the parcels within each CCD on several keys:� priority rating,� parcel area (5 categories),� percentage of adjacent parcels "known" to be occupied, and� on a random variable
and assigning the estimated number of private dwellings in the CCD to parcels in successiondown the list to the limit of each parcel's estimated capacity. The effect of this process was toassign private dwellings in line with the priorities calculated earlier, but within each prioritycategory to favour smaller parcels over larger ones and to promote a clustered urbandevelopment over a fully random pattern.
Caravans, improvised dwellings and non-private dwellings
The process described above did not include caravans owing to the difficulty in locating thesethrough the address files. Consequently, caravans (estimated from the Census) wereintroduced into the Cadastre in a separate step by allocation to geocoded caravan parks.
In view of their negligible numbers and other factors, no attempt was made to account forimprovised dwellings. Similarly, no attempt was made to estimate the numbers of residents innon-private dwellings. This task was beyond the scope of the project.
Population
The above process resulted in an electronic map of occupied private dwellings and anyidentified non-private dwellings (see example in Figure 5).
In the final step, population was estimated by attributing each private dwelling with theaverage household size for its CCD. Age distribution and employment status were alsoattributed to parcels in the same way.
3 DtMS MARKETING PRO
A Methodology for Evaluating Bus Service Proposals
Private Dwellingsmore than 1 dwelling1 dwellingno dwellings
Figure 5. Estimated Distribution of Private Dwellings(numbers of multiple dwellings not shown)
Trip rates
Aim
The aim of the second task was to determine how demand for bus travel was distributedacross the metropolitan area. The task was approached in two steps. First, a set ofrelationships was derived linking demand (i.e. trip rates) to potential determinants - age,employment, bus frequency, availability of other public transport, time period and residentiallocation. Then, these relationships were applied to the distribution of population in theCadastre yielding the distribution of demand.
Trip rate relationships
To enable patronage levels to be estimated on any existing or proposed route, a set of triprates was required. The term trip rate is used here to denote the number of bus trips expectedto be made in particular circumstances per head of population if a bus service were available.For example, an average of 0.07 bus trips might be expected in the weekday peaks, from eachemployed person, aged 15 to 34, who resides in a bus-only catchment in inner or middlesuburbs.
A category analysis was used to arrive at the trip rate relationships for the metropolitanregion. The main data sources used were the Victorian Activity and Travel Survey (VATS),1994-1998, and the Transport Research Centre’s (TRC’s) integrated public transportroute/timetable files.
McGinley
VATS provided detailed travel data including timing, modes, locations and purpose. It alsoprovided demographic data for all respondents and their households. The TRC's routenetworks enabled catchments to be defined for buses, trams and trains, and the TRC's GIS bustimetables allowed scheduled bus frequencies at any location to be identified.
Using these data sources, all households surveyed in VATS and located inside bus routecatchments were identified. The occupants of these households represent the potential marketfor bus travel. They were categorised by� age group and employment,� combined frequency of accessible bus services,� accessibility to trams and trains, and� residential location in the metropolitan area.
It was also possible to tally the numbers of bus trips made by VATS respondents in eachcategory over different periods of the week. However, because the overall approach is basedon directly predicting those trips using home-based walk access, it was necessary for the triprates also to be based on these trips. Note that final patronage estimates therefore require thetrips predicted using these trip rates to be factored up to reflect a judgement as to theadditional usage of the route.
Once the home-based walk access bus trips were tallied, trip rates were determined for eachcategory by dividing the observed number of trips by the category population.
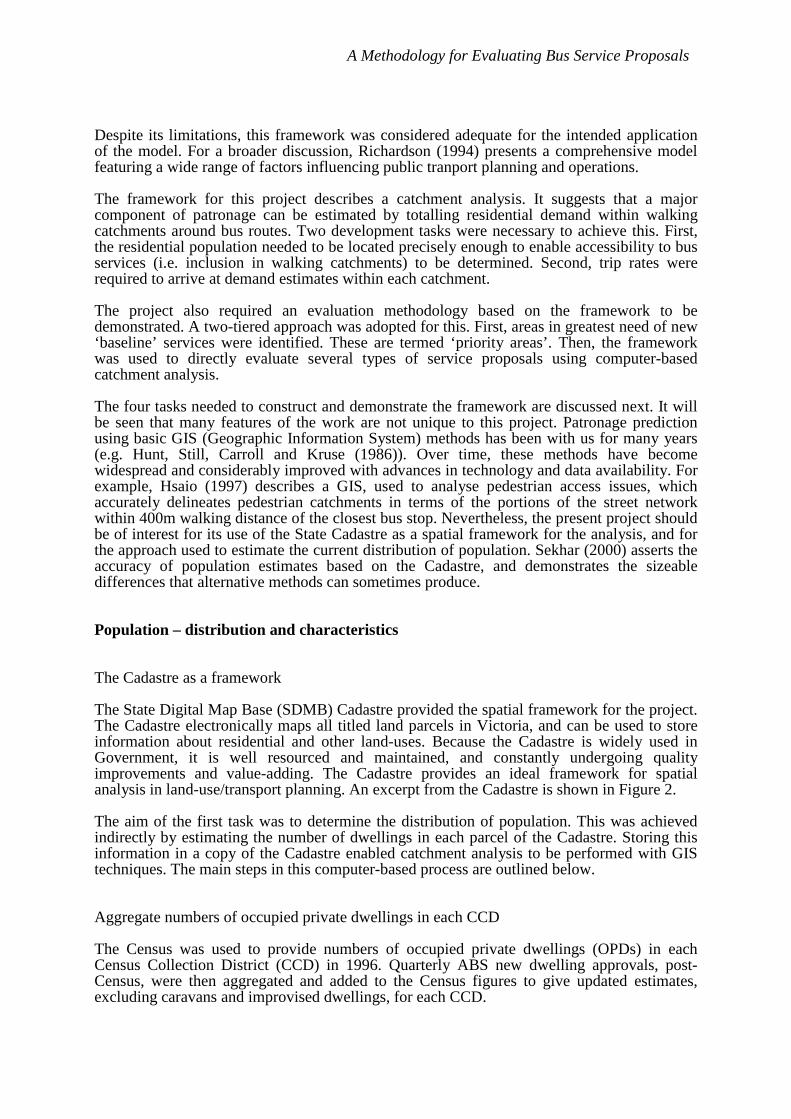
The categories used in the analysis are summarised in Tables 1-4 and Figure 6.
The results of the trip rate analysis are too extensive to reproduce here. However, it is ofinterest to note that a relationship between trip rate and service frequency was not found. Thismay reflect the captive nature of bus markets under conditions generally found in the bussystem. Service frequency was therefore omitted as a classification variable in the trip raterelationships. Similarly, owing to a lack of data in the inner region, inner and middlecategories were combined.
Table 1 Time periods
Period Time PeriodsWeekdays Peaks 7:00 - 9:00
&15:00 - 18:00
Day Off Peak 9:00 - 15:00 Late Off Peak 18:00 - 24:00Saturday 9:00 - 24:00Sunday 10:00 - 23:00
A Methodology for Evaluating Bus Service Proposals
Table 3 Bus frequency
Average HourlyFrequency averaged
across both directions oftravel
More than Up to0 11 22 44 1010 2020 -
Table 4 Public transport catchments
Catchment Type Dwellings within:400mof busroutes
400mof tramroutes
800mof trainstations
Bus Only Yes No No
Bus & Rail Only Yes No Yes
Bus [Rail] & Tram Yes Yes Yes/No
Figure 6. Metropolitan Regions
CCD trip rates
In the second step, trip rates were imputed to residential parcels in the metropolitan Cadastreby reference to CCD demographics, characteristics of the public transport network and theother independent variables.
To do this, trip rate relationships were first established for each CCD using the age/populationdistribution and the known metropolitan region. An example is given in Table 5 below.Storing trip rates in this general form permits their use at a later stage for evaluating serviceproposals.
Finally, to assign the CCD trip rates to occupied parcels within the parent CCD, the trip ratesneeded to be factored by the known parcel occupancy.
Banyule
Bayside
BoroondaraBrimbank
Cardinia
CaseyFrankston
Glen Eira
Greater Dandenong
HobsonsBay
Hume
Knox
ManninghamMaroondah
MeltonMoreland
MorningtonPeninsula
Nillumbik
Port Phillip
Whittlesea
Wyndham
Yarra Ranges
MetropolitanRegions(showing LGAs)
InnerMiddleOuter
McGinley
Table 5 Trip rates for an individual CCD
Catchment Type Weekdays Saturdays SundaysPeaks Off Peak Evening
Bus Only 0.073 0.035 0.009 0.041 0.026Bus & Rail Only 0.029 0.026 0.004 0.031 0.018Bus [Rail] & Tram 0.029 0.020 0.005 0.023 0.060
It is important to note that these trip rates may be used to estimate latent demand in areas notserved by public transport, or alternatively to estimate satisfied demand (i.e. patronage) onexisting routes. Thus, every occupied parcel on the Cadastre was assigned a set of average triprates.
Importantly, the trip rates also enable patronage changes to be estimated when bus servicesare changed.
Priority areas
Aim
In the third task, the framework was used to identify areas where new ‘baseline’ services weremost needed and could feasibly be provided. This step is needed to address any bias in thegeneration of proposals and to ensure that proposals of a suitable standard are developed.
The task involved assessing latent demand in areas without walk access to any form of publictransport, and using this information to identify and prioritise areas of high demand whoseresidents would benefit most from the introduction of new bus services. A two-step approachwas used. In the first step, the problem was solved automatically using latent trip generationrates stored in the parcels of the Cadastre. Then, in the second step, the framework was usedinteractively to review and re-prioritise results bringing a wider range of considerations andexperience to bear. This work should be carried out by experienced operational staff.
System-generated priority areas
Current public transport networks were used in this work. As in the trip rate analysis, 400mroute buffers were generated for buses and trams, and 800m stop buffers for rail stations. Tofacilitate the spatial analysis, demand for land parcels situated outside these catchments wasstored in a ‘pin’ map covering the metropolitan Cadastre.
A 200m grid was then cast over the metropolitan area and the demand measures aggregatedwithin each grid for each of the main day types (i.e. weekdays, Saturdays and Sundays). Thisdata structure provided a fine-grained representation of demand density across Melbourne.
The 200m grid system was then used to calculate demand in larger 800m x 800m cells. Thelarger cells were offset from each other vertically and horizontally at 200m intervals. Ineffect, this system of overlapping 800m cells was achieved by allowing every 200m cell in themetropolitan grid to store demand for a hypothetical 800m cell cast around it.
A Methodology for Evaluating Bus Service Proposals
Although the overall aim was to identify areas where the benefits of providing service wouldbe high, this could not be done without also considering efficiency. Capital is rationed andcosts must be taken into account. For this reason, the 800m cell was used, instead of the 200mcell, as the basic building block for identifying needy areas. 800m represents the full corridorwidth (2 x 400m) served by a bus route. Cells built on this dimension notionally link supplyand demand, and come closer to allowing potential demand per route kilometre to beestimated and compared in different areas. Similarly, the overlapping grid concept wasadopted to improve the route-tracking potential of areas identified in this process.
Using the 800m cells, a simple sorting and labelling process was used to identify and rankregions of sizeable demand for each day type.
First, the 800m grids were sorted in order of descending aggregate demand and the sort order(or ranking) was recorded. These 800m rankings were then assigned to constituent 200m cellsin order of descending priority and without re-assignment until demand levels wereconsidered too low to support a bus route. In this way, individual 200m cells were effectivelyassigned to the highest ranked 800m cells. Next, high demand regions were delineated bylabelling contiguous cells with a common region number representing the ranking of the800m cell with the highest demand in the region. In this step, any parts of the regionsoverlapping public transport walking catchments were deleted.
Finally, the regions were ranked on overall demand density, such that the higher-rankingareas represented a ‘prima facie’ set of priority areas. The average demand density acrosseach region was used in the prioritisation because it approximates the demand per routekilometre that new services in the area might encounter. In addition, the region numberingalso provides a supplementary ranking based on the demand density in the highest-ranking800m cell of each region. Figure 7 illustrates the appearance of several regions.
While it is not possible to show the distribution of the priority areas in this paper, it was foundthat unserved growth areas tended to be identified on weekdays, whereas unserved areas inestablished suburbs came to the fore on weekends.
Bus Catchment
Region
Rail Catchment
Bus Service
Figure 7. Regions of High Demand showing 200m Cells
McGinley
Interactive review of priority areas
To this point, the identification of priority areas was system-driven and could, therefore, stillbenefit from a more broadly based, interactive review involving additional qualitative andquantitative considerations.
The interactive review was carried out using GIS tools to assist the planner to work throughthe priority areas reviewing conditions and altering priorities accordingly. For example,topographic layers were displayed showing accessibility barriers such as freeways, railways,waterways and so on. Similarly, several demographics not considered in the demandcalculations but which have a bearing on demand were made available at the CCD level (e.g.income levels, car ownership, unemployment rates). The Residential Land Release Forecast isalso used to display residential growth occurring or expected in local areas. Otherconsiderations arising in this work include the size and distribution of unserved areas, thedeployment of existing services, contractual constraints, and characteristics of local streetsystems (e.g. penetrability, circuitousness, traffic management measures, etc.).
The procedure requires each priority area to be considered separately. The system then 'zoomsin' on the area and presents various topographical overlays to assist in the assimilation of localinformation. The user is able to review CCD demographics and to examine the distribution ofdemand at the parcel level. Finally, the user is able to record any thoughts relevant to his/herassessment of the area and to adjust the priorities accordingly.
Analysis of proposals
In the final task, the use of the framework for evaluating service proposals was demonstrated.This discussion outlines the process followed using a hypothetical example.
Proposal
The example involves extending several existing Monday – Saturday routes into a growtharea on the city fringes. The existing situation is shown in Figure 8. It can be seen that a largeresidential area to the north of the study area is unserved by public transport and that existingroutes do not provide access to a new retail shopping complex or an existing school. Theproposed service alterations are shown in Figure 9. Route 1 would be extended to providecoverage of the northern area as well as taking over part of Route 2. In addition, both routeswould be extended into the new shopping complex. Approximate annual costs of introducingthese changes would be $140,000 for weekdays and $20,000 for Saturdays.
Functional review
The evaluation framework is proposed as a planning aid rather than as a self-containedmodel. It is intended to be used carefully by experienced planners on account of the manyunderlying assumptions and simplifications.
For this reason, it is important to review the functions that the proposed service changes areexpected to perform early in the analysis and to make a prima-facie case for the proposalgoing ahead. Route designs need to be sensible and to a standard found elsewhere in the bussystem.
A Methodology for Evaluating Bus Service Proposals
Further, just as in the analysis of priority areas, many factors should be reviewed whenapproaching the analysis and interpreting results. Again, the framework can be usedinteractively to do this.
Finally, it was found that articulating the functions performed under a proposal tends to drawthe planner’s mind across a wider range of service planning issues with the possibility that theproposal is adjusted or even abandoned.
Setting up the analysis
Preparing for the analysis requires setting up several files describing routes, catchments anddemand. The process is semi-interactive. Network files (i.e. routes and catchments) used inthe analysis of priority areas are used to describe current conditions. The current files are thencopied and adjusted to represent the network under the various proposals. These files arereferred to as ‘base’ and ‘test’ files, respectively.
The metropolitan demand file, containing trip rates and parcel conditions, is also used. Foreach proposal, an extract of the demand file is made covering the study area. The extract isthen adjusted, using a computer program, to show conditions in each parcel under both ‘base’and ‘test’ cases. Allowance is also made for storing any adjustments made interactively toconditions in the underlying Cadastre (discussed below).
Because the demand file (i.e. the extract) contains the satisfied demand in each parcel under‘base’ and ‘test’ conditions, it can be used directly to estimate patronage gains (or losses) atthe parcel level. For each proposal, these can then be aggregated to yield overall patronagechanges, or allocated to accessible routes and summed within route catchments to yield routepatronage changes. It should be noted that the allocation of parcel demand to competingroutes is based simply on the number of routes accessible from the parcel.
McGinley
Interactive adjustments to parcel conditions
A GIS tool was developed to enable parcel conditions related to occupancy and accessibilityto be adjusted interactively in the demand file. Population adjustments may be needed toupdate the Cadastre for recent or expected growth, or simply to eliminate deficiencies foundin the population estimates. Accessibility adjustments may also be needed to account forreduced patronage in an area due to significant pedestrian barriers (e.g. physical features suchas rivers, railways and freeways, layout of the street system, and so on). This type ofadjustment is particularly useful since buffers, rather than true walking distances, were usedto define public transport catchments in the methodology.
The tool can be used in the following ways:� To enable a planner, inexperienced in GIS, to create scenarios by combining the route,
catchment and demand files discussed above and overlaying relevant planning andtopographical files (eg planning scheme, residential forecast, street network, landmarks).
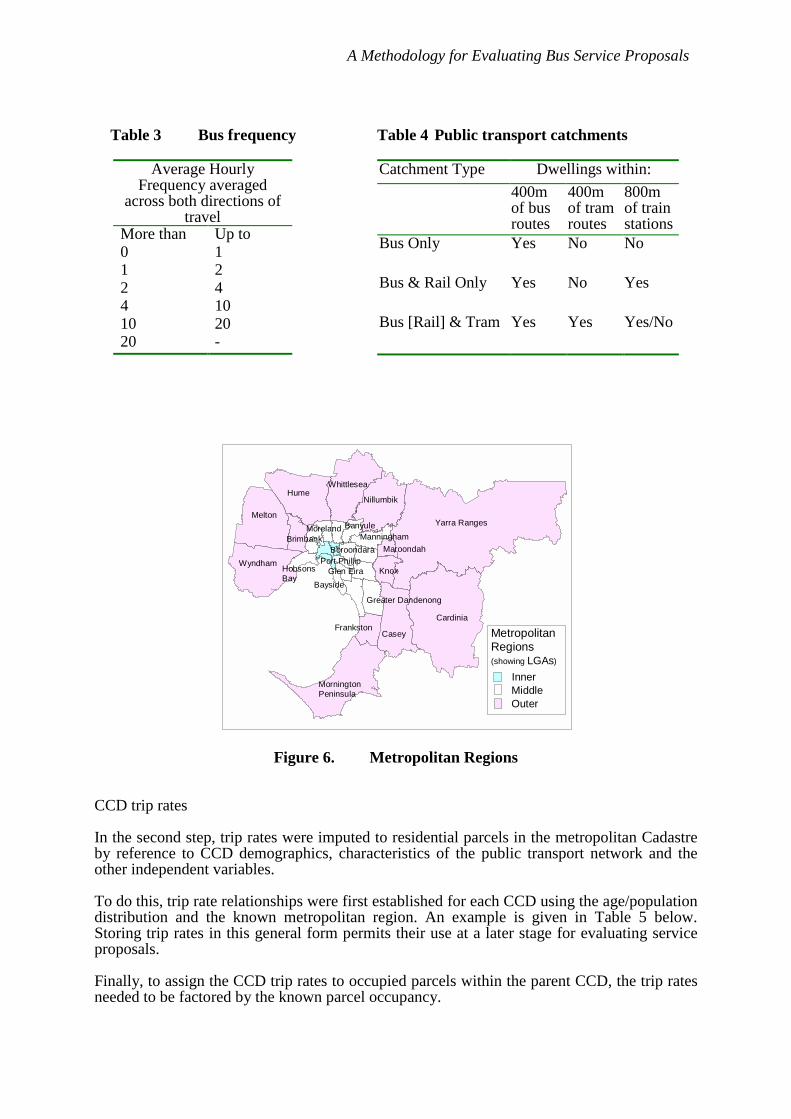
� To manage interactive adjustments on an area-wide basis to parcels in the Cadastre. Theuser is able to select an area and a subset of parcels to be adjusted, and modify thenumbers of dwellings and residents in these parcels as well as parcel access factors.Figure 10 shows the tool being used to increase parcel occupancies in the central parts ofthe study area.
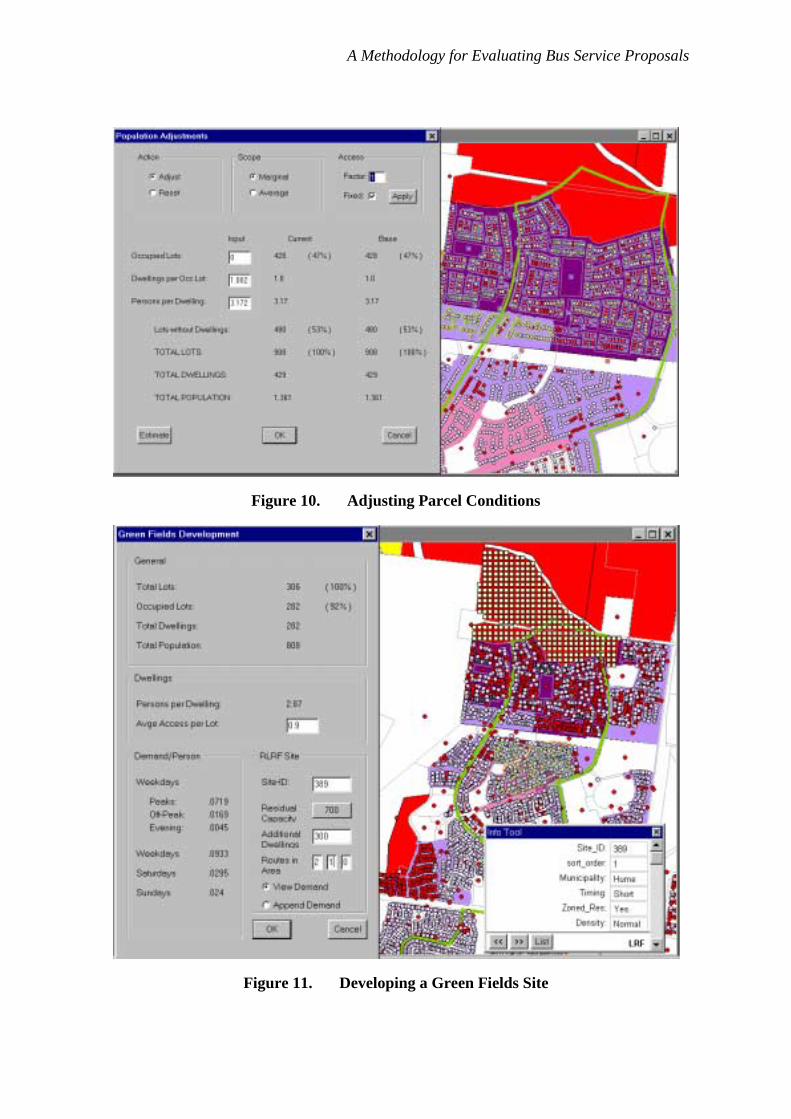
� To ‘develop’ a green fields site identified in the Residential Land Release Forecast(RLRF). The user selects an area with residential characteristics similar to those expectedon the RLRF site. Conditions in the selected area are then summarised for the user toconsider. Next, the user nominates the RLRF site to be developed and the system returnsan estimate of residual residential capacity based on the residential forecast and anydwellings already assigned to the site. The user then decides how many additionaldwellings to introduce. Because there is typically no street system or projected sub-division in the RLRF site, the artificial dwellings are set out by the tool on a uniform gridand assigned the population and demand characteristics of the selected area. Figure 11illustrates how a site, earmarked for short-term development in the northern part of thestudy area, could be ‘populated’ using the tool.
Patronage and revenue estimation
Having estimated changes in satisfied demand for each parcel, it becomes a straightforwardmatter to estimate aggregate patronage changes under a proposal.
This is done by considering parcels in bus catchments before and after a proposal’simplementation (i.e. in ‘base’ and ‘test’ catchments).
First, under ‘base’ case conditions, the process considers each bus route catchment passingthrough the study area, and select any parcels that lose access to buses under the proposal.The residents of such parcels have a service in the ‘base’ case and lose it under the optionbeing examined. The average ‘base’ patronage per route in these parcels is aggregated andrecorded as lost patronage against the route being considered.
Next, the process considers catchments in the study area under proposed ‘test’ conditions andselect only those parcels that acquire access to buses through the proposal. The average ‘test’patronage per route in these parcels is also aggregated and recorded as gained patronageagainst the route under consideration.
Finally, subtracting the losses from the gains yields the net patronage increase for each route.
A Methodology for Evaluating Bus Service Proposals
Figure 10. Adjusting Parcel Conditions
Figure 11. Developing a Green Fields Site
McGinley
It should be noted that any patronage diverted from pre-existing routes to new routes,introduced under a proposal, is not counted in the estimated net patronage change. This isappropriate for evaluating and ranking services but not for estimating patronage per se.
This process also weights the calculated patronage changes by average fare revenue yieldingnet annual revenue changes attributable to the proposal.
Finally, taking into account the annualised cost of implementing each proposal, it is possibleto estimate the subsidy per attracted trip. This subsidy can then be used for ranking alternativeproposals.
Analysis results
Table 6 shows the patronage and revenue results produced for the hypothetical example. Notethat no attempt has been made to account for non home-based walk-access trips for theexample.
The field headings are generally self-explanatory but the reader should recognise that thescope of the outputs is limited by the incremental nature of the analysis. In particular, theresults will often understate a route’s full role because it only deals with residents who,through the proposal, either lose or acquire walk access to buses. These residents account forall patronage changes in the analysis. Hence, Route 2 is not reported in the table because noresidents in its catchments gain or lose access to service as a result of the proposed change.
The analysis procedure could be adjusted to estimate absolute patronage and revenue effects ifdesired. This might be useful for doing capacity checks.
Using this method to compare and select proposals for implementation requires the proposalsto be ranked on cost-effectiveness, which can be measured using the fare subsidy per trip.This is calculated by subtracting annualised proposal costs from annual revenues. Thesummarised ranking results for several alternative proposals are shown in Table 7. Thesuggested ranking and selection process assumes that proposals are independent. If anyproposals are dependent (including any that are mutually exclusive), it will be necessary toconsider the additional complexities. In any event, proposals will be selected to maximise thenumbers of additional bus trips generated for the available government budget.
A Methodology for Evaluating Bus Service Proposals
Table 7 Cost-effectiveness ranking of several proposals
10 Remove - 10,758 -10,758 -7,26816 New 5,336 - 5,336 3,61117 New 41,296 - 41,296 31,40118 New 15,154 - 15,154 10,24220 New 82,172 - 82,172 59,28721 New 65,858 - 65,858 44,52422 New 59 - 59 40
Total 209,875 24,634 185,241 132,423 1,100,000 5.22 3
Before accepting the rankings, the analysis needs to be dissected and interpreted. This mayresult in a proposal being re-formulated to avoid aspects of poor performance. It is alsonecessary to consider whether any benefits or disbenefits, which may have been omitted, needto be given some additional weight (e.g. expected reliability or safety improvements). It isalso particularly important to scrutinise the estimated costs of the proposals. For example,projected passenger loads may need to be estimated so that capacity can be checked, andconsideration given to the likelihood that extra service will be needed in the short term. In thiscase, the results should be revised to reflect foreseen service increases.
Limitations and potential improvements
Trip modelling
Perhaps the greatest weakness in this work stems from the simplified use of trip rates toestimate latent demand and patronage changes. A better alternative would be to use a moreconventional travel demand ‘project’ modelling approach.
McGinley
In such an approach, a strategic transport demand model would conceptually sit above thecadastral framework. It would supply transit passenger flows by trip purpose, on a coarsespatial level, within/between transport zones. These flows would then be partitioned to isolateflows in the catchments under investigation. The Cadastre would also be enhanced to reflectthe distribution of land use, including the main trip attractors, across the metropolitan region;this task is currently underway in the TRC. Finally, the detailed knowledge of trip generatorsand attractors, contained in the Cadastre, would be used to transform the strategic flows intocatchment flows and patronage estimates.
This model would offer the following important advantages over the ‘trip rate’ approach:� theoretically sounder� better resolution of passenger flows along the route and hence, better ability to deal with
capacity and route design issues,� ability to forecast future patronage� better ability to deal with competition between services and with the car� ability to incorporate non-walk access directly.
Catchment definition
At present, the framework uses route "buffers" to represent walking catchments. A betterapproach would be to define stop catchments by using the street network to identify parcelswithin a given maximum walking distance of existing/potential stops. This improvementwould make the method more sensitive to accessibility issues and allow the method to be usedfor evaluating stop placement and residential development proposals.
Access distance as a determinant of trip rates
The present approach does not allow for the trip rate to vary with changes in walk accessdistance. Instead, a constant trip rate is assumed everywhere within the catchment and a zerotrip rate beyond. The problem could be overcome by estimating a decay function from VATSand applying it to the trip rate estimation process.
Household size
The methodology assumes a constant household size across all dwellings in a CCD. Thisassumption could bias results under certain scenarios (e.g. if there were more medium-densitydevelopments nearer arterial roads and, hence, nearer bus routes). This problem could bepartially overcome by linking VATS data to parcels in the Cadastre and using it to estimate acorrespondence between parcel properties and dwelling structures reported in the Census.Then, it would be possible at the CCD level to use the Census tables of "dwelling type againstnumber of occupants" to assign numbers of residents to different parcel types morediscriminately. This approach parallels the use of VATS to estimate trip rates for dwellingswithin a CCD.
A Methodology for Evaluating Bus Service Proposals
Future directions
Extension to non-metropolitan areas
The Cadastral base has been prepared for all of Victoria. This permits the framework to beextended, with minimal additional work, into provincial centres such as Geelong and Ballarat.
It should be noted, however, that the estimated population distributions might not be as goodin provincial centres because address files are less well developed in these areas. Further, inthe short term, it would probably be necessary to rely on trip rates derived from metropolitanVATS data.
Residential land-use base
The methodology relies on being able to locate dwellings on parcels in the Cadastre.Unfortunately, this work is quite time-consuming and involves greater difficulties in rapidlydeveloping areas where, as it happens, the interest in providing new bus services is keenest.
It would be worthwhile attempting to seek out and gain access to better sources ofinformation on residential development (e.g. through water or power billing information,council rates notices). It should be noted, however, that privacy and commercialconsiderations are barriers in this area. Fortunately, the quality of the data sources used in thisproject is improving constantly.
Extension of methodology to trams
Subject to suitable trip rates being estimated, the technique is directly applicable to trams. Itcould be used to examine tram extensions, stop locations and so on.
Service Planning Guidelines and Performance Measurement
The framework could be used to quantify indicators used in planning and performancemonitoring that rely on population measurement. These include criteria for the provision ofpublic transport and for setting acceptable levels of service.
Conclusions
A methodology for evaluating and ranking of bus service proposals has been developed. Theapproach is GIS-based and makes use of a variety of electronic data sets only recentlyavailable for service and infrastructure planning.
The approach makes innovative use of the State Cadastre to conveniently store population andland-use information with a high level of spatial precision. This approach is ideal for manytypes of catchment analyses and could spawn spin-off applications in other sectors.
The methodology provides a short-range planning tool of a type that is useful for achievinggreater effectiveness for this highly flexible and adaptive mode.
McGinley
The new methodology promises to deliver the following benefits:
� A method for identifying areas in greatest need of basic services.� A responsive and easily understood technique for evaluating new service proposals.� A uniform basis for ranking proposals and handling competing internal and external
priorities.� A basis for responding to the proponents of new services, who compete for limited
Government funds.
Disclaimer
The opinions and conclusions expressed in this paper are those of the author and notnecessarily those of the Victorian Department of Infrastructure.
Acknowledgments
The author acknowledges the support given to this project by the Victorian Department ofInfrastructure.
References
Hsaio, S (1997) Using GIS for transit pedestrian access analysis Presented at the 1997Transportation Research Board Annual Meeting Paper #970157, 1-17
Hunt, D T Still, S E Carroll, J D and Kruse, A O (1986) A geodemographic model for busservice planning and marketing Transportation Research Record 1051, 1-12
Richardson, A J (1994) Operator and customer trade-offs in public transport route design, pp603-622 of Papers of the 19th Australasian Transport Research Forum 19 (2) Lorne: ATRF
Sekhar, S V C (2000) Transit route catchment area analysis using GIS, 22nd Conference ofAustralian Institutes of Transport Research, Ursula College, ANU Campus, Canberra, 1-7