A GLOBAL INVESTOR’S PERSPECTIVE THE POTENTIAL FOR QUANT IN THE CHINA A-SHARE MARKET January 2020 By Ben Dunn, CFA Chief Investment Officer, Quantitative Strategies Jie Lu, PhD, CFA Portfolio Manager, Quantitative Equity Strategies
Transcript
A GLOBAL INVESTOR’S PERSPECTIVE
THE POTENTIAL FOR QUANT IN THE CHINA A-SHARE MARKET
January 2020
By Ben Dunn, CFAChief Investment Officer, Quantitative Strategies
Jie Lu, PhD, CFAPortfolio Manager, Quantitative Equity Strategies
Quant in China / 2
As the China A-share market becomes more accessible to offshore investors, and with global index providers increasing the
weight of China A stocks in regional and global indices, the option for global or regional investors to treat China as a rounding error in their benchmarks is fast disappearing. The size (and growth) of the Chinese market and the fact that it has relatively low correlation with other global markets add further compulsion for global investors.
In this paper, we take an objective look at the China A-share market, and with reference to other global markets where quantitative strategies have been prevalent for decades, and attempt to assess the viability and potential challenges of deploying quantitative strategies in China’s local market.
Our overall assessment is that the China A-share market has many of the ideal characteristics in which quantitative strategies should flourish. It is a liquid market, with relatively low transaction costs, a broad and diverse universe of stocks and high return dispersion. All ingredients that bode well for active strategies. Data (a prerequisite for quantitative strategies) is bountiful and a moderate amount of history – though less than other more developed markets – is available for backtesting strategies. There are however clear signs of different investor behaviours as well as structural nuances that must be considered and respected by quantitative investors.
This paper is not intended to be an exhaustive analysis of the market dynamics, nor is it a statement of any permanent structure to the market – in fact, one of our core conclusions is to expect China’s market dynamics to change and this should be factored into any systematic strategy for the Chinese market.
FOREWORD
Quant in China / 3
HISTORY AND SIZE OF THE CHINA A-SHARE MARKET---------------The Chinese domestic stock market has a history
spanning over 30 years. China launched the
Shanghai Stock Exchange in 1990, after public
company shares were first issued in 1984. Since
then the market has grown rapidly both in terms of
the number of listed stocks and aggregate market
capitalisation (cap). Figure 1 shows the number of
stocks listed on the Shanghai and Shenzhen stock
exchanges (1a) and the total market capitalisation of
all listed securities (1b).
As at 31 October 2019, the total market cap
of the China A-share market, spanning across the
Shanghai and Shenzhen Stock Exchanges was CNY
55.1 trillion (USD 7.8 trillion) and consisted of almost
4000 listed companies. This is approximately the
equivalent size of the Hong Kong listed H-shares
and US listed ADRs. See Figure 2.
TIMELINE OF MARKET REFORMS---------------Since the launch of the Shanghai Stock Exchange,
China’s regulators have undertaken numerous
measures to improve the depth and accessibility of
China’s stock markets.
It has been the Chinese government’s long-term
goal to open up China’s capital markets to foreign
investors. As a result, China’s stock market has
undergone multiple stages of reforms.
The reforms first started with the creation of
B-shares, which allowed foreign investors to invest
in USD. With the development of H-shares (listed in
Hong Kong) and the Qualified Foreign Institutional
Investors (QFII) programme, the popularity of
B-shares soon faded. Today there are only around
100 B-share stocks listed on the Shanghai and
Shenzhen exchanges.
The QFII scheme was launched in 2002 and
became a major channel for foreign investors to
invest in the A-share market. Under QFII, foreign
institutional investors go through a lengthy
application process and are permitted to invest
within a fixed quota upon approval.
THE POTENTIAL FOR QUANT IN THE CHINA A-SHARE MARKET
China market milestones
December 1990 – Shanghai Stock Exchange
started operations.
July 1991 – Shenzhen Stock Exchange started
operations.
October 1992 – China Securities Regulatory
Commission (CSRC) was established.
November 2002 – Temporary regulations for
Qualified Foreign Institutional Investor (QFII)
was published. This was China’s first attempt
to open its stock market to foreign investors.
October 2009 – Growth Enterprise Board was
launched.
December 2011 – Renminbi Qualified Foreign
Institutional Investor (RQFII) scheme was
established.
November 2014 - Shanghai-HongKong
Connect started operations.
December 2016 - Shenzhen-HongKong
Connect started operations.
June 2019 - Shanghai-London Connect
started operations.
June 2019 - Science and Technology Board
was launched.
Quant in China / 4
Fig.1a. Number of stocks listed on Chinese local stock exchanges1
Fig. 1b. Total market capitalisation of stocks listed on China local stock exchanges1
Fig. 2. Number of listings and total market cap of A, H–shares and Chinese ADRs2
2000
Shanghai + Shenzhen stock exchanges
4000
3000
2000
1000
0
Nu
mb
er o
f Li
sted
Sec
uri
ties
2005 2010 2015 2020
Shanghai + Shenzhen stock exchanges
60
40
20
0
Tota
l Mar
ket
Cap
(C
NY
Tr
illio
n)
2000 2005 2010 2015 2020
Number of ListingsMarket Cap (CNY trillion)
Market Cap (USD trillion)
China A-Shares(Shanghai/Shenzhen Listed)
3,694 55.1 7.8
China H-Shares(Hong Kong Listed)
1,364 29.0 4.1
Chinese ADRs (US Listed) 316 23.3 3.3
1Eastspring Investments, Refinitiv (Datastream), 31 October 2019. 2Eastspring Investments, Refinitiv (Datastream), Axioma 31 October 2019.
Quant in China / 5
The Renminbi Qualified Foreign Instituitional
Investor (RQFII) scheme, established in 2011, is an
initiative which allows foreign investors with a RQFII
quota to invest directly in China’s bond and equity
markets. At the end of 2018, the quotas for QFII and
RQFII stood at USD 101 billion and RMB 656 billion
respectively. The limits were removed in September
2019.
Around the same time, China launched the
Qualified Domestic Institutional Investors (QDII)
scheme which allowed domestic investors to invest
in foreign markets. The quota for QDII stood at USD
103 billion as at the end of 2018, comparable to that
of QFII.
However, the QFII and QDII programmes only
allowed one-way investments and are two separate
approval channels. On the other hand, the Shanghai-
Hong Kong Stock Connect, launched in 2014, was a
cross-border scheme which connected the Shanghai
and Hong Kong stock markets.
Together with the Shenzhen-Hong Kong Stock
Connect (launched in 2016), these two schemes
became the major channels for foreign investors
to invest in A-shares (Northbound), and domestic
investors to invest in the Hong Kong market
(Southbound). Over the period from January-October
2019, the trading volume of Northbound investors
contributed to almost 8% of the A-share market’s
average daily stock turnover, while Southbound
investors contributed to about 15% of the Hong
Kong market’s average daily stock turnover.
All of these efforts have gradually paved the way
for Chinese A-shares to be included by major index
providers in their indexes.
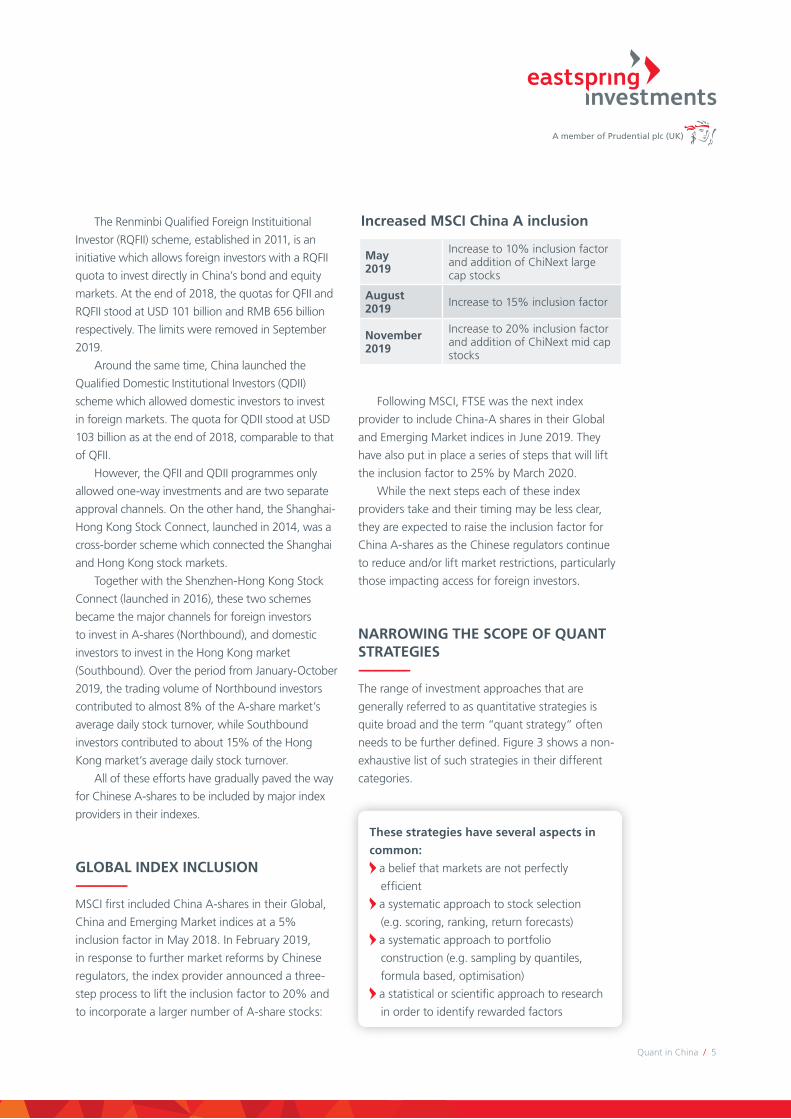
GLOBAL INDEX INCLUSION---------------MSCI first included China A-shares in their Global,
China and Emerging Market indices at a 5%
inclusion factor in May 2018. In February 2019,
in response to further market reforms by Chinese
regulators, the index provider announced a three-
step process to lift the inclusion factor to 20% and
to incorporate a larger number of A-share stocks:
Following MSCI, FTSE was the next index
provider to include China-A shares in their Global
and Emerging Market indices in June 2019. They
have also put in place a series of steps that will lift
the inclusion factor to 25% by March 2020.
While the next steps each of these index
providers take and their timing may be less clear,
they are expected to raise the inclusion factor for
China A-shares as the Chinese regulators continue
to reduce and/or lift market restrictions, particularly
those impacting access for foreign investors.
NARROWING THE SCOPE OF QUANT STRATEGIES---------------The range of investment approaches that are
generally referred to as quantitative strategies is
quite broad and the term “quant strategy” often
needs to be further defined. Figure 3 shows a non-
exhaustive list of such strategies in their different
categories.
May 2019
Increase to 10% inclusion factor and addition of ChiNext large cap stocks
August 2019 Increase to 15% inclusion factor
November 2019
Increase to 20% inclusion factor and addition of ChiNext mid cap stocks
Increased MSCI China A inclusion
These strategies have several aspects in
common:
a belief that markets are not perfectly
efficient
a systematic approach to stock selection
(e.g. scoring, ranking, return forecasts)
a systematic approach to portfolio
construction (e.g. sampling by quantiles,
formula based, optimisation)
a statistical or scientific approach to research
in order to identify rewarded factors
Quant in China / 6
The observations and assessments made in this
paper are done in the context of stock selection-
based strategies which fall into the “Active Quant/
Factor Investing” and “Smart Beta” categories in
Figure 3. They will however have some relevance to
other quantitative strategies as well.
COMPARABLE UNIVERSES---------------In this paper, a series of comparative statistics is
evaluated to give context to the Chinese market
relative to other global markets and regions.
For China, the largest 800 stocks (by free float
market cap) is used to represent China A-shares
(large and mid-cap stocks). This is a proxy for the CSI
800 index, which is commonly used within China to
represent large and mid-cap A-share stocks.
A comparable universe for several other markets
and regions is formed from the members of the
standard MSCI indices as these are widely used to
represent large and mid-cap stocks within each
market/region.
Developed Markets MSCI World
Emerging Markets MSCI Emerging Markets
Asia Pacific ex JapanMSCI AC Asia Pacific ex Japan
US MSCI USA
Japan MSCI Japan
Hong Kong MSCI Hong Kong
DATA---------------Quantitative strategies are highly dependent on
data to support the necessary research to identify
factors and to run backtest studies to validate
the strategies. Ideally the data should be broad
in coverage, reliable, accurate and have as long a
history as possible. The following sections provide
a high-level assessment of the data landscape for
Chinese stocks.
Data CoverageWhile quantitative strategies can benefit from many
types of data, there are a few key datasets that
are used to form many typical quantitative factors,
including:
market data (e.g. prices, volumes, corporate
actions etc.)
financial statement data (income statement,
balance sheet and cashflow statement)
sell-side analyst estimates and
recommendations
Fig. 3. Illustrative list of investment strategies considered as quantitative strategies (non-exhaustive)
Active Quant / Factor Investing Smart Beta
Active Multi Factor
Enhanced Index
Value
Momentum
Cheap access to factors
Size
Quality
Relative return focus
Long/short
CTA
Uncorrelated returns
Event Driven
Statistical Arbitrage
Hedge Funds / Liquid Alts
Alternate Objective Custom Solutions
Specific tilts or exposures
Incorporating client preferences
Thematic
Custom ESG objectives
Not simply return focused
Big Data
Deep learning/Neural Nets
Al/machine learning approaches
Data Driven Strategies
Low Volatility
High Yield
Risk Parity
Volatility Targeting
For this data to be useful in forming typical
quantitative factors, it must have broad coverage
across the full spectrum of listed stocks. Global
datasets have relatively good coverage for the
China-A universe as shown in Figure 4.
Quant in China / 7
Fig. 4. Percentage of securities with coverage in Datastream, Worldscope and IBES3
Fig. 5. Largest 800 China A-shares; percentage of securities with coverage4
3Eastspring Investments, MSCI, Refinitiv, 31 October 2019. 4Eastspring Investments, Refinitiv, 31 October 2019. Coverage in Datastream is based on market capitalisation; Worldscope based on available historical financials data, and IBES based on avaialbe EPS forecast data.
Quant in China / 8
Figure 5 shows that the historical coverage
is also relatively robust for the largest 800 China
A-shares.
This coverage, particularly for analyst estimate
data, can be further improved by accessing local
Chinese datasets. Well-known local data vendor,
Wind, has >85% coverage for CSI 800 constituents
(as at 30 August 2019).
Incorporating both global and local datasets has
the additional advantage of capturing data from
different brokers. Local datasets will have a better
coverage of domestic brokers. Global datasets on
the other hand will have additional coverage from
non-Chinese brokers who do not have onshore
presence.
Breadth of Data SourcesData quality is always a key consideration for
any dataset. Ideally, there should be competing
products covering similar data. This not only allows
comparison and cross validation of datasets, it also
ensures that data vendors are incentivised (through
competition) to validate their data and ensure high
data quality.
The presence of several large global data
vendors with coverage of the China-A market (e.g.
Refinitiv, Factset, Bloomberg, S&P) alongside local
vendors (e.g. Wind) bodes well for the long-term
quality of Chinese market data and the ability to
cross validate data points across multiple vendors.
Data HistoryOne of the core research elements in forming
quantitative strategies is estimating the
performance (and other characteristics) of factors
and strategies over as long a history as possible.
Longer histories allow the analyst to assess the
implications of a factor or strategy’s behaviour in
different market environments, different phases of
the business cycle and in the presence of different
macro shocks and events.
The Chinese stock market is relatively young
with relatively few listings in its early history,
however the number and size of listings have
grown rapidly over the past decade. Figure 6
shows the number of stocks and their total market
cap within China’s A-share market since 1997.
There is arguably sufficient breadth in terms
of the number of shares, even back to 1997.
However, the market’s low capitalisation up until
the second half of 2000s suggests that any market
observations prior to then are not likely to be
representative of the current market makeup or
dynamics.
While a longer history and the ability to span
multiple periods of varied market conditions
would be preferable, the China A-share market’s
12-year history is sufficient for researching and
forming a quantitative strategy. Nevertheless, it
would be prudent to re-evaluate findings with the
passage of time. There is a need to be watchful for
changes in market conditions and structural factors
(e.g. increased foreign ownership and increased
institutional ownership) that may not have been
well represented in the earlier data.
IDEAL MARKET DYNAMICS FOR QUANT STRATEGIES---------------The ideal market characteristics for a quantitative
stock-selection strategy include:
The following sections provide a high-level
assessment of the characteristics of the Chinese
market in comparison with other global markets.
Investable Universe BreadthCross-sectional stock selection models are formed
by comparing stocks on selected factors against their
peers at each point in history. In factor construction,
a higher number of available stocks provides more
Broad investable universe
Sufficient liquidity
Low direct trading costs
Low indirect trading costs (market impact)
Diverse stock and sector representation
High cross-sectional return dispersion
Moderate volatility
Quant in China / 9
options to refine the peer comparison.
In a narrow market, for example, it may only
be possible to compare against all the stocks in the
market. In a broad market, however, the ability to
compare against more homogenous peer groups (i.e.
within sector, industry or even sub-industry) can enrich
factor definitions.
A wider number of stocks also ensures a more
reliable and robust estimation of factor returns and
other aspects of factor behaviour.
In implementing a factor-based strategy, the
greater the number of stocks available, the more
diversified portfolios can be – thus gaining exposure
to the desired factors while minimising idiosyncratic
(stock specific) effects. This ability to have more
diversified portfolios also plays a key role in the
scalability in terms of strategy capacity for a factor-
based strategy.
As highlighted earlier in Figure 6, the China
A-share market today is very broad with almost
4,000 stocks listed on the local exchanges. While
market breadth was narrower in the earlier years,
as should be expected in a relatively young stock
market, there is ample breadth relative to other
global markets where quantitative strategies have
been effectively employed.
Of course, the stocks need to be of sufficient
liquidity to allow implementation at reasonable
levels of assets under management. To assess this,
we assume an average daily value traded (ADVT) of
USD 25m. A portfolio manager with a fund size of
USD 500m would be able to trade a 1% position
in a single day while only accounting for 20% of
the total (average) daily volume. This is a proxy for
a tradeable size that does not adversely impact the
market price.
Figure 7 shows the historical number of stocks
listed in China (red) and globally (grey) with at least
USD 25m of average daily value traded. About half
of all global stocks that have this level of liquidity
can be found in the China A-share market. In fact,
there are over 2,400 stocks in China at the end of
October 2019 that meet this condition.
Market LiquidityThe previous assessment of market breadth
considered a minimum level of liquidity at the
individual stock level. However, it is also important
to assess how much liquidity there is in aggregate
across a typical investible universe.
Figure 6: Number and market cap of stocks listed on Chinese local stock exchanges5
2000
Shanghai + Shenzhen stock exchanges
3000
2000
1000
0
Nu
mb
er o
f Li
sted
Se
curi
ties
2005 2010 2015 2020
60
40
20
0Tota
l mar
ket
reca
p
(CN
Y t
rilli
on
)
2007~ (12+ years)
2010
6000
4000
2000
Num
ber
of s
tock
s
2015
Stocks with 20-day average daily volume > USD25m (Nov 2009 to Oct 2019)
2020
Figure 7: Number of stocks listed on Chinese local stock exchanges and globally6
0
5Eastspring Investments, Refinitiv, 31 October 2019. 6Eastspring Investments, MSCI, Refinitiv, 31 October 2019.
China A Global
Quant in China / 10
Figure 8 shows the total value traded as a
proportion of free float market cap (turnover) for
the 800 largest China A-share stocks compared to
other global markets and regions over a 12-month
period to October 2019.
The turnover of the Chinese market is
significantly higher than the other global
markets and regions. This is good news from the
perspective of being able to effectively implement
quantitative strategies. However, it also reflects
a very different set of investor behaviours in the
China A-share market.
As later exhibits will show, retail investors in
China hold a much higher proportion of shares
(and ultimately trading activity) compared to
other markets. The tendency for these investors
to actively trade their shares drives pronounced
market inefficiencies that must be acknowledged
and potentially exploited.
Direct Trading CostsIn addition to the ability to access sufficient
liquidity, the costs of trading are a critical
consideration in any strategy. This includes both
direct costs (from broker commissions, exchange
fees, trade-based taxes etc.) as well as the indirect
costs arising from the bid/ask spread of stocks and
market impact.
Figure 9 shows the round-trip (buy + sell) fixed
costs from trading USD 1m worth of stocks in the
China A-share market versus US, Hong Kong and
Japan. A commission rate of 0.10% is assumed for
all four markets.
For the China A-share market, the trading costs
for a domestic investor in China versus the costs for
an offshore investor investing through the Stock
Connect platform are also shown.
The direct transaction costs for the China
A-share market at 0.31% (onshore investor) to
0.32% (offshore investor) are cheaper than for
Hong Kong (0.42%) or Japan (0.40%), although
the costs are more expensive than for the US
(0.20%).
Fig. 8. Proportion of free float market cap traded in the 1-year period7
China A Top 800
An
nu
al t
rad
ed v
alu
e /
free
mar
ket
cap
Nov 2018 to Oct 2019
MSCI USA
MSCI DM
MSCI EM
MSCI AC APXJ
MSCI JP MSCI HK
357%
183% 169%141%
114% 103%71%
7Eastspring Investments, MSCI, Refinitiv, 31 October 2019
Indirect Trading CostsIn addition to fixed costs, any implemented
strategy will incur (and should be compensated
for) indirect trading costs. This includes crossing
the bid-ask spread and the impact on market
prices as a result of the orders from the strategy.
Figure 10 shows the median bid-ask spread
(as a percentage of the closing stock price) for the
800 largest China A stocks relative to other global
markets and regions.
The spreads in the China A-share market are
narrow, particularly relative to its Emerging market
and Asian peers. This will help lower the indirect
cost of implementing quantitative strategies in the
China A -share market.
Our earlier observations suggest there is
ample liquidity in the China A-share market and
the impact of trading is expected to be minimal
at moderate asset (AUM) levels. While we have
not explicitly considered the likely market impact
of large AUM levels, it is not expected to be a
major hinderance for quantitative strategies with
a moderate turnover, given the liquidity of the
China A-share market relative to the other global
markets.
Quant in China / 11
Fig. 9. Fixed costs for a USD 1m trade round trip (buy + sell)8
Fig. 10. Median bid-ask spread (as a proportion of the closing mid-price)9
US (NYSE/NASDAQ)
Fixe
d t
rad
ing
co
sts
(tw
o d
ays)
Assumes 0.10% commission
0.20%
A-Shares (Onshore)
A-Shares (Offshore)
Hong Kong Japan (TSE)
0.31% 0.32%
0.42% 0.40%
MSCI USA
Med
ian
bid
-ask
sp
read
As at Oct 2019
MSCI DM
China A Top 800
MSCI HK
MSCI EM
MSCI AC APXJ
MSCI JP
0.02%0.06%
0.10%
0.16% 0.16% 0.18%0.22%
8ITG (May 2019). 9Eastspring Investments, MSCI, Refinitiv, 31 October 2019. 9Eastspring Investments, MSCI, Refinitiv, 31 October 2019.
Quant in China / 12
Diverse Stock and Sector RepresentationMarket concentration in a small number of stocks
or in a specific industry or sector is sub-optimal
for a stock-selection based quantitative strategy.
Particularly for a long-only strategy that aims to be
relative sector neutral and with moderate relative
stock positions, dominant stocks and sectors will
tie up large proportions of the fund’s capital in
matching index weights.
Figure 11 shows the breakdown (proportion of
market cap) by decile of market cap for the largest
800 China A stocks against USA, Japan and Hong
Kong. The first bar in each facet represents the
proportion of total market cap accounted for by
10% of the stocks with the largest market cap.
While the China A-share market is highly
concentrated in this first decile (80 largest stocks),
the concentration is similar in scale to that of MSCI
USA. Beyond the first decile, the concentration is
much more moderate – even more so than for the
US.
On the sector front, the China A-share market
enjoys broad diversity. Figure 12 shows the
breakdown of market cap by GICS sector (level
1). Financials are a large proportion of the overall
market cap (at almost 30%), but all other sectors
have meaningful contribution beyond that.
By comparison, the sector breakdown in China
appears more diverse than the rest of Asia and
the US. Figure 13 shows the same market cap
breakdown by GICS sector for MSCI Asia Pacific ex
Japan, USA, Japan and Hong Kong.
Not only does the China A-share market have
broad sector diversity, this diversity has remained
fairly stable. Figure 14 shows the same market cap
breakdown by GICS sector for the 800 largest China
A-shares since December 2010. The market’s broad
and stable sector diversity would be very useful
when assessing any factor or strategy backtesting
results over this period.
Cross-sectional Return DispersionA cross-sectional stock selection strategy that aims
to separate winners and losers is dependent on
stock prices varying from each other in each period.
The wider the spread of returns in each period, the
more opportunity there is for a quantitative strategy
(or an active investor) to be rewarded for its stock
selection ability.
Fig. 11. Proportion of market cap in each decile (ranked by descending market cap)10
40%
Wei
gh
t in
Dec
ile
China A Top 800
20%
0%
Market Cap Decile
MSCI USA
MSCI Japan MSCI Hong Kong
40%
20%
0%Wei
gh
t in
Dec
ile
10Eastspring Investments, MSCI, Refinitiv, 31 October 2019
Quant in China / 13
Fig. 12. Breakdown of total market cap by GICS sector for the largest 800 China A-shares11
Fig.13. Breakdown of total market cap by GICS sector for the largest 800 China A-shares11
Fig. 14. Breakdown of total market cap by GICS sector for the largest 800 China A-shares13
As at Oct 2019
50
20
10
0
Sect
or
wei
gh
t (%
)
30
40
20
10
0
30
40
MSCI AC Asia Pac x Japan MSCI USA MSCI Japan MSCI Hong Kong
Unclassified
Energy
Materials
Industrials
Consumer Discretionary
Consumer Staples
Health Care
Financials
Information Technology
Telecommunication Services
Utilities
Real Estate
2012
60
40
20Sect
or
wei
gh
t (%
)
China A Top 800: Dec 2010 to Oct 2019
0
80
100
2014 2016 2018 2020
Energy
Industrials
Cons Staples
Financials
Info Tech
11Eastspring Investments, MSCI, Refinitiv, 31 October 2019. 12Eastspring Investments, MSCI, Refinitiv, 31 October 2019. 13Eastspring Investments, MSCI, Refinitiv, 31 October 2019.
Quant in China / 14
Figure 15 shows the time series of the cross-
sectional return dispersion for the largest 800 China
A stocks (measured as the standard deviation of
stock returns within each month). Over the 10-year
period to October 2019, the monthly average of
the cross-sectional standard deviation of returns is
13.9% with the return dispersion significantly higher
in some periods.
By comparison, figure 16 shows that the spread
of returns in the China A-share market is consistently
higher than that of the developed and emerging
markets where the average cross-sectional standard
deviation over the same period was 7.0% and 8.7%
respectively.
Market VolatilityHigh cross-sectional volatility is ideal for active
quantitative strategies, but for a long-only strategy,
the volatility of the overall market also needs to be
considered. The China A-share market is known for
being more volatile.
Figure 17 shows the rolling 250-day (1-year)
volatility for both the CSI 800 index and the MSCI
USA index. The average volatility for the CSI 800
index over the 10 years to October 2019 was
22.7%, significantly higher than the MSCI USA’s
average volatility of 14.6%.
On the other hand, the average volatility of
the CSI 800 index appears relatively similar to that
of the emerging markets (which have a moderate
weighting in China A shares since 2014) at 20.8%.
See figure 18. Both markets however exhibited
heightened volatility over different periods.
In 2011-2012, the emerging markets experienced
heightened volatility as investors feared contagion
from the European debt crisis and slowing global
growth. This did little to dampen Chinese investor
sentiment as the domestic economy appeared
resilient.
In 2015-2016, it was the China A-share market’s
turn for a bumpy ride. The market rallied strongly
on the back of accommodative macro policies and
supportive regulatory changes. The Chinese central
bank had eased its monetary policy and President
Xi Jinping had just announced the “One-Belt-One-
Road” initiative. A sharp rise in margin lending
fuelled a frenzied rally in the Chinese stock market
– at one point, retail investors were permitted to
open up to 20 brokerage accounts. Meanwhile,
investor sentiment was riding high on expectations
that MSCI was going to include A-shares into their
major index for the first time. The rally peaked in the
middle of June 2015, triggered by MSCI’s rejection
and the Chinese regulator’s clamp down on margin
lending. The over-heated A-share market started its
meltdown before it bottomed out in 2016.
More recently, the increase in volatility in China
A-shares on the back of the US-China trade dispute
has not spilled over (entirely) into the broader
emerging markets.
RELEVANT INVESTOR DEMOGRAPHICS---------------Markets and changes in underlying asset prices are
ultimately driven by the actions of investors as they
digest all available information, assess the relative
attractiveness of alternate investment opportunities
and then ultimately transact on those assessments.
There are many participants in the markets,
ranging from individual retail investors to asset
management firms, hedge funds and institutional
Fig. 15. Monthly cross-sectional standard deviation of returns for largest 800 China A-shares14
40%
Cro
ss s
ecti
on
al
(sta
nd
ard
dev
iati
on
)20%
0%
China A Top 800: Nov 2009 to Oct 2019
60%
2010 2015 2020
14Eastspring Investments, Refinitiv, 31 October 2019.
Quant in China / 15
Fig. 17. Rolling 250-day index return volatility for CSI 800 compared with MSCI USA16
Fig. 18. Rolling 250-day index return volatility for CSI 800 compared with MSCI Emerging Markets17
China A Top 800 vs MSCI US: Nov 2009 to Oct 2019
40%
30%
20%
10%250-
Day
Vo
lati
lity
2010 2015 2020
CSI 800 MSCI USA
0%
China A Top 800 vs MSCI EM: Nov 2009 to Oct 2019
40%
30%
10%
250-
Day
Vo
lati
lity
2010 2015 2020
CSI 800 Emerging Market USA
0%
Fig. 16. Monthly cross-sectional standard deviation of returns for largest 800 China A-shares versus MSCI World and MSCI Emerging Markets indices15
China A Top 800 vs MSCI World (developed markets) and MSCI EM: Nov 2009 to Oct 2019
60%
40%
20%
0%
Cro
ss s
ecti
on
al(s
tan
dar
d d
evia
tio
n)
2010 2015 2020China A Top 800 MSCI World MSCI Emerging Market
15Eastspring Investments, MSCI, Refinitiv, 31 October 2019. 16Eastspring Investments, Bloomberg, CSI, MSCI, 31 October 2019. 17Eastspring Investments, Bloomberg, CSI, MSCI, 31 October 2019.
Quant in China / 16
asset owners such as pension funds, insurance
companies and government agencies. Ultimately
the efficiency of markets is largely determined by
the proportion of shareholdings and trading activity
represented by the more sophisticated investors.
The ideal setting for a quantitative investor is a
market where there are observable and persistent
market inefficiencies fuelled by the actions of less
sophisticated investors.
Institutional OwnershipAsset owners and experienced asset managers tend
to have established and disciplined approaches
to their investment decisions, taking care not
to fall victim to their own behavioural biases or
get caught up in unjustified surges in sentiment.
However less sophisticated investors tend to lack the
discipline and experience to mitigate many of these
behavioural biases. This ultimately results in more
prevalent market inefficiencies that can be identified
and exploited by systematic or quantitative
investment strategies.
Figure 19 shows the proportion of stocks held
by institutions within the CSI 800 index versus
global markets and regions. Institutional investors
(as defined by Bloomberg) own about 50% of
the China A-share market. This is moderate when
compared to the other regional markets, however, it
is significantly lower relative to the US (86.5%) and
Europe (62.7%).
This suggests that less sophisticated investors
own the other half of the China A-share market
which supports the hypothesis that the China
A-share market has ample inefficiencies to be
exploited. While we do not have the available data,
anecdotally, retail investors appear to drive an even
larger proportion of trading activity. This seems
consistent with the outsized turnover levels in China
(see figure 8), the wide dispersion of cross-sectional
returns (Figures 15 and 16) and high volatility (see
figures 17 and 18).
STOCK PRICE DRIVERS---------------In a quantitative strategy based on cross-sectional
stock selection, the goal is to isolate relative winners
and losers based on quantitative factors and to build
diversified exposure to those factors in managed
portfolios. However, the factors pursued by a
quantitative strategy are not the only factors that
will influence the subsequent returns of stocks.
Fig. 19. Proportion of stocks owned by institutions in various markets18
Pro
po
rtio
n o
f sh
ares
ow
ned
by
inst
itu
tio
ns
As at 30 August 2019
44.1%
MSCI Asia ex Japan
MSCI Emerging Market
MSCI World (Developed market)
CSI 800 MSCI Japan
MSCI Europe
MSCI USA
45.4% 46.3%50.8%
54.9%62.7%
86.5%
18Eastspring Investments, Bloomberg, CSI, MSCI, 30 August 2019.
Quant in China / 17
Many of these unintended influences can be
managed quite effectively in a portfolio through
risk management. For example, one can offset the
sector risk arising from overweighting one stock by
underweighting another stock in the same sector.
However, there are other exogenous factors that
can ultimately drive stock prices including global
macro influences (e.g. commodity prices, interest
rates, changes in the market’s inflation expectations)
or sensitivity to the broader moves of global equity
markets.
The following analysis makes use of the Citi Risk
Attribute Model (RAM) to estimate the contribution
to the risk of stocks in China (compared to other
regions) from macro factor sensitivity, global market
sensitivity, sector (and country for regions) sensitivity
and other style factors. The residual estimated risk
is an idiosyncratic element (i.e. not explained by the
RAM model).
The ideal situation for a stock selection strategy
is to have these risk factors explain as little as
possible of the overall volatility of stock prices.
This leaves ample opportunity for additional stock
attribute-based (quant) factors to be identified
that help explain variations in stock prices and can
therefore be systematically exposed to in portfolios.
Figure 20 shows that the average contribution
(over the 10 years to April 2019) to total risk for a
portfolio of the largest 800 China A-shares from
macro factors is significantly less than in other
regions. This implies that global macro influences
including global bond yields, credit spreads,
commodity prices and currencies only explain a
small proportion of China A stock price variation.
In addition, the movements in the broader
global equity market account for a much smaller
proportion of China A stock price variation than it
does in other regions (including Japan). Style factor
risk, which includes factors such as Value, Growth,
and Size (small cap) explains a small part of the
remaining risk.
Figure 21 breaks out the average idiosyncratic
(unexplained by the RAM model) portion of total
estimated risk. The introduction of China specific
macro factors would likely account for added
explanation of risk, but the same could be argued
for Japan. On balance this suggests that the variance
in China A-share stock price returns is less driven by
macro effects – an ideal situation for a quantitative
stock selection strategy.
Fig. 20. Average contributions to estimated risk from the Citi Risk Attribution Model (RAM)19
May 2009 to Apr 2019
100%
80%
60%
Pro
po
rtio
n o
f R
isk
Esti
mat
ed
CSI 800
20%
40%
0%
MSCI USA MSCI Japan MSCI World
Style
Sector(+Country)
Market
Macro
Idiosyncratic
19Eastspring Investments, Citi, CSI, MSCI, 30 April 2019.
Quant in China / 18
OTHER MARKET STRUCTURE CONSIDERATIONS---------------There are various other considerations for investors
in China’s A-share market and we highlight a few of
the key ones in this section.
Hedging InstrumentsThe ability for investors to hedge market risk is more
limited in the Chinese market than in many other
markets.
While domestic investors in China have access
to the relatively liquid SSE 50, CSI 300, and CSI 500
futures contracts, the options for foreign investors
are more limited. Two relatively new contracts
available to foreign investors are a CSI 300 futures
contract traded on the Hong Kong Exchange and
a FTSE A50 contract traded on the Singapore
Exchange (SGX). While the latter is more liquid and
has more open interest, the FTSE A50 index is a
narrow large cap index that is not as suitable as a
hedge for an investor managing against an MSCI or
CSI 300/800 index.
Meanwhile, European options are only available
for the FTSE A50 and CSI 300 ETFs, with the latter
only added in December 2019.
Index Level Short SellingDue to the limited number of stocks permitted to
be short sold and high shorting costs, index futures
are currently the major hedging instrument for
the China A-share market. However, for domestic
investors, there are further complications that make
this option slightly challenging.
For one, the margin requirements are much
higher (8% in the China A-share market) than in
most other markets. By comparison, the margin
requirements for the FTSE China A50 futures
and E-mini S&P 500 futures are 5.6% and 4%
respectively.
The Chinese regulators had restricted the trading
of index futures during the stock market crash in
2015. While the restrictions have been gradually
relaxed, trading volumes have not returned to the
levels seen before 2015.
The general trend in recent years has been
towards increasing trading volume/open interest and
gradually lowering margin requirements. Although
we expect this trend to continue, the possibility of
tighter restrictions during extreme market events
cannot be ruled out.
Stock Level Short SellingStock level shorting is allowed in the China A-share
market for approved stocks only. The number of
approved stocks was recently increased from 950
to 1,600 in August 2019, causing the total market
cap weight of stocks that can be short sold to rise to
over 80% from 70%. However, in practice, the total
amount of shorting is still small.
According to Eastmoney, as of December 2019,
the total margin balance for short positions is RMB
10 billion, whereas the margin balance for long
positions is RMB 542 billion.
Borrowing costs for shorting positions is
around 9%-10% p.a., and is usually 3% above the
prevailing the benchmark interest rate for loans.
This is considerably higher than the borrowing costs
in other major markets and presents a significant
hurdle for effectively implementing a long-short
strategy in China A-shares.
Fig. 21. Average residual (unexplained) proportion of estimated risk from Citi Risk Attribution Model (RAM)20
Average idiosyncratic contribution: May 2009 to Oct 2019
Pro
po
rtio
n o
f u
nat
trib
ute
d r
isk
CSI 800 MSCI USA MSCI Japan MSCI World
9.8%
0.9%
2.9%
0.6%
20Eastspring Investments, Citi, CSI, MSCI, 30 April 2019.
Quant in China / 19
Asymmetric Two-Way Trading RulesCurrently, the A-share market adopts an asymmetric
trading rule whereby shares bought cannot be sold
on the same day. However, the cash raised from
selling a stock can be used to buy the same stock
on the same day. As such, investors can sell shares
on the market open and buy the same stock as the
trading session progresses during the day.
This restriction creates a bias in trading activity
for short-term investors, resulting in unique market
anomalies.
Settlement Periods – Stock ConnectSecurity settlement for China A-share trading is on
a T+1 basis, for both dometsic investors in China
or investors trading through the Stock Connect
(Northbound).
PERFORMANCE OF COMMON QUANT FACTORS---------------The earlier sections of this paper have given
consideration to the characteristics of the China
A-share market and the likely implications for
quantitative strategies.
The following section attempts to get a sense of
whether a typical quant approach that has worked
well in other global markets would capture similar
results in the Chinese market. This is not a fully-
researched investment strategy but rather a quick
assessment of the efficacy of some common quant
Fig. 22. Universe of stocks at each date in the factor backtest analysis
factors used by quantitative investors globally. Results
are compared for the Chinese A-share market against
other global markets and regions over the 10-year
period to March 2019. Figure 22 details the universe
of stocks considered for each of these backtests by
market/region.
In this simplified analysis, the factors used are
relatively basic and involve a single metric used to rank
stocks cross-sectionally at each monthly rebalance in
the backtest period.
At each rebalance point, a long factor portfolio is
formed from quintile 1 (the highest factor scores) and
a short factor portfolio is formed from quintile 5 (the
lowest factor scores). The long and short quintiles are
Country Universe
China A-SharesAll listed securities (Datastream)
USS&P Broad Market Index (US companies)
World (Developed Markets)
S&P Broad Market Index (Developed countries)
Asia Pacific ex JapanS&P Broad Market Index (Asia Pacific ex Japan countries)
Japan S&P Broad Market Index (Japan companies)
Fig. 23. Factor definitions and data sources used
Factor Underlying Metric Definition Data Source
Price/Book Closing Market Cap / Last Reported Book Value Datastream (Market Cap) Worldscope (Book Value)
Price/Earnings Closing Market Cap / Trailing 12m Net Income Datastream (Market Cap) Worldscope (Net Income)
Earnings Revisions (3m) % change in consensus EPS vs 3-months prior IBES (consensus EPS estimates)
Europe 0.5% 3.9% 0.1 -2.4% 2.9% -0.8 2.9% 5.8% 0.5
Japan 0.7% 5.2% 0.1 -1.9% 4.5% -0.4 2.6% 9.0% 0.3
Asia Pacific ex Japan -0.5% 4.3% -0.1 -1.6% 3.4% -0.5 1.1% 7.3% 0.2
Reversal: Minus (1-Month Return)
Disclaimer
This document is produced by Eastspring Investments (Singapore) Limited and issued in:
Singapore and Australia (for wholesale clients only) by Eastspring Investments (Singapore) Limited (UEN: 199407631H), which is incorporated in Singapore, is exempt from the requirement to hold an Australian financial services licence and is licensed and regulated by the Monetary Authority of Singapore under Singapore laws which differ from Australian laws.
Hong Kong by Eastspring Investments (Hong Kong) Limited and has not been reviewed by the Securities and Futures Commission of Hong Kong.
Thailand by TMB Asset Management Co. Ltd. Investments contain certain risks; investors are advised to carefully study the related information before investing. The past performance of any fund is not indicative of future performance.
Indonesia by PT Eastspring Investments Indonesia, an investment manager that is licensed, registered and supervised by the Indonesia Financial Services Authority (OJK).
Malaysia by Eastspring Investments Berhad (531241-U).
United States of America (for institutional clients only) by Eastspring Investments (Singapore) Limited (UEN: 199407631H), which is incorporated in Singapore and is registered with the U.S Securities and Exchange Commission as a registered investment adviser.
European Economic Area (for professional clients only) and Switzerland (for qualified investors only) by Eastspring Investments (Luxembourg) S.A., 26, Boulevard Royal, 2449 Luxembourg, Grand-Duchy of Luxembourg, registered with the Registre de Commerce et des Sociétés (Luxembourg), Register No B 173737.
United Kingdom (for professional clients only) by Eastspring Investments (Luxembourg) S.A. - UK Branch, 10 Lower Thames Street, London, EC3R 6AF.
Chile (for institutional clients only) by Eastspring Investments (Singapore) Limited (UEN: 199407631H), which is incorporated in Singapore and is licensed and regulated by the Monetary Authority of Singapore under Singapore laws which differ from Chilean laws.
The afore-mentioned entities are hereinafter collectively referred to as Eastspring Investments.
The views and opinions contained herein are those of the author on this page, and may not necessarily represent views expressed or reflected in other Eastspring Investments’ communications. This document is solely for information purposes and does not have any regard to the specific investment objective, financial situation and/or particular needs of any specific persons who may receive this document. This document is not intended as an offer, a solicitation of offer or a recommendation, to deal in shares of securities or any financial instruments. It may not be published, circulated, reproduced or distributed without the prior written consent of Eastspring Investments. Reliance upon information in this posting is at the sole discretion of the reader. Please consult your own professional adviser before investing.
Investment involves risk. Past performance and the predictions, projections, or forecasts on the economy, securities markets or the economic trends of the markets are not necessarily indicative of the future or likely performance of Eastspring Investments or any of the funds managed by Eastspring Investments.
Information herein is believed to be reliable at time of publication. Data from third party sources may have been used in the preparation of this material and Eastspring Investments has not independently verified, validated or audited such data. Where lawfully permitted, Eastspring Investments does not warrant its completeness or accuracy and is not responsible for error of facts or opinion nor shall be liable for damages arising out of any person’s reliance upon this information. Any opinion or estimate contained in this document may subject to change without notice.
Eastspring Singapore is an ultimately wholly-owned subsidiary of Prudential plc of the United Kingdom. Eastspring Singapore and Prudential plc are not affiliated in any manner with Prudential Financial, Inc., a company whose principal place of business is in the United States of America or with the Prudential Assurance Company, a subsidiary of M&G plc, a company incorporated in the United Kingdom.
Bangkok | Chicago | Ho Chi Minh City | Hong Kong | Jakarta | Kuala Lumpur | London | Luxembourg | Mumbai | Seoul | Shanghai | Singapore | Taipei | Tokyo