A Graph Summarization Methods and Applications: A Survey YIKE LIU, University of Michigan, Ann Arbor TARA SAFAVI, University of Michigan, Ann Arbor ABHILASH DIGHE, University of Michigan, Ann Arbor DANAI KOUTRA, University of Michigan, Ann Arbor While advances in computing resources have made processing enormous amounts of data possible, human ability to identify patterns in such data has not scaled accordingly. Efficient computational methods for condensing and simplifying data are thus becoming vital for extracting actionable insights. In particular, while data summarization techniques have been studied extensively, only recently has summarizing interconnected data, or graphs, become popular. This survey is a structured, comprehensive overview of the state-of-the-art methods for summarizing graph data. We first broach the motivation behind, and the challenges of, graph summarization. We then categorize summarization approaches by the type of graphs taken as input and further organize each category by core methodology. Finally, we discuss applications of summarization on real-world graphs and conclude by describing some open problems in the field. 1. INTRODUCTION As technology advances, the amount of data that we generate and our ability to collect and archive such data both increase continuously. Daily activities like social media interaction, web browsing, product and service purchases, itineraries, and wellness sensors generate large amounts of data, the analysis of which can immediately impact our lives. This abundance of generated data and its velocity call for data summarization, one of the main data mining tasks. Since summarization facilitates the identification of structure and meaning in data, the data mining community has taken a strong interest in the task. Methods for a variety of data types have been proposed: sequence data and events [Casas-Garriga 2005], itemsets and association rules [Liu et al. 1999; Yan et al. 2005; Ordonez et al. 2006; Mampaey et al. 2011], spatial data [Lin et al. 2003], transactions and multi-modal databases [Wang and Karypis 2004; Chandola and Kumar 2005; Shneiderman 2008; Xiang et al. 2010], data streams and time series [Cormode and Muthukrishnan 2005b; Palpanas et al. 2008], video and surveillance data [Pan et al. 2004; Damnjanovic et al. 2008], and activity on social networks [Lin et al. 2008; Mehmood et al. 2013]. This survey focuses on the summarization of interconnected data, otherwise known as graphs or networks, a problem in graph mining with connections to relational data management and visualization. Graphs are ubiquitous, representing a variety of natural processes as diverse as friendships between people, communication patterns, and interactions between neurons in the brain. Formally, a plain graph or network is an abstract data type consisting of a finite set of vertices (nodes) V and a set of links (edges) E . The latter represent interactions between pairs of vertices. A graph is often represented by its adjacency matrix A, which can be binary, corresponding to whether there exists an interaction between two vertices, or numerical, corresponding to the strength of the connection. We will refer to a graph with numerical or categorical labels (attributes or annotations) for its nodes or edges as a labeled graph. A network that changes over time is called dynamic or time-evolving and is often described by a series of adjacency matrices, one per timestamp. Examples of graphs are social networks, traffic networks, computer networks, phone call or messaging networks, location check- in networks, protein-protein interaction networks, user-product review or purchase networks, functional or structural brain connectomes, and more. The benefits of graph summarization include: arXiv:1612.04883v3 [cs.IR] 16 Jan 2018
Transcript
A
Graph Summarization Methods and Applications: A Survey
YIKE LIU, University of Michigan, Ann ArborTARA SAFAVI, University of Michigan, Ann ArborABHILASH DIGHE, University of Michigan, Ann ArborDANAI KOUTRA, University of Michigan, Ann Arbor
While advances in computing resources have made processing enormous amounts of data possible, humanability to identify patterns in such data has not scaled accordingly. Efficient computational methods forcondensing and simplifying data are thus becoming vital for extracting actionable insights. In particular, whiledata summarization techniques have been studied extensively, only recently has summarizing interconnecteddata, or graphs, become popular. This survey is a structured, comprehensive overview of the state-of-the-artmethods for summarizing graph data. We first broach the motivation behind, and the challenges of, graphsummarization. We then categorize summarization approaches by the type of graphs taken as input andfurther organize each category by core methodology. Finally, we discuss applications of summarization onreal-world graphs and conclude by describing some open problems in the field.
1. INTRODUCTIONAs technology advances, the amount of data that we generate and our ability to collectand archive such data both increase continuously. Daily activities like social mediainteraction, web browsing, product and service purchases, itineraries, and wellnesssensors generate large amounts of data, the analysis of which can immediately impactour lives. This abundance of generated data and its velocity call for data summarization,one of the main data mining tasks.
Since summarization facilitates the identification of structure and meaning in data,the data mining community has taken a strong interest in the task. Methods for avariety of data types have been proposed: sequence data and events [Casas-Garriga2005], itemsets and association rules [Liu et al. 1999; Yan et al. 2005; Ordonez et al.2006; Mampaey et al. 2011], spatial data [Lin et al. 2003], transactions and multi-modaldatabases [Wang and Karypis 2004; Chandola and Kumar 2005; Shneiderman 2008;Xiang et al. 2010], data streams and time series [Cormode and Muthukrishnan 2005b;Palpanas et al. 2008], video and surveillance data [Pan et al. 2004; Damnjanovic et al.2008], and activity on social networks [Lin et al. 2008; Mehmood et al. 2013].
This survey focuses on the summarization of interconnected data, otherwise knownas graphs or networks, a problem in graph mining with connections to relationaldata management and visualization. Graphs are ubiquitous, representing a variety ofnatural processes as diverse as friendships between people, communication patterns,and interactions between neurons in the brain. Formally, a plain graph or network isan abstract data type consisting of a finite set of vertices (nodes) V and a set of links(edges) E . The latter represent interactions between pairs of vertices. A graph is oftenrepresented by its adjacency matrix A, which can be binary, corresponding to whetherthere exists an interaction between two vertices, or numerical, corresponding to thestrength of the connection. We will refer to a graph with numerical or categorical labels(attributes or annotations) for its nodes or edges as a labeled graph. A network thatchanges over time is called dynamic or time-evolving and is often described by a seriesof adjacency matrices, one per timestamp. Examples of graphs are social networks,traffic networks, computer networks, phone call or messaging networks, location check-in networks, protein-protein interaction networks, user-product review or purchasenetworks, functional or structural brain connectomes, and more.
The benefits of graph summarization include:
arX
iv:1
612.
0488
3v3
[cs
.IR
] 1
6 Ja
n 20
18
A:2 Y. Liu, T. Safavi, A. Dighe and D. Koutra
— Reduction of data volume and storage. Graphs of real-world datasets are often massive.For example, as of August 2017 the Facebook social network had 2 billion users,and more than 100 billion emails were exchanged daily. Summarization techniquesproduce small summaries that require significantly less storage space than theiroriginal counterparts. Graph summarization techniques can decrease the numberof I/O operations, reduce communication volume between clusters in a distributedsetting, allow loading the summary graph into memory, and facilitate the use of graphvisualization tools while avoiding the “hairball” visualization problem.
— Speedup of graph algorithms and queries. While a plethora of graph analysis meth-ods exist, many cannot efficiently handle large graphs. Summarization techniquesproduce smaller graphs that maintain the most salient information from the originalgraph. The resultant summary graph can be queried, analyzed, and understood moreefficiently with existing tools and algorithms.
— Interactive analysis support. As the systems side makes advancements in interactivegraph analysis, summarization is introduced to handle information extraction andspeed up user analysis. The resultant graph summaries make it possible to visualizedatasets that are originally too large to load into memory.
— Noise elimination. Real graph data are frequently large-scale and considerably noisywith many hidden, unobserved, or erroneous links and labels. Such noise hindersanalysis by increasing the workload of data processing and hiding the more “important”information. Summarization serves to filter out noise and reveal patterns in the data.Given its advantages, graph summarization has extensive applications, including
clustering [Cilibrasi and Vitanyi 2005], classification [ van Leeuwen et al. 2006], com-munity detection [Chakrabarti et al. 2004], outlier detection [Smets and Vreeken 2011;Akoglu et al. 2012], pattern set mining [Vreeken et al. 2011], finding sources of infectionin large graphs [Prakash et al. 2012], and more.
The problem of graph summarization has been studied algorithmically in the fieldsof graph mining and data management, while interactive exploration of the data andappropriate display layouts have been studied in visualization. In this survey, we reviewgraph summarization mostly from a methodological perspective, answering how wecan algorithmically obtain summaries of graph data. We also give pointers to visualanalytics platforms that can consume algorithmic outputs and explore display options.
1.1. ChallengesOverall, the notion of a graph summary is not well-defined. A summary is application-dependent and can be defined with respect to various goals: it can preserve specificstructural patterns, focus on some network entities, preserve the answers to graphqueries, or maintain the distributions of graph properties. Overall, graph summariza-tion has five main challenges:
(1) Data volume. The main target of graph summarization is to reduce the size of theinput graph data so that other analyses can be performed efficiently. At the sametime, though, summarization techniques are themselves faced with the challenge ofprocessing large amounts of data. The requirement of efficiency often steers theirdesign toward techniques that scale well with the size of the input graph. Table Ipoints to methods that are linear on the size of the input.
(2) Complexity of data. Graph operations often cannot be easily partitioned and paral-lelized because of the many interactions between entities, as well as the complexityof entities themselves. Furthermore, the heterogeneity of nodes and edges contin-ues to increase in real networks. Accordingly, incorporating side information fromheterogeneous sources (text, images, etc.) may require highly detailed design andquantification in algorithms. For example, in social networks, users can chat orshare with each other, follow or friend each other, and a single user profile alonecontains a great deal of information. Finally, real datasets often contain noise or
Graph Summarization Methods and Applications: A Survey A:3
missing information, which may interfere with the pattern mining process. newSec-tions 3 and 4 review methods for attributed and dynamic networks, which tend tobe more complex than methods for plain networks.
(3) Definition of interestingness. Summarization involves extracting of important orinteresting information. However, the definition of “interesting” is itself subjective,usually requiring both domain knowledge and user preferences. Moreover, thecutoff between “interesting” and “uninteresting” can be difficult to determine ina principled way; usually it is decided by considering the tradeoffs between time,space, and information preserved in the summary, as well as the complexity ofmapping solutions obtained from the summary back onto the original nodes andedges. Each presented graph summarization technique uses different optimizationformulations to define the interestingness of a summary.
(4) Evaluation. Evaluation of summarization outputs depends on the application do-main. From the database perspective, a summary is good if it efficiently supportsboth global and local queries with high accuracy. In the context of summarizing com-munity information, either community preservation is maximized or reconstructionerror is minimized. Compression-based techniques seek to minimize the number ofbits needed to describe the input graph, or else the number of nodes/edges or thenormalized number of bits per edge. Furthermore, evaluations become more complexwhen more elements, such as visualization and multi-resolution summaries, areinvolved. In these cases, user studies and qualitative criteria may be employed.
(5) Change over time. Ideally, graph summaries should evolve over time, since realdata are usually dynamic. For instance, social network activity, brain functions, andemail communications—all naturally represented as graphs—change with time.How to incorporate the dynamic nature of such data in computation and performanalysis efficiently becomes an essential question. Section 4 reviews methods thattreat dynamic graphs as a sequence of static snapshots or streams.
As demonstrated by these challenges, graph summarization is a difficult and multi-faceted problem.
1.2. Types of Graph SummariesIn this survey, we categorize graph summarization methods based on the type of datahandled and the core techniques employed. Below we give the main types of graphsummaries. Table I provides detailed information for each approach.• Input: Static or Dynamic. Most summarization methods operate on static net-
works, leveraging graph structure (links) and, if available, the node/edge attributes.Despite the prevalence of large dynamic networks, only recent research efforts addresstheir efficient summarization. In some cases, static methods are adapted to handledynamic networks seen as series of static snapshots. In other cases, new methods forgraph streams are devised. In this survey, we first categorize summarization methodsbased on their input type (Figure 1).• Input: Homogeneous or Heterogeneous. The most well-studied instance in
graph summarization, and graph mining more generally, is the homogeneous graphwith one entity and one link type. However, some approaches apply to heterogeneousgraphs by treating various types of nodes (e.g., students, instructors) and relationsbetween them (e.g., teacher, friends, classmates) differently. These methods tend to bemore complex, but also more expressive.• Core Technique. Across the literature, graph summarization methods employ a
set of core techniques:— Grouping- or aggregation-based: This is the most popular technique. Some
node-grouping methods recursively aggregate nodes into “supernodes” based on anapplication-dependent optimization function, which can be based on structure and/orattributes. Others employ existing clustering techniques and map each densely-
A:4 Y. Liu, T. Safavi, A. Dighe and D. Koutra
connected cluster to a supernode. Edge-grouping methods aggregate edges intocompressor or virtual nodes.
— Bit compression-based: This approach, a common technique in data summarization,minimizes the number of bits needed to describe the input graph via its summary.Some methods are lossless and can perfectly reconstruct the original graph from thesummary. Others are lossy, compromising recovery accuracy for space savings.
— Simplification- or sparsification-based: These methods streamline an inputgraph by removing less “important” nodes or edges, resulting in a sparsified graph.
— Influence-based: These approaches aim to discover a high-level description of theinfluence propagation in large-scale graphs. Techniques in this category formulatethe summarization problem as an optimization process in which some quantityrelated to information influence is maintained.
•Output: Summary Type. The output of a summarization approach can be: (i) a su-pergraph, which consists of supernodes or collections of original nodes, and superedgesbetween them; (ii) a sparsified graph, which has fewer nodes and/or edges than theoriginal network; or (iii) a list of (static or temporal) structures or influence propaga-tions, which are seen independently instead of in the form of a single summary graph.Moreover, the summary can be: (a) flat, with nodes simply grouped into supernodes, or(b) hierarchical, with multiple levels of abstraction.• Output: Non-overlapping or Overlapping Nodes. In its simplest form, a sum-
mary is non-overlapping: each original node belongs only to one summary element (e.g.,supernode, subgraph). Overlapping summaries, where a node may belong to multipleelements, can capture complex inherent data relationships, but may also complicateintepretation and visualization.• Main Objective. The key objectives of graph summarization include query effi-
ciency and approximate computations, compression and data size reduction, static ortemporal pattern discovery, visualization and interactive large-scale visual analytics,influence analysis and understanding, entity resolution, and privacy preservation.
1.3. Differences from Prior SurveysPrevious work on surveying the graph summarization literature is scarce. You et al.[2013] present some summarization algorithms for static graphs, focusing mostly ongrouping- and compression-based methods. The tutorial by Lin et al. [2013] providesmore specific categorization and descriptions of ongoing work, but again only addressesstatic graph summarization. By contrast, we review a wide set of proposed method-ologies for both static and dynamic graph summarization. Specifically, in this survey:
(1) We create a taxonomy (Figure 1) on the three main instances of the graph summa-rization problem: for plain static graphs (Section 2), for static graphs with additionalside information or labels (Section 3), and for (plain) graphs that evolve over time(Section 4). Within each instance of the problem, we present key algorithmic ideasand methodologies used to solve it.
(2) We highlight methodological properties that are useful to researchers and practi-tioners, such as input/output data types and end goal (for example, compression vs.visualization), and present them concisely in Table I.
(3) We give connections between methods of graph summarization and related fieldsthat, while not directly supporting graph summarization, have potential in summa-rization tasks. These fields include compression, sparsification, and clustering andcommunity detection.
(4) We review real-world applications of graph summarization and identify open prob-lems and opportunities for future research (Sections 5 and 6).
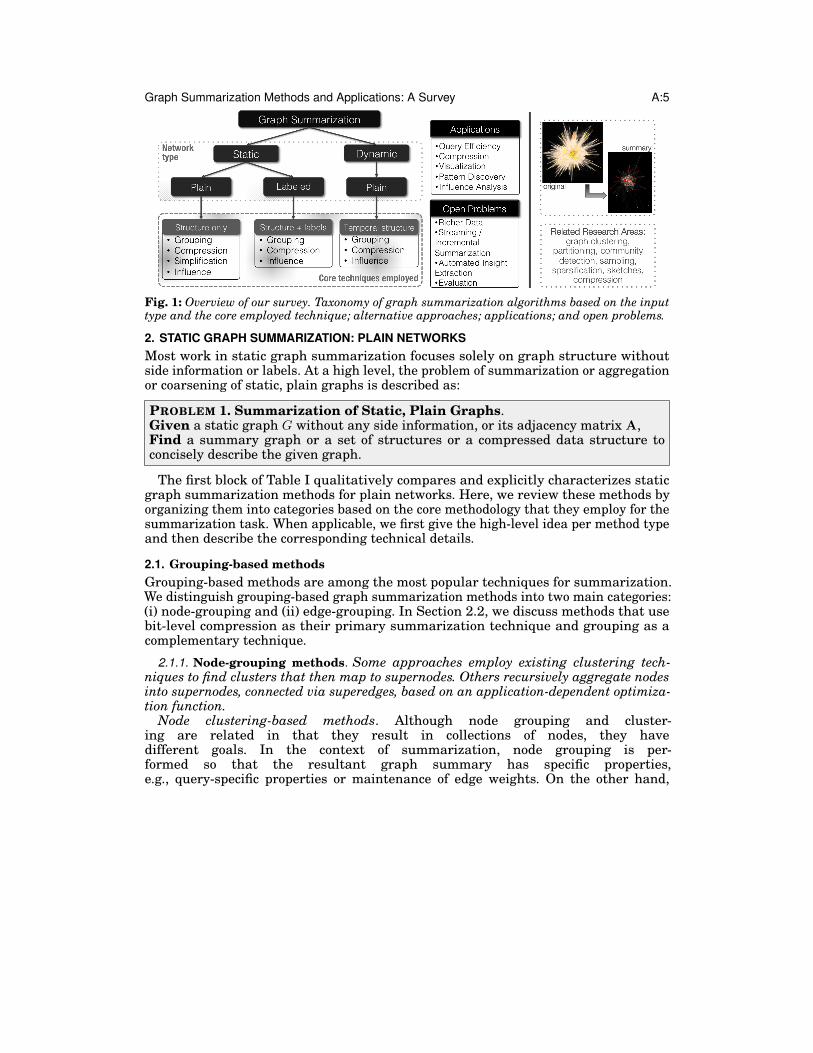
Graph Summarization Methods and Applications: A Survey A:5
Fig. 1: Overview of our survey. Taxonomy of graph summarization algorithms based on the inputtype and the core employed technique; alternative approaches; applications; and open problems.
2. STATIC GRAPH SUMMARIZATION: PLAIN NETWORKSMost work in static graph summarization focuses solely on graph structure withoutside information or labels. At a high level, the problem of summarization or aggregationor coarsening of static, plain graphs is described as:
PROBLEM 1. Summarization of Static, Plain Graphs.Given a static graph G without any side information, or its adjacency matrix A,Find a summary graph or a set of structures or a compressed data structure toconcisely describe the given graph.
The first block of Table I qualitatively compares and explicitly characterizes staticgraph summarization methods for plain networks. Here, we review these methods byorganizing them into categories based on the core methodology that they employ for thesummarization task. When applicable, we first give the high-level idea per method typeand then describe the corresponding technical details.
2.1. Grouping-based methodsGrouping-based methods are among the most popular techniques for summarization.We distinguish grouping-based graph summarization methods into two main categories:(i) node-grouping and (ii) edge-grouping. In Section 2.2, we discuss methods that usebit-level compression as their primary summarization technique and grouping as acomplementary technique.
2.1.1. Node-grouping methods. Some approaches employ existing clustering tech-niques to find clusters that then map to supernodes. Others recursively aggregate nodesinto supernodes, connected via superedges, based on an application-dependent optimiza-tion function.
Node clustering-based methods. Although node grouping and cluster-ing are related in that they result in collections of nodes, they havedifferent goals. In the context of summarization, node grouping is per-formed so that the resultant graph summary has specific properties,e.g., query-specific properties or maintenance of edge weights. On the other hand,
A:6
Y.Liu,T.Safavi,A
.Dighe
andD
.Koutra
Table I: Qualitative comparison of all graph summarization techniques based on the properties of the input graph (e.g., weighted, (un)directed,homogeneous/heterogeneous), their algorithmic properties (i.e., user-defined parameters, complexity linear on the number of edges, coretechnique, output), and their main objectives. Notation: ∗ for the input means that the algorithm can be extended to that type of input, butdetails are not in the paper; for complexity ∗ indicates sub-linearity.
ranked list of temporal patterns,TimeCrunch [Shah et al. 2015] 8 4 8 4 8 4 compression temporal structures visualization
OSNET [Qu et al. 2014] 8 4 8 8 8 4 influence subgraphs of diffusion influenceover time
Dyn
amic
Gra
phs
Social Activity [Lin et al. 2008] 8 4 8 4 8 8 influence temporal themes influence, visualization
Graph Summarization Methods and Applications: A Survey A:7
clustering or partitioning usually targets the minimization of cross-cluster edges ora variant thereof, without the end goal of producing a graph summary. Moreover,unlike role mining [Henderson et al. 2011, 2012; Gilpin et al. 2013] or structuralequivalence [Peleg and Schaffer 1989], which seek to identify “functions” of nodes (e.g.,bridge or spoke nodes) and find role memberships, summarization methods seek togroup nodes that have not only structural similarities, but are also connected or closeto each other in the network and thus can be replaced with a supernode.
Although the goal of clustering is not graph summarization, the outputs of clusteringalgorithms can be easily converted to non-application-specific summaries. In a nutshell,a small representation of the input graph can be obtained by (i) mapping all the nodesthat belong to the same cluster / community to a supernode, and (ii) linking them withsuperedges with weight equal to the sum of the cross-cluster edges, or else the sumof the weights of the original edges [Newman and Girvan 2004; Yang and Leskovec2013; Low et al. 2012]. Although the clustering output can be viewed as a summarygraph, a fundamental difference from tailored summarization techniques is that thelatter groups nodes that are linked to the rest of the graph in a similar way, whileclustering methods simply group densely-connected nodes. There exist comprehensiveintroductions to clustering techniques [Leskovec et al. 2014; Aggarwal 2015] and workon clustering or community detection methods [Aggarwal and Wang 2010], so we donot cover them in this survey. Among the most popular partitioning methods are Gra-clus [Dhillon et al. 2005], spectral partitioning [Alpert et al. 1999], and METIS [Karypisand Kumar 1999]. Although METIS is a well-known partitioning approach that finds“hard” node memberships, it constructs a series of graph “summaries” by iterativelyfinding the maximal graph matching and merging nodes that are incident to an edgeof the matching. The bisection result on the most coarsened graph is then projectedbackwards to the original graph. Via this process, it is possible to obtain a compact,hierarchical representation of the original graph, which resembles other node-groupingsummarization methods.
Node aggregation-based methods. One representative algorithm of hierarchicalclustering-based node grouping is GraSS [LeFevre and Terzi 2010], which targetsaccurate query handling. This summarization method supports queries on the adja-cency between two nodes, as well as the degree and the eigenvector centrality of a node.The graph summaries are generated by greedily grouping nodes such that the nor-malized reconstructed error, 1
|V|2∑
i∈V∑
j∈V |A(i, j)−A(i, j)|, is minimized—A is theoriginal adjacency matrix of the graph and A is the real-valued approximate adjacencymatrix, each entry of which intuitively represents the probability of the correspondingedge existing in the original graph given the summary. The resulting summaries arerepresented as a group of vertex sets with information about the number of edgeswithin and between clusters. These sets are used to generate a probabilistic approx-imate adjacency matrix upon which incoming queries are computed. For example, ifmany edges cross vertex sets A and B, then it is likely that a node in A is connected to anode in B. In another variant, GraSS leverages Minimum Description Length (MDL) toautomatically find the optimal number of supernodes in the summary.
While GraSS does not guarantee output quality, Riondato et al. [2014] propose amethod of generating supernodes and superedges with guarantees. Here, the objectiveis to find a supergraph that minimizes the lp-reconstruction error, or the p-norm ofA− A, as opposed to the normalized reconstruction error in GraSS, given a number ofsupernodes k. The proposed approach, which uses sketching, sampling, and approximatepartitioning, is the first polynomial-time approximation algorithm of its kind with
1Weights only exist between nodes of the same type.
A:8 Y. Liu, T. Safavi, A. Dighe and D. Koutra
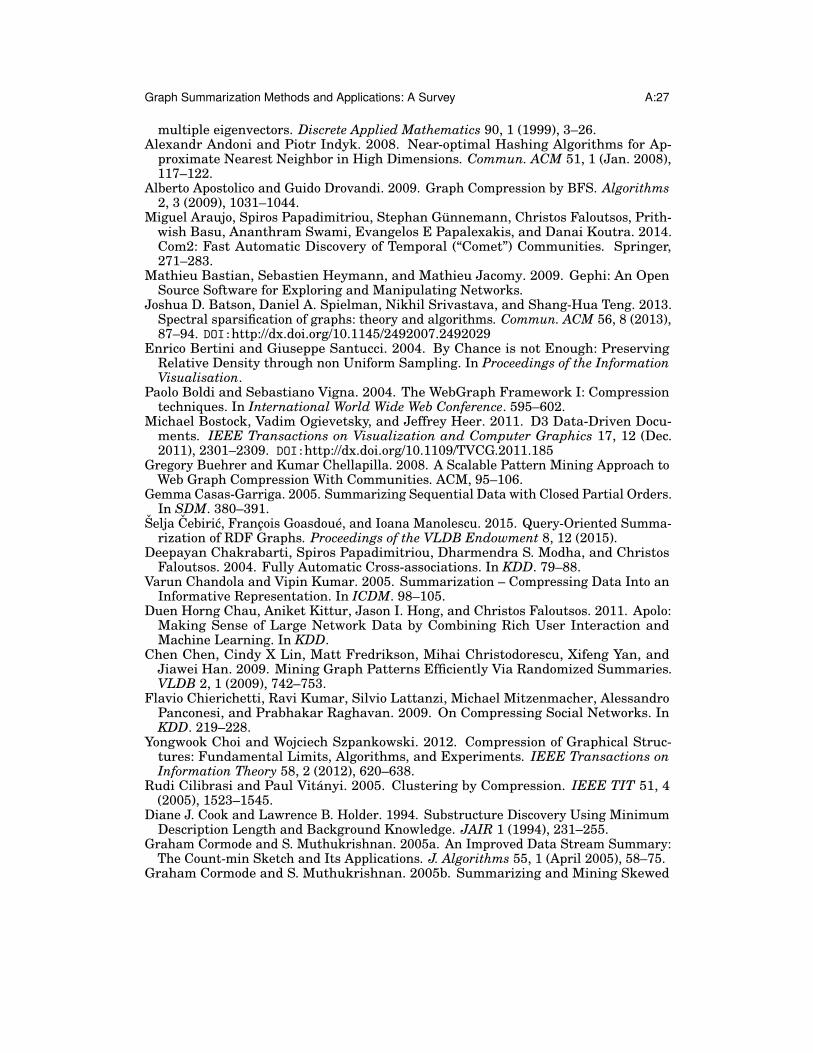
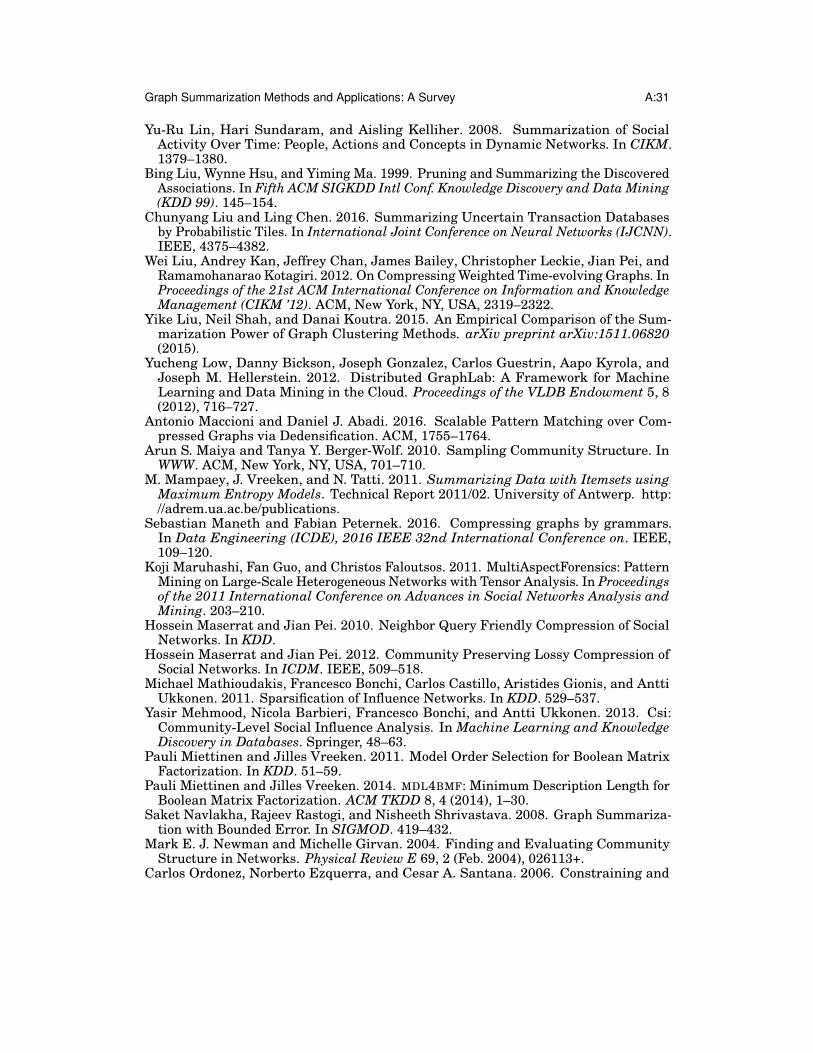
Fig. 2: Overview of COARSENET [Purohit et al. 2014]. All the edges in the original graph areweighted equally. In step 1, edges with small width result in small changes in λ1, while heavyedges result in big changes and are not good candidates for contraction. In step 2, the edge widthdepicts the new edge weight after obtaining the coarsened network.
runtime O(|E|+ |V| · k). This method targets efficiency for the same types of queries asGraSS, as well as triangle and subgraph counting queries.
Toivonen et al. [2011] focus on compressing graphs with edge weights, proposingto merge nodes with similar relationships to other entities (structurally equivalentnodes) such that approximation error is minimized and compression is maximized. Inmerging nodes to obtain a compressed graph, the algorithm maintains either edgeweights or strengths of connections of up to a certain number of hops. Specifically,in the simplest version of the solution, each superedge is assigned the mean weightof all edges it represents. In the generalized version, the best path between any twonodes is “approximately equally good” in the compressed graph and original graphs,but the paths do not have to be the same. The definition of path “goodness” is data- andapplication-dependent. For example, the path quality can be defined as the maximumflow through the path for a flow graph, or the probability that the path exists for aprobabilistic or uncertain graph.
The methods described above all minimize some version of the approximation orreconstruction error. Other node-grouping approaches seek summaries that maintainspecific properties of the original graph, a goal that resembles the target of graphsparsification methods [Spielman and Srivastava 2011; Hubler et al. 2008]. One exampleis diffusive properties related to the spectrum of the graph, and specifically its firsteigenvalue λ1 [Purohit et al. 2014], which are crucial in diffusion and propagationprocesses like epidemiology and viral marketing. In this case, the summarizationproblem is formulated as a minimization of the change in the first eigenvalue betweenthe adjacency matrices of the summary and the original graph. For efficiency, themethod repeatedly merges pairs of adjacent nodes, and uses a closed form to evaluatethe change in λ1, derived using matrix perturbation theory. Node pairs are mergedin increasing order of change in λ1—the light edges with small “edge scores” in step1 of Figure 2 are good candidates for merging—and the merging process stops whenthe user-specified number of nodes is achieved. At every step, edges are reweighted sothat λ1 is maintained (step 2 in Figure 2). The temporal extension of this approach isdiscussed in Section 4.
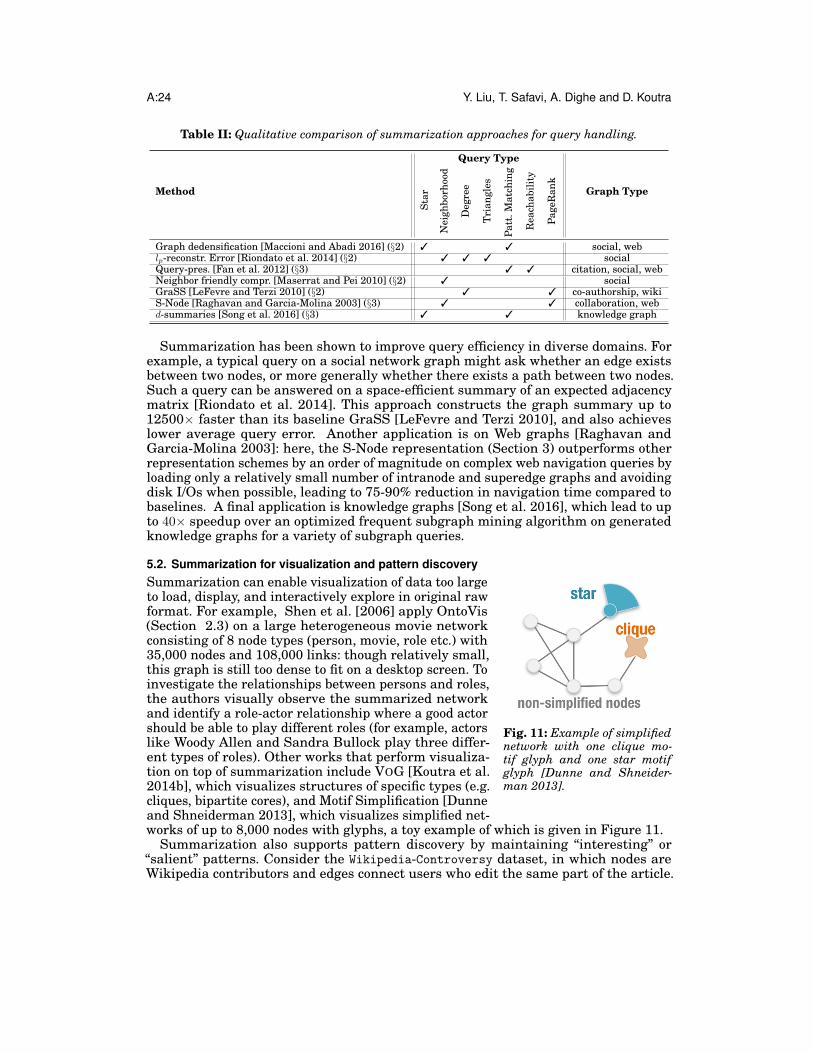
In the visualization domain, Dunne and Shneiderman [2013] introduce motif simplifi-cation to enhance network visualization. Motif simplification replaces common linksand common subgraphs, like stars and cliques, with compact glyphs to help visualizeand simplify the complex relationships between entities and attributes. This approachuses exact pattern discovery algorithms to identify patterns and subgraphs, replacing
Graph Summarization Methods and Applications: A Survey A:9
these with glyphs to result in a less cluttered network display. We give an example inSection 5.2.
Beyond the end goal of summarization itself, node grouping can be applied to manygraph-based tasks. CoSum [Zhu et al. 2016] involves summarization on k-partiteheterogeneous graphs to improve record linkage between data sets, otherwise knownas entity resolution. CoSum transforms an input k-type graph into another k-typesummary graph composed of supernodes and superedges, using links between differenttypes to improve the accuracy of entity resolution. The algorithm jointly condensesvertices into a supernode such that each supernode consists of nodes of the same typewith high similarity, and creates superedges that connect supernodes according to theoriginal links between their constituent nodes. The resultant summary achieves betterperformance in entity resolution than generic approaches, especially in data sets withmissing values and one-to-many or many-to-many relations.
2.1.2. Edge-grouping methods. Unlike node-grouping methods that group nodes intosupernodes, edge-grouping methods aggregate edges into compressor or virtual nodes toreduce the number of edges in a graph in either a lossless or lossy way. Note that in thissection, “compression” does not refer to bit-level optimization, as in the following section,but rather to the process of replacing a set of edges with a node.
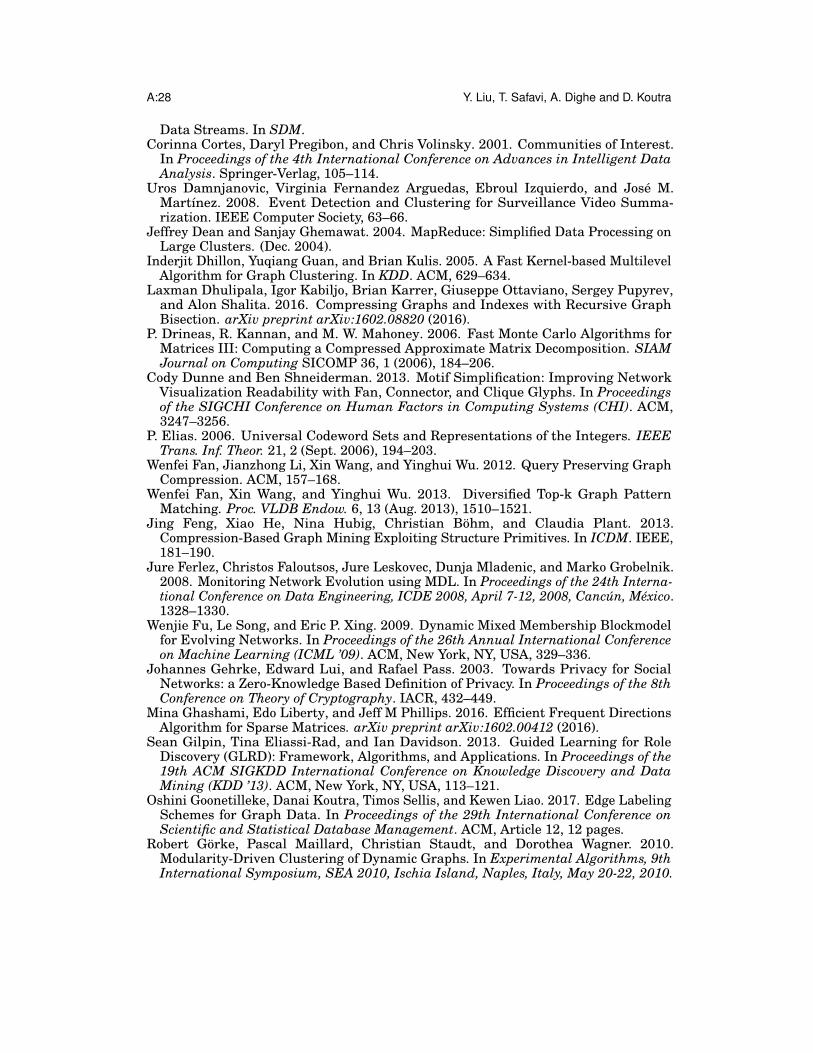
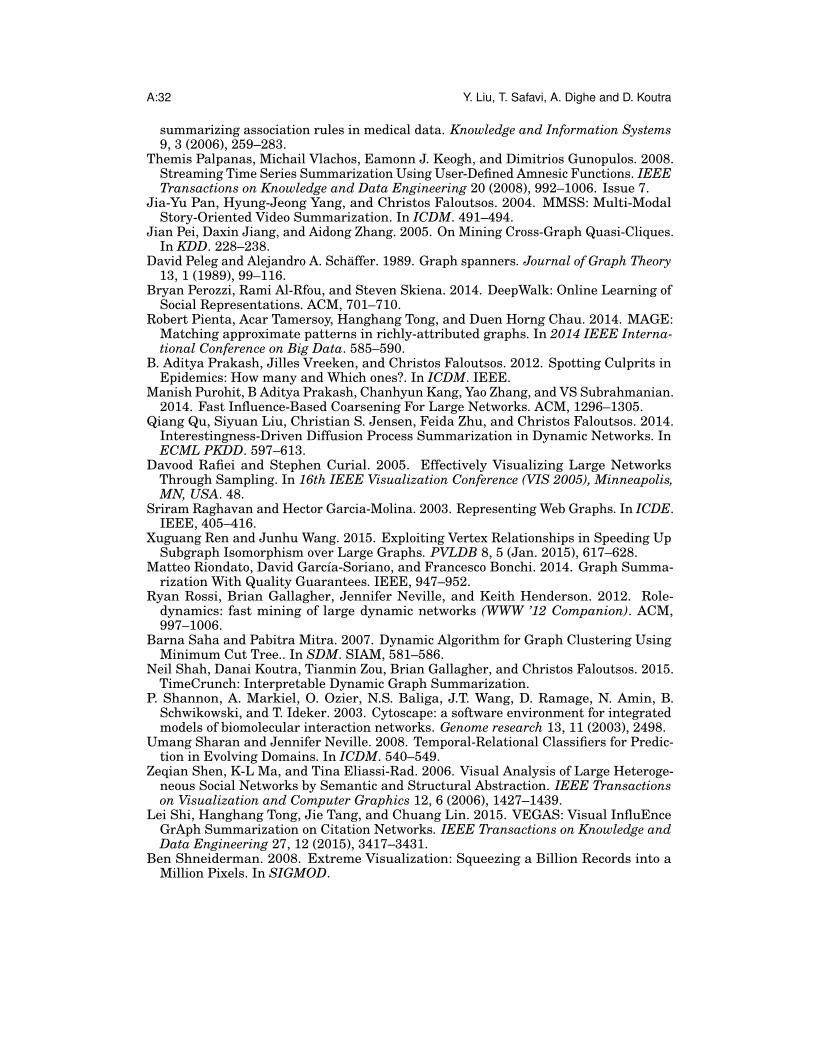
Fig. 3: Example of Graph Dedensifica-tion [Maccioni and Abadi 2016]: many edgesare removed after the addition of the com-pressor node C, which connects to the high-degree nodes H.
Graph Dedensification [Maccioni and Abadi2016] is an edge-grouping method that com-presses neighborhoods around high-degreenodes, accelerating query processing and en-abling direct operations on the compressedgraph. Following the assumption that high-degree nodes are surrounded by redundantinformation that can be synthesized and elim-inated, Maccioni and Abadi introduce “com-pressor nodes”, which represent common con-nections high-degree nodes. To provide globalguarantees and reduce the scope of compres-sor handling during query processing, deden-sification only occurs when every node hasat most one outgoing edge to a compressornode, and every high-degree node has incom-ing edges coming only from a compressor node.
These guarantees are then used to create query processing algorithms that enable directpattern matching queries on the compressed graph.
Similar approaches include the “connector” motif in visualization-based summariza-tion [Dunne and Shneiderman 2013] discussed in Section 2.1.1 and Virtual Node Mining(VNM) [Buehrer and Chellapilla 2008], which is used as a lossy compression scheme forthe Web graph to accommodate community-related queries and other random accessalgorithms on link servers. Like SUBDUE [Cook and Holder 1994] (Section 3.2), VNMuses a frequent mining approach to extract meaningful connectivity formations bycasting the outlinks/inlinks of each vertex as a transaction/itemset. Then, for eachrecurring pattern, it removes the links from its vertices and generates a new vertex(virtual node) in the graph, which is added as an outlink. The process may be viewedexactly like graph dedensification (Figure 3), although dedensification provides exactanswers due to its losslessness and does not suffer from the space/time trade-off ofgraph indexing.
A:10 Y. Liu, T. Safavi, A. Dighe and D. Koutra
2.2. Bit compression-based methodsBit compression is a common technique in data mining. In graph summarization, thegoal of these approaches is to minimize the number of bits needed to describe the inputgraph, where the summary consists of a model for the input graph and its unmodeledparts. The graph summary or model is significantly smaller than the original graphand often reveals various structural patterns, like bipartite subgraphs, that enhanceunderstanding of the original graph structure. As mentioned in the previous section,some of these approaches primarily use compression and secondary grouping techniques.However, some others aim solely to compress a given graph without necessarily creatinga graph summary or finding comprehensible graph structures.
Here we focus mostly on the former approaches, which often formulate summarizationas a model selection task. These works employ the two-part Minimum DescriptionLength (MDL) code, the goal of which is to minimize the description of the given graphG and the model class M in terms of bits:
minL(G,M) = L(M) + L(G|M), (1)
which is given as the description length of the model, L(M), and the description lengthof the graph given the model (i.e., the errors or unmodeled parts with respect to themodel). For completeness, we also present some graph compression methods that canbe adapted to summarization, although not originally designed for that purpose.
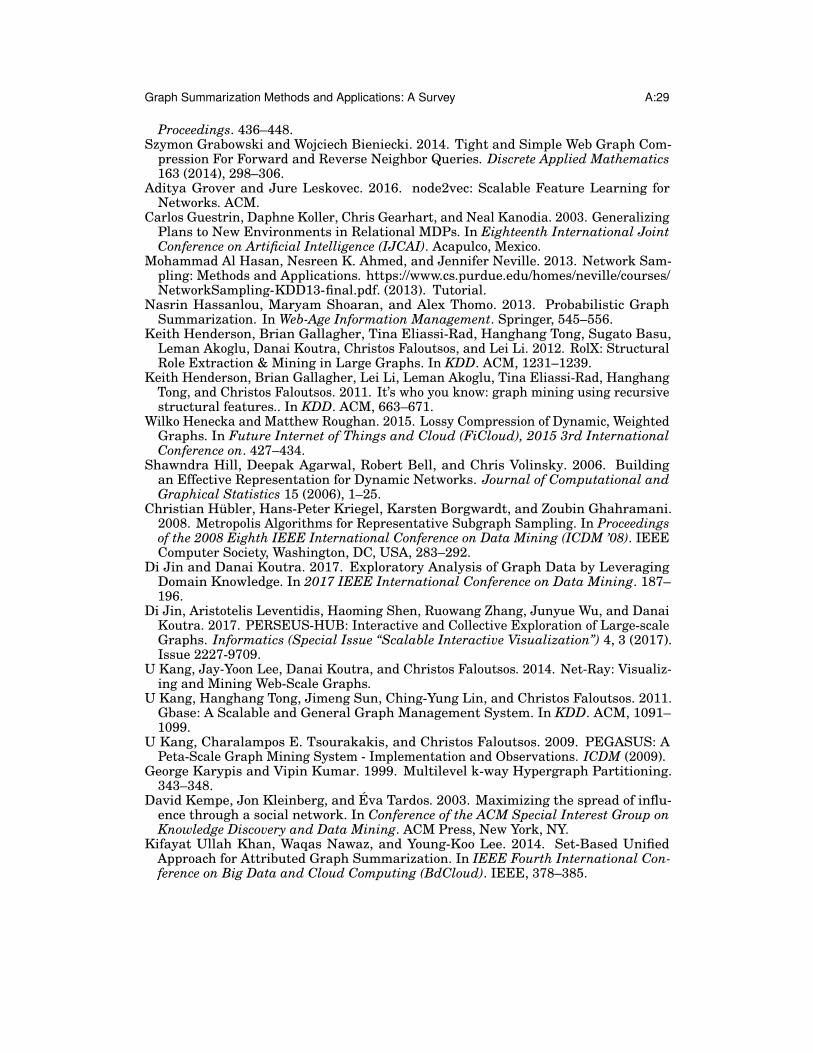
Fig. 4: Two-part MDL representa-tion [Navlakha et al. 2008]: graph sum-mary S and corrections C. Since S doesnot capture the edge (1,5) properly, it isadded in C. Similarly, the summary “cap-tures” edge (8,4), which is missing in theoriginal graph, so it is removed in C.
Relying on this two-part MDL representation,Navlakha et al. [2008] introduce an approachto summarize graphs with bounded error. Thisrepresentation, obtained by aggregating nodesin the summary generation, consists of a graphsummary S and a set of corrections C (Figure 4).The summary is an aggregate graph in whicheach node corresponds to a set of nodes in G,and each edge represents the edges betweenall pairs of nodes in the two sets. The correc-tion term specifies the list of edge-correctionsthat must be applied to the summary to exactlyrecreate G. The cost of a representation, R, isthe sum of the storage costs of both S and C:cost(R) = |ES | + |C|, where ES is the set of su-peredges in S. The MDL-based graph summaryis found by aggregating groups of nodes (therebyfalling also into the grouping-based summariza-tion category) as long as they decrease the MDL
cost of the graph. To this end, a simple but costly greedy heuristic iteratively com-bines node pairs that give the maximum cost reduction into supernodes. To reducethe complexity to cubic on the average degree of the graph, a randomized algorithmrandomly picks a node and merges it with the best node in its 2-hop neighborhood. Thisformulation also supports lossy compression with bounded reconstruction error in orderto achieve even higher space savings. This summarization approach gives up to twotimes more compact summaries than graph compression [Boldi and Vigna 2004] andclustering [Dhillon et al. 2005] methods.
Similar to Navlakha et al. [2008], Ahnert [2013] introduces a biological applicationfor the discovery of dominant relationship patterns in transcription networks, suchas the networks of S. serevisiae and E. coli. In biology, the terms “power graph” and“power nodes/edges” are used to refer to what we call supergraphs and supernodes/edges.
Graph Summarization Methods and Applications: A Survey A:11
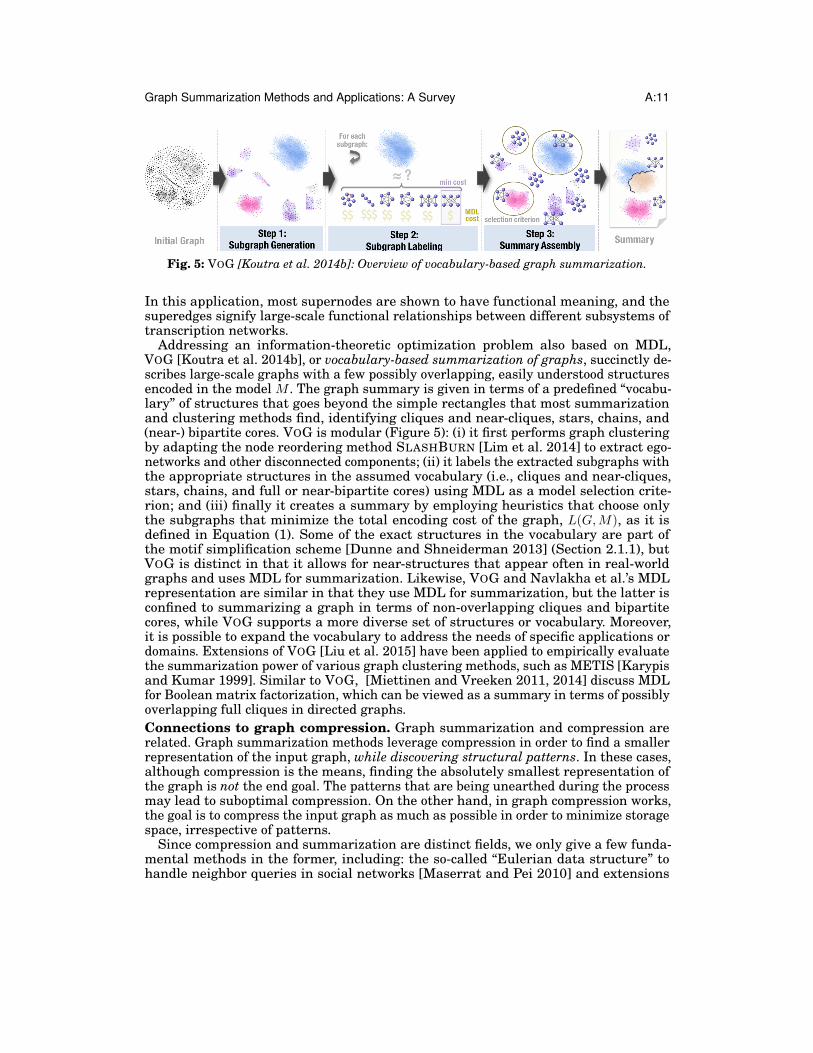
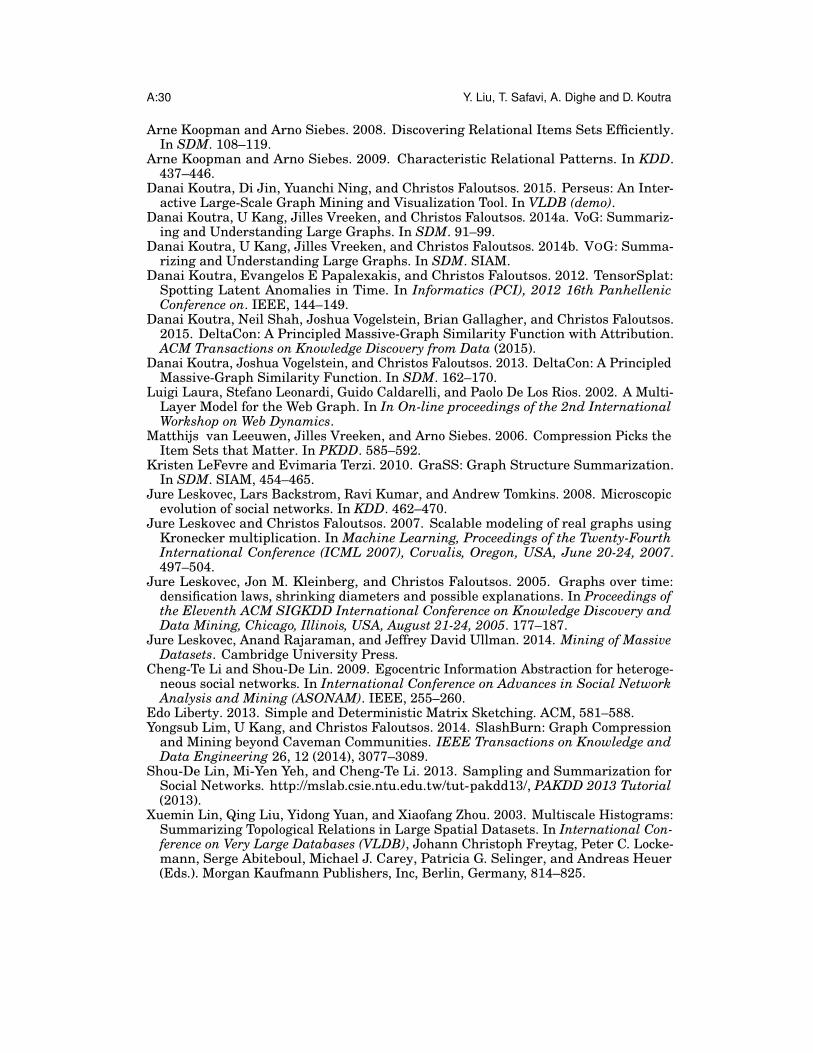
Fig. 5: VOG [Koutra et al. 2014b]: Overview of vocabulary-based graph summarization.
In this application, most supernodes are shown to have functional meaning, and thesuperedges signify large-scale functional relationships between different subsystems oftranscription networks.
Addressing an information-theoretic optimization problem also based on MDL,VOG [Koutra et al. 2014b], or vocabulary-based summarization of graphs, succinctly de-scribes large-scale graphs with a few possibly overlapping, easily understood structuresencoded in the model M . The graph summary is given in terms of a predefined “vocabu-lary” of structures that goes beyond the simple rectangles that most summarizationand clustering methods find, identifying cliques and near-cliques, stars, chains, and(near-) bipartite cores. VOG is modular (Figure 5): (i) it first performs graph clusteringby adapting the node reordering method SLASHBURN [Lim et al. 2014] to extract ego-networks and other disconnected components; (ii) it labels the extracted subgraphs withthe appropriate structures in the assumed vocabulary (i.e., cliques and near-cliques,stars, chains, and full or near-bipartite cores) using MDL as a model selection crite-rion; and (iii) finally it creates a summary by employing heuristics that choose onlythe subgraphs that minimize the total encoding cost of the graph, L(G,M), as it isdefined in Equation (1). Some of the exact structures in the vocabulary are part ofthe motif simplification scheme [Dunne and Shneiderman 2013] (Section 2.1.1), butVOG is distinct in that it allows for near-structures that appear often in real-worldgraphs and uses MDL for summarization. Likewise, VOG and Navlakha et al.’s MDLrepresentation are similar in that they use MDL for summarization, but the latter isconfined to summarizing a graph in terms of non-overlapping cliques and bipartitecores, while VOG supports a more diverse set of structures or vocabulary. Moreover,it is possible to expand the vocabulary to address the needs of specific applications ordomains. Extensions of VOG [Liu et al. 2015] have been applied to empirically evaluatethe summarization power of various graph clustering methods, such as METIS [Karypisand Kumar 1999]. Similar to VOG, [Miettinen and Vreeken 2011, 2014] discuss MDLfor Boolean matrix factorization, which can be viewed as a summary in terms of possiblyoverlapping full cliques in directed graphs.Connections to graph compression. Graph summarization and compression arerelated. Graph summarization methods leverage compression in order to find a smallerrepresentation of the input graph, while discovering structural patterns. In these cases,although compression is the means, finding the absolutely smallest representation ofthe graph is not the end goal. The patterns that are being unearthed during the processmay lead to suboptimal compression. On the other hand, in graph compression works,the goal is to compress the input graph as much as possible in order to minimize storagespace, irrespective of patterns.
Since compression and summarization are distinct fields, we only give a few funda-mental methods in the former, including: the so-called “Eulerian data structure” tohandle neighbor queries in social networks [Maserrat and Pei 2010] and extensions
A:12 Y. Liu, T. Safavi, A. Dighe and D. Koutra
of this work to community-preserving compression [Maserrat and Pei 2012]; node re-ordering techniques, such as zip block encoding in GBASE [Kang et al. 2011], bipartiteminimum logarithmic arrangement [Dhulipala et al. 2016] for inverted indices, andtechniques for real graphs with power-law degree distributions [Lim et al. 2014]; edgereordering techniques [Goonetilleke et al. 2017]; compression of web graphs using lexico-graphic localities [Boldi and Vigna 2004]; extensions to social networks [Grabowski andBieniecki 2014; Chierichetti et al. 2009]; breadth first search-based approaches [Apos-tolico and Drovandi 2009]; lossy edge encoding per triangle [Feng et al. 2013]; weightedgraph compression to maintain edge weights up to a certain number of hops [Toivonenet al. 2011]; provably optimal compression of Erdos-Renyi random graphs using struc-tural entropy (SZIP [Choi and Szpankowski 2012]); and minimal probabilistic tile covermining [Liu and Chen 2016] that has applications to binary matrices and bipartitegraphs.
2.3. Simplification-based methodsSimplification-based summarization methods streamline the original graph by removingless “important” nodes or edges, resulting in a sparsified graph. As opposed to super-graphs, here the summary graph consists of a subset of the original nodes and/or edges.In addition to simplification-based summarization methods, some existing graph algo-rithms have the potential for simplification-based summarization, such as sparsification,sampling, and sketching.
A representative work on node simplification-based summarization techniques isOntoVis [Shen et al. 2006], a visual analytical tool that relies on node filtering for thepurpose of understanding large, heterogeneous social networks in which nodes andlinks respectively represent different concepts and relations. OntoVis uses informationin the ontology that relates nodes and edges, such as the degree of nodes of specific type,to semantically prune the network. OntoVis supports semantic abstraction, structuralabstraction, and importance filtering. In semantic abstraction, the user constructs aderived graph from the original graph by including only nodes whose types are selectedfrom the original ontology graph. For example, in a terrorism network, selection ofthe node type “terrorist organization” results in a semantic abstraction of differentterrorist organizations. Structural abstraction simplifies the graph while preserving theessential structure of the entire network, for example by removing one-degree nodesand duplicate paths. Importance filtering makes use of statistical measures like nodedegree for evaluating connectivity and relevance between node types.
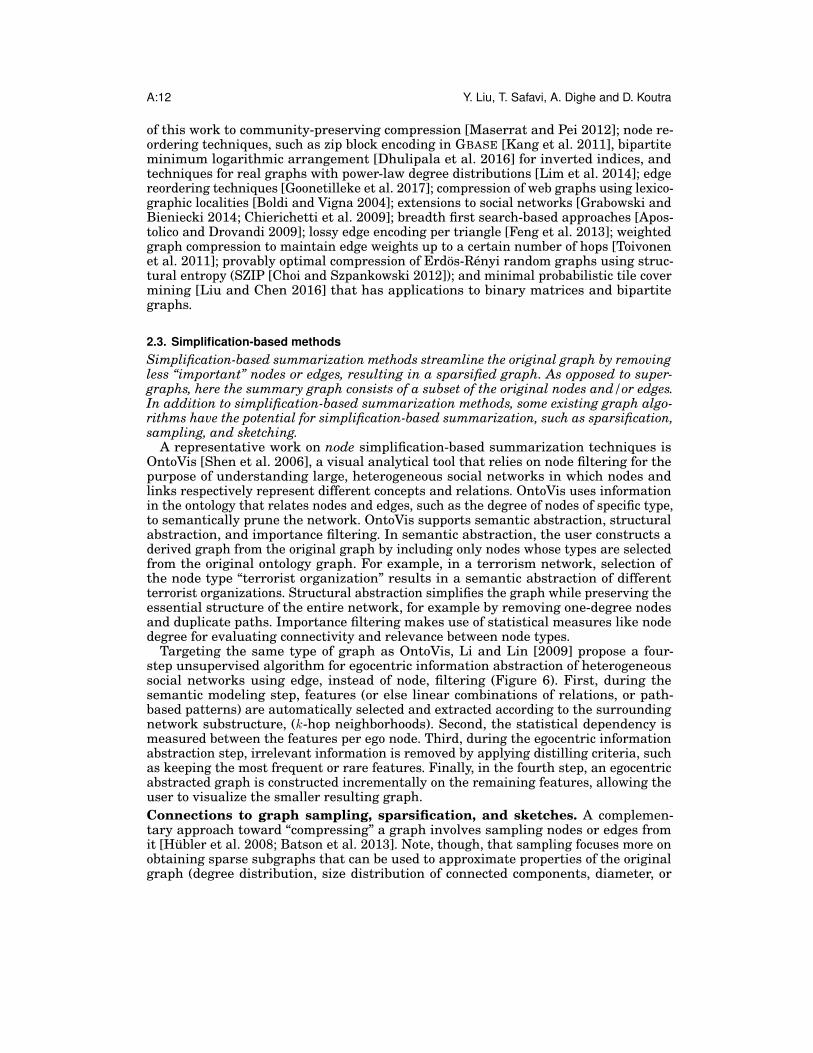
Targeting the same type of graph as OntoVis, Li and Lin [2009] propose a four-step unsupervised algorithm for egocentric information abstraction of heterogeneoussocial networks using edge, instead of node, filtering (Figure 6). First, during thesemantic modeling step, features (or else linear combinations of relations, or path-based patterns) are automatically selected and extracted according to the surroundingnetwork substructure, (k-hop neighborhoods). Second, the statistical dependency ismeasured between the features per ego node. Third, during the egocentric informationabstraction step, irrelevant information is removed by applying distilling criteria, suchas keeping the most frequent or rare features. Finally, in the fourth step, an egocentricabstracted graph is constructed incrementally on the remaining features, allowing theuser to visualize the smaller resulting graph.Connections to graph sampling, sparsification, and sketches. A complemen-tary approach toward “compressing” a graph involves sampling nodes or edges fromit [Hubler et al. 2008; Batson et al. 2013]. Note, though, that sampling focuses more onobtaining sparse subgraphs that can be used to approximate properties of the originalgraph (degree distribution, size distribution of connected components, diameter, or
Graph Summarization Methods and Applications: A Survey A:13
Fig. 6: Overview of egocentric abstraction [Li and Lin 2009]. The features are ranked by frequency(score) in step 2. Depending on the policy, only the frequent or rare features are used. In the example,the abstraction graph is based on frequent features above a threshold θ.
community structure [Maiya and Berger-Wolf 2010]) and less on identifying patternsthat collectively summarize the input graph to enhance user understanding.
Various sampling techniques have been studied [Mathioudakis et al. 2011; Ahmedet al. 2013], and a comprehensive tutorial on graph sampling was presented atKDD [Hasan et al. 2013]. Sampling techniques include sampling nodes accordingto their in- or out-degree, PageRank, or substructures, such as spanning trees; aswell as sampling edges uniformly, or according to their weights or their effective re-sistance [Spielman and Srivastava 2011] to maintain the graph spectrum up to somemultiplicative error or to maintain node reachability (transitive reduction [Aho et al.1972]). Although sampling has the potential to allow better visualization [Rafiei andCurial 2005] and approximate specific queries with theoretical guarantees, it cannotdetect graph structures, often operates on individual nodes/edges instead of collectivepatterns, and may need additional processing in order to make sense of the sample.Related to the goal of maintaining specific graph properties is the k-spanner [Peleg andSchaffer 1989], which is the sparsest subgraph in which the distance between pairs ofnodes is at most k times the distance in the initial graph. A common category of theproblem is the tree k-spanner, which approximates the original graph with a tree thatsatisfies the distance property. Finding a k-spanner is NP-hard except for the case ofk = 2, which can be solved in O(|E|+ |V|) time.
Graph sketches [Ahn et al. 2012; Liberty 2013; Ghashami et al. 2016], or datasynopses obtained by applying linear projections, are also relevant. Graph sketchingcan be viewed as linear dimensionality reduction, where the linearity of sketches makesthem applicable to the analysis of streaming graphs with node and edge additions anddeletions and distributed settings, such as MapReduce [Dean and Ghemawat 2004].
2.4. Influence-based methodsInfluence-based methods seek to find a compact, high-level description of the influencedynamics in large-scale graphs, in order to understand the patterns of influence prop-agation at a global level. Usually such methods formulate graph summarization asan optimization process in which some quantity related to information influence ismaintained. These summarization methods are scarce and have been mostly applied onsocial graphs, where important influence-related questions arise.
Community-level Social Influence or CSI [Mehmood et al. 2013] is a representativework that focuses on summarizing social networks via information propagation and so-cial influence analysis. Like some other graph summarization techniques, CSI relies onexisting clustering approaches: it detects a set of communities using METIS [Karypisand Kumar 1999] and then finds their reciprocal influence by extending the popularIndependent Cascade model [Kempe et al. 2003] to communities instead of individualnodes. To balance between data fit and model complexity, CSI uses MDL and Bayesian
A:14 Y. Liu, T. Safavi, A. Dighe and D. Koutra
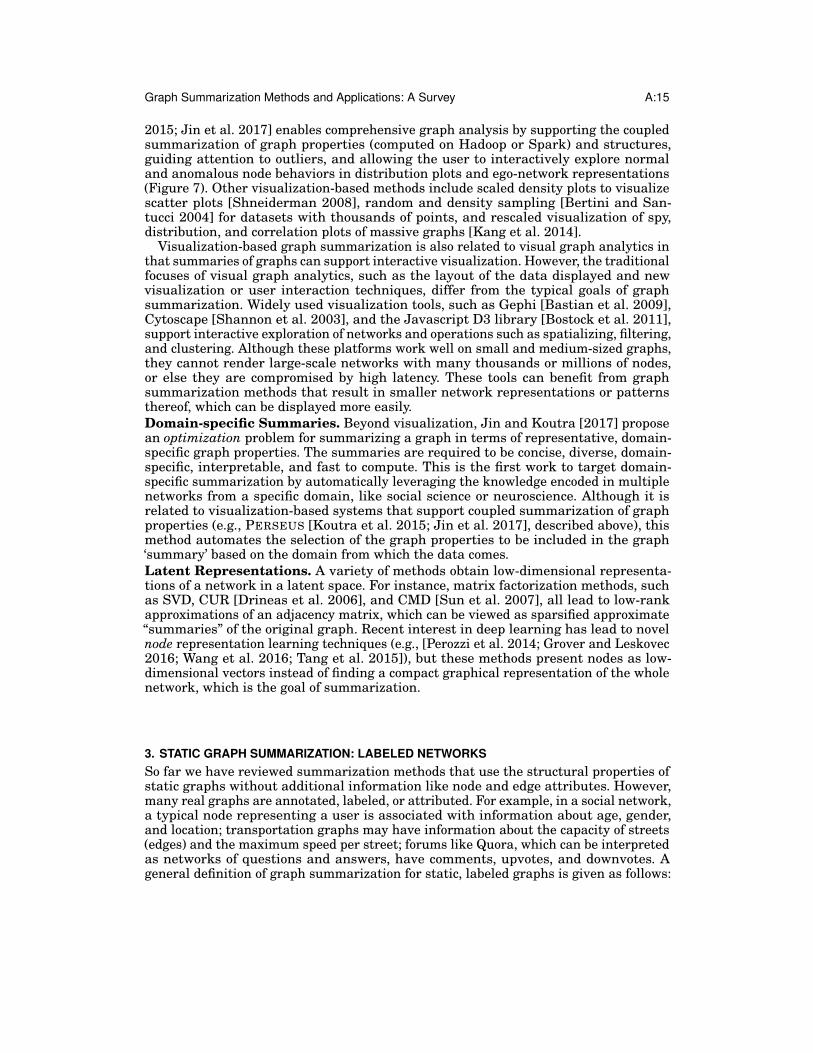
Fig. 7: The front-end of PERSEUS-HUB, with linked plots for graph properties. The annotated redpoints correspond to anomalies found during offline pre-processing.
Information Criterion (BIC) approaches to select the number of communities for thegraph model. Unlike influence propagation approaches that find representative cascadesfor information diffusion, CSI leads to a compact representation of the input networkwhere the nodes correspond to communities and the directed edges represent influencerelationships. Note that the output of CSI is different from grouping-based summa-rization techniques in which the superedges simply represent aggregate connectionsbetween the adjacent supernodes. SPINE, an alternative to CSI [Mathioudakis et al.2011], sparsifies social networks to only keep the edges that “explain” the informationpropagation—those that maximize the likelihood of the observed data. This problemis shown to be NP-hard to approximate within any multiplicative factor. Inspired bythe idea of decomposing sparsification into a number of subproblems equal to the nodesin the network, SPINE is a greedy algorithm that achieves efficiency with practicallylittle compromise in quality. Unlike CSI, it simply eliminates original edges and doesnot group nodes into communities or supernodes.
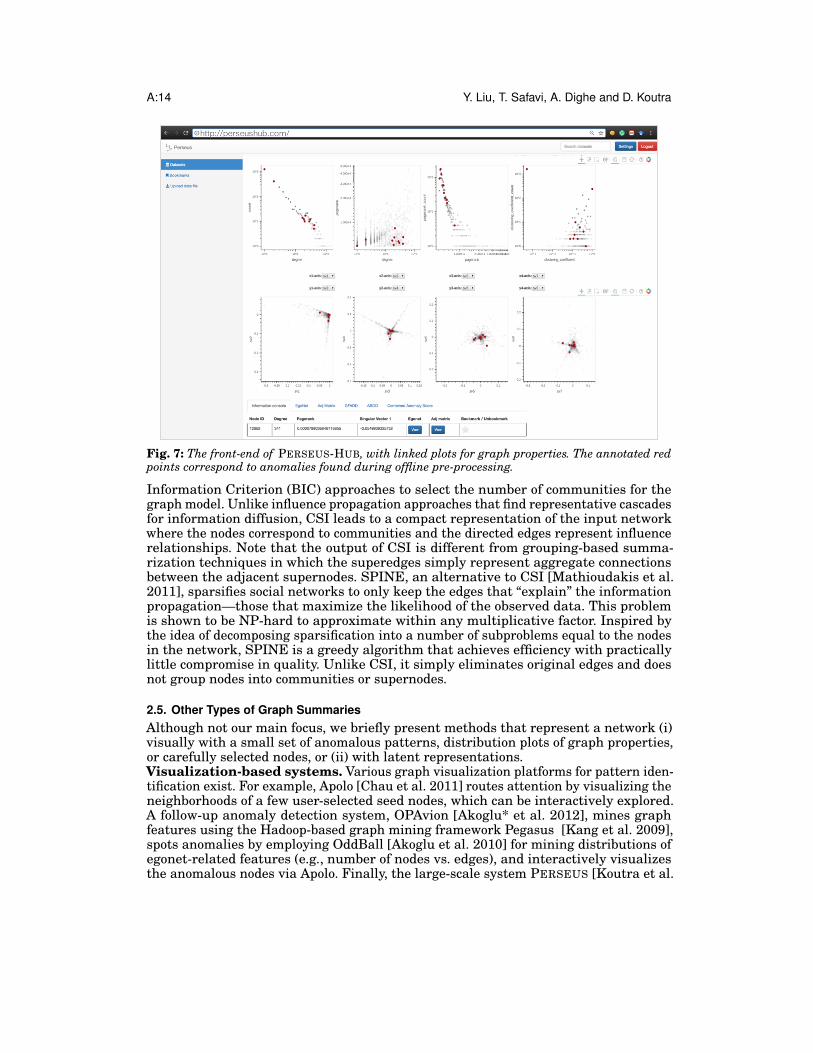
2.5. Other Types of Graph SummariesAlthough not our main focus, we briefly present methods that represent a network (i)visually with a small set of anomalous patterns, distribution plots of graph properties,or carefully selected nodes, or (ii) with latent representations.Visualization-based systems. Various graph visualization platforms for pattern iden-tification exist. For example, Apolo [Chau et al. 2011] routes attention by visualizing theneighborhoods of a few user-selected seed nodes, which can be interactively explored.A follow-up anomaly detection system, OPAvion [Akoglu* et al. 2012], mines graphfeatures using the Hadoop-based graph mining framework Pegasus [Kang et al. 2009],spots anomalies by employing OddBall [Akoglu et al. 2010] for mining distributions ofegonet-related features (e.g., number of nodes vs. edges), and interactively visualizesthe anomalous nodes via Apolo. Finally, the large-scale system PERSEUS [Koutra et al.
Graph Summarization Methods and Applications: A Survey A:15
2015; Jin et al. 2017] enables comprehensive graph analysis by supporting the coupledsummarization of graph properties (computed on Hadoop or Spark) and structures,guiding attention to outliers, and allowing the user to interactively explore normaland anomalous node behaviors in distribution plots and ego-network representations(Figure 7). Other visualization-based methods include scaled density plots to visualizescatter plots [Shneiderman 2008], random and density sampling [Bertini and San-tucci 2004] for datasets with thousands of points, and rescaled visualization of spy,distribution, and correlation plots of massive graphs [Kang et al. 2014].
Visualization-based graph summarization is also related to visual graph analytics inthat summaries of graphs can support interactive visualization. However, the traditionalfocuses of visual graph analytics, such as the layout of the data displayed and newvisualization or user interaction techniques, differ from the typical goals of graphsummarization. Widely used visualization tools, such as Gephi [Bastian et al. 2009],Cytoscape [Shannon et al. 2003], and the Javascript D3 library [Bostock et al. 2011],support interactive exploration of networks and operations such as spatializing, filtering,and clustering. Although these platforms work well on small and medium-sized graphs,they cannot render large-scale networks with many thousands or millions of nodes,or else they are compromised by high latency. These tools can benefit from graphsummarization methods that result in smaller network representations or patternsthereof, which can be displayed more easily.Domain-specific Summaries. Beyond visualization, Jin and Koutra [2017] proposean optimization problem for summarizing a graph in terms of representative, domain-specific graph properties. The summaries are required to be concise, diverse, domain-specific, interpretable, and fast to compute. This is the first work to target domain-specific summarization by automatically leveraging the knowledge encoded in multiplenetworks from a specific domain, like social science or neuroscience. Although it isrelated to visualization-based systems that support coupled summarization of graphproperties (e.g., PERSEUS [Koutra et al. 2015; Jin et al. 2017], described above), thismethod automates the selection of the graph properties to be included in the graph‘summary’ based on the domain from which the data comes.Latent Representations. A variety of methods obtain low-dimensional representa-tions of a network in a latent space. For instance, matrix factorization methods, suchas SVD, CUR [Drineas et al. 2006], and CMD [Sun et al. 2007], all lead to low-rankapproximations of an adjacency matrix, which can be viewed as sparsified approximate“summaries” of the original graph. Recent interest in deep learning has lead to novelnode representation learning techniques (e.g., [Perozzi et al. 2014; Grover and Leskovec2016; Wang et al. 2016; Tang et al. 2015]), but these methods present nodes as low-dimensional vectors instead of finding a compact graphical representation of the wholenetwork, which is the goal of summarization.
3. STATIC GRAPH SUMMARIZATION: LABELED NETWORKSSo far we have reviewed summarization methods that use the structural properties ofstatic graphs without additional information like node and edge attributes. However,many real graphs are annotated, labeled, or attributed. For example, in a social network,a typical node representing a user is associated with information about age, gender,and location; transportation graphs may have information about the capacity of streets(edges) and the maximum speed per street; forums like Quora, which can be interpretedas networks of questions and answers, have comments, upvotes, and downvotes. Ageneral definition of graph summarization for static, labeled graphs is given as follows:
A:16 Y. Liu, T. Safavi, A. Dighe and D. Koutra
PROBLEM 2. Summarization of Static, Labeled Graphs.Given a static graph G and side information, such as node attributes,Find a labeled summary graph or a set of labeled structures to concisely describethe given graph.
Overall, the main challenge in summarizing labeled graphs is the efficient combi-nation of two different types of data: structural connections and attributes. Currently,most existing works focus on node attributes alone, although other types of side infor-mation are certainly of interest in summarization. For instance, joint summarizationof multimodal data—including graphs, text, images, and streaming data—has variousapplications. However, due to the challenges of multimodal analysis, these methods areunderexplored in the literature.
The second block of Table I provides qualitative comparisons and explicit character-izations of static graph summarization methods for labeled graphs, which we reviewnext by classifying them based on their core technical methodology. The overview ofthis section is included in Figure 1.
3.1. Grouping-based methodsGrouping-based methods aggregate nodes into supernodes connected by superedgesbased on both structural properties and node attributes. Grouped nodes are usuallystructurally close in the graph and share similar attribute values.
As discussed with plain graphs, here attributed clustering or community detec-tion [Zhou et al. 2009; Yang et al. 2013; Xu et al. 2012] methods do not performsummarization, but could be leveraged by summarization approaches to obtain compactrepresentations of graphs with attributes. One fundamental difference between sum-marization and clustering is that the former finds coherent sets of nodes with similarconnectivity patterns to the rest of the graph, while clustering results in coherent,densely-connected groups of nodes.
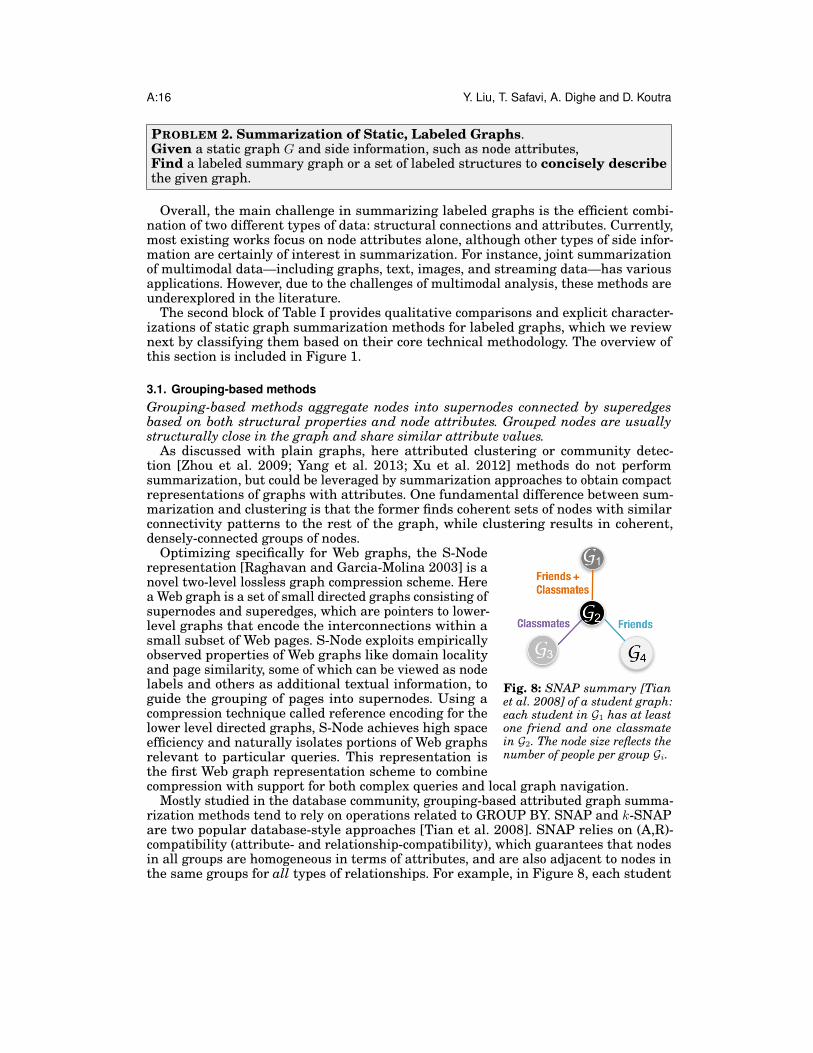
Fig. 8: SNAP summary [Tianet al. 2008] of a student graph:each student in G1 has at leastone friend and one classmatein G2. The node size reflects thenumber of people per group Gi.
Optimizing specifically for Web graphs, the S-Noderepresentation [Raghavan and Garcia-Molina 2003] is anovel two-level lossless graph compression scheme. Herea Web graph is a set of small directed graphs consisting ofsupernodes and superedges, which are pointers to lower-level graphs that encode the interconnections within asmall subset of Web pages. S-Node exploits empiricallyobserved properties of Web graphs like domain localityand page similarity, some of which can be viewed as nodelabels and others as additional textual information, toguide the grouping of pages into supernodes. Using acompression technique called reference encoding for thelower level directed graphs, S-Node achieves high spaceefficiency and naturally isolates portions of Web graphsrelevant to particular queries. This representation isthe first Web graph representation scheme to combinecompression with support for both complex queries and local graph navigation.
Mostly studied in the database community, grouping-based attributed graph summa-rization methods tend to rely on operations related to GROUP BY. SNAP and k-SNAPare two popular database-style approaches [Tian et al. 2008]. SNAP relies on (A,R)-compatibility (attribute- and relationship-compatibility), which guarantees that nodesin all groups are homogeneous in terms of attributes, and are also adjacent to nodes inthe same groups for all types of relationships. For example, in Figure 8, each student
Graph Summarization Methods and Applications: A Survey A:17
in G1 has at least one friend and classmate in G2. SNAP begins by creating groups ofnodes that share the same attributes, and then iteratively splits these groups until thegrouping is “compatible” with the relationships, eventually producing the maximum(A,R)-compatible grouping. The nodes of the summary graph given by SNAP correspondto the groups, and the edges are the group relationships. k-SNAP further allows usersto control the summary resolution, providing “drill-down” and “roll-up” capabilities tonavigate through summaries of different resolutions.
In order to facilitate interactive summarization, CANAL [Zhang et al. 2010] auto-mates k-SNAP by categorizing numerical attribute values, exploiting domain knowl-edge about the node labels and graph structure. To point users to the potentially mostuseful summaries, CANAL incorporates three “interestingness” criteria: (i) Diversity,the number of strong relationships connecting groups with different attribute values;(ii) Coverage, the fraction of nodes in the original graph that are present in stronggroup relationships; (iii) Conciseness, the sum of the number of groups and stronggroup relationships, where a lower sum is preferred. Overall, interestingness is givenas Diversity(S)×Coverage(S)
Conciseness(S) , where S is the summary graph.Hassanlou et al. [2013] introduce another database-centered graph summarization
approach similar to SNAP, where each node group consists of nodes that have thesame attribute values using the GROUP BY operation. Unlike SNAP, though, thisapproach applies to probabilistic graphs, or graphs with edges that have probabilitiesof existence associated with them. Shoaran et al. [2013] extend this by aiming toprotect the privacy of data in the labeled summaries generated by the aforementionedprobabilistic technique. Finally, Gehrke et al. [2003] propose a privacy frameworkthat extends Zero-Knowledge Privacy, improving upon differential privacy by onlyconsidering a random sampling of data with added noise for the summarization.
In the database community, Fan et al. [2012] propose a “blueprint” for losslessqueries on compressed attributed graphs. To achieve this, query-specific functions areintroduced for compressing the graph, rewriting the query accordingly, and interpretingthe result of the rewritten query on the compressed graph. For example, this blueprintcan be implemented for queries of reachability (i.e., can node A be reached from node B?)and pattern matching (i.e., is there a subgraph that best satisfies a function provided bythe user on path length between nodes in the subgraph?). The key idea is to group nodesthat belong to the same equivalence class; intuitively, nodes that are similar in structureand labels are equivalent. This differs from other database-style operations that firstgroup nodes by labels and later analyze the structure. To handle dynamic changesin web, social and other networks, the authors also introduce unbounded algorithmsthat evaluate incremental graph structure changes and propagate the changes to thecompressed graph representation. Ren and Wang [2015] propose a method similar toFan et al. specifically for subgraph isomorphism queries, where groupings are basednot only on equivalent nodes but also on edge-specific relationships that optimize thevertex matching order.
In the case of schema-less databases—in particular, for knowledge graphs connect-ing entities and concepts—Song et al. [2016] propose a lossy graph summarizationframework as a collection of d-summaries, which intuitively are supergraphs that groupsimilar entities (i.e., with the same attribute or label) within d hops of each other.Specifically, the entities within a d-summary observe what is called d-similarity, whichpreserves directed paths up to length d. Unlike frequent subgraph mining—a build-ing block for various graph algorithms, including summarization—which is NP-hard,computing d-summaries is tractable. To evaluate d-summaries, the authors introduceapproximations of an NP-hard “bi-criteria” function that quantifies informativeness anddiversity. The former measure favors large summaries with high coverage of the original
A:18 Y. Liu, T. Safavi, A. Dighe and D. Koutra
graph; the latter penalizes redundancy for entities appearing in many d-summaries.Both summarizing and querying knowledge graphs with d-summaries are efficient, andcan maintain up to 99% accuracy for subgraph queries in real and synthetic graphs.
Beyond attribute- and relationship-coherent summaries, there exists work on creatingsummaries from frequently occurring subgraphs in heterogeneous labeled graphs.A representative work is dependence graph summarization, where the vertices arelabeled with program operations and the edges represent dependency relationshipsbetween them [Chen et al. 2009]. The algorithm first generates partitions createdby sampling nodes of the same label, resulting in multiple groups with consistentlabels. The partitioning/summarization is followed by frequent subgraph mining andverification (removal of false positives). These steps are performed in multiple iterationsto find a lower bound on the false negative rate of frequent subgraph detection.
3.2. Bit compression-based methodsMost compression-based summarization methods leverage MDL to guide the groupingof nodes or the discovery of frequent structures to be replaced with virtual nodes in thesummary. Here, the employed compression and/or aggregation techniques consider boththe graph structure and node/edge attributes.
The first and most famous frequent-subgraph-based summarization scheme, SUB-DUE [Cook and Holder 1994], employs a two-part MDL representation (described inSection 2.2). Beyond the network structure, the MDL encoding accounts for node andedge labels. Greedy beam search is used to iteratively replace the most frequent sub-graph in a labeled graph, which minimizes the MDL cost, with a meta-node. Multiplepasses of SUBDUE eventually produce a hierarchical description of the structuralregularities in the graph. The resulting representation can be used to either identifyanomalous structures (instances that do not compress well) or the most common sub-structures (substructures that have very low compression cost). Since the introductionof SUBDUE, many methods have been proposed to alleviate the complexity issues offrequent pattern mining on graphs, or to extend its application in different settings:Maruhashi et al. [2011] propose MultiAspectForensics, a tool to detect and visualizegraph patterns; Thomas et al. [2010] introduce MARGIN, an algorithm that reduces thesearch space of frequent subgraphs by only mining the maximal frequent subgraphsof a graph database; and Wackersreuther et al. [2010] propose a frequent subgraphmining algorithm to operate on dynamic graphs. Similar to SUBDUE, a grammar-based compression scheme [Maneth and Peternek 2016] recursively replaces frequent“substructures” in directed edge-labeled hypergraphs, like RDF graphs. Rather thanfrequent subgraphs, these substructures are digrams, or pairs of connected hyperedges:for example, the digram “ab” consists of the edge labels “a” and “b”. The process ofrecursive replacement of digrams stops when no digram occurs more than once. Unlikemost compression-based works that use MDL, this approach leverages variable-lengthδ-codes [Elias 2006] for the connectivity and edge labels.
A simpler information-theoretic approach that does not use frequent subgraph miningdirectly minimizes the two-part MDL representation of an input network [Wu et al.2014]. The model cost consists of the number of bits to describe three parts: the numberof node and attribute groups; the nodes in each group; and the links among groups. Thedata cost includes the description cost of the links inside each group and the attributes.The greedy summary-generating algorithm employs the MDL cost function to determinewhether a certain node grouping is beneficial to the summary as a whole (i.e., it reducesthe total encoding cost of the graph). A faster version of the greedy algorithm initializesthe summaries using label propagation instead of random initialization.
Beyond its standalone utility, MDL can be easily combined with other techniques,such as locality-sensitive hashing (LSH) [Andoni and Indyk 2008], to help with in-
Graph Summarization Methods and Applications: A Survey A:19
memory processing and summary generation. LSH is a popular technique for efficientsimilarity search (here, nodes in the graph setting). In the context of summarization, itcan operate on the structure and labels of each node in order to efficiently find similarnodes that can be aggregated into a “coherent” group. Khan et al. [2014] propose toLSH-based graph summarization by iteratively computing minhash functions on nodeneighborhoods, combining these minhash functions into groups, computing hash codeson the groups, and then aggregating the nodes that have the same hash codes. To handlethe labels in the graph, adjacency and attribute lists are concatenated together beforehashing. Supernodes are used to combine nodes, and, unlike other works, virtual nodesare used to combine edges between groups of nodes. Here, MDL is used to measure therelative increases in compression efficiency achieved by grouping nodes to supernodesand edges to superedges.
We further note that MDL is used frequently for data that, while not explicitly mod-eled as a graph, can be implicitly viewed as such: R-KRIMP and RDB-KRIMP [Koopmanand Siebes 2008, 2009] summarize multi-relational data, which can be viewed as at-tributed graphs. The former, R-KRIMP, finds characteristic patterns in single datatables, then finds a small set of multi-relational characteristic item sets within thisreduced search space. The latter extends R-KRIMP by finding more expressive patterns.
3.3. Influence-based methodsInfluence-based summarization methods for labeled graphs are currently scarce. Therepresentative method in this category leverages both structural and node attributesimilarities to summarize the influence or diffusion process in a large-scale network.
The sole work in this category, VEGAS [Shi et al. 2015], summarizes influencepropagation in citation networks via a matrix decomposition-based algorithm. Thesummarization problem aims to find the community membership matrix H of thenodes (papers in the citation network) such that minH≥0 ||MG −HHT ||2F , where MG =AAT+ATA
2 is the node similarity matrix and A is the adjacency matrix. In the caseof labeled networks, MG is replaced with the generalized similarity matrix MD =(A
⊙AD)(A
⊙AD)T+(A
⊙AD)T (A
⊙AD)
2 to incorporate side information. Here,⊙
indicatesthe Hadamard or element-wise product of matrices, and AD, which may be specifiedby the user, encodes pairwise attribute similarity between nodes. In more detail, firstthe maximal influence graph G is computed from the input influence graph I by arooted graph search that follows the standard BFS/DFS implementation from sourcenode f . Then the matrices MG, AD, and MD are generated. Finally non-negativematrix factorization is used to solve the above optimization, yielding the communitymembership matrix H. Nodes are assigned to clusters according to the maximum valuein each row of H. Summaries are generated after link pruning, which is performed toselect the l best flows (links) for the final summary, dropping all other links.
4. DYNAMIC GRAPH SUMMARIZATION: PLAIN NETWORKSAnalyzing large and complex data is challenging by itself, so adding the dimension oftime makes the analysis even more challenging and time-consuming. Despite this, mostnetworks realistically do change over time: for example, communication patterns withothers via phone or social networks; the connection between servers in a network; theflow of information, news and rumors; the distance between connected vehicles; theinformation transmitted between devices in a smart home environment.
For this reason, the temporal graph mining literature is rich, mostly focusing on: lawsand patterns of graph evolution in [Leskovec and Faloutsos 2007; Ferlez et al. 2008;Leskovec et al. 2008, 2005; Sun et al. 2008] and a comprehensive survey by Aggarwaland Subbian in [2014]; anomaly and change detection in streaming graphs [Aggarwal
A:20 Y. Liu, T. Safavi, A. Dighe and D. Koutra
and Philip 2005] or time-evolving networks [Ferlez et al. 2008; Koutra et al. 2013,2015]; discovery of dense temporal cliques and bipartite cores using PARAFAC tensordecomposition and MDL ([Sun et al. 2007; Araujo et al. 2014; Koutra et al. 2012]);mining of cross-graph quasi-cliques [Pei et al. 2005]; clustering using incremental staticclustering [Xu et al. 2011] or a probabilistic approach based on mixed-membershipblockmodels [Fu et al. 2009]; sampling of streaming graphs [Ahmed et al. 2013] androle discovery [Henderson et al. 2012; Rossi et al. 2012].
In this section, we focus on methods that summarize time-evolving networks (thirdblock in Table I). Summarization techniques for time-evolving networks have not beenstudied to the same extent as those for static networks, possibly because of the newchallenges introduced by the dimension of time. The methods are sensitive to the choiceof time granularity, which is often chosen arbitrarily: depending on the application,granularity can be set to minutes, hours, days, weeks, months, years, or some other unitthat makes sense in a given setting. The continuous and sometimes irregular change ofreal-world graphs also complicates evolution tracking, defining online “interestingness”measures, and visualization. The dynamic graph summarization problem may bedefined as:
PROBLEM 3. Summarization of Dynamic, Plain Graphs.Given a dynamic graph, which is observed as a set of streaming edges, or a sequenceof adjacency matrices A1,A2, . . . ,AT corresponding to the static graphsG1, G2, . . . , GT
Find a temporal summary graph or a set of possibly overlapping temporal structuresto concisely describe the given dynamic graph.
The summary is a time-evolving supergraph with supernodes and superedges, or elsea sequence of sparsified graphs with fewer nodes/edges than the input dynamic graph.
The simplest approach treats a time-evolving graph as a series of static graph snap-shots, which allows the application of static graph summarization techniques on eachsnapshot. However, the effectiveness of this approach depends heavily on user-specifiedaggregation operations and the time granularity [Soundarajan et al. 2016], and thereis no globally established method for picking the “right” time unit. With small timegranularity, the amount of data increases significantly. With large time granularity, in-teresting dynamics may be missed. Moreover, real-world processes can be unpredictableor bursty. Adjusting the time unit of analysis may be the key to understanding andcapturing the important dynamics.
Fig. 9: Aggregated graph example (time t1+t2).
An alternative is to cre-ate an aggregate graph thatsummarizes the input dy-namic network based onthe recency and frequencyof interactions (Figure 9).This has been called an “ap-proximation graph” [Corteset al. 2001; Hill et al. 2006;Sharan and Neville 2008].Specifically, the interactionsbetween nodes in an approximation graph are aggregated over time and weighted byapplying kernel smoothing (e.g. exponential, inverse linear, linear, uniform), where morerecent edges are weighted higher than old edges. Edges with weight below a specifiedthreshold can also be pruned to simplify the graph approximation. The approximationgraph has been shown to be useful for telecommunications fraud detection [Corteset al. 2001], anomaly detection and prediction of user behavior in web logs and email
Graph Summarization Methods and Applications: A Survey A:21
networks [Hill et al. 2006], and attribute classification via relational classifier mod-els [Sharan and Neville 2008].
The approximation graph can be used as input to any of the static graph sum-marization algorithms presented in Section 2. However, this approach has the sameshortcoming as the straightforward approach—namely, it depends on the time granu-larity of the input graph sequence. Probabilistic relational models (PRM) and relationalMarkov decision processes (RMDP, which are a sequence of PRMs forming a chainthat follows a first-order Markov assumption) have also been used to model dynamicgraphs [Guestrin et al. 2003], but they cannot model time-varying edges and treat themas fixed over time.
4.1. Grouping-based methodsGrouping-based summarization approaches recursively aggregate nodes and timestepsto reduce the size of large-scale dynamic networks.
NETCONDENSE Adhikari et al. [2017] is a node-grouping approach that maintainsspecific properties of the original time-varying graph, like diffusive properties importantin marketing and influence dynamics, governed by its maximum eigenvalue. In thiscontext, given a dynamic network of T snapshots and an epidemiology model, thegoal is to find a reduced network series with few groups of nodes (supernodes) andgroups of timesteps so that the change in its maximum eigenvalue is minimized. In itsgeneral form, this problem is intractable, but it can be transformed into an equivalentstatic-graph problem with a well-conditioned, flattened network whose eigenvalue iseasy to compute and has similar diffusive properties as the original dynamic network.This observation allows solving the dynamic problem with an algorithm similar toCOARSENET [Purohit et al. 2014] (Section 2). In this case, after flattening the dynamicnetwork, NETCONDENSE repeatedly merges adjacent node pairs and adjacent timepairs, evaluating the change in the flattened network’s maximum eigenvalue. Thechanges are sorted in increasing order and the best node-/time-pairs are merged untilthe user-specified network size is achieved. NETCONDENSE uses transformations andapproximations to achieve sub-quadratic running time and linear space complexity.
In many applications such as network monitoring and urban planning, networkedges are observed sequentially. Traditional sketching techniques [Zhao et al. 2011;Cormode and Muthukrishnan 2005a] usually maintain only frequency counts, “dropping”the information of the graphical structure, although the goal in summarization is toboth construct a summarized graph in linear time and to support edge updates inconstant time. To this end, TCM [Tang et al. 2016] approximates a variety of graphqueries by creating and querying d graph sketches, and returning the minimum answer.Each graph sketch i is created by mapping the original nodes to “node buckets” orsupernodes via a hash function hi. The edges between supernodes in the graph sketchare superedges corresponding to the sum of the connections between their constituentnodes. The more pairwise independent hash functions (sketches) are used, the lower theprobability of hash collisions and thus the more precise are the answers to the queries.By maintaining the graphical structure, TCM supports complex analytics over graphstreams, such as conditional node queries, aggregated edge weights, aggregated nodeflows, reachability path queries, aggregate subgraph queries, triangles, and more.
4.2. Bit compression-based methodsThe techniques in this category use compression as a means of extracting meaningfulpatterns from temporal data. This category’s only representative is TIMECRUNCH [Shahet al. 2015], which succinctly describes a large dynamic graph with a set of importanttemporal structures. Extending VOG [Koutra et al. 2014a] (Section 2.2), the authorsformalize temporal graph summarization as an information-theoretic optimization
A:22 Y. Liu, T. Safavi, A. Dighe and D. Koutra
problem where the goal is to identify the temporal behaviors of local static structuresthat collectively minimize the global description length of the dynamic graph. A lexiconthat describes various types of temporal behavior (flickering, periodic, one-shot) isintroduced to augment the vocabulary of static graphs (stars, cliques, bipartite cores,chains).
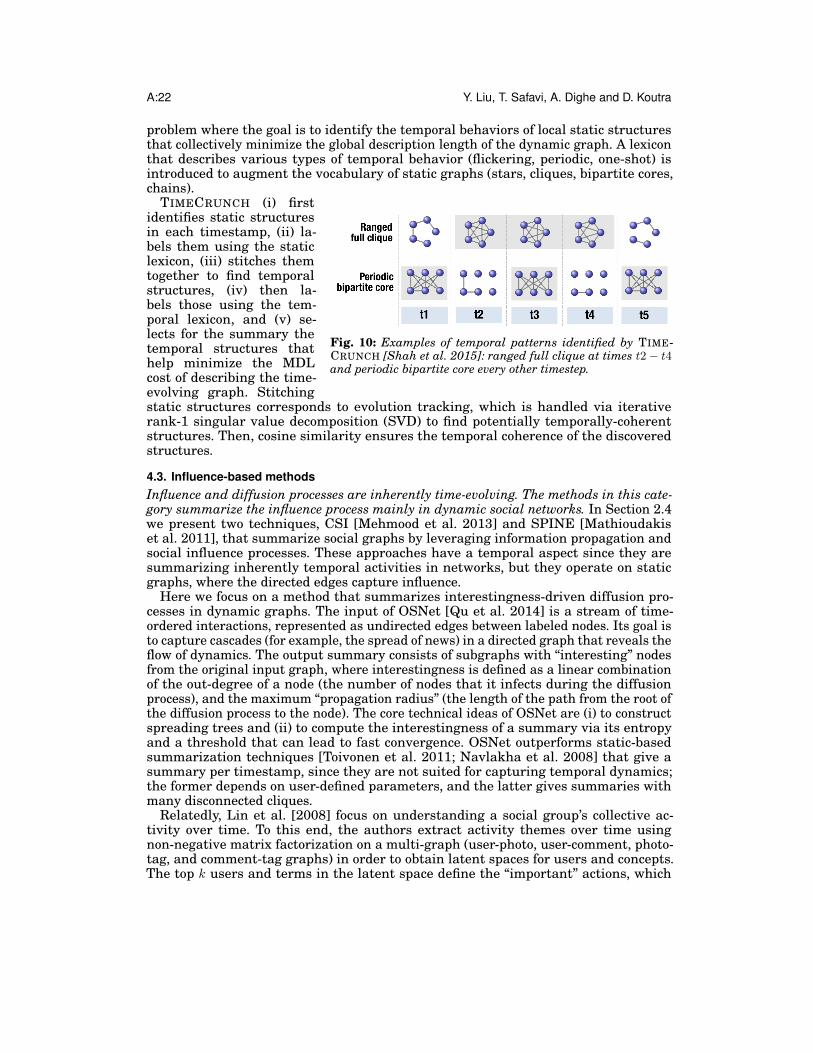
Fig. 10: Examples of temporal patterns identified by TIME-CRUNCH [Shah et al. 2015]: ranged full clique at times t2− t4and periodic bipartite core every other timestep.
TIMECRUNCH (i) firstidentifies static structuresin each timestamp, (ii) la-bels them using the staticlexicon, (iii) stitches themtogether to find temporalstructures, (iv) then la-bels those using the tem-poral lexicon, and (v) se-lects for the summary thetemporal structures thathelp minimize the MDLcost of describing the time-evolving graph. Stitchingstatic structures corresponds to evolution tracking, which is handled via iterativerank-1 singular value decomposition (SVD) to find potentially temporally-coherentstructures. Then, cosine similarity ensures the temporal coherence of the discoveredstructures.
4.3. Influence-based methodsInfluence and diffusion processes are inherently time-evolving. The methods in this cate-gory summarize the influence process mainly in dynamic social networks. In Section 2.4we present two techniques, CSI [Mehmood et al. 2013] and SPINE [Mathioudakiset al. 2011], that summarize social graphs by leveraging information propagation andsocial influence processes. These approaches have a temporal aspect since they aresummarizing inherently temporal activities in networks, but they operate on staticgraphs, where the directed edges capture influence.
Here we focus on a method that summarizes interestingness-driven diffusion pro-cesses in dynamic graphs. The input of OSNet [Qu et al. 2014] is a stream of time-ordered interactions, represented as undirected edges between labeled nodes. Its goal isto capture cascades (for example, the spread of news) in a directed graph that reveals theflow of dynamics. The output summary consists of subgraphs with “interesting” nodesfrom the original input graph, where interestingness is defined as a linear combinationof the out-degree of a node (the number of nodes that it infects during the diffusionprocess), and the maximum “propagation radius” (the length of the path from the root ofthe diffusion process to the node). The core technical ideas of OSNet are (i) to constructspreading trees and (ii) to compute the interestingness of a summary via its entropyand a threshold that can lead to fast convergence. OSNet outperforms static-basedsummarization techniques [Toivonen et al. 2011; Navlakha et al. 2008] that give asummary per timestamp, since they are not suited for capturing temporal dynamics;the former depends on user-defined parameters, and the latter gives summaries withmany disconnected cliques.
Relatedly, Lin et al. [2008] focus on understanding a social group’s collective ac-tivity over time. To this end, the authors extract activity themes over time usingnon-negative matrix factorization on a multi-graph (user-photo, user-comment, photo-tag, and comment-tag graphs) in order to obtain latent spaces for users and concepts.The top k users and terms in the latent space define the “important” actions, which
Graph Summarization Methods and Applications: A Survey A:23
correspond to activity themes. Evolution of themes over time is tracked by applyingcosine similarity between their corresponding latent spaces, similar to the evolutiontracking component of TIMECRUNCH [Shah et al. 2015], which also uses cosine simi-larity to ensure temporal coherence. Lin et al. [2008] visualize the themes as bubblesconnected by edges, each of which has a length inversely proportional to the similarityof the themes.Connections to graph clustering, sparsification, and compression. As withstatic graphs, techniques such as clustering, sparsification and compression are relatedto summarization methods for dynamic graphs. Some clustering methods extend heuris-tics that have been used for static graphs, such as modularity [Gorke et al. 2010] orminimum-cut trees [Saha and Mitra 2007], and others introduce definitions specificto the temporal domain [Tantipathananandh and Berger-Wolf 2011]. As discussed inSection 2, graph sketches [Ahn et al. 2012; Liberty 2013] summarize large amountsof data by applying linear projections. The property of linearity is fundamental, as itmakes sketches applicable to the analysis of streaming graphs in centralized or even dis-tributed settings, where they are partitioned in multiple servers with MapReduce [Deanand Ghemawat 2004]. One-pass and other efficient streaming algorithms with theirtheoretical analysis are given in [Ahn et al. 2012].
Work on compressing dynamic graphs for storage includes lossy compression of time-evolving graphs [Henecka and Roughan 2015], and encoding of dynamic, weightedgraphs as three-dimensional arrays (tensor) by reducing heterogeneity and guarantee-ing compression error within bounds [Liu et al. 2012]. The latter is based on hierarchicalclusters of edge weights and graph compression using run-length encoding, travers-ing first the tensor’s time dimension and second the tensor’s vertex dimensions. Thismethod maintains the connectivity of the graph as defined by the average shortestpaths over all pairs of connected nodes. Thus, it handles related queries with goodapproximations.
5. GRAPH SUMMARIZATION IN REAL-WORLD APPLICATIONSAs we mention in the introduction, summarization helps mitigate information overload.In this section, we discuss real-world applications of graph summarization, which aremyriad and relevant in many domains.
5.1. Summarization for query handling and efficiencyGraph summarization can greatly improve query execution and efficiency across dif-ferent graph-specific queries. Such queries may seek node-related information likedegree, PageRank, or participating triangles, or look to identify or match subgraphswithin a larger graph. Table II outlines several types of queries used to evaluate graphsummarization methods.
Pattern-matching queries are extremely common on graph databases. For example,across star queries involving nodes of different degrees, graph dedensification [Maccioniand Abadi 2016] improves query efficiency as the size of the queried graph increases,yielding the best improvements (up to 10× speedup) for queries involving only high-degree nodes (Section 2). Fan et al. [2012] propose an attributed graph compressionmethod and query transformation scheme for lossless pattern matching queries, achiev-ing a compression rate up to 92% and runtime reduction up to 70% (Section 3). From asystems point of view, Cebiric et al. [2015] propose query-oriented graph summarizationon Resource Description Framework (RDF) graphs, which are the standard model forW3C web resources. Many methods for pattern matching queries also exist outsidegraph summarization in databases and graph analytics [Tong et al. 2007; Tian andPatel 2008; Fan et al. 2013; Pienta et al. 2014], but these are beyond our survey’s scope.
A:24 Y. Liu, T. Safavi, A. Dighe and D. Koutra
Table II: Qualitative comparison of summarization approaches for query handling.
Method
Query Type
Graph Type
Star
Nei
ghbo
rhoo
d
Deg
ree
Tri
angl
es
Patt
.Mat
chin
g
Rea
chab
ility
Page
Ran
k
Graph dedensification [Maccioni and Abadi 2016] (§2) 3 3 social, weblp-reconstr. Error [Riondato et al. 2014] (§2) 3 3 3 socialQuery-pres. [Fan et al. 2012] (§3) 3 3 citation, social, webNeighbor friendly compr. [Maserrat and Pei 2010] (§2) 3 socialGraSS [LeFevre and Terzi 2010] (§2) 3 3 co-authorship, wikiS-Node [Raghavan and Garcia-Molina 2003] (§3) 3 3 collaboration, webd-summaries [Song et al. 2016] (§3) 3 3 knowledge graph
Summarization has been shown to improve query efficiency in diverse domains. Forexample, a typical query on a social network graph might ask whether an edge existsbetween two nodes, or more generally whether there exists a path between two nodes.Such a query can be answered on a space-efficient summary of an expected adjacencymatrix [Riondato et al. 2014]. This approach constructs the graph summary up to12500× faster than its baseline GraSS [LeFevre and Terzi 2010], and also achieveslower average query error. Another application is on Web graphs [Raghavan andGarcia-Molina 2003]: here, the S-Node representation (Section 3) outperforms otherrepresentation schemes by an order of magnitude on complex web navigation queries byloading only a relatively small number of intranode and superedge graphs and avoidingdisk I/Os when possible, leading to 75-90% reduction in navigation time compared tobaselines. A final application is knowledge graphs [Song et al. 2016], which lead to upto 40× speedup over an optimized frequent subgraph mining algorithm on generatedknowledge graphs for a variety of subgraph queries.
5.2. Summarization for visualization and pattern discovery
Fig. 11: Example of simplifiednetwork with one clique mo-tif glyph and one star motifglyph [Dunne and Shneider-man 2013].
Summarization can enable visualization of data too largeto load, display, and interactively explore in original rawformat. For example, Shen et al. [2006] apply OntoVis(Section 2.3) on a large heterogeneous movie networkconsisting of 8 node types (person, movie, role etc.) with35,000 nodes and 108,000 links: though relatively small,this graph is still too dense to fit on a desktop screen. Toinvestigate the relationships between persons and roles,the authors visually observe the summarized networkand identify a role-actor relationship where a good actorshould be able to play different roles (for example, actorslike Woody Allen and Sandra Bullock play three differ-ent types of roles). Other works that perform visualiza-tion on top of summarization include VOG [Koutra et al.2014b], which visualizes structures of specific types (e.g.cliques, bipartite cores), and Motif Simplification [Dunneand Shneiderman 2013], which visualizes simplified net-works of up to 8,000 nodes with glyphs, a toy example of which is given in Figure 11.
Summarization also supports pattern discovery by maintaining “interesting” or“salient” patterns. Consider the Wikipedia-Controversy dataset, in which nodes areWikipedia contributors and edges connect users who edit the same part of the article.
Graph Summarization Methods and Applications: A Survey A:25
Koutra et al. [2014b] apply VOG on this graph to extract the 10 most informative struc-tures, obtaining 8 stars and 2 bipartite subgraphs. The centers of the stars correspondto admins or heavily active contributors. The bipartite cores correspond to edit warsbetween groups of users, like vandals and responsible editors, on a controversial topic.
SUBDUE [Cook and Holder 1994], one of the most famous frequent-pattern miningmethods, is applied in areas as diverse as chemical compound analysis, scene analysis,and CAD circuit design analysis. For example, SUBDUE discovers substructures inchemical compound graphs where atoms are vertices and edges are bonds, in particulardiscovering the building-block components that are heavily used, such as isoprene unitsfor rubber compounds.
5.3. Summarization for influence extractionInfluence analysis is a long-standing research focus and objective of graph mining. Ingraph summarization, Li and Lin [2009] use egocentric abstraction to extract influencefrom a simulated heterogeneous crime dataset with nodes as gangs and edges as gangrelations. In a user study, they demonstrate that the graph abstraction leads to moreaccurate, efficient, and confident identification of high-level crime-committing gangs.Furthermore, it is demonstrated that each abstraction view captures different parts ofkey criminal evidence to some extent: for example, “the gang has hired a middlemanintending to commit a crime”.
Another example is COARSENET [Purohit et al. 2014]: applied on cascade networkFlixster of 56,000 nodes and 560,000 edges, it is demonstrated that a large fractionof movies propagate in a small number of groups with a multi-modal distribution,suggesting movies have multiple scales of spread. Finally, Mehmood et al. [2013] usecommunity-level social influence analysis on Yahoo! and Twitter graphs to observealmost no correlation between influence and link probabilities. In other words, it isdemonstrated that influence relationships do not in general exhibit any clear structure.Even dense communities do not necessarily exhibit strong internal influence.
6. CONCLUSIONIn this survey we present the state-of-the-art in graph summarization. Distinguishingbetween types of input graph and core summarization techniques, we propose a tax-onomy to categorize existing graph summarization algorithms. We introduce the keydetails of each algorithm and explore relations between relevant works and methods,also providing examples of real-life applications for each algorithm category. Here, wepoint readers to important open problems in the field.
6.1. Open Research ProblemsWhile graph summarization research is advancing, the field is still relatively new andunderexplored. First, further work is to be done in handling diverse input data types.There does not yet exist work on summarizing temporal graphs with side information,even though many real-world networks, like social networks, can easily (and perhapsmost accurately) be modeled as temporal attributed graphs. Even beyond the temporalaspect, other static graph types have yet to be addressed. An example is the multi-layergraph, which is an important model for Web graphs [Laura et al. 2002]; another is themultiview graph, which can be “viewed” from its different edge types. For instance, aTwitter graph could comprise separate adjacency matrices for follows, retweets, andmessages. As data become increasingly richer, methods will need to handle graphs thatcomprise multiple views or incorporate other types of data, like time series associatedwith network nodes.
Another area of improvement is standardizing, generalizing, or extending algorithmicand evaluation techniques. For example, numerous methods tailored toward query
A:26 Y. Liu, T. Safavi, A. Dighe and D. Koutra
efficiency on graph summaries exist, but they either perform approximate queries or arelimited to very specific exact queries. Further work should address lossless compressionwith general-purpose queries. Another example is labeled graphs: existing methodsgroup nodes with cohesive attribute values, but in some applications heterogeneousclusters are crucial. For example, such clusters could facilitate anomaly detection orelse refer to groups with desired diversity, as in an academic or professional setting.In terms of evaluation, current measures are also usually highly application-specific.Compression-based methods are evaluated on compression quality; query-orientedmethods are evaluated on query latency; and so on. Some common evaluation metricscan make comparison of new and established approaches easier: for example, metricsthat evaluate supergraphs on sparsity, least information loss, and ease of visualization.
Finally, a promising new direction is graph summarization using deep node representa-tions learned automatically from the context encoded in the graph. Node representationlearning has attracted significant interest in recent years [Perozzi et al. 2014; Groverand Leskovec 2016; Wang et al. 2016; Tang et al. 2015]. Given the existence of summa-rization methods using latent node representations (e.g., via factorization) or manuallyselected node/egonet/k-hop neighborhood features, as well as the recent successes ofdeep learning, deep node representations for summarization naturally seem promising.
Overall, summarization methods are becoming increasingly important and useful asthe volume of available interconnected data rapidly grows. While we overview severalformulations of graph summarization already studied, we conclude by noting that manypromising directions in the field remain unexplored and thus full of potential for impact.
References
Bijaya Adhikari, Yao Zhang, Aditya Bharadwaj, and B Aditya Prakash. 2017. Con-densing Temporal Networks using Propagation. In Proceedings of the 2017 SIAMInternational Conference on Data Mining. SIAM, 417–425.
Charu Aggarwal and Karthik Subbian. 2014. Evolutionary Network Analysis: A Survey.ACM Computing Surveys (CSUR) 47, 1 (2014), 10:1–10:36.
Charu C Aggarwal. 2015. Data Mining: The Textbook. Springer.Charu C Aggarwal and S Yu Philip. 2005. Online Analysis of Community Evolution in
Data Streams. In SDM. SIAM.Charu C Aggarwal and Haixun Wang. 2010. A Survey of Clustering Algorithms for
Graph Data. In Managing and mining graph data. Springer, 275–301.Amr Ahmed, Nino Shervashidze, Shravan Narayanamurthy, Vanja Josifovski, and
Alexander J Smola. 2013. Distributed Large-Scale Natural Graph Factorization.International World Wide Web Conferences Steering Committee, 37–48.
Kook Jin Ahn, Sudipto Guha, and Andrew McGregor. 2012. Graph Sketches: Sparsifica-tion, Spanners, and Subgraphs. In Proceedings of the 31st ACM SIGACT-SIGMOD-SIGART Symposium on Principles of Database Systems. 5–14.
Sebastian E Ahnert. 2013. Power graph compression reveals dominant relationships ingenetic transcription networks. Molecular BioSystems 9, 11 (2013), 2681–2685.
Alfred V. Aho, M. R. Garey, and Jeffrey D. Ullman. 1972. The Transitive Reduction of aDirected Graph. Siam Journal on Computing 1 (1972), 131–137. Issue 2.
Leman Akoglu*, Duen Horng Chau*, U Kang*, Danai Koutra*, and Christos Faloutsos.2012. OPAvion: Mining and Visualization in Large Graphs. ACM, 717–720.
Leman Akoglu, Mary McGlohon, and Christos Faloutsos. 2010. OddBall: SpottingAnomalies in Weighted Graphs. In PAKDD.
Leman Akoglu, Hanghang Tong, Jilles Vreeken, and Christos Faloutsos. 2012. Fast andReliable Anomaly Detection in Categorical Data. In CIKM. ACM.
Charles J Alpert, Andrew B Kahng, and So-Zen Yao. 1999. Spectral partitioning with
Graph Summarization Methods and Applications: A Survey A:27
multiple eigenvectors. Discrete Applied Mathematics 90, 1 (1999), 3–26.Alexandr Andoni and Piotr Indyk. 2008. Near-optimal Hashing Algorithms for Ap-
proximate Nearest Neighbor in High Dimensions. Commun. ACM 51, 1 (Jan. 2008),117–122.
Alberto Apostolico and Guido Drovandi. 2009. Graph Compression by BFS. Algorithms2, 3 (2009), 1031–1044.
Miguel Araujo, Spiros Papadimitriou, Stephan Gunnemann, Christos Faloutsos, Prith-wish Basu, Ananthram Swami, Evangelos E Papalexakis, and Danai Koutra. 2014.Com2: Fast Automatic Discovery of Temporal (“Comet”) Communities. Springer,271–283.
Mathieu Bastian, Sebastien Heymann, and Mathieu Jacomy. 2009. Gephi: An OpenSource Software for Exploring and Manipulating Networks.
Joshua D. Batson, Daniel A. Spielman, Nikhil Srivastava, and Shang-Hua Teng. 2013.Spectral sparsification of graphs: theory and algorithms. Commun. ACM 56, 8 (2013),87–94. DOI:http://dx.doi.org/10.1145/2492007.2492029
Enrico Bertini and Giuseppe Santucci. 2004. By Chance is not Enough: PreservingRelative Density through non Uniform Sampling. In Proceedings of the InformationVisualisation.
Paolo Boldi and Sebastiano Vigna. 2004. The WebGraph Framework I: Compressiontechniques. In International World Wide Web Conference. 595–602.
Michael Bostock, Vadim Ogievetsky, and Jeffrey Heer. 2011. D3 Data-Driven Docu-ments. IEEE Transactions on Visualization and Computer Graphics 17, 12 (Dec.2011), 2301–2309. DOI:http://dx.doi.org/10.1109/TVCG.2011.185
Gregory Buehrer and Kumar Chellapilla. 2008. A Scalable Pattern Mining Approach toWeb Graph Compression With Communities. ACM, 95–106.
Gemma Casas-Garriga. 2005. Summarizing Sequential Data with Closed Partial Orders.In SDM. 380–391.
Selja Cebiric, Francois Goasdoue, and Ioana Manolescu. 2015. Query-Oriented Summa-rization of RDF Graphs. Proceedings of the VLDB Endowment 8, 12 (2015).
Deepayan Chakrabarti, Spiros Papadimitriou, Dharmendra S. Modha, and ChristosFaloutsos. 2004. Fully Automatic Cross-associations. In KDD. 79–88.
Varun Chandola and Vipin Kumar. 2005. Summarization – Compressing Data Into anInformative Representation. In ICDM. 98–105.
Duen Horng Chau, Aniket Kittur, Jason I. Hong, and Christos Faloutsos. 2011. Apolo:Making Sense of Large Network Data by Combining Rich User Interaction andMachine Learning. In KDD.
Chen Chen, Cindy X Lin, Matt Fredrikson, Mihai Christodorescu, Xifeng Yan, andJiawei Han. 2009. Mining Graph Patterns Efficiently Via Randomized Summaries.VLDB 2, 1 (2009), 742–753.
Flavio Chierichetti, Ravi Kumar, Silvio Lattanzi, Michael Mitzenmacher, AlessandroPanconesi, and Prabhakar Raghavan. 2009. On Compressing Social Networks. InKDD. 219–228.
Yongwook Choi and Wojciech Szpankowski. 2012. Compression of Graphical Struc-tures: Fundamental Limits, Algorithms, and Experiments. IEEE Transactions onInformation Theory 58, 2 (2012), 620–638.
Rudi Cilibrasi and Paul Vitanyi. 2005. Clustering by Compression. IEEE TIT 51, 4(2005), 1523–1545.
Diane J. Cook and Lawrence B. Holder. 1994. Substructure Discovery Using MinimumDescription Length and Background Knowledge. JAIR 1 (1994), 231–255.
Graham Cormode and S. Muthukrishnan. 2005a. An Improved Data Stream Summary:The Count-min Sketch and Its Applications. J. Algorithms 55, 1 (April 2005), 58–75.
Graham Cormode and S. Muthukrishnan. 2005b. Summarizing and Mining Skewed
A:28 Y. Liu, T. Safavi, A. Dighe and D. Koutra
Data Streams. In SDM.Corinna Cortes, Daryl Pregibon, and Chris Volinsky. 2001. Communities of Interest.
In Proceedings of the 4th International Conference on Advances in Intelligent DataAnalysis. Springer-Verlag, 105–114.
Uros Damnjanovic, Virginia Fernandez Arguedas, Ebroul Izquierdo, and Jose M.Martınez. 2008. Event Detection and Clustering for Surveillance Video Summa-rization. IEEE Computer Society, 63–66.
Jeffrey Dean and Sanjay Ghemawat. 2004. MapReduce: Simplified Data Processing onLarge Clusters. (Dec. 2004).
Inderjit Dhillon, Yuqiang Guan, and Brian Kulis. 2005. A Fast Kernel-based MultilevelAlgorithm for Graph Clustering. In KDD. ACM, 629–634.
Laxman Dhulipala, Igor Kabiljo, Brian Karrer, Giuseppe Ottaviano, Sergey Pupyrev,and Alon Shalita. 2016. Compressing Graphs and Indexes with Recursive GraphBisection. arXiv preprint arXiv:1602.08820 (2016).
P. Drineas, R. Kannan, and M. W. Mahoney. 2006. Fast Monte Carlo Algorithms forMatrices III: Computing a Compressed Approximate Matrix Decomposition. SIAMJournal on Computing SICOMP 36, 1 (2006), 184–206.
Cody Dunne and Ben Shneiderman. 2013. Motif Simplification: Improving NetworkVisualization Readability with Fan, Connector, and Clique Glyphs. In Proceedingsof the SIGCHI Conference on Human Factors in Computing Systems (CHI). ACM,3247–3256.
P. Elias. 2006. Universal Codeword Sets and Representations of the Integers. IEEETrans. Inf. Theor. 21, 2 (Sept. 2006), 194–203.
Wenfei Fan, Xin Wang, and Yinghui Wu. 2013. Diversified Top-k Graph PatternMatching. Proc. VLDB Endow. 6, 13 (Aug. 2013), 1510–1521.
Jing Feng, Xiao He, Nina Hubig, Christian Bohm, and Claudia Plant. 2013.Compression-Based Graph Mining Exploiting Structure Primitives. In ICDM. IEEE,181–190.
Jure Ferlez, Christos Faloutsos, Jure Leskovec, Dunja Mladenic, and Marko Grobelnik.2008. Monitoring Network Evolution using MDL. In Proceedings of the 24th Interna-tional Conference on Data Engineering, ICDE 2008, April 7-12, 2008, Cancun, Mexico.1328–1330.
Wenjie Fu, Le Song, and Eric P. Xing. 2009. Dynamic Mixed Membership Blockmodelfor Evolving Networks. In Proceedings of the 26th Annual International Conferenceon Machine Learning (ICML ’09). ACM, New York, NY, USA, 329–336.
Johannes Gehrke, Edward Lui, and Rafael Pass. 2003. Towards Privacy for SocialNetworks: a Zero-Knowledge Based Definition of Privacy. In Proceedings of the 8thConference on Theory of Cryptography. IACR, 432–449.
Mina Ghashami, Edo Liberty, and Jeff M Phillips. 2016. Efficient Frequent DirectionsAlgorithm for Sparse Matrices. arXiv preprint arXiv:1602.00412 (2016).
Sean Gilpin, Tina Eliassi-Rad, and Ian Davidson. 2013. Guided Learning for RoleDiscovery (GLRD): Framework, Algorithms, and Applications. In Proceedings of the19th ACM SIGKDD International Conference on Knowledge Discovery and DataMining (KDD ’13). ACM, New York, NY, USA, 113–121.
Oshini Goonetilleke, Danai Koutra, Timos Sellis, and Kewen Liao. 2017. Edge LabelingSchemes for Graph Data. In Proceedings of the 29th International Conference onScientific and Statistical Database Management. ACM, Article 12, 12 pages.
Robert Gorke, Pascal Maillard, Christian Staudt, and Dorothea Wagner. 2010.Modularity-Driven Clustering of Dynamic Graphs. In Experimental Algorithms, 9thInternational Symposium, SEA 2010, Ischia Island, Naples, Italy, May 20-22, 2010.
Graph Summarization Methods and Applications: A Survey A:29
Proceedings. 436–448.Szymon Grabowski and Wojciech Bieniecki. 2014. Tight and Simple Web Graph Com-
pression For Forward and Reverse Neighbor Queries. Discrete Applied Mathematics163 (2014), 298–306.
Carlos Guestrin, Daphne Koller, Chris Gearhart, and Neal Kanodia. 2003. GeneralizingPlans to New Environments in Relational MDPs. In Eighteenth International JointConference on Artificial Intelligence (IJCAI). Acapulco, Mexico.
Mohammad Al Hasan, Nesreen K. Ahmed, and Jennifer Neville. 2013. Network Sam-pling: Methods and Applications. https://www.cs.purdue.edu/homes/neville/courses/NetworkSampling-KDD13-final.pdf. (2013). Tutorial.
Nasrin Hassanlou, Maryam Shoaran, and Alex Thomo. 2013. Probabilistic GraphSummarization. In Web-Age Information Management. Springer, 545–556.
Keith Henderson, Brian Gallagher, Tina Eliassi-Rad, Hanghang Tong, Sugato Basu,Leman Akoglu, Danai Koutra, Christos Faloutsos, and Lei Li. 2012. RolX: StructuralRole Extraction & Mining in Large Graphs. In KDD. ACM, 1231–1239.
Keith Henderson, Brian Gallagher, Lei Li, Leman Akoglu, Tina Eliassi-Rad, HanghangTong, and Christos Faloutsos. 2011. It’s who you know: graph mining using recursivestructural features.. In KDD. ACM, 663–671.
Wilko Henecka and Matthew Roughan. 2015. Lossy Compression of Dynamic, WeightedGraphs. In Future Internet of Things and Cloud (FiCloud), 2015 3rd InternationalConference on. 427–434.
Shawndra Hill, Deepak Agarwal, Robert Bell, and Chris Volinsky. 2006. Buildingan Effective Representation for Dynamic Networks. Journal of Computational andGraphical Statistics 15 (2006), 1–25.
Christian Hubler, Hans-Peter Kriegel, Karsten Borgwardt, and Zoubin Ghahramani.2008. Metropolis Algorithms for Representative Subgraph Sampling. In Proceedingsof the 2008 Eighth IEEE International Conference on Data Mining (ICDM ’08). IEEEComputer Society, Washington, DC, USA, 283–292.
Di Jin and Danai Koutra. 2017. Exploratory Analysis of Graph Data by LeveragingDomain Knowledge. In 2017 IEEE International Conference on Data Mining. 187–196.
Di Jin, Aristotelis Leventidis, Haoming Shen, Ruowang Zhang, Junyue Wu, and DanaiKoutra. 2017. PERSEUS-HUB: Interactive and Collective Exploration of Large-scaleGraphs. Informatics (Special Issue “Scalable Interactive Visualization”) 4, 3 (2017).Issue 2227-9709.
U Kang, Jay-Yoon Lee, Danai Koutra, and Christos Faloutsos. 2014. Net-Ray: Visualiz-ing and Mining Web-Scale Graphs.
U Kang, Hanghang Tong, Jimeng Sun, Ching-Yung Lin, and Christos Faloutsos. 2011.Gbase: A Scalable and General Graph Management System. In KDD. ACM, 1091–1099.
U Kang, Charalampos E. Tsourakakis, and Christos Faloutsos. 2009. PEGASUS: APeta-Scale Graph Mining System - Implementation and Observations. ICDM (2009).
George Karypis and Vipin Kumar. 1999. Multilevel k-way Hypergraph Partitioning.343–348.
David Kempe, Jon Kleinberg, and Eva Tardos. 2003. Maximizing the spread of influ-ence through a social network. In Conference of the ACM Special Interest Group onKnowledge Discovery and Data Mining. ACM Press, New York, NY.
Kifayat Ullah Khan, Waqas Nawaz, and Young-Koo Lee. 2014. Set-Based UnifiedApproach for Attributed Graph Summarization. In IEEE Fourth International Con-ference on Big Data and Cloud Computing (BdCloud). IEEE, 378–385.
A:30 Y. Liu, T. Safavi, A. Dighe and D. Koutra
Arne Koopman and Arno Siebes. 2008. Discovering Relational Items Sets Efficiently.In SDM. 108–119.
Arne Koopman and Arno Siebes. 2009. Characteristic Relational Patterns. In KDD.437–446.
Danai Koutra, Di Jin, Yuanchi Ning, and Christos Faloutsos. 2015. Perseus: An Inter-active Large-Scale Graph Mining and Visualization Tool. In VLDB (demo).
Danai Koutra, U Kang, Jilles Vreeken, and Christos Faloutsos. 2014a. VoG: Summariz-ing and Understanding Large Graphs. In SDM. 91–99.
Danai Koutra, U Kang, Jilles Vreeken, and Christos Faloutsos. 2014b. VOG: Summa-rizing and Understanding Large Graphs. In SDM. SIAM.
Danai Koutra, Evangelos E Papalexakis, and Christos Faloutsos. 2012. TensorSplat:Spotting Latent Anomalies in Time. In Informatics (PCI), 2012 16th PanhellenicConference on. IEEE, 144–149.
Danai Koutra, Neil Shah, Joshua Vogelstein, Brian Gallagher, and Christos Faloutsos.2015. DeltaCon: A Principled Massive-Graph Similarity Function with Attribution.ACM Transactions on Knowledge Discovery from Data (2015).
Danai Koutra, Joshua Vogelstein, and Christos Faloutsos. 2013. DeltaCon: A PrincipledMassive-Graph Similarity Function. In SDM. 162–170.
Luigi Laura, Stefano Leonardi, Guido Caldarelli, and Paolo De Los Rios. 2002. A Multi-Layer Model for the Web Graph. In In On-line proceedings of the 2nd InternationalWorkshop on Web Dynamics.
Matthijs van Leeuwen, Jilles Vreeken, and Arno Siebes. 2006. Compression Picks theItem Sets that Matter. In PKDD. 585–592.
Kristen LeFevre and Evimaria Terzi. 2010. GraSS: Graph Structure Summarization.In SDM. SIAM, 454–465.
Jure Leskovec, Lars Backstrom, Ravi Kumar, and Andrew Tomkins. 2008. Microscopicevolution of social networks. In KDD. 462–470.
Jure Leskovec and Christos Faloutsos. 2007. Scalable modeling of real graphs usingKronecker multiplication. In Machine Learning, Proceedings of the Twenty-FourthInternational Conference (ICML 2007), Corvalis, Oregon, USA, June 20-24, 2007.497–504.
Jure Leskovec, Jon M. Kleinberg, and Christos Faloutsos. 2005. Graphs over time:densification laws, shrinking diameters and possible explanations. In Proceedings ofthe Eleventh ACM SIGKDD International Conference on Knowledge Discovery andData Mining, Chicago, Illinois, USA, August 21-24, 2005. 177–187.
Jure Leskovec, Anand Rajaraman, and Jeffrey David Ullman. 2014. Mining of MassiveDatasets. Cambridge University Press.
Cheng-Te Li and Shou-De Lin. 2009. Egocentric Information Abstraction for heteroge-neous social networks. In International Conference on Advances in Social NetworkAnalysis and Mining (ASONAM). IEEE, 255–260.
Edo Liberty. 2013. Simple and Deterministic Matrix Sketching. ACM, 581–588.Yongsub Lim, U Kang, and Christos Faloutsos. 2014. SlashBurn: Graph Compression
and Mining beyond Caveman Communities. IEEE Transactions on Knowledge andData Engineering 26, 12 (2014), 3077–3089.
Shou-De Lin, Mi-Yen Yeh, and Cheng-Te Li. 2013. Sampling and Summarization forSocial Networks. http://mslab.csie.ntu.edu.tw/tut-pakdd13/, PAKDD 2013 Tutorial(2013).
Xuemin Lin, Qing Liu, Yidong Yuan, and Xiaofang Zhou. 2003. Multiscale Histograms:Summarizing Topological Relations in Large Spatial Datasets. In International Con-ference on Very Large Databases (VLDB), Johann Christoph Freytag, Peter C. Locke-mann, Serge Abiteboul, Michael J. Carey, Patricia G. Selinger, and Andreas Heuer(Eds.). Morgan Kaufmann Publishers, Inc, Berlin, Germany, 814–825.
Graph Summarization Methods and Applications: A Survey A:31
Yu-Ru Lin, Hari Sundaram, and Aisling Kelliher. 2008. Summarization of SocialActivity Over Time: People, Actions and Concepts in Dynamic Networks. In CIKM.1379–1380.
Bing Liu, Wynne Hsu, and Yiming Ma. 1999. Pruning and Summarizing the DiscoveredAssociations. In Fifth ACM SIGKDD Intl Conf. Knowledge Discovery and Data Mining(KDD 99). 145–154.
Chunyang Liu and Ling Chen. 2016. Summarizing Uncertain Transaction Databasesby Probabilistic Tiles. In International Joint Conference on Neural Networks (IJCNN).IEEE, 4375–4382.
Wei Liu, Andrey Kan, Jeffrey Chan, James Bailey, Christopher Leckie, Jian Pei, andRamamohanarao Kotagiri. 2012. On Compressing Weighted Time-evolving Graphs. InProceedings of the 21st ACM International Conference on Information and KnowledgeManagement (CIKM ’12). ACM, New York, NY, USA, 2319–2322.
Yike Liu, Neil Shah, and Danai Koutra. 2015. An Empirical Comparison of the Sum-marization Power of Graph Clustering Methods. arXiv preprint arXiv:1511.06820(2015).
Yucheng Low, Danny Bickson, Joseph Gonzalez, Carlos Guestrin, Aapo Kyrola, andJoseph M. Hellerstein. 2012. Distributed GraphLab: A Framework for MachineLearning and Data Mining in the Cloud. Proceedings of the VLDB Endowment 5, 8(2012), 716–727.
Antonio Maccioni and Daniel J. Abadi. 2016. Scalable Pattern Matching over Com-pressed Graphs via Dedensification. ACM, 1755–1764.
Arun S. Maiya and Tanya Y. Berger-Wolf. 2010. Sampling Community Structure. InWWW. ACM, New York, NY, USA, 701–710.
M. Mampaey, J. Vreeken, and N. Tatti. 2011. Summarizing Data with Itemsets usingMaximum Entropy Models. Technical Report 2011/02. University of Antwerp. http://adrem.ua.ac.be/publications.
Sebastian Maneth and Fabian Peternek. 2016. Compressing graphs by grammars.In Data Engineering (ICDE), 2016 IEEE 32nd International Conference on. IEEE,109–120.
Koji Maruhashi, Fan Guo, and Christos Faloutsos. 2011. MultiAspectForensics: PatternMining on Large-Scale Heterogeneous Networks with Tensor Analysis. In Proceedingsof the 2011 International Conference on Advances in Social Networks Analysis andMining. 203–210.
Hossein Maserrat and Jian Pei. 2010. Neighbor Query Friendly Compression of SocialNetworks. In KDD.
Hossein Maserrat and Jian Pei. 2012. Community Preserving Lossy Compression ofSocial Networks. In ICDM. IEEE, 509–518.
Michael Mathioudakis, Francesco Bonchi, Carlos Castillo, Aristides Gionis, and AnttiUkkonen. 2011. Sparsification of Influence Networks. In KDD. 529–537.
Yasir Mehmood, Nicola Barbieri, Francesco Bonchi, and Antti Ukkonen. 2013. Csi:Community-Level Social Influence Analysis. In Machine Learning and KnowledgeDiscovery in Databases. Springer, 48–63.
Pauli Miettinen and Jilles Vreeken. 2011. Model Order Selection for Boolean MatrixFactorization. In KDD. 51–59.
Pauli Miettinen and Jilles Vreeken. 2014. MDL4BMF: Minimum Description Length forBoolean Matrix Factorization. ACM TKDD 8, 4 (2014), 1–30.
Saket Navlakha, Rajeev Rastogi, and Nisheeth Shrivastava. 2008. Graph Summariza-tion with Bounded Error. In SIGMOD. 419–432.
Mark E. J. Newman and Michelle Girvan. 2004. Finding and Evaluating CommunityStructure in Networks. Physical Review E 69, 2 (Feb. 2004), 026113+.
Carlos Ordonez, Norberto Ezquerra, and Cesar A. Santana. 2006. Constraining and
A:32 Y. Liu, T. Safavi, A. Dighe and D. Koutra
summarizing association rules in medical data. Knowledge and Information Systems9, 3 (2006), 259–283.
Themis Palpanas, Michail Vlachos, Eamonn J. Keogh, and Dimitrios Gunopulos. 2008.Streaming Time Series Summarization Using User-Defined Amnesic Functions. IEEETransactions on Knowledge and Data Engineering 20 (2008), 992–1006. Issue 7.
Jia-Yu Pan, Hyung-Jeong Yang, and Christos Faloutsos. 2004. MMSS: Multi-ModalStory-Oriented Video Summarization. In ICDM. 491–494.
Jian Pei, Daxin Jiang, and Aidong Zhang. 2005. On Mining Cross-Graph Quasi-Cliques.In KDD. 228–238.
David Peleg and Alejandro A. Schaffer. 1989. Graph spanners. Journal of Graph Theory13, 1 (1989), 99–116.
Bryan Perozzi, Rami Al-Rfou, and Steven Skiena. 2014. DeepWalk: Online Learning ofSocial Representations. ACM, 701–710.
Robert Pienta, Acar Tamersoy, Hanghang Tong, and Duen Horng Chau. 2014. MAGE:Matching approximate patterns in richly-attributed graphs. In 2014 IEEE Interna-tional Conference on Big Data. 585–590.
B. Aditya Prakash, Jilles Vreeken, and Christos Faloutsos. 2012. Spotting Culprits inEpidemics: How many and Which ones?. In ICDM. IEEE.
Manish Purohit, B Aditya Prakash, Chanhyun Kang, Yao Zhang, and VS Subrahmanian.2014. Fast Influence-Based Coarsening For Large Networks. ACM, 1296–1305.
Qiang Qu, Siyuan Liu, Christian S. Jensen, Feida Zhu, and Christos Faloutsos. 2014.Interestingness-Driven Diffusion Process Summarization in Dynamic Networks. InECML PKDD. 597–613.
Davood Rafiei and Stephen Curial. 2005. Effectively Visualizing Large NetworksThrough Sampling. In 16th IEEE Visualization Conference (VIS 2005), Minneapolis,MN, USA. 48.
Sriram Raghavan and Hector Garcia-Molina. 2003. Representing Web Graphs. In ICDE.IEEE, 405–416.
Xuguang Ren and Junhu Wang. 2015. Exploiting Vertex Relationships in Speeding UpSubgraph Isomorphism over Large Graphs. PVLDB 8, 5 (Jan. 2015), 617–628.
Matteo Riondato, David Garcıa-Soriano, and Francesco Bonchi. 2014. Graph Summa-rization With Quality Guarantees. IEEE, 947–952.
Ryan Rossi, Brian Gallagher, Jennifer Neville, and Keith Henderson. 2012. Role-dynamics: fast mining of large dynamic networks (WWW ’12 Companion). ACM,997–1006.
Barna Saha and Pabitra Mitra. 2007. Dynamic Algorithm for Graph Clustering UsingMinimum Cut Tree.. In SDM. SIAM, 581–586.
Neil Shah, Danai Koutra, Tianmin Zou, Brian Gallagher, and Christos Faloutsos. 2015.TimeCrunch: Interpretable Dynamic Graph Summarization.
P. Shannon, A. Markiel, O. Ozier, N.S. Baliga, J.T. Wang, D. Ramage, N. Amin, B.Schwikowski, and T. Ideker. 2003. Cytoscape: a software environment for integratedmodels of biomolecular interaction networks. Genome research 13, 11 (2003), 2498.
Umang Sharan and Jennifer Neville. 2008. Temporal-Relational Classifiers for Predic-tion in Evolving Domains. In ICDM. 540–549.
Zeqian Shen, K-L Ma, and Tina Eliassi-Rad. 2006. Visual Analysis of Large Heteroge-neous Social Networks by Semantic and Structural Abstraction. IEEE Transactionson Visualization and Computer Graphics 12, 6 (2006), 1427–1439.
Lei Shi, Hanghang Tong, Jie Tang, and Chuang Lin. 2015. VEGAS: Visual InfluEnceGrAph Summarization on Citation Networks. IEEE Transactions on Knowledge andData Engineering 27, 12 (2015), 3417–3431.
Ben Shneiderman. 2008. Extreme Visualization: Squeezing a Billion Records into aMillion Pixels. In SIGMOD.
Graph Summarization Methods and Applications: A Survey A:33
Mahsa Shoaran, Alex Thomo, and Jens H Weber-Jahnke. 2013. Zero-Knowledge PrivateGraph Summarization. In IEEE International Conference on Big Data. IEEE, 597–605.
Koen Smets and Jilles Vreeken. 2011. The Odd One Out: Identifying and CharacterisingAnomalies. In SDM. SIAM, 804–815.
Qi Song, Yinhui Wu, and Xin Luna Dong. 2016. Mining Summaries for KnowledgeGraph Search. In 2016 IEEE 16th International Conference on Data Mining (ICDM).1215–1220.
Sucheta Soundarajan, Acar Tamersoy, Elias B. Khalil, Tina Eliassi-Rad, Duen HorngChau, Brian Gallagher, and Kevin Roundy. 2016. Generating Graph Snapshots fromStreaming Edge Data. In Proceedings of the 25th International Conference Companionon World Wide Web. 109–110.
Daniel A. Spielman and Nikhil Srivastava. 2011. Graph Sparsification by EffectiveResistances. SIAM J. Comput. 40, 6 (2011), 1913–1926. https://doi.org/10.1137/080734029
Jimeng Sun, Christos Faloutsos, Spiros Papadimitriou, and Philip S Yu. 2007. Graph-Scope: Parameter-Free Mining of Large Time-Evolving Graphs. In KDD. ACM, 687–696.
Jimeng Sun, Charalampos E. Tsourakakis, Evan Hoke, Christos Faloutsos, and TinaEliassi-Rad. 2008. Two heads better than one: pattern discovery in time-evolvingmulti-aspect data. Data Min. Knowl. Discov. 17, 1 (2008), 111–128.
Jimeng Sun, Yinglian Xie, Hui Zhang, and Christos Faloutsos. 2007. Less is More:Compact Matrix Decomposition for Large Sparse Graphs. In SDM.
Jian Tang, Meng Qu, Mingzhe Wang, Ming Zhang, Jun Yan, and Qiaozhu Mei. 2015.LINE: Large-scale Information Network Embedding. 1067–1077.
Nan Tang, Qing Chen, and Prasenjit Mitra. 2016. Graph stream summarization:From big bang to big crunch. In Proceedings of the 2016 International Conference onManagement of Data. ACM, 1481–1496.
Chayant Tantipathananandh and Tanya Berger-Wolf. 2011. Finding Communities inDynamic Social Networks.. In ICDM. IEEE, 1236–1241.
Lini T. Thomas, Satyanarayana R. Valluri, and Kamalakar Karlapalem. 2010. MARGIN:Maximal Frequent Subgraph Mining. ACM Transactions on Knowledge DiscoveryFrom Data 4, 3 (2010), 10:1–10:42.
Yuanyuan Tian, Richard A Hankins, and Jignesh M Patel. 2008. Efficient Aggregationfor Graph Summarization. In SIGMOD. ACM, 567–580.
Yuanyuan Tian and Jignesh M. Patel. 2008. TALE: A Tool for Approximate LargeGraph Matching. In Proceedings of the 2008 IEEE 24th International Conference onData Engineering. 963–972.
Hannu Toivonen, Fang Zhou, Aleksi Hartikainen, and Atte Hinkka. 2011. Compressionof Weighted Graphs. In KDD. 965–973.
Hanghang Tong, Christos Faloutsos, Brian Gallagher, and Tina Eliassi-Rad. 2007. FastBest-effort Pattern Matching in Large Attributed Graphs. In Proceedings of the 13thACM SIGKDD International Conference on Knowledge Discovery and Data Mining.737–746.
Jilles Vreeken, Matthijs van Leeuwen, and Arno Siebes. 2011. KRIMP: Mining Itemsetsthat Compress. Data Min. Knowl. Disc. 23, 1 (2011), 169–214.
Bianca Wackersreuther, Peter Wackersreuther, Annahita Oswald, Christian Bohm, andKarsten M. Borgwardt. 2010. Frequent Subgraph Discovery in Dynamic Networks.In Proceedings of the Eighth Workshop on Mining and Learning with Graphs. ACM,155–162.
Daixin Wang, Peng Cui, and Wenwu Zhu. 2016. Structural Deep Network Embedding.KDD.
A:34 Y. Liu, T. Safavi, A. Dighe and D. Koutra
Jianyong Wang and George Karypis. 2004. SUMMARY: Efficiently SummarizingTransactions for Clustering. In ICDM. 241–248.
Ye Wu, Zhinong Zhong, Wei Xiong, and Ning Jing. 2014. Graph Summarization forAttributed Graphs. In International Conference on Information Science, Electronicsand Electrical Engineering (ISEEE). IEEE, 503–507.
Yang Xiang, Ruoming Jin, David Fuhry, and Feodor Dragan. 2010. Summarizingtransactional databases with overlapped hyperrectangles. Data Min. Knowl. Disc.(2010).
Kevin S Xu, Mark Kliger, and Alfred O Hero III. 2011. Tracking Communities inDynamic Social Networks. In Proceedings of the 4th International Conference onSocial Computing, Behavioral-Cultural Modeling, & Prediction (SBP’11). Springer,219–226.
Zhiqiang Xu, Yiping Ke, Yi Wang, Hong Cheng, and James Cheng. 2012. A Model-basedApproach to Attributed Graph Clustering. ACM.
Xifeng Yan, Hong Cheng, Jiawei Han, and Dong Xin. 2005. Summarizing itemsetpatterns: a profile-based approach. In KDD. 314–323.
Jaewon Yang and Jure Leskovec. 2013. Overlapping Community Detection at Scale: ANonnegative Matrix Factorization Approach. ACM, 587–596.
Jaewon Yang, Julian McAuley, and Jure Leskovec. 2013. Community Detection inNetworks with Node Attributes. In ICDM. IEEE, 1151–1156.
Jinguo You, Qiuping Pan, Wei Shi, Zhipeng Zhang, and Jianhua Hu. 2013. TowardsGraph Summary and Aggregation: A Survey. In Social Media Retrieval and Mining.Springer, 3–12.
Ning Zhang, Yuanyuan Tian, and Jignesh M. Patel. 2010. Discovery-driven GraphSummarization. In ICDE. 880–891.
Peixiang Zhao, Charu C. Aggarwal, and Min Wang. 2011. gSketch: On Query Estimationin Graph Streams. Proc. VLDB Endow. 5, 3 (Nov. 2011), 193–204.
Yang Zhou, Hong Cheng, and Jeffrey Xu Yu. 2009. Graph clustering based on struc-tural/attribute similarities. Proceedings of the VLDB Endowment 2, 1 (2009), 718–729.
Linhong Zhu, Majid Ghasemi-Gol, Pedro Szekely, Aram Galstyan, and Craig A Knoblock.2016. Unsupervised Entity Resolution on Multi-type Graphs. In International Se-mantic Web Conference. Springer, 649–667.