This document is downloaded from DR‑NTU (https://dr.ntu.edu.sg)Nanyang Technological University, Singapore.
A graph‑based requirement elicitation approachin the context of smart product‑service systems
Wang, Zuoxu; Zheng, Pai; Chen, Chun‑Hsien; Khoo, Li Pheng
2018
Wang, Z., Zheng, P., Chen, C.‑H., & Khoo, L. P. (2018). A graph‑based requirement elicitationapproach in the context of smart product‑service systems. CIE48 Proceedings.
The trend of servitization has promoted the prosperity of product-service systems (PSS), by generating integrated solution bundles with more values for both industrial companies and customers. Nowadays, with the advances of Information and Communication Technology (ICT) and artificial intelligence (AI) techniques, an emerging paradigm known as smart product-service systems (Smart PSS) has been proposed and discussed. Smart PSS is an IT-driven value co-creation business strategy, consisting of smart, connected products (SCP) as tools and medium, stakeholders as participants, and intelligent systems as the supporting tools. Owing to the unique characteristics of Smart PSS, huge-volume, high velocity and heterogeneous data can be collected and analyzed to extract useful knowledge with wisdom. This is especially important in the requirement elicitation process. Though many existing studies have discussed methods to support requirement elicitation process, few studies emphasize how the data and information play their roles with products and services in the context of Smart PSS. Aiming to address it, a graph-based requirement elicitation approach considering system-in-use information in the context of Smart PSS is proposed. It leverages the graph embedding technique, i.e. deepwalk, together with the pre-defined product/service/condition ontologies to depict their in-context relations, and hence discover prospective latent needs. Finally, a case study of smart bike design requirement elicitation is illustrated at last to demonstrate its feasibility and effectiveness.
CIE48 Proceedings, 2-5 December 2018, The University of Auckland
[216]-2
1 INTRODUCTION
Product-service system (PSS) is an emerging paradigm for industrial companies to preserve competitiveness and creating more values in this fierce competitive market. It is widely understood as
“an integrated product and service system that can provide user-required functionalities with add-on services in a more environmentally friendly way”[1].
Initially, the definition of PSS only focused on business scope for value generation, nevertheless, recent pioneers have expanded the scope of PSS from business to engineering aspects with technical considerations [2]. In the past decades, a lot of studies about PSS paradigms, including technical PSS [3], industrial PSS [4], digitalized PSS [5] and cyber-physical PSS [6], have been discussed from engineering perspectives. Nowadays, due to the wide usage of ICT techniques, there is no doubt that new techniques can generate new values in the PSS innovations [7]. In this context, a new PSS paradigm, i.e. Smart PSS, has been proposed and discussed. A clear definition of Smart PSS was given by Zheng et al. [8]:
“an IT-driven value-cocreation business strategy consisting of various stakeholders as the players, intelligent systems as the infrastructure, smart, connected products as the media and tools, and their generated services as the key values delivered that continuously strives to meet individual customer needs in a sustainable manner”.
Owing to the unique characteristics of Smart PSS, huge-volume, high velocity and heterogeneous data can be collected and analyzed to extract useful knowledge with wisdom [9]. This is especially important in the requirement elicitation process. Though many existing studies have discussed methods to support requirement elicitation process [10], few studies emphasize how the data and information play their roles with products and services in the context of Smart PSS. Existing requirement elicitation studies mainly focus on extracting the relations between user-generated requirements and the products, services as well as add-on values [11], using ontologies or UML as the form of PSS representation [12], without the consideration about the in-context relations. Tukker and Tischner [13] have claimed that the “need behind the need” is much more valuable than needs, it can reveal the latent relations how exactly the products and service collaborate together to achieve an overall task. In fact, context is comparatively consistent with the “need behind the need”. For example, the requirement from people hundreds of years ago can be “a faster horse” but “a faster and more convenient commuting method” is their “need behind the need”. If the context, i.e. “commuting” can be obtained in this example, then “car” can be invented and designed to provide better service. Likewise, by mining the context in a requirement, the “need behind the need” can be revealed with higher probability and reliability, making the requirements much more convincing. Moreover, commercial values, such as more profits and more royal users can also be generated. The semantic context can be identified by collecting the data and information while monitoring real-time performance of the SCPs in Smart PSS.
Aiming to address this problem, a graph-based requirement elicitation approach in the context of Smart PSS is proposed. It leverages a typical graph embedding technique, i.e. deepwalk, together with the pre-defined product/service/condition ontologies to depict their in-context relations and hence discover prospective latent needs. The rest of this paper is organized as follows. Section 2 gives an overall review about the related works. Section 3 explains the details of the proposed graph-based requirement elicitation approach in Smart PSS. A case study about smart bike requirement elicitation is analyzed to demonstrate its feasibility and effectiveness in Section 4. In Section 5, conclusions, contributions and limitations of this paper are concluded.
CIE48 Proceedings, 2-5 December 2018, The University of Auckland
[216]-3
2 RELATED WORKS
In order to clarify the influence of data and information for requirement elicitation in PSS and further elicit latent requirements with semantic context through the data and information, related works about requirement elicitation methods in PSS and graph embedding technique, viz. deep walk, are reviewed in this section.
2.1 Requirement elicitation in PSS
Both academia and industry began to realize the importance of extracting correct requirements in PSS. Lots of previous research have studied the product-in-use data and generate functional solutions/design [3], which can generate technical solutions, for example maintenance or warehouse material management [14]. The integration of products and services are not considered in depth, accordingly making the potential benefits of PSS unrealizable [15]. But fortunately, the necessity of considering comprehensive data and information used in PSS system has been noticed and discussed. Hussain et al. [16] emphasized that system-in-use data can facilitate the concepts/solutions generation in PSS. McKay et al [12] developed a representation scheme for PSS to manage product information as well as service processes. Lützenberger et al. [17] considered the product usage information (such as sensor data or user feedback) as a key factor for the further PSS development. They analyzed a case study of washing machine validating the connection of product usage information and KBE models. As thus, it is significant to develop a framework to manage the system-in-use data in PSS, that is considering the product-in-use data and service-in-use data simultaneously to mine the relations among data.
2.2 Deepwalk
As aforementioned, large-scale and heterogeneous system-in-use data are required to be managed simultaneously for latent requirement elicitation. Graph is used in this paper to explore the relations between products, services as well as the system-in-use data and information since its essential advantage that it can present the structure and proximity of nodes. It is intuitional for the subsequent knowledge discovery, for example, mining the proximity of physical components and data logs. All the data need to be integrated into a unified form, causing a high dimensionality. Graph embedding methods can be suitable for dimensionality reduction. Graph embedding methods are prosperous [18] in many research and industrial fields, such as social network link prediction [19], Question-answering task [20], and knowledge graph completion [21]. According to the taxonomy proposed by Cai et al. [22], the graph embedding techniques can be categorized into Matrix Factorization, Deep Learning, Edge Reconstruction, Graph Kernel and Generative Model. In general, deepwalk belongs to Deep Learning based graph embedding with random walk. It was originally designed to generate representation of each node as vectors for social networks, using the local information obtained from random walks as the equivalent of sentences [19]. Owing to its advantages, nowadays deepwalk has been widely adapted and applied in many fields, mainly in the biochemical or biomedical research [23] [24]. Nevertheless, regarding the requirement elicitation exploitation, only one journal [25] discussed user multi-interests by exploiting deepwalk model in the field of healthcare.
Despite the above works listed, the Smart PSS has its own uniqueness in the requirement elicitation process because of the diverse relations between heterogeneous system-in-use information. In another words, the relations between the heterogeneous system-in-use information can be one-to-one, many-to-one, one-to-many and many-to-many relations. Furthermore, in the context of Smart PSS, the relations or the confidence coefficient of relations are usually changing and evolving since the SCPs are usually monitored in real-time, event logs are evolving all the time. In this situation, conventional rule-based reasoning is hard to maintain with a high efficiency. Nevertheless, graph-based representation and
CIE48 Proceedings, 2-5 December 2018, The University of Auckland
[216]-4
reasoning with the support of ontology is readily for evolve. Deepwalk, as one of a graph-based model, hence is suitable for the requirement elicitation task in Smart PSS.
Besides the heterogeneous system-in-use data as well as the evolving relations, deepwalk is used to implement the requirement elicitation framework since it can solve the normalized problem of latent requirement elicitation. SkipGram [26], as a part of deepwalk model, can predict the context (viz. the several previous words and latter words) of a given word. Likewise, deepwalk can be also deployed to figure out the similar problem that which product components and services have strong relations with given condition in the requirement elicitation task in Smart PSS. Requirements can be obtained by mining the relations between product components, services and conditions since they are the constituent elements of a requirement. However, hardly any existing approach proposes suitable methods to deal with requirement elicitation among heterogeneous and evolving data, not to mention considering their relations. To fill this gap, deepwalk, for the first time, is adapted in this engineering research to deal with system-in-use information in, and to extract latent requirements in the context of Smart PSS.
3 PROPOSED PSS REQUIREMENT ELICITATION METHOD
In this section, the proposed graph-based requirement elicitation method in the context of Smart PSS is discussed.
3.1 Requirements decomposition
Initially, in order to extract the latent requirement from large-volume and heterogeneous data, the form of requirements should be defined in the first step. Generally, a requirement can be regarded as a rule with the form of IF-THEN [27]. In this paper, the form of requirements is defined as an action with some objects under certain condition(s).
For example, a requirement for a smart phone can be update the operate system if the response time is too long. The long response time is the condition, operate system is the operated object and update the operate system is the action. By this means, requirements can be decomposed into three parts and correspond with the system-in-use information in Smart PSS, as shown below. As shown in Figure 1, condition (IF portion) of requirements intuitively corresponds with the usage condition information in Smart PSS. Likewise, object(s) is related with the product information and action(s) with object(s) from requirement elements is attached to service information. In this way, requirements can be extracted by mining the relations between products, services and usage condition information in the context of Smart PSS.
Figure 1: Requirement Decomposition and Connection with Smart PSS System-in-use Information
CIE48 Proceedings, 2-5 December 2018, The University of Auckland
[216]-5
3.2 Elements in the requirement elicitation method
As aforementioned, three kinds of system-in-use information are required in our proposed requirement elicitation method, namely physical products information, services information and various usage conditions information. The details of each kind of elements are shown as follows.
1. Products information
In the product ontology, a smart connected product 𝑃 can be divided into various levels, namely structure, parts and components, represented as tree diagram. According to the product ontology, the component 𝑃𝑖 refers to the component level.
2. Services information
Similarly, service ontology should also be defined and represented as tree diagram. However, in terms of the literature review in Section 2, there is still lack of a comprehensive consensus about what services can be provided in PSS, let alone to talk about the services in the context of Smart PSS. Hence, a clear scope of service in Smart PSS should be clarified as Figure 2, according to the studies from [28] and [29]. Digitalized services refer to the services offered to the customers through the support of intelligent digital systems. E-services refer to the service which is completed with the support of online information (e.g. social network information).
Figure 2: Scope of Services in Smart PSS
Services in Smart PSS
Digitalized services
Maintenance service
spare parts/material predcition
maintenance prediton
Logistic service
Optimisation service queue optimization
Implementation service
Monitor service
online quality management
manufacturing process monitor
real-time manufacturing
information tracking
E-services
Training service
Consulting service
Planning servicese.g. strategy
recommendation
CIE48 Proceedings, 2-5 December 2018, The University of Auckland
[216]-6
3. Usage conditions information
The usage conditions mean the various conditions occurred during the usage stage of smart connected products. With the support of multi-sensors in SCPs, the data and information can be collected and collected to monitor the performance of SCPs. Similar performance of SCPs can be clustered as a condition. The clustering methods can be K-means [30] or spectral clustering [31]. For the sake of illuminate the exact requirement elicitation method in the following part, some research assumptions in this paper are given below.
1. Research assumption 1:
The product information, service information and usage condition information are all stored in the form of ontology and are represented as tree diagrams. We assume that they are predefined by the domain experts since the knowledge acquisition is out of research scope in this paper.
2. Research assumption 2:
All the heterogeneous data and information used have already been pre-processed and integrated in a uniform form, i.e. the vector form using one-hot encoding, because the data integration is out of research scope as well. Detailed integrated methods can be found in [32].
3.3 Exploiting the graph of system-in-use information
Formally speaking, a graph can be represented as 𝐺 =< 𝑉, 𝐸 >, where 𝑉 is the set of nodes and 𝐸 ⊆ (𝑉 × 𝑉) is the set of edges of 𝐺 . A graph of system-in-use information can be
constructed with the three kinds of inputs as aforementioned, i.e. 𝑉 = {𝑃𝑖 , 𝐶𝑟 , 𝑆𝑗}, where 𝑃𝑖
means the product modules in the product ontology, 𝐶𝑟 means the usage conditions and 𝑆𝑗refers to the service instances in the service ontology. The nodes need to be represented in
a unified form, i.e. vectors using one-hot encoding. The relations between product module and usage conditions can be regarded as the adjacency matrix 𝑀𝑖×𝑟. Similarly, the relations
between usage conditions and services can be formed as weighted adjacency matrix 𝑁𝑟×𝑗, as
shown in Figure 3.
Figure 3: Exploiting the Graph of System-in-use Information
CIE48 Proceedings, 2-5 December 2018, The University of Auckland
[216]-7
The adjacency is defined as the co-occurrence relations between two elements in the pre-processed <product-condition-service> list.
𝑎𝑑𝑗𝑎𝑐𝑒𝑛𝑐𝑦 = {0, 𝑖𝑓 𝑐𝑜 − 𝑜𝑐𝑐𝑢𝑟𝑟𝑒𝑛𝑐𝑒
1, 𝑒𝑙𝑠𝑒 (2)
In this way, a graph of system-in-use information can be exploited.
3.4 Extracting requirements from graph
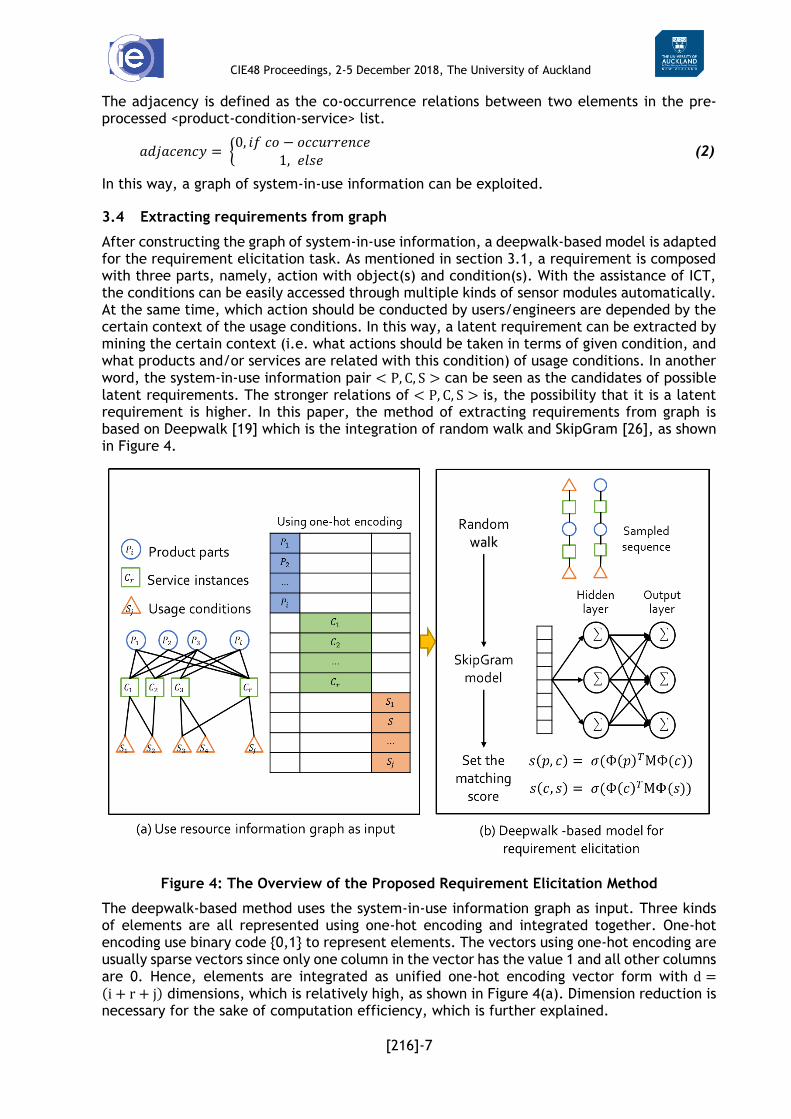
After constructing the graph of system-in-use information, a deepwalk-based model is adapted for the requirement elicitation task. As mentioned in section 3.1, a requirement is composed with three parts, namely, action with object(s) and condition(s). With the assistance of ICT, the conditions can be easily accessed through multiple kinds of sensor modules automatically. At the same time, which action should be conducted by users/engineers are depended by the certain context of the usage conditions. In this way, a latent requirement can be extracted by mining the certain context (i.e. what actions should be taken in terms of given condition, and what products and/or services are related with this condition) of usage conditions. In another word, the system-in-use information pair < P, C, S > can be seen as the candidates of possible latent requirements. The stronger relations of < P, C, S > is, the possibility that it is a latent requirement is higher. In this paper, the method of extracting requirements from graph is based on Deepwalk [19] which is the integration of random walk and SkipGram [26], as shown in Figure 4.
Figure 4: The Overview of the Proposed Requirement Elicitation Method
The deepwalk-based method uses the system-in-use information graph as input. Three kinds of elements are all represented using one-hot encoding and integrated together. One-hot encoding use binary code {0,1} to represent elements. The vectors using one-hot encoding are usually sparse vectors since only one column in the vector has the value 1 and all other columns are 0. Hence, elements are integrated as unified one-hot encoding vector form with d =(i + r + j) dimensions, which is relatively high, as shown in Figure 4(a). Dimension reduction is necessary for the sake of computation efficiency, which is further explained.
CIE48 Proceedings, 2-5 December 2018, The University of Auckland
[216]-8
In the deepwalk model, random walk is used to generate node sequences from graph G, as shown in Figure 4(b). Then the generated node sequence can be treated as a sentence and its nodes as words. SkipGram model and hierarchical softmax are utilized to model the probability density for the nodes in each context window and maximum the likelihood probability of the random walk sequence. The problem can be formulated as an optimization problem as follow. More details about the model architecture and implementation can be found in [29] and [26].
After obtaining the node embeddings Φ(vα) ∈ ℝd′, d′ ≪ d, a matching score is set up as
𝑠(𝑝, 𝑐) = 𝜎(𝛷(𝑝)𝑇𝑀𝛷(𝑐)) (4)
𝑠(𝑐, 𝑠) = 𝜎(𝛷(𝑐)𝑇𝑀𝛷(𝑠)) (5)
, where M is the similarity matrix and σ is sigmoid activation function. The similarity matrix is randomly initialized and are trained by the back propagation of loss function.
4 AN ILLUSTRATIVE EXAMPLE
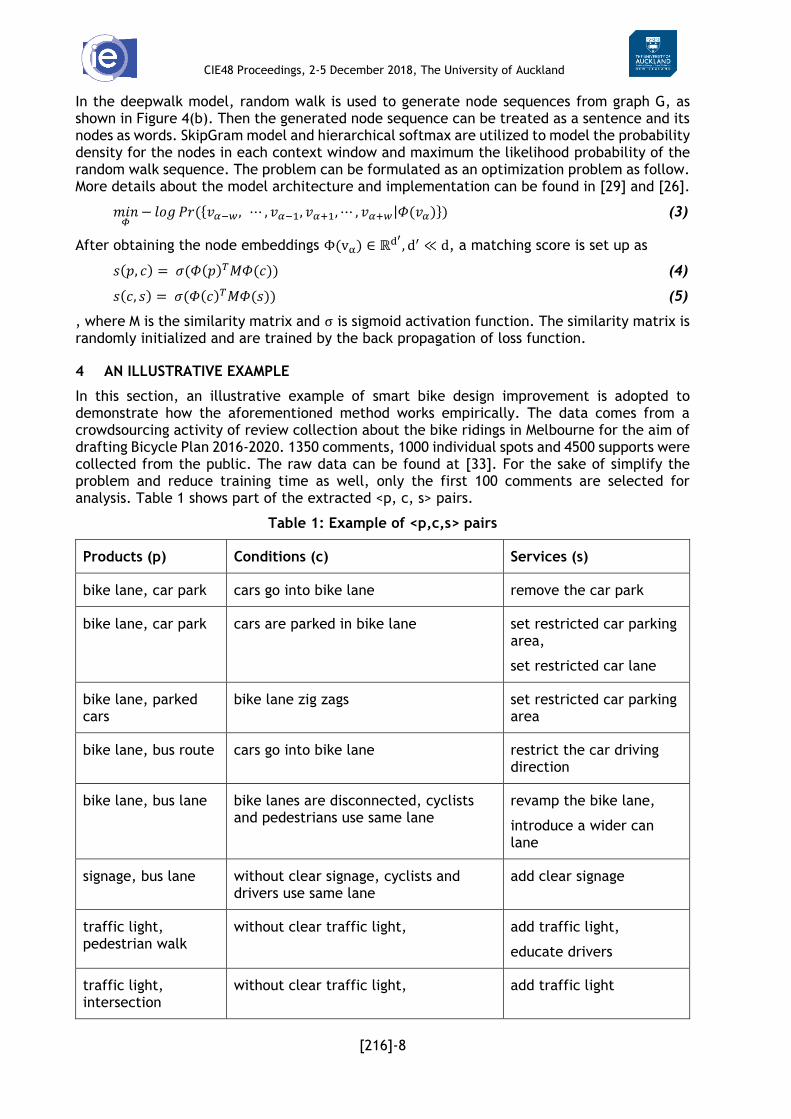
In this section, an illustrative example of smart bike design improvement is adopted to demonstrate how the aforementioned method works empirically. The data comes from a crowdsourcing activity of review collection about the bike ridings in Melbourne for the aim of drafting Bicycle Plan 2016-2020. 1350 comments, 1000 individual spots and 4500 supports were collected from the public. The raw data can be found at [33]. For the sake of simplify the problem and reduce training time as well, only the first 100 comments are selected for analysis. Table 1 shows part of the extracted <p, c, s> pairs.
Table 1: Example of <p,c,s> pairs
Products (p) Conditions (c) Services (s)
bike lane, car park cars go into bike lane remove the car park
bike lane, car park cars are parked in bike lane set restricted car parking area,
set restricted car lane
bike lane, parked cars
bike lane zig zags set restricted car parking area
bike lane, bus route cars go into bike lane restrict the car driving direction
bike lane, bus lane bike lanes are disconnected, cyclists and pedestrians use same lane
revamp the bike lane,
introduce a wider can lane
signage, bus lane without clear signage, cyclists and drivers use same lane
add clear signage
traffic light, pedestrian walk
without clear traffic light, add traffic light,
educate drivers
traffic light, intersection
without clear traffic light, add traffic light
CIE48 Proceedings, 2-5 December 2018, The University of Auckland
[216]-9
bike lane, park construction blocks bike lane build new bike lanes
bike lane, hoops, camera
bicycle theft add hoops,
add cameras near bike hoops
turn-around facilities
traffic congestion at major routes N/A
painted bike refuge without clear signage add clear signage
cyclists, pedestrians cyclists and pedestrians use same lane force cyclist dismount and walk their bikes,
widen the bike lane
slow meandering path of park
cyclists and pedestrians use same lane N/A
bike lane, gutters and cobbles
construction blocks bike lane build new bike lanes
bike lane, intersection
traffic congestion at peak time build new bike lanes
Based on the extracted <p,c,s> pairs, node list, adjacency list and edge list are identified and the graph of bike ridings is constructed as well, as shown in Figure 5(a). In the graph, 47 nodes
are all represented with one-hot encoding initially in ℝ47. The representation as vectors of each node was obtained after the adjacency list was input into the deepwalk-based model for
training. The learned representation in ℝ2 encodes the relations among nodes so that it can be easily exploited by standard classification/clustering methods, as shown in Figure 5(b). K means was applied in this example. The closer the nodes located with, the stronger relations they have. Moreover, the colour of nodes represents its clustering results.
Figure 5: Illustrative Example of Smart Bike Ridings
(a) Input: Bike riding graph (b) Output: Representation
CIE48 Proceedings, 2-5 December 2018, The University of Auckland
[216]-10
5 CONCLUSION
Smart PSS are fairly complex and ever-evolving eco-systems with different kinds of elements. Rapid actions should be taken to satisfy stakeholders in terms of their requirements. With the advances of ICT, large-scale data and information are easily accessed by companies via hardware sensing and crowdsourcing channels. Companies can leverage them to extract large amount of knowledge, especially latent user requirements. Therefore, it is essential to develop a proper requirement elicitation approach to assist the service providers preserve their competitiveness and profits in the fierce market. Nevertheless, to the authors’ knowledge, little study discusses how the system-in-use data and information play their roles in Smart PSS context. Aiming to address it, this paper proposed a novel graph-based requirement elicitation method for Smart PSS, and discussed the relations between products, usage conditions and services. The main scientific contributions can be summarized into three aspects:
1. Well-defined the categories of services be offered in the eco-system of Smart PSS, including both e-services and digitalized services.
2. Proposed a graph-based requirement elicitation method considering the roles of data and information in the context of Smart PSS. This work provided a new idea to model the requirement elicitation task as finding the context (i.e. the related system-in-use information) of given conditions where deepwalk method is adapted.
3. Provided a requirement decomposition approach, together with its critical procedures for exploiting the related information as a graph. The decomposed requirements are mapped with the corresponding system-in-use information in Smart PSS.
Moreover, an illustrative example of smart bike requirement elicitation is further adopted to validate the feasibility of the proposed graph-based requirement elicitation approach. Despite these achievements, this research still has some limitations. For instance, the edge weight should also be considered in the graph as the input of requirement elicitation model. Nevertheless, the authors hope this paper can be seen as an attempt and foundation to clarify the task of requirement elicitation, and further generate more values in this new PSS paradigm, i.e. Smart PSS. Meanwhile, future research directions are suggested to: 1) consider the occurrence frequency of <product, condition, service> pairs as edge weight; 2) further adapt the deepwalk method by attaching labels or auxiliary information for heterogeneous data in graph; and 3) validate the proposed method with practical data in the real world.
6 ACKNOWLEDGEMENT
The authors wish to acknowledge the financial support from the National Research Foundation (NRF) Singapore and Delta Electronics International (Singapore) Pte Ltd., under the Corporate Laboratory@ University Scheme (Ref. SCO-RP1; RCA-16/434) at Nanyang Technological University, Singapore.
7 REFERENCES
[1] Baines, T. S., Lightfoot, H. W., Evans, S., Neely, A., Greenough, R., Peppard, J., Roy, R., Shehab, E., Braganza, A., Tiwari, A., Alcock, J. R., Angus, J. P., Bastl, M., Cousens, A., Irving, P., Johnson, M., Kingston, J., Lockett, H., Martinez, V., Michele, P., Tranfield, D., Walton, I. M., Wilson, H. 2007. State-of-the-art in product-service systems, Proceedings of the Institution of Mechanical Engineers, Part B: Journal of Engineering Manufacture, 221(10), pp 1543–1552. doi:10.1243/09544054JEM858
[2] Goedkoop, M. 1999. Product service systems, Ecological and Economic Basis
[3] Aurich, J. C., Fuchs, C., Wagenknecht, C. 2006. Life cycle oriented design of technical Product-Service Systems, Journal of Cleaner Production, 14(17), pp 1480–1494
CIE48 Proceedings, 2-5 December 2018, The University of Auckland
[216]-11
[4] Rese, M., Karger, M., Strotmann, W.-C. 2009. The dynamics of industrial product service systems (IPS2)–using the net present value approach and real options approach to improve life cycle management, CIRP Journal of Manufacturing Science and Technology, 1(4), pp 279–286
[5] Lerch, C., Gotsch, M. 2015. Digitalized Product-Service Systems in Manufacturing Firms: A Case Study Analysis, Research-Technology Management, 58(5), pp 45–52. doi:10.5437/08956308X5805357
[6] Wiesner, S., Thoben, K.-D. 2017. Cyber-Physical Product-Service Systems, Multi-Disciplinary Engineering for Cyber-Physical Production Systems, Springer, pp 63–88
[7] Zheng, P., Lin, Y., Chen, C. H., Xu, X. 2018. Smart, connected open architecture product: an IT-driven co-creation paradigm with lifecycle personalization concerns. International Journal of Production Research.
[8] Zheng, P., Lin, T.J., Chen, C.H. and Xu, X., 2018. A systematic design approach for service innovation of smart product-service systems. Journal of Cleaner Production, 201, pp.657-667.
[9] Zheng, P., Xu, X., Chen, C.-H. 2018. A data-driven cyber-physical approach for personalised smart, connected product co-development in a cloud-based environment, Journal of Intelligent Manufacturing, pp. 1–16.
[10] Zheng, P., Xu, X., Xie, S. Q. 2016. A weighted interval rough number-based method to determining relative importance ratings of customer requirements in QFD product planning. Journal of Intelligent Manufacturing, pp. 1-14.
[11] Kim, Y., Wang, E., Lee, S., Cho, Y. 2009. A product-service system representation and its application in a concept design scenarioPresented at the Proceedings of the 1st CIRP Industrial Product-Service Systems (IPS2) Conference, , Cranfield University Press
[12] McKay, A., Kundu, S. 2014. A representation scheme for digital product service system definitions, Advanced Engineering Informatics, 28(4), pp 479–498. doi:10.1016/j.aei.2014.07.004
[13] Tukker, A., Tischner, U. 2017. New Business for Old Europe: Product-Service Development, Competitiveness and Sustainability, Routledge
[14] Van Ostaeyen, J., Van Horenbeek, A., Pintelon, L., Duflou, J. R. 2013. A refined typology of product–service systems based on functional hierarchy modeling, Journal of Cleaner Production, 51, pp 261–276
[15] Mont, O. K. 2002. Clarifying the concept of product–service system, Journal of Cleaner Production, 10(3), pp 237–245
[16] Hussain, R., Lockett, H., Vasantha, G. V. A. 2012. A framework to inform PSS Conceptual Design by using system-in-use data, Computers in Industry, 63(4), pp 319–327
[17] Lützenberger, J., Klein, P., Hribernik, K., Thoben, K.-D. 2016. Improving Product-Service Systems by Exploiting Information From The Usage Phase. A Case Study, Procedia CIRP, 47, pp 376–381
[18] Goyal, P., Ferrara, E. 2018. Graph embedding techniques, applications, and performance: A survey, Knowledge-Based Systems, 151, pp 78–94
[19] Perozzi, B., Al-Rfou, R., Skiena, S. 2014. Deepwalk: Online learning of social representationsPresented at the Proceedings of the 20th ACM SIGKDD international conference on Knowledge discovery and data mining, , ACM, pp 701–710
CIE48 Proceedings, 2-5 December 2018, The University of Auckland
[216]-12
[20] Fang, H., Wu, F., Zhao, Z., Duan, X., Zhuang, Y., Ester, M. 2016. Community-based question answering via heterogeneous social network learningPresented at the Thirtieth AAAI Conference on Artificial Intelligence
[21] Ji, G., He, S., Xu, L., Liu, K., Zhao, J. 2015. Knowledge graph embedding via dynamic mapping matrix (Vol. 1), Proceedings of the 53rd Annual Meeting of the Association for Computational Linguistics and the 7th International Joint Conference on Natural Language Processing (1: Long Papers), pp 687–696
[22] Cai, H., Zheng, V. W., Chang, K. 2018. A comprehensive survey of graph embedding: problems, techniques and applications, IEEE Transactions on Knowledge and Data Engineering
[22] Zong, N., Kim, H., Ngo, V., Harismendy, O. 2017. Deep mining heterogeneous networks of biomedical linked data to predict novel drug–target associations, Bioinformatics, 33(15), pp 2337–2344
[23] Li, G., Luo, J., Xiao, Q., Liang, C., Ding, P., Cao, B. 2017. Predicting MicroRNA-Disease Associations Using Network Topological Similarity Based on DeepWalk, IEEE Access, 5, pp 24032–24039
[24] Jin, Z., Liu, R., Li, Q., Zeng, D.D., Zhan, Y. and Wang, L., 2016, July. Predicting user's multi-interests with network embedding in health-related topics. In Neural Networks (IJCNN), 2016 International Joint Conference on 2016, July IEEE., pp 2568-2575.
[25] Mikolov, T., Chen, K., Corrado, G., Dean, J. 2013. Efficient estimation of word representations in vector space, ArXiv Preprint ArXiv:1301.3781
[26] Chen, C.-H., Rao, Z. 2008. MRM: A matrix representation and mapping approach for knowledge acquisition, Knowledge-Based Systems, 21(4), pp 284–293
[27] Abramovici, M., Neubach, M., Schulze, M., Spura, C. 2009. Metadata reference model for IPS2 lifecycle managementPresented at the Proceedings of the 19th CIRP Design Conference–Competitive Design, , Cranfield University Press
[28] Zhang, Y., Zhang, G., Liu, Y., Hu, D. 2017. Research on services encapsulation and virtualization access model of machine for cloud manufacturing, Journal of Intelligent Manufacturing, 28(5), 1109–1123. doi:10.1007/s10845-015-1064-2
[29] Kanungo, T., Mount, D. M., Netanyahu, N. S., Piatko, C. D., Silverman, R., Wu, A. Y. 2002. An efficient k-means clustering algorithm: Analysis and implementation, IEEE Transactions on Pattern Analysis & Machine Intelligence, 7, pp 881–892
[30] Ng, A.Y., Jordan, M.I. and Weiss, Y., 2002. On spectral clustering: Analysis and an algorithm. In Advances in neural information processing systems, pp 849-856.
[31] Guo, K., Tang, Y., Zhang, P. 2017. CSF: Crowdsourcing semantic fusion for heterogeneous media big data in the internet of things, Information Fusion, 37, pp 77–85. doi:10.1016/j.inffus.2017.01.008
[32] City of Melbourne Open Data Team. 2015. Public comments on 2016-20 Bicycle Plan in Melbourne. 2015, Available online: ttps://data.melbourne.vic.gov.au/Transport-Movement/Public-comments-on-2016-20-Bicycle-Plan/8kn4-yjni