145
A Green Future: Our 25 Year Plan to Improve the Environment Annex 1: Supplementary evidence report

A Green Future: Our 25 Year Plan to Improve the Environment
Annex 1: Supplementary evidence report
A Green Future: Our 25 Year Plan to Improve the Environment
Annex 1: Supplementary evidence report

2
Contents
Introduction ............................................................................................................................ 4
Section 1: Understanding natural capital and complex systems for environmental planning,
policy and decision making.................................................................................................... 6
1.1 Setting natural capital within a conceptual framework for improving the environment 6
1.2 Relationships between drivers, pressures, assets and benefits ............................... 10
1.3 Synergies and trade-offs ............................................................................................ 14
1.4 Complex systems and uncertain futures ................................................................... 16
Section 2: The context for the 25 Year Environment Plan .................................................. 22
2.1 Introduction ................................................................................................................ 22
2.2 Atmosphere ................................................................................................................ 22
2.3 Freshwater ................................................................................................................. 28
2.4 Species and ecological communities (on land) ......................................................... 33
2.5 Oceans (including marine species and ecological communities) ............................. 41
2.6 Land, soil and geological assets ................................................................................ 47
2.7 Interactions between natural capital assets .............................................................. 62
2.8 Environmental attitudes and behaviours ................................................................... 66
2.9 UK Overseas Territories ............................................................................................ 68
2.10 Pressures ................................................................................................................. 71
Section 3: Evidence for the effectiveness of different types of policy intervention ............. 90
3.1 Introduction ................................................................................................................ 90
3.2 The current situation .................................................................................................. 90
3.3 Conclusions from the UK NEA analysis of response options ................................... 91
3.4 Analysis of interventions supporting environmental outcomes from land management
........................................................................................................................................ 102
3.5 Encouraging environmentally positive behaviours .................................................. 103
3.6 Selection of policy interventions .............................................................................. 105

3
3.7 Governance .............................................................................................................. 107
3.8 Conclusion ............................................................................................................... 107
Section 4: Prioritising action in the Plan ............................................................................ 109
4.1 Context ..................................................................................................................... 109
4.2 The importance of employing a variety of prioritisation and valuation methods ..... 109
4.3 Determining the value of interventions .................................................................... 110
4.4 Using prioritisation methods with a suitable level of caution ................................... 113
4.5 Evidence base for prioritising interventions in the Plan .......................................... 114
4.6 High level analysis of the benefits of the goals set out in the Plan ......................... 115
4.7 Achieving the goals .................................................................................................. 117
4.8 Conclusion ............................................................................................................... 132
Section 5: Monitoring, evaluation and adaptive management .......................................... 134
5.1 Our approach ........................................................................................................... 134
5.2 An integrated monitoring and evaluation framework ............................................... 137
5.3 Flexible, adaptive management ............................................................................... 144

4
Introduction
This supplementary evidence report provides context and analysis which underpins the 25
Year Environment Plan. The 25 Year Plan is a complex piece of environmental forward
planning with a considerable breadth of coverage over a long timescale. It sets out a wide
range of actions designed, over the course of the Plan, to result in cleaner air and water,
richer habitats for more wildlife and an approach to agriculture, forestry, land use and
fisheries that puts the environment first. It also frames proposals to tackle waste, soil
degradation, and the effects of climate change.
Planning in the face of considerable future uncertainty, including climate change, requires
the adoption of flexible, adaptive management frameworks which recognise that learning
from the interventions of today will help to construct more effective future responses. The
Plan therefore aims to set a clear long-term direction that is flexible enough to adapt to
new evidence and changing circumstances.
Knowledge frameworks need to support this adaptive approach. This means both
understanding long-term trends, and challenging the current knowledge base to encourage
innovations that will provide more useful and robust information about how the
environment system is changing and how interventions are having an effect. Lay and local
knowledge also needs to be adequately recognised as part of this broader learning
environment, especially to get greater involvement of a wide range of stakeholders in
response strategies.
The 25 Year Plan responds to the conclusions presented by the Natural Capital
Committee that many aspects of the natural capital across the country are currently in a
state where they are delivering flows of benefits well below what is possible or desirable.
The Committee called for a long-term plan to rectify this situation, and therefore this 25
Year Plan uses the concept of natural capital to frame its arguments and actions. This
concept links the physical and biological “capital stocks” of the environment to the
pressures on them, the benefits that humans and other species gain from them, and the
value attributed by society to those benefits. It enables consideration of interventions in all
parts of this system and recognises the need for a broad evidence base to develop,
support and evaluate these actions.
The evidence report sets out the theory behind the natural capital concept and examines
how it can be built, alongside other considerations, into a framework for planning
adaptively over such a long time period.
It then provides a snapshot of the rich variety of information we currently have that can tell
us how parts of the environment system are currently structured and functioning and how
this current situation might frame and interact with the goals and actions set out in the
Plan. To do this, it uses the conceptual framework to consider what we know of both the
current status of different aspects of the environment, and, where possible, what we know

5
of the benefits that society currently receives from those various “assets”1. It also sets out
evidence on some of the pressures that are currently being put on those environmental
assets and considers how those might be affecting the flow of benefits to society.
The Plan has the ambition of leaving the environment in a better state for the next
generation. It acknowledges that this will require action on a number of fronts by a range
of actors. This evidence report provides a summary of evidence of the effectiveness of
different actions on changing the flows of benefits we get from the environment. It then
sets out in more detail some of the economic evidence that we currently have which can
help us to prioritise actions. It recognises the need for a range of approaches to
prioritisation, and that we will need to be flexible and develop our responses as we learn
more and adapt to an uncertain and changing future.
Finally, to enable effective measurement of progress towards the Plan’s aims, this report
sets out proposals for a new monitoring and evaluation framework for the Plan, suggesting
areas where further work is needed to develop indicators and metrics that give a robust
insight into the effectiveness of actions aimed at improving the environment.
1 The Defra group publishes a full range of official and national statistics – see
https://www.gov.uk/government/organisations/department-for-environment-food-rural-affairs/about/statistics.
This publication is based on these statistics and other published scientific data.

6
Section 1: Understanding natural capital and complex systems for environmental planning, policy and decision making
1.1 Setting natural capital within a conceptual framework for improving the environment
Natural capital is defined by the Natural Capital Committee (NCC) as “the elements of
nature that directly and indirectly produce value or benefits to people (now or in the future),
including ecosystems, species, freshwater, land, minerals, the air and oceans, as well as
natural processes and functions2. This includes what economists refer to as non-use
values. These encapsulate the wellbeing people receive from knowing that special places
or species exist and are conserved even though they may never directly ‘use’ or see them
(a more detailed description of non-use values is provided in Figure 4.2).
The conceptual framework developed for the 25 Year Environment Plan, building on
previous models developed by the NCC and others3, is illustrated in Figure 1.1. It
categorises the environment into a number of ‘assets’ (stocks) which combine in varying
ways to provide a suite of services and benefits from which we derive wellbeing. Many of
these relationships are mediated, and the benefits we receive enhanced, through human
activities denoted as ‘other capital inputs’ (i.e. financial, manufactured, social and human).
For management and investment purposes relating to the 25 Year Plan, our primary
interest is in how to manage natural assets in order to provide the greatest net benefits to
society, a strong economy and improved wellbeing, sustainably. What we want to achieve
– the improvement of the environment within a generation – can be defined in terms of the
state of the assets and the flows of benefits we derive from them.
2 The State of Natural Capital: Towards a framework for measurement and valuation, Natural Capital
Committee, 2013, https://www.gov.uk/government/publications/natural-capital-committees-first-state-of-
natural-capital-report
3 Towards a Framework for Defining and Measuring Changes in Natural Capital Working Paper 1, Natural
Capital Committee, 2014,
https://www.gov.uk/government/uploads/system/uploads/attachment_data/file/516946/ncc-working-paper-
measuring-framework.pdf. Natural Capital Metrics Project Phase 1 Final Report, Centre for Ecology and
Hydrology. 2017, https://www.ceh.ac.uk/our-science/projects/natural-capital-metrics. Maseyk, F.J.F,
Mackay, A.D, Possingham, H.P, Dominati, E.J, & Buckley, Y.M, (2017) Managing Natural Capital Stocks for
the Provision of Ecosystem Services. Conservation Letters. Vol 10, Issue 2, pp. 211–220,
http://doi.org/10.1111/conl.12242

7
Figure 1.1: A conceptual framework for improving the environment
The assets and benefits are part of an open and highly interdependent system (see
section 1.4 for further discussion on complex systems) which are influenced by a wide
range of ‘external’ drivers (Box 1.1) and pressures and ‘internal’ policy or management
interventions (as summarised in Section 3).
Drivers give rise to multiple pressures on the environment such as climate change, habitat
loss and fragmentation, invasive species, resource consumption, waste and chemicals
entering the environment. However, these drivers of change also present opportunities,
such as advanced technologies helping to reduce emissions of harmful substances; or
economic systems adopting natural capital as a key underpinning framework. These risks
and opportunities affect the capacity of assets to provide the benefits we are interested in.
Interventions at different points in the system can be made in order to improve the net
benefits we obtain from the environment. Some interventions focus on reducing pressures
on assets by reducing our environmental footprint (e.g. reducing atmospheric emissions
and the generation of waste) and others on protecting and enhancing assets (e.g. good
soil management practices and protection of wildlife). In other situations, interventions
focus on achieving sustainable use or increasing productivity by managing ‘other capital
inputs’ (e.g. fishing and farming practices). Interventions may also focus more directly on
improving wellbeing outcomes by providing opportunities for people to engage with nature
and the environment (e.g. volunteering, health interventions or educational activities with
children). This full range of interventions is how we seek to achieve an improved
environment.

8
Box 1.1: Drivers of change
Key drivers of change include social, technological, environmental, economic and political
factors such as:
Social changes such as demographic and values shifts
Technological advances such as through automation and biotechnology
Environmental changes through dynamics in ecosystem structure and processes
Economic power-shifts, particularly towards China and India
Political changes within the UK and between the UK and the rest of the world
These drivers, both individually and in combination, play out within broad ‘socio-technological’
systems (such as energy, food, mobility and infrastructure), where they affect these systems
through global scale mega-trends (such as geo-political shifts and technological advances, see
Box 1.5) and at the smaller, more local ‘niche’ level, where innovations may begin to have
influence. These developments may grow or fade in importance over time and the pace and
direction of such trends and innovations are very difficult (if not impossible) to predict with a high
degree of confidence4 (see also Box 1.4 below).
Recent evidence on cultural ecosystem services can help expand the conceptualisation of
‘other capital inputs’, services, goods and benefits. Cultural ecosystem services derive
from the interplay between specific environments and the activities undertaken in them,
with each influencing the other. A wide range of cultural goods emerge from these
interactions: leisure, recreation and tourism goods; health goods; heritage goods;
education and ecological knowledge goods; and religious and spiritual goods5. The
benefits people get from these cultural ecosystem services and cultural goods are also
associated with the interaction between different types of environments and the activities
undertaken in them. These benefits include rootedness and a sense of place, inspiration
and escape, and increased knowledge, health and wellbeing6.
The conceptual framework also shows (down the right hand side of Figure 1.1) the
approach to evaluation. There are two broad components to this. The first is the
measurement of progress towards the stated objective. This will require a series of metrics
4 Grin, J., Rotmans, J. and Schot, J., (2010) Transitions to sustainable development: New directions in the
study of long term transformative change, Routledge
5 Church, A., Burgess, J., & Ravenscroft, N. (2011) Chapter 16 Cultural Services. In: The UK National
Ecosystem Assessment Technical Report. UK National Ecosystem Assessment, UNEP-WCMC,
http://uknea.unep-wcmc.org/LinkClick.aspx?fileticket=QLgsfedO70I%3d&tabid=82
6 Church, A., Fish, R., Haines-Young, R., Mourato, S., & Tratalos, J. (2014) UK National Ecosystem
Assessment Follow-on. Work Package Report 5: Cultural ecosystem services and indicators. UNEP-WCMC,
LWEC, UK. http://uknea.unep-wcmc.org/Resources/tabid/82/Default.aspx

9
to cover pressures, assets and benefits (the what), evolving these as evidence and data
collection activities develop. The second is about evaluating how effective interventions
are (the how) and whether they are working. This will help inform the continued
development of the 25 Year Environment Plan and its periodic revisions. Further details on
monitoring and evaluation provided in Section 5.
Although stylistic, the conceptual framework developed here (Figure 1.1) enables
consideration of both environmental stocks and flows, which in turn facilitates better
inclusion of sustainability considerations. By incorporating drivers and pressures into the
framework, it is possible to take a much more systematic view of both key current and
future challenges as well as the potential synergies and trade-offs involved in policy
decisions. The framework works better for some aspects than others, particularly those
assets and benefits that lend themselves to quantification and valuation, and this allows a
formal approach of natural capital accounting (see Box 1.2). As thinking and the evidence
base grow, so too will understanding of the conceptual framework, and this evolution
highlights the need to consider a wide range of evidence when developing the Plan.
Box 1.2: Natural capital accounting
Natural capital accounting is a coherent and integrated approach to the assessment of the
environment through the measurement of natural assets such as ecosystems, and the
measurement of the flows of services from these assets into economic and other human
activity.
The scope of natural capital accounts may vary from specific land cover types, such as forests,
to larger integrated areas such as river basins, and includes areas that may be considered
relatively natural and those that may be heavily influenced by human activity, such as
agricultural or urban areas.
Natural capital accounting goes beyond other approaches to environmental analysis and
assessment through the explicit linking of the natural assets to economic and other human
activity. The links are seen both in terms of the services provided by the assets and also in the
impacts that economic and other human activity may have on the assets and their future
capacity to deliver services. While natural capital accounting does consider the environment
and the economy to be different systems, they are analysed jointly reflecting the fundamental
connections between them. The use of an accounting framework enables the stock of assets
and the flows of services to be defined in relation to each other and also in relation to a range
of other environmental, economic and social information.
A prime motivation for natural capital accounting is that the separate analysis of the
environment and the economy does not clarify the vital nature of the relationship between
humans and the environment in which we live. The standard approaches to the measurement
of the economy focus largely on economic and other human activity that is reflected in the
activity of markets. Natural capital accounting aims to shed light on the non-market activity that
relates to ecosystems and integrate this information with relevant market related data. It is
expected that individual, social and business decisions concerning the use of the environment

10
may be better informed by developing information sets based on recognition of the relationship
between ecosystems and economic and other human activity.
Source: Defra
1.2 Relationships between drivers, pressures, assets and benefits
Our understanding of the relationships between drivers, pressures, assets and benefits is
incomplete and is a focus for ongoing research. A preliminary assessment was
undertaken in the UK National Ecosystem Assessment which focused on the relationships
between drivers, pressures, broad habitat types and ecosystem services at the national
scale: historic, current and across a range of plausible futures7. This assessment
concluded that land use and land management change, pollution and over exploitation had
had the highest impact on ecosystem services in the UK and in most cases these impacts
were expected to continue. Some impacts of pollution were expected to decrease through
policy interventions. Pressures arising from climate change and invasive alien species had
generally been lower but were projected to increase.
The Natural Capital Committee has referred to stark warnings about the risks posed by a
series of interacting global drivers and pressures related to population growth, climate
change, and demands for energy, water and food that could coincide to create an
unprecedented set of circumstances. Technological developments also provide new
opportunities and risks that have highly uncertain consequences for management of
natural capital8.
There is a significant body of evidence concerning the relationship between some
pressures and particular attributes of some of the assets, particularly regarding the status
of assets that have been defined as statutory or policy priorities, for example the condition
of Sites of Special Scientific Interest, wildlife populations, water quality etc.9 (see Figure
7 UK National Ecosystem Assessment, UNEP-WCMC, 2011, http://uknea.unep-
wcmc.org/Resources/tabid/82/Default.aspx
8 The State of Natural Capital Protecting and Improving Natural Capital for Prosperity and Wellbeing. Third
report to the Economic Affairs Committee, Natural Capital Committee, 2015,
https://www.gov.uk/government/collections/natural-capital-committee-documents
9 Natural England data on reasons for adverse condition on designated sites,
https://designatedsites.naturalengland.org.uk/ReportUnitAdverseCondition.aspx?ReportTitle=All%20of%20E
ngland%20adverse%20conditions. Biesmeijer J C et al. (2006) Parallel declines in pollinators and insect-
pollinated plants in Britain and the Netherlands. Science 313 (5785):351-4,
http://doi.org/10.1126/science.1127863.
Status and value of pollinators and pollinator services, report by Vanbergen et al.to.Defra, 2014,
http://randd.defra.gov.uk/Default.aspx?Menu=Menu&Module=More&Location=None&Completed=0&ProjectI
D=18916. .Update to the river basin management plans in England National Evidence and Data Report,
Environment Agency, 2015, https://www.gov.uk/government/publications/river-basin-management-plans-

11
1.2 and Table 2.1). Even so the long-term, cumulative and combined effects of pressures
are not fully understood and quantified10. Furthermore the attributes of assets that have
been well studied are not necessarily those that are most relevant to understanding supply
of services to people and there is therefore a need to identify metrics that relate more
directly to benefits11.
national-evidence-and-data-report, UK National Ecosystem Assessment, UNEP-WCMC, 2011,
http://uknea.unep-wcmc.org/Resources/tabid/82/Default.aspx
10 Drivers of change in the UK’s Species Trend Indicators. Provision of Evidence Statements to accompany
the UK and England Species Trend Indicators and an Overview of the Causes of Biodiversity Change
(Project Reference BE0112), Eaton, M. A. & Burns, F. report to Defra, 2016,
http://sciencesearch.defra.gov.uk/Default.aspx?Menu=Menu&Module=More&Location=None&ProjectID=195
28
11 The State of Natural Capital Protecting and Improving Natural Capital for Prosperity and Wellbeing. Third
report to the Economic Affairs Committee, Natural Capital Committee, 2015,
https://www.gov.uk/government/collections/natural-capital-committee-documents

12
Figure 1.2: Drivers of species’ population changes, UK biodiversity, 1970 to 2012 (Source:
Eaton and Burns, 201610)
Notes to Figure 1.2:
1. Positive (green) and negative (blue) impact for each broad driver of change, presented in broad
groupings.
2. Results are based on evidence of all strengths, and by weighting the three main taxonomic groups
equally.
The Centre for Ecology and Hydrology has undertaken a review of evidence, data and
models regarding the interrelationships between pressures, natural capital assets and
human benefits for six case studies: pollination and food production; lake water quality;
tree planting and flood mitigation; riverine vegetation, flood risk and drought mitigation; sea
birds and renewable energy; and, air quality and human health. The process of producing
the evidence chains (see the example of tree planting and flood mitigation in Figure 1.3)
proved to be highly complex and varied substantially across the different case studies.
Drivers of species’ population changes, UK biodiversity, 1970 to 2012

13
Some significant evidence gaps were identified including spatially explicit data sources
and modelling capability12.
Figure 1.3: Illustration for evidence chain linking tree planting with flood mitigation (Source:
CEH12)
The inter-relationships between pressures, assets and benefits are complex in space and
time, and include multiple biophysical, socio-economic and behavioural aspects, some of
which display non-linear relationships which may be irreversible13.
In order to identify the most important aspects to measure and monitor, it is necessary to
look at the extent to which the benefits are and can be influenced by decisions affecting
the quantity, quality or location of the underpinning asset. For example, for outdoor
recreation, the location of recreation areas such as woodlands near to people is a key
determinant of how much they will be used and therefore the benefits derived from them.
So location and quantity matter more than quality in this case. However, the contribution of
woodland to an equable climate (via carbon sequestration) is mostly unaffected by its
location and will instead be determined largely by its size (quantity) and to some extent by
12 Harrison, P.A., Sier, A., Acreman, M., Bealey, W., Fry, M., Jones, L., Maskell, L., May, L., Norton, L.,
Read, D., Reis, S., Trembath, P., Watkins, J. (2017) Natural Capital Metrics. Phase 1 Final report: Central
components. CEH Project NEC06063. 78 pp. NERC Centre for Ecology & Hydrology.
https://www.ceh.ac.uk/our-science/projects/natural-capital-metrics
13 The State of Natural Capital: Restoring our Natural Assets. Second report to the Economic Affairs
Committee, Natural Capital Committee, 2014, https://www.gov.uk/government/collections/natural-capital-
committee-documents

14
species composition (quality)14. Natural England have undertaken a project to review the
suitability of potential indicators for measuring change in the quantity and quality of natural
capital in England, at a range of scales from local to national. This has included the
identification of ideal natural capital indicators through the development of natural capital
logic chains. This work will be used to inform the development of the framework for
monitoring and evaluating the 25 Year Plan (see section 5 for further details).
In addition to direct and tangible benefits, it is important to recognise a broad range of
values about the environment, including people’s care and concern about the natural world
and how these vary spatially and temporally. For example, research to support the
National Pollinator Strategy15 is finding that pollinators prompt people to think about nature
as an interconnected whole, in which they too participate, and can unlock feelings of
wonder, awe, groundedness, concern, responsibility, and nostalgia16. These values are
important for motivating action and changing behaviour. The international study European
Nature in the Plural17 found that people’s views of what nature is, what it is for and how
humans should behave towards nature are diverse and increasingly fragmenting.
1.3 Synergies and trade-offs
Any particular natural capital asset can deliver multiple but often different ‘bundles’ of
benefits. For example, trees and woods deliver multiple benefits of timber production,
places for recreation, carbon sequestration, improving air and water quality, controlling
floods, as well providing as a habitat for wildlife, all depending on which trees are where
and how they are managed. Similarly a fully functioning peatland ecosystem regulates
water flow, improves water quality, sequesters carbon and provides a unique habitat for
wildlife18. Understanding the potential for multiple benefits and the risks of dis-benefits can
help to identify the synergies and trade-offs between different policy and management
interventions (see Box 1.3).
14 The State of Natural Capital Protecting and Improving Natural Capital for Prosperity and Wellbeing. Third
report to the Economic Affairs Committee, Natural Capital Committee, 2015,
https://www.gov.uk/government/collections/natural-capital-committee-documents
15 The National Pollinator Strategy: for bees and other pollinators in England, Defra, 2014,
https://www.gov.uk/government/publications/national-pollinator-strategy-for-bees-and-other-pollinators-in-
england
16 Pollinating insects: what do they mean to people and why does it matter? Christmas et al. report to Defra,
2017,
http://randd.defra.gov.uk/Default.aspx?Menu=Menu&Module=More&Location=None&ProjectID=19620&Fro
mSearch=Y&Publisher=1&SearchText=PH0523&SortString=ProjectCode&SortOrder=Asc&Paging=10#Desc
ription
17 European nature in the plural. Finding common ground for a next policy agenda. Van Zeijts et al., PBL
Netherlands Environmental Assessment Agency, 2017, http://www.pbl.nl/en/publications/european-nature-in-
the-plural
18 UK National Ecosystem Assessment, UNEP-WCMC, 2011, http://uknea.unep-
wcmc.org/Resources/tabid/82/Default.aspx
15
Box 1.3: Examples of delivering multiple benefits
In 2009 Natural England set up three place-based upland ecosystem service pilot projects, in
Bassenthwaite (Lake District), the South Pennines and South West Uplands. A core aim of the
pilots was to demonstrate that investment in the natural environment can result in multiple
benefits, in terms of carbon, water, food, biodiversity, recreation and landscape, in a cost
effective way. The partnership projects worked with a range of local stakeholders, including
farmers and land managers. A participatory approach to decision making, identified key
actions and mechanisms to enhance multiple ecosystem services. A shared and mapped
evidence base was developed for each pilot. Through workshops, potential opportunities were
identified for delivering the key actions on the ground. Integrated delivery plans, for 2011 to
2016, were produced for two of the pilots. A current evaluation of all three pilots, is assessing
their effectiveness and impact, providing vital lessons for future natural capital projects.
Source: Natural England
Scenario analysis undertaken in the UK National Ecosystem Assessment illustrates the
choices that exist between agricultural production (providing goods of food, fibre and fuel)
and other benefits derived from the land. Under a future scenario where intensity of
agricultural production is increased there are substantial decreases in the benefits
provided for climate regulation (through increased greenhouse gas emissions), recreation
and wildlife. Conversely in a scenario where intensity of agriculture decreases there are
projected increases in these benefits, though there are marked spatial differences19 (see
Figure 1.4). There are also international implications as, for example, reduced domestic
production of food increases the requirement to import food which may transfer resource
pressures overseas. A natural capital framework can help in understanding and
quantifying these trade-offs and to make informed decisions about policy options.
19 Bateman, I. J. et al. (2013) Bringing Ecosystem Services into Economic Decision-Making: Land Use in the
United Kingdom. Science Vol. 341, Issue 6141, pp. 45-50, https://doi.org/10.1126/science.1234379

16
Figure 1.4: Spatial distribution of the market and non-market effects of land use change
under two scenarios (i.e. an increase and a decrease in the intensity of agricultural
production) (Source: Bateman et al., 201319)
Further work on understanding the effects and trade-offs of different scenarios, particularly
relating to land use change and the impacts of agriculture and agri-environment schemes
is being undertaken.
This type of scenario analysis, which typically combines empirical data with expert opinion,
should not be considered as providing a prediction, but rather illustrates how the
assumptions made may influence future land use. Scenarios are often used to represent
policy extremes with the differences between scenario outputs being most relevant to
informing decisions.
Understanding, quantifying and valuing these trade-offs can assist in policy prioritisation
(see Section 4).
1.4 Complex systems and uncertain futures
Complex systems
A key concept underpinning a natural capital approach is system based thinking which
recognises the interdependencies between the different elements of the natural capital

17
framework and any emergent properties which occur through these interactions (see Box
1.4). Systems thinking also recognises the interactions between systems and the need to
take account of the speed and direction of changes on the different spatial and temporal
scales.
Box 1.4: Systems based thinking, analysis and management
Many environmental issues are inherently ‘complex system problems’20. “System problems are
shared problems: they are caused by no one party in isolation and can be solved by no one
party in isolation. System problems emerge as a consequence of interaction between system
components - including the political, social and economic context in which they are embedded -
and are best managed collaboratively.” 21
Complex systems can have properties that simple systems do not have, because “the whole is
more than the sum of its parts”- it has emergent properties which are a consequence of the
dynamic interaction of its components through time. Interdependencies can result in
unintentional negative impacts from well-intentioned interventions22. When looking at the whole
picture, patterns become visible that help formulate more successful interventions. The degree
of cost-effectiveness, equitability and sustainability of interventions to achieve environmental
outcomes is currently limited by our lack of understanding of ‘the system(s)’ and their dynamic
interdependencies23.
These types of issues are best managed through accepting and embracing complexity24 and by
looking to appropriate ways to manage issues in the context of this complexity. This is usually
through a process of co-learning, building up an understanding of key components and their
interdependencies.
Combining systems and futures thinking can help us to grasp complexity and uncertainty. They
are also key concepts required to deliver resilient ecosystems and more integrated
management, and consequently multiple benefits through better targeted, co-ordinated action.
Systems models and futures analysis also provide the material to build the capacity and
confidence of decision-makers and stakeholders to shape policies and interventions as
'hypotheses' that can be tested as part of adaptive management to better target investment
where it will have most impact over the long-term.
20 Berkes, F., and C. Folke, editors. (1998) Linking Social and Ecological Systems: Management Practices
and Social Mechanisms for Building Resilience. Cambridge University Press, New York.
Arnold D.A and Wade J.P. (2015) A Definition of Systems Thinking: A Systems Approach, Procedia
Computer Science 44 (2015) 669 – 678, https://doi.org/10.1016/j.procs.2015.03.050
21 Dolan T and Cosgrove E (2016) Aligning systemic infrastructure decisions with social outcomes. Civil
Engineering 169 (4) 147, https://doi.org/10.1680/jcien.2016.169.4.147
22 Sterman, J., (2002) All models are wrong: reflections on becoming a systems scientist. System Dynamics
Review, 18(4), pp.501–531, https://doi.org/10.1002/sdr.261
23 Chapman J (2004) System failure. Why governments must learn to think differently. Demos Second
edition, https://www.demos.co.uk/files/systemfailure2.pdf
24 R. Axelrod, M. D. Cohen (2001) Harnessing Complexity. Free Press, New York.

18
Looking ahead to move forward
The future is often unpredictable, and uncertainties increase the further ahead we try to
look. With a 25 year time horizon, there is a risk that actions to achieve long-term
objectives in the Plan are overtaken by developments, new findings and other factors.
Understanding and awareness about potential futures will affect current and near-term
decisions and actions. Futures thinking can help identify and explore plausible futures and
options and flag key opportunities and risks. Futures thinking is a tool that helps with
understanding what may happen, but it doesn’t provide a prediction of what will actually
happen25.
Adopting futures thinking and foresight resources and tools can help to:
describe and explore plausible and possible ways the future might play out;
flag key opportunities and risks that these futures may bring with regard to pursuing or
revising the goals;
explore a range of potential options for action in the face of these risks and
opportunities; and
build capacity for long-term thinking among those involved in policy design and
implementation.
There are a number of resources available to help facilitate this approach including UK
and international studies of global trends and emerging issues (summarised in Box 1.5
below) and ‘Foresight’ studies undertaken by the Government Office for Science (GO
Science) and others, and the Futures Toolkit published by GO Science 25 26. Studies
25 The Futures Toolkit: Tools for strategic futures for policy-makers and analysts. Cabinet Office/Government
Office for Science, 2014, https://www.gov.uk/government/publications/futures-toolkit-for-policy-makers-and-
analysts
26 E.g. Outlook on the Global Agenda 2015, World Economic Forum,. http://reports.weforum.org/outlook-
global-agenda-2015. Assessment of Global Mega-Trends, European Environment Agency, 2015,
https://www.eea.europa.eu/soer-2015/global. Global Strategic Trends (fifth edition), Ministry of Defence
(DCDC), 2014, https://www.gov.uk/government/publications/global-strategic-trends-out-to-2045. UNEP
Frontiers 2016 Report. Emerging issues of environmental concern, UNEP, 2016,
https://europa.eu/capacity4dev/unep/document/unep-frontiers-2016-report-emerging-issues-environmental-
concern. Future State 2030: The global megatrends shaping governments, KPMG, 2013, http://www.kpmg-
institutes.com/institutes/government-institute/articles/2013/12/future-state-2030--the-global-megatrends-
shaping-governments.html. Shaping our future, Global Annual Review, PWC, 2015,
https://press.pwc.com/Multimedia/image/shaping-our-future--global-annual-review-2015/a/ad1ba078-0623-
4318-afdc-0bb178474359, The six global megatrends you must be prepared for, Hay, 2016,
http://www.haygroup.com/en/campaigns/the-six-global-megatrends-you-must-be-prepared-for/. The upside
of disruption. Megatrends shaping 2016 and beyond, EY, 2016, http://www.ey.com/gl/en/issues/business-
environment/ey-megatrends

19
undertaken for the Convention on Biological Diversity (CBD) illustrate that there are
plausible scenarios to achieve the CBD’s 2050 vision to conserve biodiversity, maintain
ecosystem services and deliver benefits essential for all people, but these require
transformational change in the way natural assets are used and managed (see Box 1.6).
Box 1.5: Global trends and emerging issues
The UK is bound to the rest of the world through multiple social, economic, technological and
environmental systems, enabling two-way flows of materials, people, ecosystem services,
financial resources, innovations and ideas. As a result, the UK's ecological and societal resilience
will be significantly affected in coming decades by a variety of global megatrends, these are large-
scale, generally slow moving but high impact and often interdependent social, economic, political,
environmental or technological changes.
There have been a number of recent studies looking at global trends26 and those listed below have
been flagged as important considerations when planning for the environment over the next 25
years:
Diverging trends in demographics e.g. with ageing populations in some areas and among
some groups, and more young people in others, this gives rise to greater diversity of value-
systems.
Increasing disease burdens and risks, these may be on human, animal and plant health,
through various routes and modes of transmission and the impacts of anti-microbial
resistance on our ability to deal with these.
Increasing parochial sentiments from global to sub-national, this may be combined with
decreasing sentiments towards cooperation and turning away from globalisation.
Increasing autonomy of the individual where the emphasis is on greater personal control, is
open source and off-grid.
Increasingly transformational, converging and open technological innovation. For example,
through artificial intelligence, there may be greater automation and autonomy, improvements
in information technology and use of data, and use of mobile technology leading to hyper-
connectivity. In addition to huge opportunities for tackling key challenges and delivering great
benefits, such technological disruptions may also bring risks and issues surrounding ethics
and vulnerability.
Increasing concern around extreme climate change related events and their impacts, these
are likely to play out differently in different areas, with some potentially disruptive effects, for
example on food production, water availability and migration.
Increasing pressure on terrestrial and marine ecosystems, environmental degradation and
pollution. This is a broad systemic issue recently brought into focus by evidence on the
pervasive spread of micro-plastics across the world. Despite progress in tackling point-
sources, the effects of wider diffuse pollution may increase through production and
consumption systems.

20
Increasing competition for resources for terrestrial and marine states, as development,
economic activity and population growth require space to operate within, and resources to
ensure continued production and enable consumption. Gains in resource productivity may
not be uniform or guaranteed into the future.
Diverging trends in economic growth and economic models. There may be a need for
alternative metrics and alternative configurations, building circular, regenerative or sharing
economies. There are emerging goals for economic activity such as sustainability.
Increasing urbanisation and focus on governance and geography. Different kinds of urban
pattern are emerging, where and how will these be governed?
Increasing demand for international and global policy coordination. There will be a need to
recognise limitations of global institutions but also face greater needs for global cooperation.
Increasingly multi-polar world and eastward economic power shifts.
Box 1.6: Pathways to achieve global sustainability goals by 2050
Scenarios analysis shows that very substantial changes from business as usual trends are
needed in order to meet three key global objectives by 2050: slow and then stop the loss of
biodiversity; keep average global temperature increases below 2°C; and attain other human
development goals. As many examples of recent environmental successes illustrate, solutions
for a sustainable future require a wide range of deep societal transformations – there is no
individual, simple policy tool available to address all of these challenges27 28.
Scenarios analysis suggests that global environmental goals can be attained while also reaching
broader socioeconomic objectives that include strong climate mitigation, improved diets and the
eradication of hunger. The analysis shows that outcomes can be achieved by various mixes of
polices which are explored in three pathways:
• Global technology: Focus on large-scale technologically optimal solutions, such as intensive
agriculture, and a high level of international coordination.
• Decentralized solutions: Focus on decentralized solutions, such as agriculture that is
interwoven with natural corridors and national policies that regulate equitable access to food.
• Consumption change: Focus on changes in human consumption patterns, most notably by
reducing meat intake per capita and by ambitious efforts to reduce losses in food systems.
The pathways differ in their emphasis on human behaviour as leverage for change, in the
relative weight of regulation versus markets, in coordination versus competition and on the
27 Global Biodiversity Outlook 4, Secretariat of the Convention on Biological Diversity, 2014,
https://www.cbd.int/gbo4/
28 Roads from Rio+20: Pathways to achieve global sustainability goals by 2050. Vuuren, D. V., Kok, M.,
Esch, S. V. D., Jeuken, M., Lucas, P., Prins, A. G., Scott, A. PBL Netherlands Environmental Assessment
Agency, 2012, http://www.pbl.nl/en/publications/2012/roads-from-rio20

21
characteristics and scale of the stimulation of technology. The pathways rely on a mix of different
actions, including:
Restoration of abandoned lands
Reduced nitrogen emissions
Mitigation of climate change
Reduced nature fragmentation
Reduced infrastructure expansion
Expanded protected areas
Reduced consumption and waste
Increased agricultural productivity

22
Section 2: The context for the 25 Year Environment Plan
2.1 Introduction
This section of the evidence report provides the context in which the ambitions and actions
of the 25 Year Environment Plan are framed. It considers the different facets of the
environment according to the conceptual framework underpinning the Plan (Figure 2.1),
considering both the state of the environmental “assets”, and the benefits that society
derives from them. It also summarises evidence relating to some of the pressures on and
interactions between assets, noting the importance of considering these systematically
when designing integrated policy responses to improve the environment.
As part of the context it also sets out what we know about people’s current attitudes and
behaviours towards the environment. Where possible information is presented for
England, but in some cases the most relevant information is only available for Great Britain
or the UK as whole. A short section summarises some of the key environmental issues in
the UK Overseas Territories.
Figure 2.1: Environmental assets and related benefits, drivers and pressures
The government publishes a full range of official and national statistics – see
https://www.gov.uk/government/organisations/department-for-environment-food-rural-
affairs/about/statistics for those produced by the Defra Group. The data underlying many
of these statistics is also available on Data.gov.uk. This section of the evidence report is
based on just some of these statistics and other published scientific data of relevance to
the goals of the 25 Year Plan. This data and knowledge landscape can never be
“complete”, but rather is constantly evolving and will continue to do so to support the
implementation of the Plan.
2.2 Atmosphere
The 25 Year Environment Plan sets out a goal of achieving “clean air”. This clearly
focuses on the asset of our atmosphere, as described below. Evidence relating to climate

23
change impacts are considered in section 2.10. The government has published a separate
Clean Growth Strategy that sets out policies for reducing greenhouse gas emissions29.
Quality
The atmosphere is a shared resource, the quality of which varies enormously at local
levels; including noise. Air pollution is a transboundary issue. It can be dispersed globally,
and therefore actions taken in this country will have international impacts and actions
taken elsewhere impact on England.
Assessments of air quality are undertaken in relation to the concentrations of particular
substances of concern or the amounts of emissions of those compounds from economic
activity in relation to national targets30. Air quality has improved significantly in recent
decades. Since 1970 sulphur dioxide (SO2) emissions have decreased by 96%, particulate
matter by 73% and nitrogen oxides (NOx) by 69%. Total emissions of NOx fell by a further
19% between 2010 and 201531 (see figure 2.2). However, levels of particulate matter and
ammonia show less of a decline than other pollutants and are now starting to increase for
various reasons. For particulate matter an increase in domestic wood burning is a key
reason. For ammonia, agricultural sources account for 80% of emissions. Livestock
practices, in particular slurry and manure storage and use, and application of urea-based
fertilizers are the key sources of ammonia emission from agriculture. An increase in
anaerobic digestion also contributes to ammonia emissions32.
Projected emissions show exceedances of particulate matter (PM2.5) in 2020 and 2030.
Emissions are also very close to 2020 ceilings30 for Non Methane Volatile Organic
Compounds (NMVOCs), ammonia and oxides of nitrogen and further action to reduce
emissions is required to meet the 2030 ceilings.
Ground level ozone (O3) is a toxic air pollutant and greenhouse gas. It is formed through
atmospheric conversion of pollutants, particularly volatile organic compounds (VOCs) and
NOx, and it is also formed naturally as plants release VOCs under certain conditions.
Policy interventions to control VOCs and NOx in previous years have successfully reduced
peak ozone concentrations. However, background ozone levels are increasing, and
current ozone exposures lead to widespread exceedance of critical thresholds for effects
29 The Clean Growth Strategy, HM Govt, 2017, https://www.gov.uk/government/publications/clean-growth-
strategy
30 National Emission Ceilings Directive, UNECE Gothenburg Protocol, Air Quality Standards Regulations,
European Environment Agency, 2016, https://www.eea.europa.eu/themes/air/national-emission-
ceilings/national-emission-ceilings-directive
31 Air Quality Pollutant Inventories, for England, Scotland, Wales and Northern Ireland: 1990-2015, National
Atmospheric Emissions Inventory, 2017, http://naei.beis.gov.uk/reports/reports?report_id=895
32 Inventory of Ammonia Emissions from UK Agriculture 2015, National Atmospheric Emissions Inventory
2016, http://naei.beis.gov.uk/reports/reports?report_id=928

24
on crops, forests and semi-natural vegetation33. This has led to, for example, a yield loss
in crop plants valued at around £180 million (for eight widely grown crop species, in the
2008 reference year)34.
Pollution particles, aerosols, and gases in the air deposit onto land and water. Sulphur
deposition in the UK has been significantly reduced, as a result of successful regulation
and emission reduction. The deposition of atmospheric nitrogen however (from oxides of
nitrogen and ammonia), has been at a slower rate over the last 20 years. Critical loads for
nitrogen deposition are exceeded across a large number and area of designated sites and
other semi-natural habitats. For example, over 88% of SSSIs in the UK have nitrogen
critical load exceedance35. These exceedances have resulted in overall reduction in the
number of plant species found in five widespread habitats in the UK by one-third36. An
important overall effect of air pollution is to reduce the resilience of sensitive habitats to
other threats, such as pests and climate change.
UK performance in reducing NOx and SO2 emissions compares well with other OECD
countries (fourth and ninth highest, respectively) with falls of 41% and 65% between 2000
and 2012, but other countries, notably Denmark and the Netherlands, have made greater
progress in reducing emissions of ammonia from agriculture37.
33 Review of Transboundary Air Pollution (RoTAP), NERC, 2012, http://www.rotap.ceh.ac.uk/
34 Impacts of Ozone Pollution on Food Security in the UK: A Case Study for Two Contrasting years, 2006
and 2008, Mills et al., 2011, https://www.ceh.ac.uk/news-and-media/news/two-new-ozone-pollution-reports-
published
35 Modelling and mapping of exceedance of critical loads and critical levels for acidification and
eutrophication in the UK 2013-2016, Hall et al., 2016, https://uk-
air.defra.gov.uk/library/reports?report_id=925
36 Nitrogen deposition and plant biodiversity: past, present, and future, Payne et al, 2017,
http://doi.org/10.1002/fee.1528
37 Convention on Long-range Transboundary Air Pollution, trends from 1990 until last reporting round,
http://webdab1.umweltbundesamt.at/official_country_trend.html?cgiproxy_skip=1

25
Figure 2.2: Summary trends in UK sulphur dioxide, nitrogen oxides, non-methane volatile
organic compounds, ammonia and particulate matter (PM10, PM2.5) emissions, 1970 to 2015
(Source: Defra38)
Although overall emissions have fallen for many air pollutants, more localised effects
remain; also, the number of people exposed to high concentrations is more relevant for
human health than overall emissions (see below). On local air quality, the UK is one of 16
EU member states failing to meet nitrogen dioxide (NO2) targets due to roadside
emissions.
Poor air quality persists in certain areas of the country as a direct result of the failure of the
European regulatory system to deliver expected improvements in vehicle emissions.
Standards on vehicle engines (known as “Euro Standards”), which should have led to
major reductions in emissions of NO2 from vehicles, failed to deliver, particularly for diesel
38 Emissions of Air Pollutants in the UK, 1970 to 2015, Defra,
https://www.gov.uk/government/statistics/emissions-of-air-pollutants
Summary trends in UK sulphur dioxide, nitrogen oxides, non-methane volatile organic
compounds, ammonia and particulate matter (PM10, PM2.5) emissions, 1970 to 2015

26
vehicles, whose “real world” emissions have proven to be many times higher than
laboratory tests39.
Overall, UK emissions of greenhouse gases have reduced by 38% since 1990 to 496
million tonnes of carbon dioxide equivalent (MtCO2e) in 2015. Agriculture’s emissions have
fallen by 17% over this period to around 50 MtCO2e, and the waste sector has achieved a
reduction of 73% to around 20 MtCO2e40. Greenhouse gas emissions per capita in the
UK are high compared to other OECD countries (22nd out of 33 OECD countries), but
emissions have been reduced by 22% since 2000 at a faster rate than most other OECD
countries (the fourth greatest improvement in the OECD).
The World Health Organisation (WHO) categorises noise as being the second worst
environmental cause of ill health in Europe41; circa 1.6 million healthy life years are
estimated to be lost each year in urban areas across Europe, with a societal cost of
approximately €40 billion per year in the EU (0.4% EU GDP)41. There is increasing
evidence that long-term exposure to high noise levels is associated with illnesses like
heart attacks and strokes.
National noise maps published in 2015 estimated that 8% of England’s population had a
noise exposure of more than 55 decibels from transport noise42 – a level of exposure which
the World Health Organisation states “is considered increasingly dangerous for public
health”. Nearly half of people in the UK felt noise spoilt their home life to some extent in
201242, an increase from 43% in 2000.
Costs and benefits
Air pollutants can affect biodiversity and ecosystem services, harm human health, damage
crops, and contribute to climate change. Reducing air pollution will generally be beneficial
overall but impacts vary depending on the pollutant and what is affected.
Air pollution affects ecosystem structure and function and therefore a wide range of the
benefits that ecosystems provide. Ammonia can cause direct damage to plants and is
39 UK plan for tackling roadside nitrogen dioxide concentrations, Defra/DfT, 2017,
https://www.gov.uk/government/publications/air-quality-plan-for-nitrogen-dioxide-no2-in-uk-2017
40 Final UK greenhouse gas emissions national statistics: 1990-2015, Defra, 2017,
https://www.gov.uk/government/statistics/final-uk-greenhouse-gas-emissions-national-statistics-1990-2015
41 Burden of disease from environmental noise, World Health Organisation, 2011,
http://www.who.int/quantifying_ehimpacts/publications/e94888/en/
42 2012 strategic noise mapping dataset, Defra, 2015, https://www.gov.uk/government/publications/open-
data-strategic-noise-mapping

27
highly toxic to many mosses and lichen43 44. Increased ammonia in air can also reduce
the ability of plants to cope with other environmental stresses such as drought and
disease. Increasing nitrogen deposition is associated with a decline in plant species
richness in a large number of UK habitats, including acid grassland, sand dune grassland,
heathlands, bogs, and deciduous woodland45 46.
Air pollutants affect human health and are a particular threat to vulnerable groups,
including the elderly, the very young, and those with existing health issues, such as
respiratory conditions. Short-term exposure to elevated levels of air pollution can cause a
range of effects including exacerbation of asthma, effects on lung function, increases in
hospital admissions and mortality. Epidemiological studies have shown that long-term
exposure reduces life-expectancy, mainly due to increased risk of mortality from
cardiovascular and respiratory causes and from lung cancer. Those living in city centres,
and near busy roads, often on the lowest incomes, are most exposed to dangerous levels
of air pollution.
While the accumulating evidence supporting links between exposure to certain air
pollutants and a range of medical effects continues to strengthen, it remains difficult to
quantify the impacts, either in terms of equivalent mortality through shortened lifespans, or
the wider social costs, for example impacts on the National Health Service, and the wider
economy through days at work lost. While it is likely that social impacts are significant, any
quantified estimates from analyses are subject to significant uncertainty, and are more
likely to be illustrative than definitive. The burden can also be represented as an average
loss of life expectancy from birth of approximately six months across the whole of the UK
population. Analysis also shows that in 2012, the cost of air pollution to the economy via its
effects on productivity was estimated to be £2.7 billion47.
Surveys have shown that the majority of people think that tranquil (or quiet) areas should
be protected. People in urban areas value the ability to enjoy areas of tranquillity or
43 Assessing the risks of air pollution impacts to the condition of Areas/Sites of Special Scientific Interest in
the UK, JNCC, 2006, http://jncc.defra.gov.uk/page-3832
44 Measures to evaluate benefits to UK seminatural habitats of reductions in nitrogen deposition, Defra,
2014, https://uk-air.defra.gov.uk/library/reports?report_id=862
45 Assessing the effects of small increments of atmospheric nitrogen deposition (above the critical load) on
semi-natural habitats of conservation importance, Caporn et al., 2016,
http://publications.naturalengland.org.uk/publication/5354697970941952; Review of Transboundary Air
Pollution (RoTAP), Centre for Ecology & Hydrology, 2012, http://www.rotap.ceh.ac.uk/
46 A review and application of the evidence for nitrogen impacts on ecosystem services. Jones et al., 2014,
http://doi.org/10.1016/j.ecoser.2013.09.001
47 Valuing the Impacts of Air Quality on Productivity: Final report, Ricardo-AEA, 2014, https://uk-
air.defra.gov.uk/assets/documents/reports/cat19/1511251135_140610_Valuing_the_impacts_of_air_quality_
on_productivity_Final_Report_3_0.pdf

28
relative quiet, away from the sounds of urban life. Tranquillity provides a number of
important benefits to human wellbeing - including improved creativity, problem solving,
mental health, concentration and restoration. Protection of quiet areas in the major cities
of England could be valued at as much as £1.4 billion48. The annual social cost of urban
road noise in England has been estimated at £7 billion to £10 billion49.
2.3 Freshwater
The 25 Year Environment Plan sets out goals of achieving clean and plentiful water, and
reducing the risks of harm from environmental hazards. The freshwater asset interacts
strongly with both of those goals.
Extent, quantity and quality
England has approximately 136,000 kilometres of rivers and streams, 2,624 kilometres of
canals, and over 97,000 hectares of standing waters. Within standing waters, there are
approximately 234,000 ponds and around 5,710 permanent lakes and reservoirs greater
than 1 hectare in size50.
The UK has 145 billion cubic metres a year of renewable water resources51. Some of
these are under pressure from high abstraction, which could increase with population
growth and climate change.
There are no pristine freshwater ecosystems in England, reflecting significant pollution and
alteration of many water bodies in past centuries. But in recent decades major
improvements have been made. In England and Wales, the biological and chemical
classification of 7,000 kilometres and 12,000 kilometres of rivers, respectively, improved
significantly from 1990 to 2008. Although still short of full recovery, effects have been most
marked across formerly polluted catchments with extensive urbanised land, and reflect
48 The Economic Value of Quiet Areas, URS Scott Wilson, 2011,
http://randd.defra.gov.uk/Default.aspx?Module=More&Location=None&ProjectID=17600
49 Noise pollution: economic analysis, Defra, https://www.gov.uk/guidance/noise-pollution-economic-analysis
50 Countryside Survey: England Results from 2007 (published September 2009). NERC/Centre for Ecology &
Hydrology, Department for Environment, Food and Rural Affairs, Natural England:
http://www.countrysidesurvey.org.uk/content/england-results-2007
51 AQUASTAT Global water information system, Food and Agricultural Organization of the United Nations,
2015, http://www.fao.org/nr/water/aquastat/main/index.stm

29
investments in wastewater treatment and other point source discharges52 53 (see Figure
2.3).
Figure 2.3: Reduction in the ammonia, Biochemical Oxygen Demand (BOD) and phosphorus
load discharged to rivers by sewage treatment works, 1995 to 2015 (Source: Environment
Agency54)
Currently 16% of water bodies are classed as in good or high chemical and biological
status and 75% of tested elements are a good or high standard. This has remained
reasonably stable since 2009 (see Figure 2.4).
52 UK National Ecosystem Assessment 2011, UNEP-WCMC, http://uknea.unep-
wcmc.org/Resources/tabid/82/Default.aspx
53 Harmonised Monitoring Scheme statistical dataset, Defra, 2012,
https://www.gov.uk/government/statistical-data-sets/env-16-harmonised-monitoring-scheme-datasets
54 Regulating for People, the Environment and Growth. Environment Agency December 2017,
https://www.gov.uk/government/publications/regulating-for-people-the-environment-and-growth
Loads discharged to rivers from water company sewage treatment works in England and Wales,
1995 to 2015

30
Figure 2.4: Status of surface water bodies in England, 2009 to 2016 (NB: a new survey
protocol ‘Cycle 2’ was used in 2016 which is not directly comparable with previous years)
(Source: Environment Agency)
Notes to figure 2.4:
1. Based on numbers of surface water bodies classified under the Water Framework Directive in England.
Includes rivers, canals, lakes, estuaries and coastal water bodies, but excludes SSSI ditches and
surface water transfers.
2. A water body is a management unit, as defined by the relevant authorities.
3. The results published each year relate to data reported in that year under the Water Framework
Directive. From 2016 the Environment Agency has moved to a triennial reporting system and will report
next in 2019.
4. Percentage of water bodies in each status class has been calculated based on the total number of water
bodies assessed in each year. Number of water bodies assessed varies slightly from year to year: in
2009 5,651 water bodies were assessed, in 2010 5,587 water bodies, in 2011 5,607, in 2012 5,692 in
2013 5,735, in 2014 5,769, in 2015 5,738 and in 2016 5,012 in cycle 1 and 4,656 in cycle 2. This
reduction in the number assessed in 2016 was primarily due to removal of a number of water bodies that
were below the 10km2 catchment area in line with guidance.
5. Water bodies that are heavily modified or artificial (HMAWBs) are included in this indicator alongside
natural water bodies. HMAWBs are classified as good, moderate, poor or bad ‘ecological potential’.
Results have been combined; for example, the number of water bodies with a good status class has
been added to the number of HMAWBs with good ecological potential.
Status classifications of surface water bodies in England under the Water Framework
Directive, 2009 to 2016

31
The most significant factors contributing to waters not reaching good status are: physical
modifications; pollution from waste water; pollution from rural areas, such as agricultural
run-off including nutrients and sediment pollution from towns, cities and transport; changes
to the natural flow level of water; and invasive non-native species55. Chemicals and
nutrients remain the most challenging water quality pressures with agricultural and rural
activities contributing to around 30% of failures. Around 46% of land in England is
designated as a Nitrate Vulnerable Zone due to the risk of high nitrate concentrations in
surface waters55.
Ground water shows a long-term decline in quality, which is difficult to reverse because
polluted water moves through rock strata slowly maybe for decades to reach the
groundwater body.
There are around 540,000 hectares of terrestrial and coastal Natura 2000 protected areas
in England that have water dependent features. To ensure that the conservation objectives
of the Natura 2000 sites are met, further action will be needed on some 42% of sites by
area55.
Costs and benefits
Fresh, clean water is essential to life and underpins all human activity (including economic
activity), as well as the functioning of most ecosystems. This includes drinking water and
other water for household and industrial use, notably power generation (cooling for power
stations and hydropower) and agriculture. Water bodies also transport and treat effluents
from domestic and industrial waste.
Total abstractions per head of population in England are about 266 cubic metres per
year56, compared to the OECD average of over 800, driven by many countries’ larger
industrial use including power (France) or by agricultural irrigation (Spain). Levels of use of
available resources are highest in South East England.
In England, about 14.7 million cubic metres of water are abstracted in total, of this, 50%
comes from freshwater, 36% from tidal sources and the remaining 14% from groundwater.
Around 35% of this is used for public water supply. Electricity generation and other
industries use 59% and 7% goes to fish farming and agricultural uses.
55 River basin management plans, Environment Agency, 2015,
https://www.gov.uk/government/collections/river-basin-management-plans-2015
56 Water abstraction tables, Defra, 2017, https://www.gov.uk/government/statistical-data-sets/env15-water-
abstraction-tables

32
Natural assets contribute an estimated £1 billion to public water supply in the UK
annually57. The total asset value of UK freshwaters including benefits for public water
supply, recreational visits and fisheries is estimated at £39.5 billion.
Water bodies provide a wide range of recreational benefits for anglers, and other users of
riparian habitat (e.g. walkers, bird watchers), as well as to practitioners of water sports
(e.g. rowers) and through navigation and boating activities. In England, anglers spend
£1.1 billion each year, supporting 36,000 full-time jobs58, the value of day visits attributed
to freshwater habitats is £303 million57, and there are 3,000 licensed boats on inland
waterways in England and Wales59.
Freshwater also provides landscape and amenity value for local residents which can be
associated with a measurable premium in property values60, as well as having a cooling or
climate moderation function in urban areas61.
Flooding can be a significant risk to people, homes and businesses and is estimated to
cause an expected £1.3 billion of damage to property annually in England (see Figure 2.5).
The total costs, including damages, from severe floods in Northern England during the
winter of 2015/16 are estimated to be in the range £1.3 to £1.9 billion62. Investment to
reduce flood risk brings significant benefits, with every £1 of capital spend on flood
defences yielding £9.50 of avoided damages on average63. Recent studies have also
shown that flood defences significantly raised property prices in urban areas at risk of
flooding in England and Wales64.
In England, 42,000 more homes were better protected from flooding last year65. These
improvements face increasing pressures, with 36,000 properties flooded in the 2013 to
57 UK natural capital: ecosystem accounts for freshwater, farmland and woodland, Office for National
Statistics, 2017, https://www.ons.gov.uk/releases/uknaturalcapitallandandhabitatecosystemaccounts
58 Economic evaluation of inland fisheries, Environment Agency, 2009,
https://www.gov.uk/government/publications/economic-evaluation-of-inland-fisheries
59 Canal and River Trust Annual Report 2016/17, https://canalrivertrust.org.uk/about-us/annual-report
60 UK National Ecosystem Assessment 2011, UNEP-WCMC, http://uknea.unep-
wcmc.org/Resources/tabid/82/Default.aspx
61 Hathway, E. A. and Sharples, S. (2012). The interaction of rivers and urban form in mitigating the urban
heat island effect: a UK case study, http://doi.org/10.1016/j.buildenv.2012.06.013
62 Estimating the economic costs of the 2015 to 2016 winter floods. Environment Agency, 2018,
https://www.gov.uk/government/publications/floods-of-winter-2015-to-2016-estimating-the-costs
63 Flood and coastal erosion risk management outcome measures, Environment Agency, 2015,
https://www.gov.uk/government/statistics/flood-and-coastal-erosion-risk-management-outcome-measures
64 Beltran, A., Maddison, D. and Elliott, R. (2017). Assessing the Economic Benefits of Flood Defences: A
Repeat Sales Approach. Department of Economics, University of Birmingham.
http://www.webmeets.com/EAERE/2016/prog/viewpaper.asp?pid=879
65 Annual report and accounts for the financial year 2016-2017, Environment Agency, July 2017,
https://www.gov.uk/government/publications/environment-agency-annual-report-and-accounts-2016-to-2017

33
2014 and 2015 to 2016 flood events together62, often after unprecedented weather events.
Modelling and mapping of flood risk shows the risk is likely to increase with the pressures
of urbanisation and climate change66. Natural flood management approaches which can
deliver multiple benefits are being demonstrated in a number of flood and catchment
management schemes, including examples in North Yorkshire, Somerset and Derbyshire
and on the Humber and Severn estuaries67.
Figure 2.5: Damages and damages avoided in recent major flood events (Source:
Environment Agency62)
2.4 Species and ecological communities (on land)
The 25 Year Environment Plan has a goal of achieving thriving plants and wildlife on land
and in the sea. This section provides evidence of the species and ecological communities
on land and in our fresh waters, with detail on marine wildlife contained in section 2.5
66 The UK Climate Change Risk Assessment 2017 Synthesis Evidence Report, Adaptation Sub-Committee
of the Committee on Climate Change, https://www.theccc.org.uk/tackling-climate-change/preparing-for-
climate-change/uk-climate-change-risk-assessment-2017/
67 Working with natural processes to reduce flood risk; and Working with natural processes to reduce flood
risk: The evidence behind natural flood management, Environment Agency, 2017,
https://www.gov.uk/government/publications/working-with-natural-processes-to-reduce-flood-risk

34
Abundance, extent and quality
Globally, species and the ecological communities they create are under great pressure, with
the global extinction rate suggested to be 1,000 times the background rate (i.e. typical rates
recorded in the fossil record)68 and continuing high levels of habitat loss and damage (e.g.
tropical rain forest and coral reefs)69. Species living within the ecological communities they
create capture carbon and lock it in soils, they intercept rainfall, filter air and water borne
pollutants, store water and reduce soil erosion and runoff.
There have been significant declines in species and ecological communities in terrestrial
and freshwater ecosystems in England over the last 50 years or more, with land use
change and pollution being major drivers of this change70 71.
In the shorter term, conservation action, including improved management through
incentives, as well as better protection has helped to stabilise populations of some
threatened (priority) species, for example, conservation activities have led to the recovery
of red kite populations. By the end of the 19th century red kites were completely lost from
England and Scotland, with only a small residual population remaining in Wales72. A
reintroduction programme combined with measures to reduce persecution have proved
highly successful leading to a significant increase in the population73. According to the
latest results of the Breeding Bird Survey, between 1995 and 2015 the UK red kite
population increased more than tenfold74. As a result of the population recovery the
species is now included on the ‘Green’ list (low concern) of the latest UK birds of
conservation concern assessment but many other species in the wider environment are
still declining75.
68 Estimating the normal background rate of species extinction, JM De Vos, LN Joppa, JL Gittleman, PR
Stephens, SL Pimm, Conservation Biology, 2015, http://doi.org/10.1111/cobi.12380
69 Baillie, J.E.M., Hilton-Taylor, C. and Stuart, S.N. Eds. (2004). 2004 IUCN Red List of Threatened Species.
A Global Species Assessment, http://www.iucnredlist.org/about/publication/analyses
70 The UK National Ecosystem Assessment, UNEP-WCM, 2011, http://uknea.unep-
wcmc.org/Resources/tabid/82/Default.aspx, gives details of change across a variety of taxonomic groups, as
well as an assessment of the robustness of our evidence in each case.
71 UK Biodiversity Indicators 2017, Defra, https://www.gov.uk/government/statistics/biodiversity-indicators-
for-the-uk
72 Return of the red kite: the red kite reintroduction programme in England. English Nature Research Report,
http://publications.naturalengland.org.uk/publication/84009
73 The state of the UK’s birds 2016. RSPB, BTO, WWT, DAERA, JNCC, NE, NRW and SNH,
https://ww2.rspb.org.uk/our-work/conservation/centre-for-conservation-science/state-of-the-uks-birds
74 The Breeding Bird Survey 2016. British Trust for Ornithology, https://www.bto.org/volunteer-
surveys/bbs/bbs-publications/bbs-reports
75 Eaton M.A., Aebischer N.J, Brown A.F., Hearn R.D., Lock L., Musgrove A.J., Noble D.G., Stroud D., and
Gregory R.D. (2015). Birds of conservation concern 4: the population status of birds in the UK, Channel
Islands and Isle of Man, British Birds, 108, pp.708-746. https://britishbirds.co.uk/article/birds-of-conservation-
concern-4-the-population-status-of-birds-in-the-uk-channel-islands-and-isle-of-man/

35
There has been an improvement in the condition of nationally protected sites (Sites of
Special Scientific Interest or SSSIs). In 2016, 38.5% of SSSIs were in a good condition
(favourable) in England, up slightly from five years ago76. A further 57.4% of SSSIs are in
recovering condition (unfavourable improving), up from 13% in 2003. Favourable condition
is determined by assessing the status of attributes of interest, for habitats this can include
area covered, key species abundance and distribution, composition and structure and
supporting ecological processes. Targets are set for each attribute and together these are
used to determine the status of the habitat77. There has also been an improvement in the
condition of wildlife habitats on land managed for wildlife outside of protected sites. As of
January 2017, 64% of wildlife habitats identified as a priority78 were in favourable or
recovering condition79.
Despite these improvements in condition of SSSIs and priority habitats, the most important
habitats (those for which the UK has a European level responsibility) remain in relatively
poor condition (71% unfavourable for the UK versus an EU average of 30%)80. The main
factors causing unfavourable condition are intensification of agriculture; under- and over-
grazing by farmed livestock; grazing by wild deer in woodlands; air and water pollution;
and changes in drainage80 81.
76 A strategy for England's wildlife and ecosystem services, Biodiversity Indicators: 2017 assessment, Defra,
2017, https://www.gov.uk/government/statistics/england-biodiversity-indicators
77 JNCC guidance on common standards monitoring, http://jncc.defra.gov.uk/page-2201
78 Biodiversity 2020: A strategy for England’s wildlife and ecosystem services, Defra, 2011,
https://www.gov.uk/government/publications/biodiversity-2020-a-strategy-for-england-s-wildlife-and-
ecosystem-services
79 Figures from Natural England
80 Third UK Habitats Directive Report, 2013, http://jncc.defra.gov.uk/page-6387
81 Evidence statements to accompany the ecological biodiversity indicators (BE0112), Defra, 2016,
http://randd.defra.gov.uk/Default.aspx?Menu=Menu&Module=More&Location=None&ProjectID=19528&Fro
mSearch=Y&Publisher=1&SearchText=BE0112&SortString=ProjectCode&SortOrder=Asc&Paging=10#Desc
ription

36
Figure 2.6: Change in relative abundance of priority species in the UK, 1970 to 2015
(Source: Bat Conservation Trust, British Trust for Ornithology, Butterfly Conservation,
Centre for Ecology & Hydrology, Defra, Joint Nature Conservation Committee, People’s
Trust for Endangered Species, Rothamsted Research, Royal Society for the Protection of
Birds)
Notes to Figure 2.6:
1. Based on 215 species. The line graph shows the unsmoothed trend (dotted line) with its 95%
confidence interval (shaded).
2. The bar chart shows the percentage of species increasing or declining in abundance over the long-term
(1970 to 2015) and the short-term (2010 to 2015).
3. All species in the indicator are present on one or more of the country priority species lists (Natural
Environmental and Rural Communities Act 2006 – Section 41 (England), Environment (Wales) Act 2016
section 7, Northern Ireland Priority Species List and Scottish Biodiversity List).
Abundance data are available for a limited number (215) of the most threatened (priority)
species in the UK, including species selected as a ‘priority’ because of their rapid decline.
These data show a long-term decline in abundance continuing for many priority species up
to 2015. However, 40% of these priority species increased in abundance in the latest five
years (see Figure 2.6). Data on distribution are available for a larger number of priority
species (714) and the percentage of these becoming less widespread is currently
balanced by those becoming more widespread82.
82 A strategy for England's wildlife and ecosystem services, Biodiversity Indicators: 2017 assessment, Defra,
2017, https://www.gov.uk/government/statistics/england-biodiversity-indicators
Change in the relative abundance of priority species in the UK, 1970 to 2015

37
The averages mask a complex picture of differences between species. Birds that are
specialised to certain habitats, for example, have tended to decline, while generalist birds
have tended to be stable or increasing. Some populations are very variable year on year
(butterflies) and some species appear to have increased considerably this century (bats).
The long-term trend for breeding farmland birds in England shows a decline, with 57%
declining in numbers since 1970 (see figure 2.7). In the short term 32% of farmland bird
species have increased, 32% have declined and 37% show no change. The index for
breeding woodland birds in England has declined by 25% over the same time period83.
Figure 2.7: Breeding farmland birds in England, 1970 to 2016 (Source: British Trust for
Ornithology, Department for Environment Food and Rural Affairs, Joint Nature
Conservation Committee and the Royal Society for the Protections of Birds)
Notes to Figure 2.7:
1. Figure in brackets shows number of species.
2. Graph shows unsmoothed trend (dashed line) and smoothed trend (solid line) with its 95% confidence
interval (shaded).
3. Bar chart shows the percentage of species within the indicator that have increased, decreased or shown
no change, based on set thresholds of annual change.
4. The bar chart provided alongside the headline chart shows the percentage of species within that indicator
that have increased, decreased or shown no change. Whether an individual bird species is increasing or
decreasing has been decided by its rate of annual change over the time period (long or short) of interest.
The available data on trends are largely based on the species that are monitored within
expert volunteer schemes. These tend to be the species (such as birds, butterflies and
bats) that are widely appreciated and can be observed by volunteers, rather than those
which are less obvious and more difficult to identify and observe, though these may
83 Wild Bird Populations in England, 1970 to 2016, Statistical Release, Defra 2017.
https://www.gov.uk/government/statistics/wild-bird-populations-in-england
Breeding farmland birds in England, 1970 to 2016

38
nevertheless be important for their function as part of an ecosystem. Far less is known
about changes, for example, to soil organisms, though they play important roles such as
nutrient cycling and pest and disease regulation.
An example of a functional group of species that support wider socio-economic interests,
for which relatively good quality data are available, is pollinating insects. The data for 389
species in the UK show a general decline in the ranges occupied by pollinators since the
mid-1980s84 (see Figure 2.8).
Figure 2.8: Change in the distribution of pollinators, 1980 to 2014, United Kingdom (Source:
Bees, Wasps & Ants Recording Society; Hoverfly Recording Scheme; Biological Records
Centre (supported by Centre for Ecology & Hydrology and Joint Nature Conservation
Committee, Defra))
Notes to Figure 2.8:
1. Based on a total of 389 insect pollinators, comprising 147 wild bee species and 242 hoverfly species.
2. Graph shows the composite indicator trend with variation around the line (shaded) within which we can be
90% confident that the true value lies.
3. Bar chart shows the percentage of species within the indicator that have increased, decreased or shown
no change in occupancy, based on set thresholds of change.
Despite the important contribution designated sites have made, England’s wildlife habitats
have become increasingly fragmented and isolated, leading to declines in the provision of
some ecosystem services, and losses to species populations. The Lawton Review85
84 A strategy for England's wildlife and ecosystem services, Biodiversity Indicators: 2017 assessment, Defra,
2017, https://www.gov.uk/government/statistics/england-biodiversity-indicators
85 Making Space for Nature: A review of England’s Wildlife Sites and Ecological Network, 2010,
http://webarchive.nationalarchives.gov.uk/20110318111038/http://www.defra.gov.uk/environment/biodiversity
/index.htm
Change in the distribution of UK pollinators, 1980 to 2014

39
concluded that limiting wildlife conservation to small and isolated sites is insufficient to halt
biodiversity loss alone because:
It is almost always the case that large areas support more species than smaller
areas (the ‘species-area relationship’), both because they support larger
populations of individual species that are less likely to fluctuate to local extinction (in
a hard winter, for example) and because they are likely to be more physically
variable (in their geology, topology, and variety of habitats), providing greater
habitat diversity.
Larger areas of semi-natural habitat reduced ‘edge effects’. The edges of habitats
(for instance a wood) abutting a more hostile environment (a cereal field for
example) often differ markedly in microclimate and other characteristics from the
habitat centre and small patches of semi-natural habitat (e.g. grassland) may be
degraded by nutrient pollution from fertilisers and spray drift from adjacent arable
land.
Inbreeding and so-called ‘Allele effects’ where species breed less successfully or
not at all at low densities can threaten the viability of small populations of species
on small isolated sites.
Models suggest that networks of wildlife sites may need to be significantly larger
than they currently are to cope with climate change.
The Lawton Review acknowledged that re-creating large expanses of continuous natural
habitat was not a feasible option over most of England, though recommended that
attempts to establish significantly ‘bigger and better’ areas should be made. It also
proposed that in addition to a network of high quality protected sites, ecological
connections such as buffer zones, wildlife corridors and smaller but still wildlife-rich
‘stepping stones’ were developed between sites. The review noted that these connections
did not have to be continuous, physical connections (a mosaic of mixed land use, for
example, may be sufficient) but the permeability of the landscape to species (or their
genes) was what mattered.

40
Restoration of lowland heath from plantation forest at Tidenham Chase, Gloucestershire
Benefits
The very existence of species and ecological communities is valued by many people,
especially those that are rare, threatened or otherwise iconic or culturally significant. They
also deliver a range of benefits directly and indirectly because they underpin almost all
other ecosystem services through which benefits are derived from natural capital (see Box
2.1).

41
2.5 Oceans (including marine species and ecological communities)
The 25 Year Environment Plan has goals of thriving plants and wildlife and of using
nature’s bounty sustainably. Both of these goals concern the marine environment, which
provides both food and a wide range of other benefits to society, as set out in this section.
Extent and quality
The marine waters of the UK (excluding the Overseas Territories) extend to over 867,000
square kilometres, which is more than three and a half times the land area86. There are
17,820 kilometres of mainland coastline and the widest range of marine habitats of any
Atlantic European country. Coastal waters contain a rich diversity of plankton,
invertebrates, fish and higher predators, with around 8,500 species of animals and
plants87. As well as forming the foundation for all marine ecosystems, marine geological
features provide oil and gas which are a crucial driver of the national and international
86 UK National Ecosystem Assessment 2011, UNEP-WCMC: http://uknea.unep-
wcmc.org/Resources/tabid/82/Default.aspx
87 The State of Nature Report 2016, The State of Nature Partnership, https://ww2.rspb.org.uk/our-
work/conservation/projects/state-of-nature-reporting
Box 2.1: Summary of benefits provided by species and ecological communities86
Benefit Components of the species and ecological communities asset providing
the benefit
Clean water Upland wetlands; woodland, moorland and grassland ecosystems in upper
catchments
Climate regulation All terrestrial ecosystems, including soil ecosystems, and especially peatland,
woodland, wetland and coastal systems
Wildlife (as a direct
benefit)
All aspects, but particularly rare, threatened or iconic species and habitats
Hazard protection Woodland and wetland high in catchments. Salt marsh and sand dunes.
Recreation, health,
tourism and amenity
Woodland, heathland and greenspace near urban areas. Coastal, freshwater,
upland, enclosed farmland and mountain ecosystems; and iconic species
Clean air All ecosystems, especially woodland, wetland and coastal, and marine
systems
Disease and pest
control
Predatory insects; parasites, arable field margins and field boundaries.
Fruit; some oil crops Pollinating insects
Food, fruit, fibre Woodland and grassland, soil ecosystems
Soil formation Soil ecosystems

42
economy as well as providing fuel for transport and raw material for products such as
plastics. Coastal areas are diverse, rich in heritage and busy with human activities
providing access to the sea for substantial maritime activities including ports and shipping,
marine aggregates, tourism, recreation, communications cabling, energy production,
fisheries, aquaculture and surface and waste water treatment88 .
Marine ecosystems contribute significantly to climate change mitigation, air quality, flood
defence, water quality, wildlife, heritage, seascape, health and wellbeing (see Figure 2.9).
Figure 2.9: Summary of ecosystem services and benefits provided by marine ecosystems
(Source: European Environment Agency89)
88 UK Marine Policy statement, Defra, 2011, https://www.gov.uk/government/publications/uk-marine-policy-
statement
89 Seafood in Europe: A food system approach for sustainability. European Environment Agency, 2016. EEA
Report No 25/2016. Luxembourg: Publications Office of the European Union, 2016.
https://www.eea.europa.eu/publications/seafood-in-europe-a-food

43
A set of 11 descriptors are used to define the status of UK seas90. These address the
status of species (including marine mammals, birds and fish), food webs, seafloor and
pelagic habitats. They also address the human pressures that impact on the marine
environment including invasive non-native species, fishing activity, contaminants, marine
litter and underwater noise. Some aspects of the status of the UK’s seas have improved
since 2012 but still some measures are required to secure healthy and productive seas.
Approximately 30% of UK fish stocks that are regularly assessed were harvested at
sustainable levels in 2013, an increase from 15% in 2000. The proportion of large fish in
the North Sea had also recovered by 2014 to levels last seen in the 1980s91 (see Figure
2.10). However, such recent trends need to be set in a longer context to draw conclusions
about long-term sustainability of marine ecosystems92.
Figure 2.10: Percentage of large fish in the North-western North Sea, 1983 to 2014 (Source:
CEFAS, Marine Scotland)
Notes to Figure 2.10:
90 Marine Strategy part one: UK initial assessment and good environmental status, Defra, 2012,
https://www.gov.uk/government/publications/marine-strategy-part-one-uk-initial-assessment-and-good-
environmental-status
91 UK Biodiversity Indicators 2017, JNCC, http://jncc.defra.gov.uk/page-4229
92 Charting Progress 2: The State of UK Seas, UK Marine Monitoring and Assessment Strategy (UKMMAS)
community, Defra, 2010,
http://webarchive.nationalarchives.gov.uk/20141203170558/http://chartingprogress.defra.gov.uk/
Proportion of large fish (equal to or larger than 40cm), by weight, in the North-western North Sea,
1983 to 2014

44
1. Graph shows unsmoothed trend (dashed line) and a LOESS smoothed trend (solid line) with the shaded area showing the 95% confidence intervals around the smoothed trend.
2. LOESS is a non-parametric regression method; it may be understood as standing for “Local 44egression”.
In 2017, 406 (98.3%) of 413 coastal bathing waters measured in England met at least the
minimum standard and 270 (65.4%) bathing waters were classified as excellent93. Bathing
water quality has improved progressively since monitoring started in 1995 (see Figure
2.11).
Figure 2.11: Trend in Bathing Water Quality for England, 1995 to 2017 (Source: Environment
Agency)
Notes to Figure 2.11:
1. The assessments are based on a 4 year monitoring period except where a bathing water is newly
designated, temporarily closed or a step change have been applied.
2. The following rules have been used for all years when calculating the back dated rBWD classifications:
• Step changes applied – samples collected prior to step change excluded from the classification
assessment.
• The bathing waters parameters changed in 2012 from Faecal Coliforms and Faecal Streptococci to
Ecoli and Intestinal Enterococci respectively. Any sample results pre 2012 are based on these older
parameters.
• Discounted and Replacement samples applied – From 2013 samples discounted under short term
pollution (STP) were excluded from the classification assessment. Replacement samples were
collected and included in assessment in 2013 and 2014 only.
• Closed bathing waters – Sample selection window reset for the next open year for bathing water.
93 Following protocols set out in the Bathing Water Directive, European Parliament, 2006, http://eur-
lex.europa.eu/legal-content/EN/TXT/PDF/?uri=CELEX:32006L0007&from=EN

45
• Insufficiently sampled bathing waters – Where a water did not meet the EU rules regarding sampling,
and is classed as “insufficiently sampled “. Those samples are still included in future classification
assessments.
There is incomplete understanding of current levels, properties, impacts and costs of
marine litter in the UK waters though evidence suggests that 12.2 million tonnes of plastics
leak into the ocean each year 94. The UK has already proposed some measures (such as
the ban of microplastics in rinse-off cosmetic and personal care products and the plastic
carrier bags charge policy) which are expected to reduce the environmental impacts.
Ocean acidification is closely linked with climate change as they share the same driver:
increasing atmospheric carbon dioxide (CO2). Ocean uptake of CO2 has increased surface
ocean hydrogen ion concentration by around 30% to date, and decreased surface
carbonate ion concentration by around 16% globally95.
However, whilst there are some improving trends, further measures are required to secure
healthy and productive sea96.
Designation of Marine Protected Areas (MPAs) is one important mechanism for
addressing some of these pressures in the marine environment. 35% of England’s seas
are now within MPAs which provide legal protection for important and vulnerable habitats
and species. In English waters there are currently 50 Marine Conservation Zones (MCZs),
covering over 20,000 square kilometres of sea. MCZs are specific types of MPA created
under the Marine and Coastal Access Act 2009. They are designated for a range of
nationally important marine wildlife, habitats, geology and geomorphology, and can be
designated anywhere in English and Welsh territorial and UK offshore waters. Marine
protected areas have also been designated around some of the UK’s Overseas Territories
(see section 2.9). The UK works together and cooperates with 15 governments and the
European Union to protect the marine environment of the North-East Atlantic through the
OSPAR (Oil Spill Prevention, Administration and Resource) Convention.
Benefits
In 2012, marine-related activities (including shipyards, equipment manufacturers and
suppliers in the naval, commercial, leisure and marine renewable sectors) contributed
94 Plastics in the Marine Environment, Eunomia, 2016, http://www.eunomia.co.uk/reports-tools/plastics-in-
the-marine-environment/
95 Williamson, P., Turley, C. and Ostle, C. (2017). Ocean acidification. MCCIP Science Review 2017, 1-14,
http://doi.org/10.14465/2017.arc10.001-oac
96 Marine Strategy Part Three: UK programme of measures, Defra, 2015,
https://www.gov.uk/government/publications/marine-strategy-part-three-uk-programme-of-measures

46
about £38.5 billion to UK GDP97 and employed 260,000 people98.The marine and coastal
environment of the UK provides a range of food, from fish/shellfish to seaweed with an
estimated annual value of £380 million99, but the value of the industry it supports is much
larger. In 2016, UK vessels landed 701,000 tonnes of sea fish (including shellfish) into the
UK and abroad with a value of £936 million100.
People access the sea mainly via beaches, estuaries, harbours and ports, which play an
important role in connecting us to the sea and millions of people enjoy recreational
opportunities associated with the marine environment. It is estimated that in 2015, UK
Ports contributed around £7.6 billion to the UK economy and employed over 100,000
people101. 310 million day visits were made to UK coastline and beaches in 2015,
conservatively valued at £1.4 billion102. Over 14 million UK adults participated in water
sports and other water-based leisure activities, including boating, sea angling and coastal
walking103.
As well as protecting biodiversity, MPAs are in many cases working areas, which support
communities and businesses that are reliant on marine natural capital to provide benefits
to people. The management of some MPAs has created opportunities for opening new
markets based on greater sustainability attributed to produce from these areas104. It has
been estimated that MPAs in English waters could safeguard an annual recreational value
worth £1.9 billion to £3.4 billion105. The willingness of households in England to pay to halt
97 UK non-financial business economy: 2014 revised results (Annual Business Survey), Office for National
Statistics, 2015,
https://www.ons.gov.uk/businessindustryandtrade/business/businessservices/bulletins/uknonfinancialbusines
seconomy/2014revisedresultsannualbusinesssurvey.
98 Figures represent employment under different years due to issues with data availability and therefore this
figure is indicative
99 UK natural capital: monetary estimates 2016, Office for National Statistics,
https://www.ons.gov.uk/economy/environmentalaccounts/bulletins/uknaturalcapital/monetaryestimates2016
100 UK sea fisheries annual statistics report 2016, Marine Management Organisation, 2017,
https://www.gov.uk/government/statistics/uk-sea-fisheries-annual-statistics-report-2016
101 The Economic Contribution of the UK Ports Industry. A Report for Maritime UK. Centre for Economics and
Business Research. September 2017,
https://www.maritimeuk.org/documents/187/Cebr_Ports_report_finalised.pdf
102 Reviewing cultural services valuation methodology for inclusion in aggregate UK natural capital estimates
Office for National Statistics, 2016,
https://www.ons.gov.uk/economy/nationalaccounts/uksectoraccounts/methodologies/naturalcapital
103 Watersports Participation Survey, Royal Yacht Association, 2016,
http://www.rya.org.uk/SiteCollectionDocuments/sportsdevelopment/Watersports_Survey_2016%20-
%20Summary.pdf
104 Such as Lyme Bay Reserve Seafood, http://www.lymebayreserve.co.uk/reserve-seafood/
105 The value of potential marine protected areas in the UK to divers and sea anglers, UK National
Ecosystem Assessment Interim Report, 2013, http://uknea.unep-wcmc.org/Resources/tabid/82/Default.aspx

47
loss of biodiversity and ecosystem services on the coastal shelf has been estimated at
£1.6 billion106.
Other marine benefits include carbon sequestration, absorption of wastes, renewable
energy, genetic resources, mineral resources and aggregates (see Figure 2.9).
Many marine ecosystems benefits are currently too complex and dynamic to quantify.
There are gaps in knowledge about the effects of natural conditions, current levels of
pressures and the impacts they have on the environment and ecological functions, and the
effectiveness of management interventions. It is also likely that marine ecosystems will
benefit future generations in ways not yet understood.
2.6 Land, soil and geological assets
The land and soil, and the geology that supports them, are key to delivering a range of the
goals of the 25 Year Environment Plan. They support food production, and the variety of
landscapes and green spaces that allow people to engage with nature while also providing
the space for people to live, travel and work.
Extent and quality
With a land surface of 13 million hectares, England is the largest country of the United
Kingdom (53.5% of the UK land area). It is also home to more than 55 million people107,
making it one of the world’s most densely populated countries108. Uplands cover
approximately 17% of England and occur mainly in the north and west. Improved
agricultural land comprises 52%, woodland 10%, and urban areas 11%. Arable land is
concentrated in eastern lowlands109 110 (Figure 2.12).
106 UK National Ecosystem Assessment Follow-On, UNEP-WCMC, 2012, http://uknea.unep-
wcmc.org/Resources/tabid/82/Default.aspx
107 England population mid-year estimate, Office for National Statistics, 22 June 2017,
https://www.ons.gov.uk/peoplepopulationandcommunity/populationandmigration/populationestimates/timeser
ies/enpop/pop
108 Foresight annual review 2010, Government Office for Science,
https://www.gov.uk/government/publications/foresight-annual-review-2010
109 Countryside Survey: England Results from 2007 (published September 2009). NERC/Centre for Ecology
& Hydrology, Department for Environment, Food and Rural Affairs, Natural England,
http://www.countrysidesurvey.org.uk/content/england-results-2007
110 Forestry Statistics 2017, Forestry Commission, https://www.forestry.gov.uk/forestry/infd-7aqdgc

48
Figure 2.12: Land Cover Map 2015 shows the spatial diversity of land cover types across
the UK (Source: Centre for Ecology and Hydrology)
Land use in England changed rapidly in the years following the Second World War. The
extent of land growing crops in England rose from roughly 3 to 4.3 million hectares in the
mid-1980s and has since fallen back to 3.9 million hectares. Livestock numbers have
fallen since the 1990s and currently there are around 15 million sheep, 5 million cattle and

49
4 million pigs111. Crop yields also increased in all major crops as a result of intensification,
most dramatically for wheat, which rose from 2.5 tonnes per hectare in 1940 to 8 tonnes
per hectare in 2008, or a 3.2-fold increase112. However crop yields have been relatively
static since 2000113.
Agriculture is a very significant economic activity in many rural areas114 not only through
the production of food and other agricultural outputs, but in management of land which
delivers a wide range of additional ecosystem services including the provision of water, the
regulation of air quality, flooding, climate and nutrient cycles, as well as cultural services
including enjoyment of the countryside and recreational value. The global food supply
system faces an unprecedented challenge to feed a growing global population and
continuing food security is a concern112. Farmers, land managers and policy makers are
faced with a significant technical challenge to measure and value the environmental and
social performance of agriculture, as well as to develop markets that reward the provision
of these services alongside traditional income streams for food production. Information and
tools are needed to support decision-making on trade-offs and optimisation of benefits
from land management (see section 2.6).
Whilst the proportion of woodland in England is low compared with other European
countries115 (just over 10% compared with 38% average for the EU), the extent of
woodland has increased by 73% since 1947, though with only a small increase in the last
five years. Broadleaved woodland remains more extensive (74%) than conifer woodland
(26%). In addition there is tree cover outside woodland; estimated at 4% of England’s land
area in 2016116. There were an estimated 336,000 kilometres of hedgerows in 2016116.
58% of woodland in England is actively managed.
These post war gains for agriculture and forestry have been at the expense of other
ecological communities including semi-natural grassland, heathland, bogs and fens. For
111 Structure of the agricultural industry in England and the UK at June 2017, Defra,
https://www.gov.uk/government/statistical-data-sets/structure-of-the-agricultural-industry-in-england-and-the-
uk-at-june
112 UK National Ecosystem Assessment 2011, UNEP-WCMC, http://uknea.unep-
wcmc.org/Resources/tabid/82/Default.aspx
113 Farming statistics - final crop areas, yields, livestock populations and agricultural workforce at 1 June
2016 – UK, Defra, https://www.gov.uk/government/statistics/farming-statistics-final-crop-areas-yields-
livestock-populations-and-agricultural-workforce-at-1-june-2016-uk
114 Statistical Digest of Rural England - November 2017, Defra,
https://www.gov.uk/government/statistics/statistical-digest-of-rural-england
115 Forestry Statistics 2017, Forestry Commission, https://www.forestry.gov.uk/forestry/infd-7aqdgc
116 Tree cover outside woodland in Great Britain, National Forest Inventory, Forestry Commission, 2017,
https://www.forestry.gov.uk/fr/beeh-a2uegs

50
example, an estimated 97% of lowland semi-natural grassland was converted to
agricultural land and other uses between 1930 and 1984 in England and Wales117.
Cotswolds Area of Outstanding Natural Beauty and Vale of Berkley, Gloucestershire.
National Parks and Areas of Outstanding Natural Beauty (AONBs) cover around 25% of
England118. These protected landscapes contain some of England’s most memorable
landscapes and include the Lake District World Heritage Site. They are also working
landscapes, supporting farm businesses, the wider rural economy and providing multiple
benefits for society. The most important areas for wildlife and geology in England are
recognised as Sites of Special Scientific Interest (SSSIs). In total, SSSIs cover around 1
million hectares of England (about 8%)119. About half of the area of SSSIs is found within
National Parks or AONBs.
Around 1.3 million hectares (circa 11%) of land in England is under targeted agri-
environment schemes (Higher Level Environmental Stewardship Scheme and the new
Countryside Stewardship Scheme)120. The amount of land in entry level schemes has
117 Fuller (1987) cited in UK National Ecosystem Assessment 2011, UNEP-WCMC, http://uknea.unep-
wcmc.org/Resources/tabid/82/Default.aspx
118 National Parks: 8-point plan for England (2016 to 2020), Defra, Natural England and Environment
Agency, 2016, https://www.gov.uk/government/publications/national-parks-8-point-plan-for-england-2016-to-
2020
119 Designated sites data, Natural England, at December 2016,
https://designatedsites.naturalengland.org.uk/ReportConditionSummary.aspx?SiteType=ALL
120 England Biodiversity Indicators, Defra, 2017, https://www.gov.uk/government/statistics/england-
biodiversity-indicators

51
declined recently with the focus shifting to concentrating on higher value, more targeted
schemes.
159 National Character Areas have been defined to aid management of the broader
landscapes of England. An assessment published in 2006121 found that landscape
character was being maintained or enhanced in 61% of England’s landscapes. Twenty per
cent of landscapes were showing signs of neglect and a further 19% were developing new
characteristics. There are 188,500 kilometres of public rights of way in England, of which
78% are footpaths. About 865,000 hectares of land are open country (as defined in the
Countryside and Rights of Way Act 2000) or registered common land. There are an
estimated 397,000 hectares of publicly accessible woodland in England122 and 107,000
hectares of public urban green space123.
Around 11% of land in England is developed. Recent trends indicate that each year, an
average of 3,000 hectares of non-developed land has been developed for residential
purposes124. This increases to around 16,800 hectares if other developed uses are
included125.
Urban areas provide a wide variety of land types and green infrastructure126. This includes
both publically accessible and non-accessible greenspace such as urban parks, open
spaces, playing fields, woodland, street trees, rights of way, roadside verges, allotments
and private gardens. Urban areas can also include rivers, streams, canals and other water
bodies, geological exposures and features such as green roofs and walls. The supply of
121 Countryside Quality Counts, University of Sheffield, 2006,
http://webarchive.nationalarchives.gov.uk/20140605104518/http://www.naturalengland.org.uk/ourwork/lands
cape/englands/character/cqc/default.aspx
122 Space for people: targeting action for woodland access, Woodland Trust, 2017,
https://www.woodlandtrust.org.uk/publications/2017/06/space-for-people-2017/
123 UK National Ecosystem Assessment 2011,UNEP-WCMC, http://uknea.unep-
wcmc.org/Resources/tabid/82/Default.aspx
124 This includes: agriculture land and buildings, forestry and woodland, rough grassland and bracken,
natural and semi-natural land, water, outdoor recreation, vacant land not previously developed, residential
gardens, and undeveloped land in urban areas. Land use change statistics 2015 to 2016, DCLG,
https://www.gov.uk/government/statistics/land-use-change-statistics-2015-to-2016. A three-year average of
2013-14 to 2015-16 data, data from Table P361 from live tables.
125 This includes, but not limited to: transport, utilities, industry, commerce, defence and community buildings.
Land use change statistics 2015 to 2016, DCLG, https://www.gov.uk/government/statistics/land-use-change-
statistics-2015-to-2016. A three-year average of 2013-14 to 2015-16 data. Data from Table P361 from live
tables.
126 A network of multi-functional green space urban and rural, which is capable of delivering a wide range of
environmental and quality of life benefits for local communities. National Planning Policy Framework, DCLG,
2012, https://www.gov.uk/government/publications/national-planning-policy-framework--2

52
and demand for greenspace varies across and within settlements127 128. Access to urban
greenspace is highest in the West Midlands and North West and lowest in the South East
and Yorkshire and Humberside129.
Green Belts are designated on the urban fringe to manage development. They can provide
green spaces and countryside close to urban populations. Green Belts cover over 1.6
million hectares, almost 13% of land in England, and around 60% of the population live in
urban areas within their boundaries130.
England’s geology is extremely diverse with a wide range of rocks, fossils, minerals and
landforms, along with natural processes that are still shaping the landscape today131. This
diverse geology has led to the contrasting landscapes that characterise England. Whilst
over 90% of nationally or internationally important geological features are protected
through designation, activities that obscure geological exposures or that disrupt natural
processes, continue to pose a threat to our geological heritage132. However, well-planned
mineral extraction and restoration, can make a significant contribution to the understanding
and conservation of this rich heritage133.
The UK has over 700 soil types, extensively mapped and studied134. The most
widespread major soil groups are periodically waterlogged gley soils and deep, well-
drained brown earths. Organic or peat soils make up 11% of England’s total land area,
over 70% of which are drained or in poor condition135.
127 Ordnance Survey Open Greenspace map: https://www.ordnancesurvey.co.uk/business-and-
government/products/os-open-
greenspace.html?utm_source=Greenspace%2520OS%2520openspace%2520-
%2520%252Fopengreenspace&utm_campaign=Greenspace%20
128 Day, B. H., and G. Smith (2016). Outdoor Recreation Valuation Tool (ORVal) User Guide: Version 1.0,
Land, Environment, Economics and Policy (LEEP) Institute, College of Social Sciences and International
Studies, University of Exeter, http://leep.exeter.ac.uk/orval/
129 CABE, 2010, cited in UK National Ecosystem Assessment 2011, UNEP-WCMC, http://uknea.unep-
wcmc.org/Resources/tabid/82/Default.aspx
130 Green Belts: A greener future, Natural England and Campaign to Protect Rural England, 2010,
http://www.cpre.org.uk/resources/housing-and-planning/green-belts/item/1956-green-belts-a-greener-future
131 British Geological Survey, England Geology and Regional Geophysics,
http://www.bgs.ac.uk/research/ukgeology/England/home.html
132 Crofts, R. and Gordon, J.E. 2014. Geoconservation in protected areas, Parks, 20.2, IUCN, 61-76.
http://doi.org/10.2305/IUCN.CH.2014.PARKS-20-2.RC.en
133 Prosser, C.D. in press (accepted and published on line) Geoconservation, quarrying and mining:
Opportunities and challenges Illustrated through working in partnership with the mineral extraction industry in
England. Geoheritage, http://doi.org/10.1007/s12371-016-0206-z
134 Land Information System (LandIS), http://www.landis.org.uk/
135 England's peatlands: Carbon storage and greenhouse gases (NE257), Natural England, 2010,
http://publications.naturalengland.org.uk/publication/30021?category=23033

53
An estimated 1 million hectares of soils in England and Wales are at risk of erosion from
wind or water136. Erosion rates are generally less than 1 tonne per hectare per year, but in
some extreme cases as much as 100 times that amount is lost, usually in one-off events.
In Europe, the tolerable range of soil erosion is between 0.3 and 1.4 tonnes per hectare
per year, when natural soil formation rates are considered137. Erosion risk is very spatially
specific with certain soil types (e.g. peat) losing higher amounts (about 10 times that of
mineral soils) per year. Some 84% of the area of peatland has been lost from East Anglia
in the last 200 years through land drainage, soil shrinkage, oxidation and wind erosion138.
In addition, an estimated 3.9 million hectares of soils are at risk of soil compaction, the risk
being highest on clay soils during wet periods136. Evidence differs on the changing
carbon/organic content of soils, with some monitoring suggesting a decline and other
studies showing no change139 140.
Inorganic (primarily metals, nutrients and fertilisers) and organic chemical pollutants and
pathogens are added to soils through aerial deposition (see section 2.2) or application of
manures and other organic compounds. While there are no legally defined safe soil limits,
there are limits set for the application of metals containing organics wastes to soil based
on the sewage sludge regulations141. Nitrogen applications are controlled under the nitrate
pollution prevention regulations142. Limits also exist in relation to contaminated land143.
136 The total costs of soil degradation in England and Wales (SP1606), Cranfield University, 2011,
http://sciencesearch.defra.gov.uk/Default.aspx?Menu=Menu&Module=More&Location=None&ProjectID=169
92&FromSearch=Y&Publisher=1&SearchText=SP1606&SortString=ProjectCode&SortOrder=Asc&Paging=1
0#Description
137 Verheijen, F., Jones, R., Rickson, R., Smith (2009). Tolerable versus actual soil erosion rates in Europe.
Earth Science Reviews 94, 23-38. http://dspace.lib.cranfield.ac.uk/handle/1826/3548
138 Burton, R.G.O. and Hodgson, J.M. (1987). Lowland Peat in England and Wales. Soil Survey Special
Survey No. 15. Soil Survey of England and Wales, Harpenden. Now available digitally via Land Information
System (LandIS), http://www.landis.org.uk/
139 Bellamy, P.H., Loveland, P.J., Bradley, R.I., Lark, R.M. & Kirk, G.J.D. 2005. Carbon losses from all soils
across England and Wales 1978–2003. Nature, 437, 245–248, http://doi.org/10.1038/nature04038
140 Emmett, B.A., Reynolds, B., Chamberlain, P.M., Rowe, E., Spurgeon, D., Brittain, S.A., Frogbrook, Z.,
Hughes, S., Lawlor, A.J., Poskitt, J., Potter, E., Robinson, D.A., Scott, A., Wood, C., Woods, C. 2010.
Countryside Survey: Soils Report from 2007. Technical Report No. 9/07 Centre for Ecology & Hydrology
192pp, http://www.countrysidesurvey.org.uk/content/soils-report-2007
141 Metals in Soils (SP0569), ADAS UK Ltd, 2009,
http://randd.defra.gov.uk/Default.aspx?Menu=Menu&Module=More&Location=None&ProjectID=15983&Fro
mSearch=Y&Publisher=1&SearchText=SP0569&SortString=ProjectCode&SortOrder=Asc&Paging=10#Desc
ription
142 The Nitrate Pollution Prevention Regulations 2015: https://www.legislation.gov.uk/uksi/2015/668/contents
143 Contaminated land: For further information see: https://www.gov.uk/contaminated-land and
https://www.gov.uk/government/collections/land-contamination-technical-guidance

54
Many authors have attempted to define the concept of soil health. At its simplest it can be
defined as the ability of a soil to function and provide ecosystem services144. However,
defining and assessing soil health is complicated by the fact that soils perform multiple
functions145, for example storage of carbon, infiltration and transport of water, nutrient
cycling, and provision of food. What makes a soil healthy is context specific and depends
on the use the land is being put to and on societal choices regarding priorities for that land.
Soil health is an emergent property of the physical, biological and socio-economic
circumstances at any site. Different suites of indicators have been proposed to assess soil
health, these include: soil properties such as acidity, organic matter content; soil structure;
ability of soil to store or transport water; biological community present in the soil; and
vegetation cover.
Costs and benefits
Land provides a wide variety of important benefits including through its use for agriculture,
forestry, outdoor recreation, wildlife and earth science conservation, and landscape
amenity, now and for future generations. These are in addition to its value as a space for
urban, infrastructure and industrial development.
Food, timber and wood fuel are key benefits resulting from agriculture and forestry. The
gross value added (GVA) to the UK economy of agriculture in 2015 was £8.2 billion146 and
GVA for primary forestry and logging was estimated at around £600 million in 2015147. In
forestry and logging GVA has increased from £416 million in 2011 to £626 million in 2015.
However, the UK imports around 80%148 of the wood it consumes.
Agriculture employed 466,000 people in the UK in 2016149 and 2.5 million people are
employed by 536,020 small and medium-sized enterprises in rural areas150. The forest
144 Fine, A. K., H. M. van Es, and R. R. Schindelbeck. 2017. Statistics, Scoring Functions, and Regional
Analysis of a Comprehensive Soil Health Database. Soil Sci. Soc. Am. J. 81:589-601,
http://doi.org/10.2136/sssaj2016.09.0286
145 Doran, J. W. and Safley, M. (1997). Defining and assessing soil health and sustainable productivity. In
Biological Indicators of Soil Health. (Eds C. E. Pankhurst, B. M. Doube, and V. V. S. R. Gupta.) pp. 1-28.
(CAB International: New York.) (Reference 18)
146 Agriculture in the United Kingdom 2016, Defra, https://www.gov.uk/government/statistics/agriculture-in-
the-united-kingdom-2016
147 Forestry Statistics 2017, Chapter 8 - Finance & Prices, Forestry Commission:
https://www.forestry.gov.uk/forestry/infd-7aqdgc
148 Forestry Statistics 2017, Chapter 3 – Trade, Forestry Commission:
https://www.forestry.gov.uk/forestry/infd-7aqdgc
149 Farming statistics - final crop areas, yields, livestock populations and agricultural workforce at 1 June
2016 – UK, Defra, https://www.gov.uk/government/statistics/farming-statistics-final-crop-areas-yields-
livestock-populations-and-agricultural-workforce-at-1-june-2016-uk
150 Agriculture in the United Kingdom 2016, Defra, https://www.gov.uk/government/statistics/agriculture-in-
the-united-kingdom-2016

55
sector employed 17,000 people in forestry and logging in the UK in 2015; plus 26,000
people employed in primary wood processing151.
Land and the ecological communities it supports are key to delivering climate regulation,
particularly because soils can be a sink for carbon. Land in the UK has changed from
being a net source of greenhouse gases in 1990 (estimated emissions of 6 million tonnes
of carbon dioxide equivalent (MtCO2e)) to being a net store (7 MtCO2e) in 2015152
(equivalent to 1.4% of total UK emissions). In England, woodland, and to a lesser extent
grassland, have made an increasingly important contribution to climate regulation
throughout this period. However, based on model projections, the contribution from
woodland to removal of greenhouse gases is expected to reduce by as much as a half
between 2018 and 2050153 as large areas of forest planted in the 1970s and 1980s are
restocked with young trees following timber harvest.
Land-based activity can lead to production of polluted air. For example, agriculture
accounted for around 81% of ammonia emissions in 2015154. In 2015, it was estimated
that ammonia emissions from UK agriculture resulted in £440 million in costs to human
health and the environment155. Ammonia and NOx emissions also result in the deposition
of nitrogen on terrestrial habitats resulting in changes in soil chemistry156 that changes the
abundance and diversity of plant species157 158. In addition, agriculture produces
greenhouse gases, mainly in the form of methane and nitrous oxide. These emissions
come from livestock and their manures, as well as the breakdown of fertilisers applied to
151 Forestry Statistics 2017, Chapter 7 – Employment and Businesses, Forestry Commission:
https://www.forestry.gov.uk/forestry/infd-7aqdgc
152 UK Greenhouse Gas Inventory, 1990 to 2015: Annual Report for submission under the Framework
Convention on Climate Change: https://uk-air.defra.gov.uk/library/reports?report_id=929
153 Projections of emissions and removals from the LULUCF sector to 2050, Centre for Ecology & Hydrology
and Forest Research, 2017, http://naei.beis.gov.uk/reports/reports?report_id=927
154 National Atmospheric Emissions Inventory,
http://naei.beis.gov.uk/resources/Sector_Summary_Factsheet_2017-v2.0.html
155 Defra calculation using updated interim damage costs. These damage costs are not finalised and may be
subject to change
156 Rowe, E.C., Emmett, B.A., Frogbrook, Z.L., Robinson, D.A., Hughes, S., 2012. Nitrogen deposition and
climate effects on soil nitrogen availability: Influences of habitat type and soil characteristics. Science of the
Total Environment 434, 62-70. https://doi.org/10.1016/j.scitotenv.2011.12.027
157 Emmett, B.A., Rowe, E.C., Stevens, C.J., Gowing, D.J., Henrys, P.A., Maskell, L.C., Smart, S.M., 2011.
Interpretation of evidence of nitrogen impacts on vegetation in relation to UK biodiversity objectives. JNCC
Report 449. JNCC, Peterborough, UK, p. 105. http://jncc.defra.gov.uk/page-5895
158 Stevens, C.J., Dise, N.B., Mountford, J.O., Gowing, D.J., 2004. Impact of nitrogen deposition on the
species richness of grasslands. Science 303, 1876-1879. http://doi.org/10.1126/science.1094678

56
soils. The cost of greenhouse gas emissions from agriculture in the UK were estimated at
£3.08 billion in 2015159 160.
On the other hand, vegetation on land can reduce impacts of air pollution. It has been
estimated that vegetated farmland and woodland provided £182 million and £794 million of
health benefits in the UK in 2015 respectively159, largely through reduction in
concentrations of particulates (PM2.5)161. However, the role of vegetation in reducing or re-
distributing pollutants is complex and further modelling and monitoring of effects are
required especially at highly localised scales162 163. Land’s capacity to ameliorate or
exacerbate water and air pollution is a result of a complex interaction between the land
usage (e.g. arable fields, livestock farming or woodland) and land management (e.g. buffer
strips, slurry use and fertiliser application). Well-targeted interventions such as tree
planting can deliver multiple benefits, from habitat creation to flood alleviation, greenhouse
gas absorption, recreation and reduced exposure to pollution, including ameliorating
diffuse water pollution from agriculture164 (see Figure 2.13).
Good soil management provides nutrient supply to crops and supports our water supply
through infiltration to aquifer recharge and removal of pollutants. However, soil erosion
puts pressure on water bodies through increased sediment runoff, nitrate and
phosphorous pollution. The offsite impact of soil erosion includes the costs of loss of
carbon from soils to the atmosphere, dredging costs, costs to remove eroded material from
drinking water, rivers, and lakes. Soil compaction changes the ability of soil to store and
release water having an impact on flooding. The offsite impacts of soil erosion and
compaction from agriculture in England and Wales had an estimated cost of £305 million
in 2015165.
159 2015 cost in 2017 prices
160 Calculated using the quantity of MtCO2e produced and the non-traded price of carbon: Green Book
supplementary guidance, valuation of energy use and greenhouse gas emissions for appraisal, Data table 3,
https://www.gov.uk/government/publications/valuation-of-energy-use-and-greenhouse-gas-emissions-for-
appraisal; 2015 UK Greenhouse Gas Emissions Final Figures,
https://www.gov.uk/government/uploads/system/uploads/attachment_data/file/604350/2015_Final_Emission
s_statistics.pdf
161 UK Natural Capital: ecosystem accounts for freshwater, farmland and woodland, ONS, 2017,
https://www.ons.gov.uk/releases/uknaturalcapitallandandhabitatecosystemaccounts (Tables 8 and 13)
162 Developing estimates for the valuation of air pollution removal in ecosystem accounts, Centre for Ecology
and Hydrology, 2017,
https://www.ons.gov.uk/economy/environmentalaccounts/articles/developingestimatesforthevaluationofairpoll
utioninecosystemaccounts/2017-07-25, Table 21
163 AQEG (2018), Emissions of Air Pollutants from Agriculture - Report by the Air Quality Expert Group
(AQEG) prepared for Defra, Scottish Executive, Welsh Government and the Department of the Environment
in Northern Ireland. https://uk-air.defra.gov.uk/library/aqeg/publications
164 UK National Ecosystem Assessment 2011, UNEP-WCMC: http://uknea.unep-
wcmc.org/Resources/tabid/82/Default.aspx
165 The total costs of soil degradation in England and Wales (SP1606), Cranfield University, 2011,
http://sciencesearch.defra.gov.uk/Default.aspx?Menu=Menu&Module=More&Location=None&ProjectID=169

57
Restoring the functions of blanket bog and other peatlands can turn land from a net source
to a net sink of carbon166. The potential for genuine carbon sequestration to other soil
types by agricultural management changes is very limited under UK conditions. Large
removals of carbon dioxide (CO2) from the atmosphere by soils will only come from large
scale permanent land use change including restoration of peatlands and wetlands, and
woodland planting167.
Land also delivers significant cultural benefits, particularly recreation through public access
and other visitor facilities, including in National Parks and AONBs. For example, in 2015,
the contribution of UK woodlands alone to recreation was valued at £300 million168 (see
Figure 2.13) and in 2014, the annual value of recreational services in the UK provided by
nature was estimated at £6.5 billion169. Geodiversity provides a range of cultural, social
and economic benefits, for example through education, outreach and tourism on the
Jurassic Coast World Heritage Site in Dorset170.
92&FromSearch=Y&Publisher=1&SearchText=SP1606&SortString=ProjectCode&SortOrder=Asc&Paging=1
0#Description. Cost adjusted to 2017 prices.
166 England's peatlands: Carbon storage and greenhouse gases (NE257), Natural England, 2010,
http://publications.naturalengland.org.uk/publication/30021?category=23033
167 Natural Capital Committee’s third state of natural capital report - The State of Natural Capital Protecting
and Improving Natural Capital for Prosperity and Wellbeing, 2015,
https://www.gov.uk/government/publications/natural-capital-committees-third-state-of-natural-capital-report
168 UK natural capital: ecosystem accounts for freshwater, farmland and woodland, Office for National
Statistics, 2017, https://www.ons.gov.uk/releases/uknaturalcapitallandandhabitatecosystemaccounts.
Adjusted to 2017 prices.
169 UK natural capital: monetary estimates, ONS and Defra, 2016,
https://www.ons.gov.uk/economy/environmentalaccounts/bulletins/uknaturalcapital/monetaryestimates2016
170 Dorset’s environmental economy - placing an economic value on the Jurassic Coast, Ash Future Ltd,
2015, https://jurassiccoast.org/documents/the-economic-impact-of-the-jurassic-coast-world-heritage-site-
designation-2016/

58
Figure 2.13 Estimated monetised benefits of UK woodland, 2015 (in 2017 prices) (Source:
ONS and Defra168)
Natural and semi-natural environments within urban areas provide large benefits in terms
of recreation and health (see Box 2.2). They also provide habitats for pollinators and some
threatened species which have adapted to the urban environment (e.g. peregrine falcons)
and invertebrates found on previously developed land171.
171 Open Mosaic Habitat Survey Handbook, Exegesis Spatial Data Management, 2013,
https://www.buglife.org.uk/sites/default/files/omhsurveyhandbookfinal.pdf
Ecosystem services from UK Woodland, 2015 costs in 2017 prices

59
Box 2.2: The importance of urban natural and semi-natural environments
Natural and semi-natural environments within urban areas account for only 8% of UK land area
but urban areas accommodate 80% of the human population. For this reason natural assets
within urban areas are especially valuable to people and the economy. Research by Defra and
ONS to develop natural capital accounts for urban areas highlights the range of economic
values provided by urban green spaces:
Benefit Estimated annual value
of service (£m)
Recreational value to users of urban greenspace 2,000 – 2,800 *
Avoided healthcare costs from physical activity in green
spaces
900
Avoided damage costs from vegetation dissipating road noise 59
(Greater Manchester only)
Avoided damage costs from vegetation reducing air pollution
impacts
211
Value of food produced from urban allotments 114
Productivity and energy savings from urban cooling effect 70
Carbon sequestration 31
Note: * The estimates of the ‘recreational value to users of urban greenspace’ reflect the range
of uncertainty resulting from the use of a different classification of urban areas in the Ricardo
report to that used for the natural capital account for urban areas.
Source: Defra/ONS Natural Capital Account for Urban Areas172 173
Over 3 billion visits were made to green open spaces in and around towns and cities, as
well as, to the wider countryside and coastline in England in 2015/16. Fifty-eight per cent
of people claimed to visit the natural environment at least once a week, up from 54% in
2009/10, increasingly the reason was given for health benefits (up from 34% in 2009 to
172 A study to scope and develop urban natural capital accounts for the UK, Defra (Eftec), 2017,
http://randd.defra.gov.uk/Default.aspx?Menu=Menu&Module=More&Location=None&ProjectID=19843&Fro
mSearch=Y&Publisher=1&SearchText=NR0167&SortString=ProjectCode&SortOrder=Asc&Paging=10#Desc
ription
173 Reviewing cultural services valuation methodology for inclusion in aggregate UK natural capital estimates,
ONS (Ricardo), 2016,
https://www.ons.gov.uk/economy/nationalaccounts/uksectoraccounts/methodologies/naturalcapital

60
47% in 2015/16). However, many people are infrequent visitors, with 33% of the
population visiting once or twice a month or less. Ten per cent of respondents said they
had not visited the natural environment at all in the previous 12 months, a proportion that
has remained similar over the last 5 years174.
Overall, those who are less likely to visit are from Black, Asian and minority ethnic (BAME)
backgrounds, those aged 65 and over, those with a long-term illness or disability, and
those in DE social grades175.
Although many children visit the natural environment frequently, a significant proportion of
children rarely or never visit. On average, 70% of children visit at least once a week, but
approximately one in nine (12%) children have not visited at all in the previous 12
months176. Children spend less time playing in natural places, such as woodlands and the
countryside, than they did in previous generations. Less than 10% play in such places
compared to 40% of adults when they were young177.
The cultural ecosystem services and benefits that result from visits to the natural
environment are derived from the interplay between the specific environments visited (e.g.
gardens, parks, farmland and beaches) and the activities undertaken (e.g. exercising and
playing)178. Health, cultural and economic benefits from natural environments include179:
Escape and freedom: places where people can get away from work and feel free
from constraint;
Valued social interactions: places that enable interactions between friends and
family and the community;
174 Monitor of Engagement with the Natural Environment (MENE) headline report: March 2015 to April 2016,
Natural England: https://www.gov.uk/government/statistics/monitor-of-engagement-with-the-natural-
environment-2015-to-2016
175 Monitor of Engagement with the Natural Environment (MENE) annual report: March 2013 to February
2014, Natural England, https://www.gov.uk/government/statistics/monitor-of-engagement-with-the-natural-
environment-2013-to-2014
176 Monitor of Engagement with the Natural Environment (MENE): A pilot for an indicator of visits to the
natural environment by children - results from years 1 and 2 (March 2013 to February 2015), Natural
England, 2016, https://www.gov.uk/government/statistics/monitor-of-engagement-with-the-natural-
environment-pilot-study-visits-to-the-natural-environment-by-children
177 Childhood and Nature: a survey on changing relationships with nature across generations, Natural
England, 2009, http://publications.naturalengland.org.uk/publication/5853658314964992
178 UK National Ecosystem Assessment Follow-on 2014, UNEP-WCMC, http://uknea.unep-
wcmc.org/Resources/tabid/82/Default.aspx
179 Naturally Speaking… A Public Dialogue on the UK National Ecosystem Assessment, University of Exeter,
2015, http://valuing-nature.net/sites/default/files/documents/NEA_Dialogue_Final_Report_final.pdf

61
Physical and mental health: places for physical exercise and achieving inner peace
and mental calm;
Tangible and intangible cultural heritage: places for reconnecting people to their
pasts and sustainable models of living.
Education and learning: places of instruction and where imagination, wonder and
interest in life is triggered;
Economic productivity: places that support industries and livelihoods, and provide
materials that underpin human infrastructures.
In 2013/14, 46% of visits were to destinations in towns and cities, 45% to the countryside,
6% to a seaside resort or town, and 3% to other coastal areas180. The majority of visits are
local; in the same year, over two-thirds of trips were to a destination less than two miles
away. However, there are over 95 million visits to National Parks each year, comprising 87
million day trips and seven million staying visits181. There is some evidence that the
benefits from these visits can be particularly important. For example, there is qualitative
evidence that visits to National Parks and other similar environments can provide long-
term health and wellbeing benefits182.
The natural environment is also a significant draw to overseas visitors. Twenty per cent of
holidays in Britain by overseas visitors include visiting the countryside, 11% include visiting
the coast or beaches, and 7% include visits to National Parks183.
Exposure to, contact with, and use of the natural world can bring a range of health and
wellbeing benefits. For example, there is relatively strong and consistent evidence for
mental health and wellbeing benefits arising from exposure to natural environments,
including reductions in stress, fatigue, anxiety and depression, together with evidence that
these benefits may be most significant for marginalised groups184. Exposure to natural
180 Monitor of Engagement with the Natural Environment (MENE) annual report: March 2013 to February
2014, Natural England, https://www.gov.uk/government/statistics/monitor-of-engagement-with-the-natural-
environment-2013-to-2014
181 Valuing England’s National Parks Final Report, Cumulus Consultants and ICF GHK, 2013,
http://www.nationalparksengland.org.uk/__data/assets/pdf_file/0004/717637/Valuing-Englands-National-
Parks-Final-Report-10-5-13.pdf
182 National Parks for health and wellbeing: the experience of Mosaic in Wales. Campaign for National Parks,
2015, http://www.cnp.org.uk/benefits-using-national-parks
183 Inbound tourism to Britain's nations and regions: profile and activities of international holiday visitors. Visit
Britain, 2013, https://www.visitbritain.org/sites/default/files/vb-corporate/Documents-
Library/documents/Regional_Activities_report_FINAL_COMPRESSED.pdf
184 Evidence Statement on the links between natural environments and human health, Defra, 2017,
http://randd.defra.gov.uk/Default.aspx?Menu=Menu&Module=More&Location=None&ProjectID=19511&Fro

62
environments can help to maintain a healthy immune system and reduce incidence of
inflammatory-based diseases such as asthma185. Rates of obesity tend to be lower in
populations living in greener environments. Across 8 European cities, people were 40%
less likely to be obese in the greenest areas, after controlling for a range of relevant
factors186.
Overall, there is high quality evidence of strong links or generally positive associations in 4
areas, which may provide a useful focus for future policy and delivery: mental health and
wellbeing; development and maintenance of a healthy immune system and reduction of
inflammatory-based diseases; landscape, ecosystem and city scale linkages; and, physical
activity (in selected groups)187.
Further benefits should be gained through more integrated policy and delivery across the
health, natural environment and other sectors at a range of spatial scales187. The Outdoor
Recreation Valuation Tool (ORVal), developed by the University of Exeter for Defra, uses
known patterns of visits to sites and socio-economic characteristics to predict the number
and value of visits to recreational sites depending on location, area of site, diversity of land
cover features and availability of alternative green spaces188.
2.7 Interactions between natural capital assets
All of the above ecosystem components or assets are linked as part of the wider dynamic
environment system. The environment system is intimately linked with social, economic
and political systems. Interventions which aim to deliver policy objectives in one area are
highly likely to have beneficial or perverse impacts on others and conversely, to achieve
change in one asset may require action in several others. In some cases this extends to
action and impacts outside England and the UK. Some of these interactions are illustrated
in figure 2.14 and summarised in Table 2.1. Approaches to considering interactions when
prioritising interventions are considered in Section 3, below. It is important to gain an
understanding of how these dynamic interacting sub-systems operate in order to manage
them as a system to deliver the benefits and to best avoid perverse or unwanted impacts.
mSearch=Y&Publisher=1&SearchText=BE0109&SortString=ProjectCode&SortOrder=Asc&Paging=10#Desc
ription
185 Exploring connections among nature, biodiversity, ecosystem services, and human health and well-being:
opportunities to enhance health and biodiversity conservation, Sandifer et al, 2015,
http://www.sciencedirect.com/science/article/pii/S2212041614001648
186 Greenspace and obesity: a systematic review of the evidence, Lachowycz and Jones, Obesity Reviews,
2011, http://onlinelibrary.wiley.com/wol1/doi/10.1111/j.1467-789X.2010.00827.x/full
187 Evidence Statement on the links between natural environments and human health, Defra, 2017,
http://randd.defra.gov.uk/Default.aspx?Menu=Menu&Module=More&Location=None&ProjectID=19511&Fro
mSearch=Y&Publisher=1&SearchText=BE0109&SortString=ProjectCode&SortOrder=Asc&Paging=10#Desc
ription
188 The ORVal Recreation Demand model, Day, B. & Smith, G., 2017, http://leep.exeter.ac.uk/orval/pdf-
reports/ORVal_Modelling_Report_2017.pdf

63
Figure 2.14: Examples of interactions between natural capital assets

64
Table 2.1: Summary of interactions between natural capital assets
Assets
Impact on assets
Land and soils Freshwater Ocean Atmosphere Species and ecological communities
Land and soils
Soil erosion, nutrients and other pollution from land are a major determinant of water quality. Silting of rivers can increase the risk of flooding.
Land use, soil infiltration and storage capacity have a major influence on flooding and water supplies.
Wetlands can mitigate flooding and assimilate pollutants.
Soil erosion, nutrients and other pollution from land are a major determinant of water quality in coastal waters.
Natural sea defences such as salt marsh or sand dunes can help prevent coastal erosion and flooding.
Land uses and management (including agriculture) are a major source of primary air pollutants including GHGs, NOx, and ammonia and secondary pollutants, including particulate matter (PM2.5) and ozone. Some soils such as peatlands can, subject to management, be a source or sink of GHGs. Forestry can reduce net GHG emissions through harvested wood products storing carbon and substituting for fossil fuels.
Land uses, land management and soil condition have a major impact on terrestrial plants and animals. Runoff from land affects freshwater and coastal communities. Agricultural intensification, with increased use of fertilizers and pesticides, and drainage of wetlands, has been a major cause of biodiversity decline. Agri-environment schemes can help to halt and reverse biodiversity loss. Commercial forestry expansion could impact on semi-natural habitats.
Freshwater Flooding, flood defences and high water tables could be seen as a constraint on land use in floodplains and other wetlands, but the benefits of reducing flood risk can provide added protection to people, land and wildlife. Flooding can be a source of nutrients and pollutants to soils or other detritus to land Water availability can be a limitation on agriculture and aquaculture. Water bodies and wetlands enhance the value of land for recreational uses.
Nutrients and other pollution in rivers are a major determinant of water quality in coastal waters.
Wetlands, subject to management can be a source or sink of GHGs
Re-wetting of wetlands, naturalisation of rivers, improved water flows through reducing abstraction, and buffer zones can enhance biodiversity. Reduced nutrient loadings can restore aquatic habitats, including for iconic species such as otter and salmon.
Oceans Saline intrusion can hinder land use. Land can also be lost through coastal erosion and gained through
Coastal flooding, sea level rise and salt water intrusions are a risk to water quality and supply in coastal areas.
Seas are a source of some pollutants, e.g. sea salt add to particulate concentrations that form inland. It is also a sink
Seas are the UKs most extensive and diverse wildlife habitat. Exploitation of marine resources including fishing and

65
deposition, including through managed coastal realignment.
for other pollutants, particularly those which are readily soluble, such as ammonia.
dredging can have major impacts on biodiversity. Sea level change and sediment dynamics can cause changes to extent and age structure of coastal habitats such as saltmarsh, sand dunes and intertidal habitats.
Atmosphere Airborne pollutants in particular SO2, NOx and NH3 have had significant impacts on soil acidity and nutrient status. Crop and timber yields can be significantly reduced by high levels of ozone pollution. Tree growth can also be affected positively and negatively from air borne pollutants.
Airborne pollutants in particular SO2, NOX and NH3 have had significant impacts on acidification and eutrophication of water bodies; either directly, or from leaching following deposition on land.
Increasing acid conditions in soils can mobilise metals and other chemicals from soil which pollute water bodies.
Direct deposition to seas, and on land and in rivers, can affect ecosystems in marine waters.
Acidification and eutrophication of soils and freshwater habitats have a large and pervasive impact on biodiversity. Areas affected by excess pollution have fallen, but remain high and air pollution is a factor in the poor conservation status of many protected sites.
Noise has also been shown to have adverse effects on fauna.
Species and ecological communities
Wild plants, animals and fungi are essential to many of the functions provided by land and soils, including agriculture and forestry (e.g. pollinators for insect pollinated crops, nutrient cycling and soil formation). They are an essential component of landscape character and the value of land for recreational uses. Invasive species can have impacts on other land uses.
Wild plants, animals and fungi, through the establishment of riparian wetlands and woodland, have a strong buffering capacity, trapping nutrients and preventing erosion, thereby improving water quality.
Plants and wildlife, through the establishment of wetlands and woodland especially in upper catchments can increase the water holding capacity and regulate flows.
Invasive species have considerable economic impact on our water asset.
Healthy marine ecosystems maintain healthy stocks of fish and other food species. Invasive species have considerable economic impact on our water asset.
Plants (particularly trees) can reduce exposure to some pollutants locally. However, some species of plants can also be a source of air pollution, particularly ozone-forming pollutants.
Woodland, wetland, grassland and coastal habitats in particular can store large amounts of carbon (or similarly release them if destroyed or degraded).

66
2.8 Environmental attitudes and behaviours
A majority of people consider the environment to be important and many take action of
different kinds to help protect and enhance it. The goal of the 25 Year Environment Plan
relating to “Aesthetics and engagement with our natural environment” recognises this
importance.
A particularly noticeable feature of UK cultural practice is the depth and breadth of
engagement with nature and wildlife189. However, when compared with other issues, the
environment generally features fairly low down the list of public priorities, and there is
some evidence of deteriorating pro-environmental attitudes190.
Overall, 94% of UK citizens surveyed in 2014 considered that protecting the environment
was important to them personally (54% very important, 40% fairly important). Only 5% did
not regard it as important. The figures are very similar in Europe as a whole191.
In England, the Monitor of Engagement with the Natural Environment (MENE) survey
provides evidence about attitudes to the natural environment. Findings from the 2014/15
survey show high levels of agreement with the following statements192:
“There are many natural places I may never visit but I am glad they exist (94% agreed, with 42% agreeing strongly)”.
“Having open green spaces close to where I live is important (94% agreed, with 47% agreeing strongly)”.
“Spending time out of doors (including my own garden) is an important part of my life (89% agreed, with 42% agreeing strongly)”.
“I am concerned about damage to the natural environment (85% agreed, with 33% agreeing strongly)”.
The proportion of people engaging in recycling and volunteering to help care for the
environment did not change significantly between 2009/10 and 2015/16 (see Figure 2.15).
However, the proportion of people ‘not likely to change’ their lifestyle to protect the
environment increased from 26% in 2009/10 to 33% in 2015/16. Those aged 55 and over
189 The UK National Ecosystem Assessment: Chapter 16, Cultural Services, UNEP-WCMC, 2011,
http://uknea.unep-wcmc.org/Resources/tabid/82/Default.aspx
190 Issues Index August 2017, Economist/Ipsos MORI, 2017,
https://www.ipsos.com/sites/default/files/ct/news/documents/2017-08/ipsos-mori-issues-index-august-2017-
charts.pdf
191 Special Eurobarometer 416: Attitudes of European citizens towards the environment, European
Commission, 2014, https://data.europa.eu/euodp/data/dataset/S2008_81_3_416
192 Monitor of Engagement with the Natural Environment (MENE), Natural England online cross-tabulation
viewer, 2015, http://naturalengland.tns-global.com

67
are consistently more likely than younger people to say that they are not likely to change
their lifestyle193.
Overall, the large number of members of environmental or conservation organisations is
an indication of high levels of interest in, and care and concern for, nature and the
environment. For example, the National Trust has over 4.8 million members194, the RSPB
over 1.2 million members195, and the Wildlife Trusts have over 800,000 members,
including 150,000 children and young people196.
Figure 2.15: Pro-environmental behaviours (lines) and proportion of population not likely to
change lifestyle (bars) (%), 2009/10 to 2015/16 (Source: Natural England193)
However, while the evidence indicates broad positive attitudes towards the environment
and some positive actions, it is also important to consider environmental issues in relation
to other key concerns, and changes over longer periods of time. A recent survey shows
that only 2% of people consider pollution/environment to be the top issue facing the
country, and only 12% consider it to be either the most important or another important
193 Monitor of Engagement with the Natural Environment headline report: March 2015 to February 2016,
Natural England, 2017, https://www.gov.uk/government/statistics/monitor-of-engagement-with-the-natural-
environment-2015-to-2016
194 National Trust Annual Report 2016-17, https://www.nationaltrust.org.uk/features/annual-reports
195 RSPB Annual Review 2016-17, https://ww2.rspb.org.uk/about-the-rspb/about-us/how-the-rspb-is-
run/annual-review
196 The Wildlife Trusts, http://www.wildlifetrusts.org/node/134703

68
issue. Over the last two decades, the percentage of people considering this to be an
important issue has rarely been above 10%197. Between 1993 and 2014, there has been
an increase in the view that people should be allowed to use their cars as much as they
like, even if it causes damage to the environment. This coincides with a decrease in the
view that car users should pay higher taxes198:
Similarly, an international comparative study analysed environmental concern in 33
countries and found that it had decreased slightly in almost all nations, including the UK,
over the previous two decades199.
Overall, while many people are committed to protecting and enhancing the environment
and care passionately about nature and wildlife, the evidence highlights challenges in
building wider understanding of how we can translate commitment into changes in
behaviour200, for example, the widespread change in behaviour brought about by the
charge for plastic bags201.
2.9 UK Overseas Territories
The 14 UK Overseas Territories (UKOTs) hold biodiversity of global significance, including
more penguins than any other nation on earth, and the world’s largest coral atoll. Gough
and Inaccessible Islands, Tristan da Cunha and Henderson Island, and Pitcairn Islands
are UNESCO World Heritage Sites.
Together the UKOTs hold 94% of species which are unique to the UK (1,547 species),
however only 10% of these (145) have had their conservation status assessed, and 77%
of those assessed (111) are globally threatened202. It has also been estimated that the
Territories may hold an additional 70,000 species yet to be documented, of which perhaps
1,800 could be previously undescribed endemics203.
197 Issues Index August 2017, Economist/Ipsos MORI, 2017,
https://www.ipsos.com/sites/default/files/ct/news/documents/2017-08/ipsos-mori-issues-index-august-2017-
charts.pdf
198 British Social Attitudes, NatCen Social Research, 2015, http://www.bsa-data.natcen.ac.uk/
199 Franzen A and Vogl D (2013). Two decades of measuring environmental attitudes: a comparative
analysis of 33 countries. Global Environmental Change 23, 1001-1008,
https://doi.org/10.1016/j.gloenvcha.2013.03.009
200 Andrew Balmford et al. 2017. The environmental footprints of conservationists, economists and medics
compared. Biological Conservation Vol. 214, pg 260-269, https://doi.org/10.1016/j.biocon.2017.07.035
201 Single-use plastic carrier bags charge: data in England for 2015 to 2016, Defra
https://www.gov.uk/government/publications/carrier-bag-charge-summary-of-data-in-england
202 The UK's Wildlife Overseas: a stocktake of nature in our Overseas Territories, RSPB, 2014,
https://ww2.rspb.org.uk/our-work/conservation/projects/the-uks-wildlife-overseas-a-stocktake-of-nature-in-
our-overseas-territories
203 Churchyard, T, Eaton, M. A, Havery, S, Hall, J, Millett, J, Farr, A, Cuthbert, R.J, Stringer, C, Vickery J
(2016) The biodiversity of the United Kingdom’s Overseas Territories: a stock take of species occurrence

69
The UKOTs are highly dependent on the natural environment for their economic and social
wellbeing. The environment provides goods and services of significant cultural and
economic value. It also plays a key role in protecting manmade assets and safeguarding
human life. The natural environment is susceptible to damage from human activities
resulting in significant loss of value to the economies of the Territories.
With support from the Conflict, Stability and Security Fund (CSSF), the UK Joint Nature
Conservation Committee (JNCC) is working in close collaboration with individual
Territories to establish monetary and cultural values for critical ecosystem goods and
services, identify measurable attributes that can be used to monitor changes in value
through time, and map the distribution of these assets in UKOTs in the Caribbean and
South Atlantic (see Figure 2.16).
Figure 2.16: Map of ecological communities on Gough Island, Tristan da Cunha (Source:
JNCC)
Major threats to natural environment in the Territories and the ecosystem goods and
services that it provides include invasive species, habitat destruction and climate change.
Many of the UKOTs are thought to be particularly vulnerable to climate change
because204:
and assessment of key knowledge gaps. Biodiversity and Conservation Vol 25,
http://doi.org/10.1007/s10531-016-1149-z
204 Parry M.L., Canziani O.F., Palutikof P.J., van der Linden P.J., and Hanson C.E. Eds. (2007). Contribution
of Working Group II to the Fourth Assessment Report of the Intergovernmental Panel on Climate Change.
Cambridge University Press.

70
Several ecosystems found in the UKOTs are identified as “most vulnerable” and “virtually certain to experience the most severe ecological impacts” of climate change;
Small islands are expected to experience some of the most severe impacts of
increasing temperatures;
The economies of UKOTs are not highly diversified and they depend on a narrow
range of goods or services; and
UKOTs have high communication and transportation costs and are vulnerable to
natural hazards.
Island ecosystems often have high levels of unique biodiversity with species which occur
nowhere else in the world. At the same time, island species are very vulnerable to the
introduction of invasive non-native species due to their previous isolation from predators,
diseases and competition. Globally, non-native species are second only to habitat loss in
reducing biodiversity and since 1500 AD, 72% of recorded extinctions have occurred on
islands205.
Over 2,261 invasive species have been recorded in the UKOTs, with 1,139 recorded in
Bermuda alone, more than twice the number recorded on any other island206.
Three species of rat, Rattus spp, have been implicated in a large proportion of extinctions
on islands207 and are documented as causing negative impact in 14 of the UKOTs206. For
example, since the introduction of rats and mice as stowaways on sealing and whaling
ships, most of the 29 species of breeding birds in South Georgia have been greatly
reduced in numbers and the endemic South Georgia pipit, the world’s most southerly
songbird, has lost over 80% of its former habitat to rats206. Following a successful habitat
restoration programme, non-native reindeer, rats and mice have all been subject to
eradication programmes. So far signs of success are positive, though monitoring is
ongoing.
The CSSF is supporting programmes to address problems of invasive species. The Great
Britain Non-Native Species Secretariat is sharing expertise in biosecurity and helping the
Territories to take preventative action to avert potential threats arising from invasive
species. The restoration of the UNESCO World Heritage Site at Gough Island, Tristan da
http://www.ipcc.ch/publications_and_data/publications_ipcc_fourth_assessment_report_wg2_report_impacts
_adaptation_and_vulnerability.htm
205 Baillie, J.E.M., Hilton-Taylor, C. & Stuart, S.N. Eds. 2004. 2004 IUCN red list of threatened species: a
global species assessment. https://portals.iucn.org/library/node/9830
206 Non-native species in UK Overseas Territories: a review, JNCC Report No. 372, 2006,
http://jncc.defra.gov.uk/page-3660
207 Harper G.A and Bunbury N. (2015). Invasive rats on tropical islands: Their population biology and impacts
on native species. Global Ecology and Conservation Volume 3, January 2015, Pages 607-627.
http://doi.org/10.1016/j.gecco.2015.02.010

71
Cunha, is ongoing including through the eradication of invasive house mice which are
threatening this vital seabird breeding site.
The UK and its 14 Overseas Territories are custodians of the fifth largest marine estate in
the world. HM Government is committed to working in partnership with the Territory
Governments to support them in protecting their environmental assets208 209. In 2015, the
UK Government committed to creating a ‘Blue Belt’ around the UKOTs. This includes the
designation of protected areas around St Helena, Pitcairn, South Georgia and the South
Sandwich Islands, the British Indian Ocean Territory, and the British Antarctic Territory and
a commitment to designate marine protection zones around Ascension by 2019 and
Tristan da Cunha by 2020. Overall, over 4 million square kilometres of ocean will be
protected by 2020.
2.10 Pressures
As set out in section 1.2, the pressures on the environment are many and varied in time
and space and are the subject of much ongoing research. This part of the report focusses
on a subset of these pressures which are known to have significant impacts on different
aspects of natural capital or the flows of benefits from them, and where there is a particular
focus for action at the current time.
2.10.1 Climate change
The global climate is changing, leading to rising temperatures and sea levels, retreating
ice, and an increase in the number of heavy precipitation events in a number of regions.
The Fifth Assessment Report of the Intergovernmental Panel on Climate Change210
concluded that the warming trend in the climate system since the 1950s is unequivocal
and the dominant cause is greenhouse gas emissions from human activity. Climate
change is considered as a pressure within the natural capital framework.
As part of the UK Climate Change Risk Assessment 2017, the Adaptation Sub-Committee
conducted an independent review of evidence211 to assess current and future risks to and
opportunities for the UK from climate change. All evidence presented in this section is
taken from that review unless otherwise stated.
208 The Overseas Territories: security, success and sustainability, HMG, 2012,
https://www.gov.uk/government/publications/the-overseas-territories-security-success-and-sustainability
209 United Kingdom overseas territories biodiversity strategy, Defra, 2011,
https://www.gov.uk/government/publications/united-kingdom-overseas-territories-biodiversity-strategy
210 Fifth Assessment Report, Intergovernmental Panel on Climate Change, 2014,
https://www.ipcc.ch/report/ar5/
211 The UK Climate Change Risk Assessment 2017 Synthesis Evidence Report, Adaptation Sub-Committee
of the Committee on Climate Change, https://www.theccc.org.uk/tackling-climate-change/preparing-for-
climate-change/uk-climate-change-risk-assessment-2017/

72
Observed changes in the UK include:
The annual average UK land temperature was 0.9 degrees Celsius higher during
the period 2005 to 2014 compared to 1961 to 1990;
More winter rainfall has fallen as heavy precipitation during the last 30 years in the
north and west of the UK, and there have been increases in winter run-off and high
river flows;
Sea levels around the UK have risen by 15 to 20 centimetres since 1900;
Sea-surface temperatures in UK coastal waters and in the North-east Atlantic have
risen by between 0.1 and 0.5 degrees Celsius per decade since the 1980s212.
The salinity of the upper ocean (0 to 800 metres) to the west and north of the UK has
generally been increasing over the last three decades following a particularly fresh period
(with relatively low salinity) in the 1970s212.
Whilst natural variability in the climate will continue to have a considerable influence on
individual weather events, the recent episodes of severe and sustained rainfall are
consistent with climate change projections.
The greatest direct climate change-related threats for the UK are large increases in flood
risk and exposure to high temperatures and heatwaves, shortages in water, substantial
risks to wildlife and natural ecosystems, risks to domestic and international food production
and trade, and risks from new and emerging pests and diseases213.
A warmer atmosphere can hold more moisture, leading to heavier rainfall and more
frequent flooding, including outside of recognised flood risk areas. Higher temperatures will
affect public health, infrastructure, business, farming, forestry and the natural environment.
Dry periods, when combined with higher temperatures, are likely to result in more severe
and prolonged droughts. Projected sea level rise of 50 to 100 centimetres by 2100 will
exacerbate flood risks and accelerate the process of coastal change for exposed
communities.
The continued provision of benefits traditionally associated with the natural environment,
including clean water, food, timber and fibre are at risk from climate change. Impacts on
other benefits are less well understood, including insect pollination, carbon storage, natural
flood alleviation and the cultural benefits provided by landscapes and wildlife.
212 Brown, I., Thompson, D., Bardgett, R., Berry, P., Crute, I., Morison, J., Morecroft, M., Pinnegar, J.,
Reeder, T., and Topp, K. (2016) UK Climate Change Risk Assessment Evidence Report: Chapter 3, Natural
Environment and Natural Assets. Report prepared for the Adaptation Sub-Committee of the Committee on
Climate Change, London, https://www.theccc.org.uk/tackling-climate-change/preparing-for-climate-
change/uk-climate-change-risk-assessment-2017/ccra-chapters/natural-environment-and-natural-assets/
213 Living with Environmental Change Report Cards,
http://www.nerc.ac.uk/research/partnerships/ride/lwec/report-cards/

73
Climate change is already having an impact on natural systems in the UK. Evidence of
long-term shifts in the distribution and abundance of some terrestrial, freshwater and
marine species due to higher temperatures is now discernible, despite complex
interactions. These shifts can be expected to continue and become more widespread, with
some species potentially benefiting, but others losing suitable climate space. The marine
environment is also being affected by changes in water chemistry214.
The risks from climate change are heightened because the natural environment is already
stressed. These pressures constrain the natural resilience of species and ecosystems and
their ability to adjust and adapt. There is therefore a risk that climate change will lead to
further species declines and habitat degradation.
There are also potential opportunities that could arise from a modest level of climate
change, through extended growing seasons and improved productivity in agriculture,
forestry and fisheries. These opportunities will only be realised however, if limiting factors
such as water availability, soil health and pests and diseases are managed and positive
innovation, for example by tapping into plant and animal genetic resources, is encouraged.
Key risks for natural capital from climate change include:
The majority of agricultural land in the eastern side of the UK is projected to
become less suitable for farming due to reduced water availability, increased soil
aridity and the continued loss of soil organic matter;
Reduced water availability in the summer, combined with increased water demand
from a growing population, is likely to challenge the ecological health of rivers and
lakes;
The loss of habitat and sediment in the coastal zone from sea level rise will have
implications for the long-term viability of coastal defences, which often rely on
natural buffering to absorb wave energy;
A combination of ocean acidification and higher temperatures is already having an
impact and could result in fundamental changes to marine food chains and the
fisheries they support.
214 Brown, I., Thompson, D., Bardgett, R., Berry, P., Crute, I., Morison, J., Morecroft, M., Pinnegar, J.,
Reeder, T., and Topp, K. (2016) UK Climate Change Risk Assessment Evidence Report: Chapter 3, Natural
Environment and Natural Assets. Report prepared for the Adaptation Sub-Committee of the Committee on
Climate Change, London, https://www.theccc.org.uk/tackling-climate-change/preparing-for-climate-
change/uk-climate-change-risk-assessment-2017/ccra-chapters/natural-environment-and-natural-assets/

74
Box 2.3: Climate change risks and opportunities for the natural environment
Soils and land
Risks and opportunities from changes in agricultural and forestry productivity and land suitability
Risks to soils and erosion from seasonal aridity and wetness
Risks of land management practices exacerbating flood risk
Risks to agriculture, forestry, wildlife and heritage from change in frequency and/or magnitude of extreme weather and wildfire events
Risks to agricultural land and habitats from salt water intrusion
Risks to habitats and heritage in the coastal zone from sea-level rise; and loss of natural flood protection
Freshwater
Risks to agriculture and wildlife from water scarcity and flooding
Risks to freshwater species from higher water temperatures
Risk of eutrophication due to reduced river flow and higher temperatures
Risks to aquifers from salt water intrusion
Oceans
Risks to, and opportunities for, marine species, fisheries and marine heritage from ocean acidification and higher water temperatures
Species and ecological communities
Risks to species and habitats due to inability to respond to changing climate conditions
Opportunities from new species colonisations
Cross-cutting
Pests and diseases: risks to agriculture, forestry, landscapes and wildlife from pests, pathogens and invasive species
Natural carbon stores: risks to natural carbon stores and carbon sequestration
Landscape and sense of place: risks and opportunities from changes in landscape
character
Based on: The Adaptation Sub-Committee Climate Change Risk Assessment 2017 Evidence
Report (synthesis), p.7 CCRA

75
2.10.2 Resource use and waste
In addition to biomass produced by living organisms, natural environment includes
resources below the soil, such as minerals and fossil fuels, in which the UK has been
historically rich. These resources, and the materials derived from them, represent the
foundation for economic growth. For example, iron transformed into steel and non-metallic
minerals transformed into cement are central to infrastructure development while a group
of rare earth elements are vital inputs across a range of low carbon technologies. In
addition, resource efficiency improvements on their own support economic growth as they
allow increased economic value per given amount of natural resources used.
Globally, the use of many materials has significantly increased over the last century and is
more than ten times the levels seen at the beginning of the last century (see Figure
2.17)215. This has been mainly driven by a rapid rise in the demand for construction, ores
and industrial materials. The growth in material consumption is expected to continue, with
some projections indicating that it may more than double by 2050216. The demand for
resources puts substantial pressures on our environment at different stages, including raw
material extraction, construction and manufacturing or waste disposal, underlying the need
for a more resource efficient economy that takes into account associated environmental
costs.
Figure 2.17: Global materials use by main mineral groups, 1900 to 2009 (Source:
Krausmann et al., 2009215)
215 Krausmann, F., Gingrich, S., Eisenmenger, N., Erb, K.-H., Haberl, H. and Fischer-Kowalski, M., 2009,
'Growth in global materials use, GDP and population during the 20th century', Ecological Economics 68(10),
pp. 2696–2705, https://doi.org/10.1016/j.ecolecon.2009.05.007
216 Resource Efficiency: Potential and Economic Implications. A report of the International Resource Panel,
United Nations Environment Programme, 2017, http://wedocs.unep.org/handle/20.500.11822/21230

76
The UK is a net importer of raw materials, with almost 127 million tonnes of net imports in
2015217. The UK’s landmass cannot provide all the natural resources required to support
the national economy and access to overseas supply of biomass for food, fibre and
bioenergy is essential. Almost one-third of the UK biomass (from agriculture, forestry and
fisheries) came from overseas with net imports of 36 million tonnes. This dependence
makes the protection of the long-term functionality of these overseas ecosystems an
economic imperative for the UK.
Many resources that ultimately come from our natural environment are “non-renewable”.
Oil, minerals, phosphorous for fertilisers, mineral-based building materials, for example,
will not be replaced over human timescales and therefore use of them results in a fall in
capital stocks. To reduce raw material depletion and associated environmental impacts
and maximise the value of materials requires an increased role of reducing, reusing and
recycling materials.
Resource efficiency in the UK is among the highest in Europe, being 1.5 times the EU
average218. The UK’s global material footprint (raw material consumption, accounting for
imports and exports of materials) fell 26% from a peak of 890 million tonnes in 2001 to
around 659 million tonnes in 2013 (see Figure 2.18), whilst over the same period GDP
rose by 18%219. Raw material consumption per unit of GDP continues to fall as secondary
materials increase use across the economy220. For example, UK plastic reprocessing has
almost doubled in the period from 2010 to 2015221.
217 Material flows account for the United Kingdom, Office for National Statistics, 2017
https://www.ons.gov.uk/economy/environmentalaccounts/datasets/ukenvironmentalaccountsmaterialflowsac
countunitedkingdom
218 Domestic material consumption (DMC) per person 2013, Office for National Statistics, 2017,
https://www.ons.gov.uk/economy/environmentalaccounts/articles/ukenvironmentalaccountshowmuchmaterial
istheukconsuming/ukenvironmentalaccountshowmuchmaterialistheukconsuming
219 Digest of waste and resource statistics 2017, Defra, 2017,
https://www.gov.uk/government/statistics/digest-of-waste-and-resource-statistics-2017-edition
220 UK Environmental Accounts: How much material is the UK consuming?’, Office for National Statistics,
2017,
https://www.ons.gov.uk/economy/environmentalaccounts/articles/ukenvironmentalaccountshowmuchmaterial
istheukconsuming/ukenvironmentalaccountshowmuchmaterialistheukconsuming
221 Plastics Market Situation Report, Chart 1, WRAP, 2016, http://www.wrap.org.uk/collections-and-
reprocessing/recovered-materials-markets/reports/market-situation-reports-plastics

77
Figure 2.18: Raw material consumption in the UK, 2000 to 2013 (Source: ONS218)
In England, 44.9% of household waste is currently recycled, an increase from just 10% in
2000222. This shift has significantly improved UK’s resource efficiency by lowering its raw
material footprint and reduced its environmental impact as recycled materials have
generally lower environmental footprint than virgin materials. The UK is slightly ahead of
the EU average in recycling, higher than France, but below Germany and the Nordic
countries.
Evidence indicates that there are further opportunities for businesses to generate
substantial financial savings by increasing resource efficiency. A series of no or low cost
interventions by businesses could deliver business savings of around £3 billion per year
through a more resource efficient use of materials and waste223.
The material economy will inevitably generate some residual waste that needs to be
managed through appropriate disposal methods, such as energy recovery and landfilling.
Total waste to landfill in England has fallen from 80 million tonnes in 2000 to 45 million
tonnes in 2016, an overall decrease of 44% over the period224. Local authorities in England
sent 16% of waste to landfill in 2016, compared to 79% in 2000225. Biodegradable
municipal waste sent to landfill has also significantly decreased to 22% of 1995 levels in
2015. In 2016/17, local authorities in England sent 9.9 million tonnes (almost 38%) of
222 Statistics on waste managed by local authorities in England in 2016/17, Defra, 2017,
https://www.gov.uk/government/statistics/local-authority-collected-waste-management-annual-results
223 Business Resource Efficiency – Quantification of the no cost/low cost resource efficiency opportunities in
the UK economy in 2014 (EV0482), Defra research report by Oakedene Hollins, 2017,
http://randd.defra.gov.uk/Default.aspx?Menu=Menu&Module=More&Location=None&ProjectID=19885&Fro
mSearch=Y&Publisher=1&SearchText=EV0482&SortString=ProjectCode&SortOrder=Asc&Paging=10#Desc
ription
224 Waste management for England 2016, https://www.gov.uk/government/publications/waste-management-
for-england-2016
225 Statistics on waste managed by local authorities in England in 2016/17, Defra, 2017,
https://www.gov.uk/government/statistics/local-authority-collected-waste-management-annual-results

78
waste for incineration with energy from waste, a 10% increase on the 2015/16 figure of 9
million tonnes (35%)225.
One of the drivers for increased efficiency has been the increasing value that can be
extracted from waste. Waste can be converted into energy and recycled among other
uses. These activities have helped to reduce greenhouse gas emissions from waste by
73% between 1990 and 2015 and to contribute to meeting carbon budgets, which state
that UK carbon emissions must decrease by 80% compared to 1990 levels by 2050226. A
large scale adoption of resource efficient business models could potentially deliver
substantial economic and environmental benefits – further increases in remanufacturing,
leasing, repair and recycling could deliver net GVA gain of at least £4.2 billion, reduce
materials use by 1.1 million tonnes, divert 2.9 million tonnes from incineration and landfill
and reduce greenhouse gas emissions by 2.3 million tonnes of carbon dioxide equivalent
by 2030227.
2.10.3 Chemicals
Chemicals are one of the UK’s biggest manufacturing export sectors in terms of value
added, with £26 billion of exports in 2016 – more than 70% of its output. Around half a
million people are employed in the sector either directly and indirectly. The sector
provides essential materials to the UK economy, underpinning UK manufacturing, and
supplying raw materials and inputs to a range of sectors such as automotive, aerospace,
health (medicines, cosmetics, medical equipment and supplies, homecare, personal care)
and agriculture (pesticides and biocides). With £5 billion per annum invested in research
and innovation new chemicals and new uses for existing chemicals continue to be
developed228.
Globally, production of chemicals has increased from 1 million tonnes in 1930 to several
hundreds of million tonnes today229 reflecting population growth and economic
development. With a growth of this rate the number of chemicals on the global market is
still unknown. In addition to those that are manufactured directly for use, there are also
chemicals which are produced as by-products of manufacturing processes or as a result of
human activities for example, polycyclic aromatic hydrocarbons (PAHs) from combustion
processes.
Chemicals provide substantial societal benefits but their widespread use in our industries,
agriculture, food systems and homes, has led in some cases, to pollution of land, water, air
226 2017 Report to Parliament – Meeting Carbon Budgets: Closing the policy gap, Committee on Climate
Change, 2017, https://www.theccc.org.uk/publication/2017-report-to-parliament-meeting-carbon-budgets-
closing-the-policy-gap/
227 Extrapolating resource efficient business models across Europe, WRAP, 2016,
http://www.rebus.eu.com/resources/reports/
228 UK Chemicals Industry, Department for international Trade, 2016
229 European Chemicals Agency, 2017, https://echa.europa.eu/-/chemicals-in-our-life-why-are-chemicals-
important

79
and food. These chemicals have entered the environment through different routes
including during production, use of products and disposal. They can be released from a
single point source such as a wastewater treatment works or from diffuse sources which
occur over a wider area without a defined discharge point, such as agricultural runoff.
Diffuse effects are particularly challenging to identify, attribute and tackle. Whilst some
chemicals may be quickly degraded in the environment, others can remain for extended
periods and be transported long distances and/or accumulate in organisms. As such,
pressures on our natural capital resources come from both locally in the UK and from
global sources.
Many of these chemicals have hazardous properties but it is the extent of exposure that
determines the risk to the environment, wildlife and human health. In the natural
environmental, organisms tend to be exposed to a mixture of chemicals from different
sources which could have a cumulative impact. The magnitude of exposure will be
determined by the input, transport and fate of chemicals in the environment, which are
controlled by complex natural processes230. It remains a challenge to define and quantify
the impacts of chemicals (see Box 2.4).
Lethal effects on wildlife as a result of sudden exposure to high concentrations from
chemical discharges arising from pollution incidents are relatively rare. Improved
understanding is needed about the implications to wildlife of longer term exposure to
chemicals at sub-lethal concentrations, in combination with other chemicals and with other
stresses present in the environment231. Studies generally focus on the effects of particular
chemicals, and usually single organisms, which means there are many unanswered
questions about the effects of exposure to multiple chemicals in the environment. Defining
how chemicals interact is an important step to understanding their potential effects and
subsequent interactions with the environment, including from indirect effects (e.g. via
trophic interactions).
There is evidence linking chemicals to adverse impacts on reproduction, development and
survival outcomes of wildlife232. Elevated concentrations of harmful chemicals can be
detected in different media but it is not always easy to demonstrate the direct links to
adverse effects observed in wildlife because of the complexity of multiple exposure and
additional environmental pressures233. There are also indirect effects on wildlife such as
trophic interactions.
230 Jepson, P.D. et al (2016) PCB pollution continues to impact populations of orcas and other dolphins in
European waters. Nature Scientific Reports. 6 18573 http://doi.org/10.1038/srep18573
231 Jobling, S. et al. (2006) Predicted Exposures to Steroid Estrogens in U.K. Rivers Correlate with
Widespread Sexual Disruption in Wild Fish Populations. Environmental Health Perspectives. 114 (Suppl 1):
32-39 http://doi.org/10.1289/ehp.8050
232 Lu, Q. et al. (2017) Persistent Organic Pollutants in sediment and fish in the River Thames Catchment
(UK) Science of the Total Environment. 576 78–84 http://doi.org/10.1016/j.scitotenv.2016.10.067
233 Evans, S.M. et al. (1996) Widespread Recovery of Dogwhelks, Nucella lapillus (L.), from Tributyltin.
Marine Pollution Bulletin. 32 (3) 263-269. http://doi.org/10.1016/0025-326X(95)00127-9

80
There are a number of potential pressures on our natural capital assets arising from
chemical exposure. The challenge is to manage environmental and human health risks of
chemicals through avoiding irreversible/expensive environmental damage to wildlife,
water, soil and air quality and controlling the exposure risk to chemicals whilst retaining
their societal benefits.
Box 2.4: Challenges in defining and quantifying the impacts of chemicals
Some of the key challenges in defining and quantifying the impacts of chemicals
include:
Chemical use in society is constantly evolving and linked to changing practices and
behaviours from whole industries to individuals.
To tackle future emerging chemical issues, we need greater insight into how the
pressures of chemicals in the environment change including any increase in exposure to
assess effectively the risk to human health and the environment.
It is unknown what the implications will be of combined pressures for example, does
chemical exposure risk reducing the ability for wildlife to adapt to climate
change/changing environments.
The natural environment is exposed to a complex cocktail of chemicals and the effects of
these mixtures is difficult to predict from studies on isolated substances.
The effects on ecosystems and populations is difficult to infer from studies on individual
organisms.
Keeping pace with technological developments of new types of chemicals such as
nanomaterials and assess any future risks.
Ecosystems vary with some more vulnerable than others so local impacts of chemicals
will be non-uniform across the country.
Of the tens of thousands of chemicals on the market, only a fraction have been
thoroughly evaluated to determine their effects on human health and the environment.
Legacy issues and long-term effects due to bioaccumulation and biomagnification are
difficult to model/predict.
Predicting contaminants of emerging concern.

81
2.10.4 Biosecurity
Tree health and plant biosecurity
Threats to plant health can impact a wide range of sectors and hosts species including
trees and related woody species, agricultural and horticultural food crops, biomass crops,
indigenous vegetation and ornamentals. Managing and reducing the impact of pests and
diseases on these sectors helps protect the value that healthy trees and plants contribute
to the UK economy, society and environment, estimated partially at £8 billion per year234.
The publicly available UK Plant Health Risk Register235 tracks such risks and prioritises
them for action. It currently contains approximately 970 pests and diseases, with around 5
new risks added to the register every month (see Figure 2.19).
Figure 2.19: Number of pests on the UK Plant Health Risk Register by broad taxonomic
category of pest, October 2013 to end of June 2017 (Source: UK Plant Health Register,
FERA235)
Risks to plant health have increased with globalisation in trade and travel and the resulting
escalation in the volume and diversity of plants and plant products entering the UK. Defra
234 Comprised of an estimated £3 billion of Gross Value Added (GVA) from crop and horticulture sectors, £1
billion of GVA from forestry and logging sector, and around £4 billion of social/environmental value from
forestry and trees from carbon sequestration, air pollution absorption, biodiversity, recreation and landscape
value (excluding many elements that cannot easily be monetised – water quality/availability, noise, flood and
heat reduction, physical and mental wellbeing, and cultural, symbolic education benefits). Estimates of GVA
are based on published government statistics. Note that full details of the £4 billion estimate of
social/environmental annual value we derive from forestry and trees will be published soon in the Defra Tree
Health Resilience Plan.
235 UK Plant Health Risk Register, https://secure.fera.defra.gov.uk/phiw/riskRegister/
Number of pests on the UK Plant Health Register by broad taxonomic category of pest, October
2013 to end of June 2017

82
carries out targeted inspections of controlled and uncontrolled imports at ports and airports
and risk-based inspections at nurseries and retail sites to detect any issues at an early
stage. In England and Wales, the number of import consignments declared and requiring
controls increased 5% between 2015 and 2016 (from 95,153 to 100,571)236.
Imports of plants and plant products, estimated at around 22 million tonnes per year, are
one of the primary ways in which new pests and diseases are introduced. Over the past
five years the UK has notified the EU of around 900 interceptions of harmful organisms
annually, consistently more than any other EU Member State (around 40% of the total for
the EU)237 (see Figure 2.20). The high number of notifications by the UK may, in part,
reflect differences in reporting along with differences in the volumes of trade and import
routes.
Figure 2.20: Number of consignments intercepted with harmful organisms from non-EU
countries, 2012 to 2016 (Source: European Commission, Health and Food Safety Directorate
General237)
Yet introductions still occur, as do outbreaks of pests and diseases which must be
managed, see Figure 2.21. Eradicating a small outbreak of Asian longhorn beetle, which
was found in in Kent in 2012, will have cost around £2 million once statutory surveillance is
236 2016 Annual Report on UK Multi-Annual National Control Plan, Foods Standards Agency,
https://www.food.gov.uk/news-updates/news/2017/16505/2016-annual-report-on-uk-multi-annual-national-
control-plan-published
237 EUROPHYT - Interceptions Annual Report 2016,
https://ec.europa.eu/food/plant/plant_health_biosecurity/europhyt/annual_reports_en
Member States intercepting the highest number of consignments with harmful organisms,
2012 to 2016

83
complete238. Whereas the cost of managing the same disease in the US, where it has
become established, has already cost into the hundreds of millions of US dollars239. The
cost of managing and slowing the spread of Phytophthora in the UK (a disease that has
not been eradicated) was £23 million between 2009 and 2014.
Figure 2.21: UK major tree pest introductions, 1900 to 2015 (Source: Spencer, 2018240)
Animal health
Protection from animal diseases is important for the economy, environment and health. UK
food and drink exports are worth £20 billion and rely on excellent plant and animal health
status. For example, bovine tuberculosis (bTB) is an increasing social and economic
problem in England. Over the past three decades, the incidence of bTB in England has
continued to increase and the disease has spread from parts of the south west. Although
most of the north and east of England has had a very low incidence of bTB herd incidents
(‘breakdowns’), there has been a much higher disease incidence in the west and south
west. 6.1% of cattle herds in England are under restrictions due to bTB241. There is a
238 Fielding et al (2016), History and development of an isolated outbreak of Asian longhorn beetle
Anoplophora glabripennis (Coleoptera: Cerambycidae) in southern England, Agricultural & Forest
Entomology, http://doi.org/10.1111/afe.12160
239 Estimated costs of $373 million, from the following Source, Haack et Al (2010): Managing Invasive
Populations of Asian longhorned beetle and citrus longhorned beetle: A Worldwide Perspective, Annual
Review of Entomology, Vol. 55: 521-546, http://doi.org/10.1146/annurev-ento-112408-085427
240 Forest Resilience in British Forests, Woods and Plantations - the ecological components. .Spencer, J.
(2018). Quarterly Journal of Forestry 112(1), 53-61.
241 Quarterly publication of National Statistics on the incidence and prevalence of tuberculosis (TB) in Cattle
in Great Britain – to end September 2017, Defra, 2017.
https://www.gov.uk/government/uploads/system/uploads/attachment_data/file/666933/bovinetb-statsnotice-
quarterly-13dec17a.pdf

84
strong social and economic case for controlling the disease in order to support a thriving
and sustainable livestock sector.
Animal diseases threaten the UK for two main reasons: firstly, because of the potential for
some diseases to spread from animals to humans and cause illness or fatalities; and
secondly, because they affect the animals on which we rely for food, trade, or to maintain
the ecosystem242.
Diseases which spread from animals to humans are called ‘zoonotic diseases’. Examples
include:
avian influenza spread by migratory birds, movements of live poultry, poultry meat
or contaminated vehicles / materials. Some strains can cause diseases in humans;
West Nile virus spread by mosquitoes and via birds as intermediate hosts. It can
cause encephalitis or meningitis in people (inflammations of the brain / brain lining
and spinal cord) although 80% of those infected show no symptoms at all. It has
never reached the UK; and
rabies spread by bites / scratches from infected animals. It infects the nervous
system and is usually fatal once clinical signs appear. Rabies is present at very low
levels in some UK bat populations, but the risk to humans is very low.
Animal diseases which cannot spread to humans are termed ‘non-zoonotic’. These harm
the UK by affecting animals (particularly livestock) that agriculture or ecosystems rely on.
Examples include:
foot and mouth spread by direct and indirect contact and can be wind-borne;
swine fever spread via movement of pigs or contaminated products. Classical swine
fever has been recorded in the UK but African swine fever has not; and
bluetongue spread between animals by midges. Severely affects sheep while cattle
may show fewer clinical signs. Vaccination has eradicated Bluetongue virus from
the UK but livestock remains susceptible to new strains.
Protection from animal diseases requires collaboration with international partners in
disease surveillance and prevention to identify international trends in animal disease
outbreaks and to mitigate threats before they reach the UK. Robust, evidence-based
contingency plans are needed to deal with outbreaks when they happen. There are simple
and cost effective steps farmers can take to improve biosecurity and reduce the risk to
farm animals of contracting or spreading animal diseases such as bird flu and swine fever.
242 National risk register of civil emergencies, Cabinet Office, 2017.
https://www.gov.uk/government/publications/national-risk-register-of-civil-emergencies-2017-edition

85
Non-native invasive species
Non-native invasive species are one of the main drivers for biodiversity loss globally243.
Increased movement of goods and people increases the risk of introducing species to new
areas. Introductions of new species has increased dramatically over the last 400 years,
and is continuing to rise244. Whilst many non-native species that are introduced will not
survive in the new environment, some are able to establish. Of those that establish a small
percentage will become invasive, meaning that they threaten biodiversity or have
unforeseen negative consequences. In Great Britain, 10 to 15% of introduced species
become invasive245. Whilst some non-native species become invasive and have negative
impacts, many do not and some can be beneficial246. There are over 1,919 non-native
species established in Great Britain, 1,494 of which are plants and 420 are animals244.
Non-native invasive species disrupt ecological communities by preying on, outcompeting
or introducing disease to native species. The best available evidence suggests that 1 in 5
threatened species in Europe is directly affected by a non-native invasive species. In
addition, non-native invasive species can have human health implications, interfere with
agriculture and recreational activities and reduce house prices. Many invasive species
have a direct impact on the economy through the reduction in products and services (e.g.
food production) or the costs associated with eradication and control. In England, the total
cost of invasive species is estimated at £1.29 billion each year247.
243 Genovesi.P, Carnevali. L, Scalera, R (2015). The impact of invasive alien species on native threatened
species in Europe. Technical report for the European Commission. Pp.18. Available here:
http://wedocs.unep.org/handle/20.500.11822/19388
244 GB non-native species scorecard, 2014, http://www.nonnativespecies.org/factsheet/
245 GB Non-native species strategy, Defra, 2015, https://www.gov.uk/government/publications/the-great-
britain-invasive-non-native-species-strategy
246 Schlaepfer, M. A., Sax, D. F. and Olden, J. D. (2011), The Potential Conservation Value of Non-Native
Species. Conservation Biology, 25: 428–437. http://doi.org/10.1111/j.1523-1739.2010.01646.x
247 Williams, Frances & Eschen, René & Harris, Anna & Djeddour, Djami & Pratt, Corin & Shaw, R.S. &
Varia, Sonal & Godwin, Julien & Thomas, Sarah & Murphy, Sean. (2010). The Economic Cost of Invasive
Non-Native Species on Great Britain, CABI, https://www.cabi.org/VetMedResource/ebook/20123122024

86
Figure 2.22: Number of established non-native species and the number that are designated
as having a negative ecological or human impact against date of first arrival, 1500 to 1999248
248 Defra Non-Native Species information report: Non-Native Species in Great Britain: establishment,
detection and reporting to inform effective decision making. July 2012,
http://www.nonnativespecies.org/downloadDocument.cfm?id=753
Number of established non-native species and the number that are designated as
having a negative ecological or human impact against date of first arrival, 1500 to 1999

87
2.10.5 Summary of pressure impacts on natural capital assets
Table 2.2 provides a summary of the impacts of pressures of resource use and waste, climate change, chemicals, plant health and invasive species
on natural capital assets of land and soils, freshwater, oceans, atmosphere and species and ecological communities.
Table 2.2: Summary of pressure impacts on natural capital assets in England
Pressures Land and soils Freshwater Oceans Atmosphere Species and ecological communities
Resource use and waste
Waste disposal, in particular landfill, has a demand for land, can preclude other land uses and impacts on recreational uses. Waste disposal can be a source of soil pollution. Land resource for various purposes may be created through restoration of mineral workings.
Waste and by-products including sewage, industrial effluents, extractive industry dewatering, cooling waters etc. are a source pollution. High water use can lead to disruption of natural flows and inadequate water levels for wetlands.
High water usage will increase pressure on the environment and leads to disruption of natural flows and inadequate water levels for wetlands. Other impacts include widespread modification of channels, nutrient status of freshwaters, drainage and fisheries that result in ecological modification.
Waste and sewage disposals to estuaries and seas cause local, widespread and accumulative pollution, e.g. plastics, micro-beads and heavy metals.
Waste combustion/incineration, anaerobic digestion, composting and the spread of manure and slurry on land are all sources of air pollutants (e.g. NOX and ammonia).
Inefficient resource use can increase the pressure on species and ecological communities.
Mineral workings can be restored to create new wildlife habitats.
Climate change
Parts of the UK are projected to become less suitable for farming and forestry due to reduced water availability, increased soil aridity and the continued loss of soil organic matter resulting
Reduced water availability in the summer, combined with increased water demand from a growing population, is likely to challenge the water quality and ecological health of rivers and lakes.
A combination of ocean acidification and higher temperatures is already having an impact and could result in fundamental changes to marine
Changing atmospheric conditions will affect air pollution emissions and transport, but more research is needed on the resulting effects.
Drying of wetlands due to reduced water availability
Evidence of long-term shifts in the distribution and abundance of some terrestrial, freshwater and marine species due to higher temperatures is now discernible, despite complex interactions. These

88
in release of GHGs to the atmosphere.
Increased soil aridity will increase the amount of sediments washed away by torrential rain to rivers and waterbodies.
The increased risk of extreme weather events could result in increased soil erosion and more frequent landslips.
Crop and timber yields may increase in other parts of the UK as temperatures rise.
Increased frequency of torrential rain will increase the risk of flooding – excessive / too much water including wetter summers and/or more locational increases in rainfall leads to flooding.
food chains and the fisheries they support.
may result in oxidation of peat and loss of carbon to atmosphere.
Climate change could result in high GHG emissions from vegetation and soils, particularly forests and peatlands, respectively.
shifts can be expected to continue and become more widespread, with some species potentially benefiting, but others losing suitable climate space.
Chemicals Contaminants present in soils and on land, such as legacy industrial chemicals or more persistent pesticides used in crop protection, have the potential to represent sources which may impact on drinking water resources. The addition of treated sewage sludge to agricultural land can introduce contaminants which reside in the soil compartment and which can be transported to groundwater resources and/or surface water bodies. There is the potential for soil contaminants to be taken up by crops and enter the human food chain.
Pesticides affect water abstracted for drinking and can affect freshwater ecology. Other chemicals can enter the freshwater environment, including pharmaceuticals, veterinary medicines, and other biocidal and non-biocidal products with effects on species ranging from endocrine disruption to other sub-lethal and lethal direct effects as well as indirect effects on populations.
Discharges to receiving rivers of low levels of chemical contaminants from waste water treatment works or from abandoned metal mines, road runoff or agricultural areas results in substances being transported to coastal and marine waters.
All industrial processes result in emissions of a wide range of pollutants, and are therefore subject to regulation and permitting. All uses of chemical products will result in some highly diffuse releases of different air pollutants.
Chemicals in the environment can accumulate in soils, sediments and in the food chain and can be toxic to wildlife and predators. Pollinators are vulnerable to inappropriate use of pesticides. Pesticides can affect freshwater ecology. Other chemicals can enter the freshwater environment, including pharmaceuticals, veterinary medicines, and other biocidal and non-biocidal products with effects on species ranging from endocrine disruption to other sub-lethal and lethal direct effects as well as indirect effects on populations.

89
Biosecurity Plant disease has impacts on forest, agricultural and horticultural productivity and profitability. Plant disease may reduce the value of woodland and trees for a range of benefits. Biosecurity measures increase costs and may restrict access.
Invasive non-native species can increase costs of management of water bodies and impact on freshwater fisheries.
Some invasive algae can increase the risk of flooding by obstructing channels.
Tree pests and diseases can impact the growth rate and survival of trees and therefore the amount of carbon stored on an annual basis.
Loss of trees and vegetation through disease could also impact negatively on air quality at a local level.
Plant disease affects some native trees and shrubs and can result in major changes to the composition of ecological communities and the conservation status of dependent species.
Invasive non-native species affect the composition of ecological communities and are a significant threat to the conservation status of some native species.

90
Section 3: Evidence for the effectiveness of different types of policy intervention
3.1 Introduction
This section assesses the evidence available249 to support decisions on which policy
interventions might be the most effective, whether bundles of interventions could be used,
and what sort of actions and behaviour changes need to happen and by whom.
Many interventions that improve the environment have the potential also to improve both
economic growth and individual wellbeing. There is also a question, therefore, of how best
to deliver this economic and social potential alongside that improved environment. The
many beneficiaries of these interventions suggest that not only government, but also the
private sector and civil society have significant parts to play250, and there is a strong
rationale for dividing responsibilities in line with the benefits accrued between the private
and public sectors.
Determining specific policy interventions will require analysing and working with the key
sectors and individuals involved in delivering the desired change and the necessary levers
to incentivise them to change their behaviour. This chapter therefore only sets out some
of the analytical underpinning to such interventions, rather than prescribing a particular
approach.
3.2 The current situation
Current interventions which have impacts on the environment include a wide range of
voluntary, legislative, fiscal and governance actions, spanning a wide range of actors
across society. This reflects the many interactions that people have with the environment
and the actors who have influence over it. The majority of historic interventions have been
constructed to deal with a particular issue (e.g. reduction of a particular pollutant) or set of
actors (e.g. utility companies).
Our present understanding, as section 2 shows, is that different aspects of the
environment are functionally linked. This suggests that responses focussed on single
sectors are unlikely to be as effective as they could be, given the interconnectedness of
ecosystems and the interdependence of different stakeholders.
249 The UK National Ecosystem Assessment, Chapter 27 ‘Response Options’ forms the basis of this section,
UNEP-WCMC, 2011, http://uknea.unep-wcmc.org/Resources/tabid/82/Default.aspx. Other sources of
evidence are referenced separately.
250 Natural Capital Committee, Advice to Government on the 25 Year Environment Plan (2017)
https://www.gov.uk/government/publications/natural-capital-committee-advice-on-governments-25-year-
environment-plan

91
An analysis by the UK National Ecosystem Assessment (UK NEA) concludes that trends
suggest responses are indeed becoming more integrated at sub-national, national and
international scales. It also concludes that the challenges to broadening and deepening
this approach are considerable and should not be underestimated.
The UK NEA went on to analyse a range of possible response options that have been
shown to have had positive impacts on the management of natural capital or the derivation
of benefits from it. It considered a broad range of instruments and actors. Key
conclusions from this analysis are given here, together with some more recent analysis of
behaviour change and the use of segmentation to increase the effectiveness of
interventions with subsections of the population. Noting this evidence during policy
development can then enable future responses to have increased effectiveness as they
work in a more integrated way across a range of actors and environmental aspects.
3.3 Conclusions from the UK NEA analysis of response options
3.3.1 Types of policy instrument
The UK NEA concluded that “the sustainable management of ecosystems and their
services typically involves a mix of approaches including regulations, policies, attitudes,
incentives, technologies and voluntarism”. This emphasises the need “to manage
ecosystems through the adoption of holistic and integrated approaches which recognise
the impacts of actions across a range of sectors and provide opportunities for collaboration
between actors at different levels”. It went on to say that there may be trade-offs which
can mean the need to make difficult choices. Actions and interventions in one area can
have knock-on effects beyond some of which can be unintended.
To analyse the effectiveness of different approaches, the UK NEA classified three tiers of
response options for sustainably managing ecosystems and the benefits they provide:
1. Foundational: The generation and distribution of knowledge and information.
2. Enabling: Legislation; policies, institutions and governance; changing social attitudes.
3. Instrumental: Markets and incentives; technologies and practices; voluntary actions.

92
Figure 3.1: Tiers of response options analysed by the UK NEA
It produced a number of key findings based on an analysis of a wide range of policies
influencing land, water and marine areas across the UK. These are set out in the sections
below.
3.3.1.1 Knowledge
Although our knowledge base continues to grow in this area, there remains a need to
better understand linkages between biodiversity, ecosystem structure, functions and
services, together with a need to develop monitoring and reporting frameworks that are
better aligned with a more integrated approach to environmental management.
3.3.1.2 Legislation
The international context within which the UK has had to frame policy responses, has often
provided a strong push towards a more integrated and collaborative approach. External
obligations are not necessarily a constraint to action, where they allow for variation in
national models of implementation. Many recent improvements have been due to effective
legislative drivers. Examples of legislation demonstrated to have had a positive impact on
the environment and the benefits we receive from it include:
the Wildlife and Countryside Act (1981); and
the Natural Environment and Rural Communities (NERC) Act (2006).
3.3.1.3 Engaging people
The importance of the engagement of local communities and the general public in
conservation is acknowledged in national environmental and biodiversity strategies and
policies because public understanding and opinion of the value of the natural environment

93
have strong implications for the acceptance and adoption of any measures. Understanding
what people value in the environment and to what extent is central to the natural capital
approach. While many people have broadly positive environmental attitudes, at present,
the terms and concepts of biodiversity, ecosystems and their services are not meaningful
for the vast majority of people. Culturally, the concepts which have most meaning are
those of nature, place and landscape. The evidence behind people engagement and
behaviour change is explored further below.
3.3.1.4 Markets and incentives
There are a range of market-based instruments that can be used for the protection and
enhancement of ecosystem services. Using market based mechanisms can encourage
innovation and a more efficient outcome. For instance, the approach Payment for
Ecosystem Services (PES) provides a market to allow beneficiaries to pay for an
enhanced ecosystem service. A further example is tradable emissions permits, such as
carbon trading which create an incentive to reduce carbon emissions. Approaches that rely
on ecological restoration or carbon sequestration do involve an element of risk due to
outcome uncertainties which market prices may not include. Consequently such market-
based schemes may require some regulation or insurance251. The voluntary Woodland
Carbon Code, which is a domestic carbon offset scheme, has both a register to enhance
investor confidence and a ‘buffer’ to provide insurance.
Adjusting prices can internalise environmental costs and benefits by altering economic
incentives and aligning private interests with societal objectives252 - this is the rational for
the level of UK aggregates tax and the landfill tax. For both of these the tax rates were set
at a level such that the “external costs of landfill waste and aggregates activity would be
reduced to points where the further abatement action (costs) would exceed benefits”253. In
other words, taxes were set to encourage abatement action up to the point where any
further action would cost more than any gained benefit.
Other market-based schemes that have proved effective include certification schemes
such as the UK Woodland Assurance Standard, and since the UK NEA publication,
significant further work has been done on market generation and access to finance, which
is also explored below.
251 UK National Ecosystem Assessment Follow-on Chapter 8.A1.4 & 5, UNEP-WCMC, 2014,
http://uknea.unep-wcmc.org/Resources/tabid/82/Default.aspx
252 Guidelines for Cost-effective Agri-environmental Policy Measures, OECD, 2010,
http://www.oecd.org/greengrowth/guidelines-for-cost-effective-agri-environmental-policy-measures-
9789264086845-en.htm
253 The state of natural capital: protecting and improving natural capital for prosperity and wellbeing, Natural
Capital Committee, 2015, pages 30 & 54, https://www.gov.uk/government/publications/natural-capital-
committees-third-state-of-natural-capital-report

94
3.3.1.5 Technologies and practices
Agricultural production has been greatly increased by the application of technology for
breeding, cultivation, management and protection from pests and diseases. The wider
negative effects of fertilisers, pesticides and livestock manures have been reduced due to
improved storage, new chemicals and more efficient applications. Nevertheless, habitats
that are highly productive in terms of food are, inevitably, uniform and species-poor. In
some areas, biodiversity is being supported by allocating non-productive areas to
conservation using biodiversity offsetting mechanisms such as agri-environment schemes.
This support is occurring on a range of levels from single fields (promoting pollination and
biological pest control), to whole catchments (promoting landscape and water quality), and
even to higher scales (such as wilderness areas) and has the potential for enhancing
biodiversity in the wider countryside.
In the marine environment, seabed trawling technologies have significantly damaged
biodiversity. However, new, more environmentally friendly technologies and practices are
now being developed, for example fishing technology to minimise harm to non-target
species and juveniles.
Subsequent to the UK NEA, the current expansion in data available for modelling the
environment also offers a range of opportunities for better environmental decisions,
monitoring and management.
3.3.1.6 Voluntary actions, education and awareness
Education, at all ages, is important for increasing public knowledge and understanding of
the importance of the natural environment and conserving biodiversity. Statutory
requirements stipulate that the science curriculum must include sustainable development,
life processes and living things. Awareness creation can lead to voluntary and civil society
action, which plays an important role in the conservation of biodiversity.
The England Natural Environment Indicators254 track time spent volunteering on
conservation activities. The work undertaken by volunteers includes assisting with
countryside management, carrying out surveys and inputting data, assisting with
administrative tasks, and fundraising. Information is collected from ten major organisations
across the environmental sector in England.
Similarly, UK Biodiversity Indicators255 also track volunteer time spent in conservation,
using similar data. The amount of time people spend volunteering to assist in conservation
in part reflects society’s interest in and commitment to the natural environment. Overall,
254 England Natural Environment Indicators, Defra, 2016, https://www.gov.uk/government/statistics/england-
natural-environment-indicators
255 UK Biodiversity Indicators 2017, Defra, 2017, https://www.gov.uk/government/statistics/biodiversity-
indicators-for-the-uk

95
the amount of time contributed by volunteers increased by 18% between 2000 and 2015,
although it decreased by 14% in the five years to 2015. However, the methodology used
by conservation charities can change from year to year, causing fluctuations in the data.
More broadly, there is increasing evidence that voluntary and community-led action can be
beneficial for the natural environment. Individuals and communities can engage in a wide
range of environmental activities. These can include: community‐led campaigns, activism
or advocacy; collective action linked to sustainable lifestyles (including community
recycling, transport, energy, or food growing initiatives); and collective action linked to the
protection, maintenance, monitoring and/or restoration of community green spaces and
other local natural environments256.
In seeking to increase voluntary and community-led action, evidence identifies three
specific factors related to engagement longevity256:
the satisfaction of seeing tangible environmental and social community outcomes;
forming strong social ties and relationships; and
ensuring engagement experiences match prior expectations, needs, abilities and
interests.
There is a wide range of barriers to participation in voluntary and community-led activity
including: a lack of knowledge or awareness of opportunities; lack of confidence; practical
constraints such as transport availability or health concerns; lack of time and busy lives;
existing regulations; challenges in partnership working; short‐term funding streams; and a
lack of opportunities of interest256.
3.3.2 A combined approach to interventions
The UK NEA concludes that managing ecosystems and their services sustainably
(economically, environmentally and socially) will be facilitated by employing an appropriate
mix of approaches including legislation and regulations supporting attitudinal changes,
underpinning markets and incentives, technological innovation, and voluntary compliance.
What must also be borne in mind when determining the most appropriate policy
instruments, is the issue of property rights as this impacts upon who can expect payment
and who is liable to be charged257.
The evidence assessed by the UK NEA showed that local initiatives have been invaluable
for a range of local conservation activities and improving the delivery of some ecosystem
services. However, the review of past interventions concluded that no national, regional or
global environmental issue (e.g. air and water quality) had ever been successfully
256 The Big Society concept in a natural environment setting, Policy Studies Institute report to Defra, 2011,
http://randd.defra.gov.uk/Default.aspx?Menu=Menu&Module=More&Location=None&ProjectID=16951
257 Guidelines for Cost-effective Agri-environmental Policy Measures, OECD, 2010,
http://www.oecd.org/greengrowth/guidelines-for-cost-effective-agri-environmental-policy-measures-
9789264086845-en.htm

96
addressed without an appropriate enabling framework using a mix of regulations,
technology, financial incentives and behavioural changes. Evidence also shows that
managing ecosystems and their services sustainably will be facilitated through the use of
integrated approaches, recognising the scope for a wide range of actors to participate and
collaborate, acknowledging the importance of spatial and temporal scales in formulating
appropriate response mechanisms, and using flexible adaptive management frameworks.
However, it is essential to bear in mind how different approaches and mechanisms interact
with each other and the possibility that they don’t necessarily have to operate
simultaneously.
Broadly, trends suggest that responses have been becoming more integrated over recent
years. Moreover, in an international context, EU and UK approaches to ecosystem
management reflect more integrated and collaborative modes of intervention. However,
considerable challenges remain and should not be underestimated.
3.3.2.1 Integrated approaches
In order to reflect ecosystem and now natural capital thinking in the consideration of policy
responses, the evidence suggests decision-makers need integrated approaches that cut
across narrow sectoral boundaries and recognise that the impact of actions in one sector
has implications for other sectors and their associated ecosystem services, as well as
human well-being. For example, the Convention on Biological Diversity advocates the
ecosystem approach as its primary framework for action. This is “a strategy for the
integrated management of land, water and living resources that promotes conservation
and sustainable use in an equitable way”258. Promoting multi-functionality requires the
identification of win-win opportunities which conserve and enhance multiple services such
as through strategies like managed realignment, while also recognising the importance of
potential trade-offs between services. Responses that are initiated within a single sector
often impact on other sectors and services which is a key aspect of ecosystem service-
based thinking. For example, agri-environment schemes provide markets and incentives
shaped by EU law, albeit with variations in implementation in each region of the UK. The
goal is to secure nonproduction ecosystem services from the farmed landscape alongside
the income farmers make from provisioning services, such as crop, livestock and dairy
production. Agri-environment schemes have been shown to have the following effects on
ecosystem services:
There is growing evidence that there have been considerable biodiversity
improvements.
There is potential to deliver other services, for example the prevention of soil
erosion, better water quality and improvements to quantity and recharge flood
control, and recreation.
Evidence suggests that working across spatial scales is required to gain full
potential, specifically joint participation schemes for farmers to deliver ecosystem
258 Convention on Biological Diversity, https://www.cbd.int/ecosystem/

97
services from spatially connected farms which cannot be accomplished by
individual farms.
A range of partnership based interventions have developed integrated approaches,
including Nature Improvement Areas, Local Nature Partnerships and the Catchment
Based Approach. Evaluations of these initiatives provide evidence to inform future policy
and delivery (see Case Study below; and the Local Nature Partnerships259 260 and
Catchment Based Approach261 evaluations).
Case Study: Nature Improvement Areas262
The establishment of the Nature Improvement Areas (NIAs) was announced in the Natural
Environment White Paper and contributed to England’s strategy for wildlife and ecosystem
services – Biodiversity 2020. The NIAs were designed to enable partnerships (including local
authorities, local communities, land managers, the private sector and conservation
organisations) to develop and implement a shared vision for their natural environment and to
demonstrate how a ‘step change’ in nature conservation might be delivered at a landscape-
scale, enhancing ecosystem services including social and economic objectives. Following a
national competition 12 selected NIAs were awarded a share of £7.5 million government
funding for a three year period from April 2012 to March 2015.
In their three years the NIAs developed partnerships, established shared visions and objectives
for the natural environment in their areas, and implemented ambitious work programmes. They
delivered a range of benefits, including: real change in the quality and quantity of priority
habitats; enhanced ecosystem services; joint working with a wide range of partners and the
involvement of many people as volunteers or visitors, leading to benefits for local people and
communities.
259 Formative evaluation of Local Nature Partnerships, Tavistock Institute and URSUS Consulting report to
Defra, 2014,
http://randd.defra.gov.uk/Default.aspx?Menu=Menu&Module=More&Location=None&ProjectID=18413&Fro
mSearch=Y&Publisher=1&SearchText=NE0134&SortString=ProjectCode&SortOrder=Asc&Paging=10#Desc
ription
260 Local Nature Partnership Phase II Evaluation, ICF International report to Defra, 2015,
http://randd.defra.gov.uk/Default.aspx?Menu=Menu&Module=More&Location=None&ProjectID=18911&Fro
mSearch=Y&Publisher=1&SearchText=NR0160&SortString=ProjectCode&SortOrder=Asc&Paging=10#Desc
ription
261 Evaluation of the Catchment Based Approach - Pilot Stage. Final Evaluation Report from Cascade
Consulting to Defra, 2013,
http://randd.defra.gov.uk/Default.aspx?Menu=Menu&Module=More&Location=None&ProjectID=17943&Fro
mSearch=Y&Publisher=1&SearchText=WT0959&SortString=ProjectCode&SortOrder=Asc&Paging=10#Des
cription
262 Monitoring and Evaluation of Nature Improvement Areas, Final Report from Collingwood Environmental
Planning Ltd to Defra, 2015,
http://randd.defra.gov.uk/Default.aspx?Menu=Menu&Module=More&Location=None&ProjectID=18555&Fro
mSearch=Y&Publisher=1&SearchText=WC1061&SortString=ProjectCode&SortOrder=Asc&Paging=10#Des
cription

98
More, bigger and less fragmented places for wildlife
Substantial contributions to Biodiversity 2020 outcomes were achieved. NIA partnerships
maintained or improved 13,664 hectares of existing priority habitat (equivalent to about a
quarter of the size of the New Forest National Park); and have restored or created 4,625
hectares of new priority habitat. The NIAs also restored, created or managed 225 kilometres of
linear and boundary habitats, such as rivers and hedgerows. Activities to restore or create
habitats have delivered multiple benefits, such as: improved habitat connectivity; development
of recreational corridors; creation of open spaces; and the enhancement of ecosystem
services.
Enhancing the benefits that nature provides for people
The NIA partnerships worked to improve people’s experiences of the natural environment and
use nature for learning, art and cultural events. Examples include: a project in Birmingham and
Black Country which brought together local residents and community groups in a deprived
urban-fringe estate to improve their local open space providing opportunities to learn new skills,
meet people and be physically active. In three of the NIAs, 26,500 people participated in
educational visits. Volunteers contributed over 47,000 days of their time to activities in all the
NIAs over the three grant funded years, and volunteering increased in each of the three years,
with the amount of volunteering in the third year twice as much as in the first. In total, 87% of
volunteering time was on activities considered likely to lead to health and wellbeing benefits for
the people involved (e.g. working in groups or doing physical work).
Working with local communities, land managers and businesses
The government grant enabled staff to be employed in NIAs to coordinate partnerships and
encourage joined-up working. NIA partnerships were broader and better coordinated than
would have been possible otherwise. They included organisations that are not traditionally
involved in conservation work, such as local businesses. Land managers were involved in, and
undertook activities across all the NIAs, particularly related to sustainable agriculture. The NIA
partnerships also engaged with their local communities, encouraging community involvement in
decision-making.
Leverage
Following the initial government grant of £7.5 million, the NIA partnerships managed to lever in
additional resources with an equivalent value of £26.2 million (including the financial value of
volunteer time and services in-kind). Of this total, £15.3 million was from non-public sources
(e.g. private sector and non-governmental organisations).
3.3.2.2 Collaboration between multiple actors
There is considerable evidence that in each sector action has been undertaken by actors
at every level, suggesting that there is scope for a wide range of actors to participate in the
management of ecosystems. Different actors may be differently placed to undertake
particular types of responses, but it is important to recognise that responses are not the
exclusive domain of official/government actors, and that effective responses have been led

99
by a range of private, non-governmental and community actors. An appropriate policy mix
may require a combination of different types of responses. Governments are primarily
involved in foundational and enabling activities; the scientific community in foundational
activities; the private sector primarily in foundational and instrumental activities, but also in
enabling activities, especially in shaping social attitudes; and individuals and communities
are mostly involved in enabling activities by changing social attitudes and values and
instrumental activities by responding to incentives and undertaking voluntary activities.
In order to be effective and to deliver lasting improvements in ecosystem services and
human well-being, responses need to recognise the importance of collaboration between
actors. While responses may be typically initiated by particular actors, they are rarely
implemented in isolation, and usually require synergistic inputs from other actors to be
successful. For example, the Water Framework Directive is an enabling piece of legislation
which is implemented at local/regional scales, and necessitates collaboration between
actors in order to develop River Basin Management Plans (RBMPs). While the lead
stakeholders are competent government authorities in each river basin district (e.g. the
Environment Agency, the Scottish Environment Protection Agency and the Northern
Ireland Environment Agency), extensive consultations have taken place with stakeholders
in the agricultural sector and water industry, and with planning authorities, businesses,
environmental organisations, and anglers, boaters and other water users in the
development of RBMPs. This engagement has established the foundation for continued
collaboration between stakeholders in this context.
Integrated approaches within and across sectors and collaboration between multiple
actors are also needed to secure a wide range of health and wellbeing benefits from
natural environments (see Case Study below).
Case Study: Health and Wellbeing
There is growing practical experience of using or managing the natural environment to provide
a context or resource for health and wellbeing related interventions. This can take many forms,
from specific practitioner led therapeutic interventions in natural environment settings to
ensuring adequate access to greenspaces in the living environment (whether through planning
for new spaces or improving physical access to existing spaces)263. Green care interventions
seek to improve the health and wellbeing of vulnerable groups, such as psychiatric patients and
people with learning disabilities. Interventions include horticulture, green exercise therapies,
animal-assisted therapy, care farming, ecotherapy and wilderness therapy. Overall, there is
263 Evidence Statement on the links between natural environments and human health, Defra, 2017,
http://randd.defra.gov.uk/Default.aspx?Menu=Menu&Module=More&Location=None&ProjectID=19511&Fro
mSearch=Y&Publisher=1&SearchText=BE0109&SortString=ProjectCode&SortOrder=Asc&Paging=10#Desc
ription

100
evidence that green care interventions produce health, social and educational benefits, but
these have not yet been widely evaluated264.
Social prescribing is a mechanism for linking patients with non-medical sources of support
within the community, including green care interventions265. There are numerous examples
dating back to the 1990s but interest in the concept is increasing266.
Social prescribing can make use of a wide range of interventions and approaches including
community education, arts-based activities, exercise on referral and self-help groups. Nature
based interventions offered as part of a social prescribing portfolio can include green care
services for individuals with a defined health need as well as wider health promotion services
(e.g., community gardening or conservation volunteering)267.
Overall, there is evidence of a range of benefits from social prescribing initiatives. The evidence
is relatively strong for nature-based interventions, compared to many other activities included in
social prescribing portfolios267. Benefits from social prescribing can include265:
Improvements in psychological or mental wellbeing, and reduction in symptoms of anxiety
and/or depression
Improvements in physical health and a healthier lifestyle
Reduction in number of visits to a GP and other primary or secondary care services
Reduction in social isolation and loneliness, support for hard-to-reach people
Acquisition of learning, new interests and improvements in motivation and meaning in life
More broadly, there is evidence that changes to the built environment can encourage use and
result in increased physical activity in urban green space268. Factors that lead to increased park
use include safety, aesthetics, amenities, maintenance and proximity269.
However, there may be significant barriers to greater engagement with the natural environment
for many different groups. Some evidence suggests that the key requirement for further
264 Pretty et al. (2011). Health values from ecosystems. In: The UK National Ecosystem Assessment:
Technical Report. UNEP-WCMC, 2011, http://uknea.unep-wcmc.org/Resources/tabid/82/Default.aspx
265 Thomson, L., Camic, Paul M. and Chatterjee, H. (2015) Social prescribing: a review of community referral
schemes. Technical Report. London: University College London,
http://create.canterbury.ac.uk/15655/1/Social_Prescribing_Review_2015.pdf .
266 Local Government Association (2016). Just what the doctor ordered. Social prescribing - a guide for local
authorities. LGA, London, Local Government Association, 2016, https://www.local.gov.uk/just-what-doctor-
ordered-social-prescribing-guide-local-authorities
267 Good practice in social prescribing for mental health: the role of nature-based interventions. Natural
England Commissioned Report NECR228. Natural England, Peterborough, (NECR228), Bragg, R. and Leck,
C. Report to Natural England, http://publications.naturalengland.org.uk/publication/5134438692814848
268 Hunter et al. (2015). The impact of interventions to promote physical activity in urban green space: A
systematic review and recommendations for future research. Social Science and Medicine 124(0): 246-256,
https://doi.org/10.1016/j.socscimed.2014.11.051
269 McCormack et al. (2010). Characteristics of urban parks associated with park use and physical activity: a
review of qualitative research. Health and Place 16(4): 712-726,
https://doi.org/10.1016/j.healthplace.2010.03.003

101
research on the natural environment and health may not be to improve understanding of the
health benefits which can be derived from increased contact with nature, but how to increase
the number of people who choose to engage with nature270.
3.3.2.3 Temporal and spatial scale.
Spatially, institutional mechanisms that link across scales provide opportunities for
stakeholder engagement and greater collaboration between actors, and for the
involvement of local groups and non-governmental organisations. Strategic spatial
planning of habitats (terrestrial, freshwater and marine) is important for ecosystem service
delivery, and this is happening in some cases, but needs to be better reflected in future
responses. Temporally, recognising potential trade-offs between short-term goals and
medium/long-term targets may require the adoption of longer planning horizons.
One example of thinking across spatial scales is marine planning. The Marine and Coastal
Access Act is an enabling piece of legislation, which is under implementation in each
region. The goal is an overarching framework for marine spatial planning, recognising
linkages across scales. Key features include: consistency at the UK level across devolved
administrations; recognition of competing demands taking an integrated ecosystems
approach across scales; and engagement of all stakeholders/actors. Relevant evidence for
the effectiveness of such an approach is the enactment of the Belgium Marine Protection
Act in 1999, which established a master plan for Belgium’s North Sea marine area, making
it one of the first countries to develop an operational, multi-use marine spatial planning
system with effective engagement of relevant stakeholders.
An example of thinking across temporal scales is Forest Schools, which seek to influence
long-term social attitudes through education in woodland. The goal is to use woodlands as
a learning tool and site for education; there are about 140 Forest Schools in the UK.
Evidence shows that outdoor learning environments enhance physical health and mental
wellbeing of participants. There are also positive long-term impacts on the attitudes of
participants towards nature and forested landscapes, resulting in greater local involvement
in forest stewardship.
3.3.3 Flexible, adaptive management frameworks
It has to be recognised that the environment is under constant change and consequently
both management and the supporting evidence base needs to take into account these
changes. The collection, analysis and application of evidence has to satisfy the needs of
what must be a flexible, adaptive management approach.
Planning responses in the face of uncertainty such as in the context of climate change
requires the adoption of more flexible, adaptive management frameworks that are
270 Hitchings (2013). Studying the preoccupations that prevent people from going into green space.
Landscape and Urban Planning 118: 98-102, https://doi.org/10.1016/j.landurbplan.2012.09.006

102
implemented within reflexive learning environments and which recognise that mistakes
often help to construct more effective future responses.
Knowledge frameworks need to support this adaptive approach, and lay and local
knowledge needs to be adequately recognised as part of this broader learning
environment, especially to get greater involvement of a wide range of stakeholders in
response strategies.
3.4 Analysis of interventions supporting environmental outcomes from land management
Due to the importance of land management to the delivery of a wide range of
environmental outcomes, further analysis has been done on the various options that are
available for exploration. This has concluded that, in order to secure long-term
sustainability and resilience of the environment, two approaches are needed:
1. To reduce the pressure on the environment caused by pollution or erosion of
natural capital. Responses are needed which address the risk of ‘negative
externalities’ from actions taken on or uses of land. Application of the ‘polluter pays
principle’ to these responses could help increase ownership of those externalities
and their solutions by each actor.
2. To increase environmental benefit. Intervening in market failure for public goods,
either through contracts that reward their provision or by securing permanent
changes in practice. Enabling new private sector investment opportunities for
environmental improvements or increased flows of benefits.
The analysis also concludes that the way interventions operate impacts on their suitability
to address particular types of environmental issue. Furthermore, whilst some can operate
independently, their effectiveness is usually enhanced when used in combination.
Therefore a future system should look to combine different instruments that are best suited
to the delivery of common objectives. Some could appear in more than one box, but the
purpose here is to show their primary role.
There is a further group of interventions that are particularly suited to enabling land
managers to improve their environmental performance by creating access to finance,
knowledge and skills. Some can support strategies to promote reductions in
environmental pressure and increase benefit, whilst others are best focussed to one or the
other. For example, supply chain assurance is best focussed on using standards to
reduce environmental pressures, whilst “net gain” frameworks and visitor fees are best
focussed on increasing environmental benefits.
There is also a group of interventions that can enhance the delivery of environmental
management contracts. Evidence suggests that payment-by-results and reverse auctions
can improve the setting of payment rates whilst agglomeration bonuses encourage group
working. Covenants offer a means of securing the past investment from a contract, or

103
following land purchase and subsequent re-sale with conditions, but their use elsewhere in
the world suggests they need to be supported by some compensatory mechanism for loss
of flexibility.
3.5 Encouraging environmentally positive behaviours
Table 3.1 (which builds on the Nuffield Ladder of Interventions) is adapted from the House
of Lords “Behaviour Change” report271 and covers a wide variety of types of interventions
related to changing behaviours. It sets them out in a possible framework, including
examples, of different types of intervention. The report states that “Many of the goals to
which governments aspire—such as bringing down levels of crime, reducing
unemployment, increasing savings and meeting targets for carbon emissions—can be
achieved only if people change their behaviour. Consequently, understanding how to
change the behaviour of populations should be a concern for any government if it is to be
successful”.
Table 3.1: Table of policy interventions related to behaviour change
Regulation of the individual Fiscal measures directed at
the individual
Non-regulatory and non-fiscal measures with relation to the individual
Choice Architecture (“Nudges”)
Inte
rven
tions c
ate
go
ry
Eliminate
choice
Restrict
choice
Guide and enable choice
Fiscal
disincentives
Fiscal
incentives
Non-fiscal
incentives
and
disincentives
Persuasion Provision of
information
Changes to
physical
environment
Changes to
the default
policy
Use of social
norms and
salience
Exa
mp
les o
f po
licy inte
rven
tions Prohibiting
goods or
services e.g.
banning
certain drugs
Restricting
the options
available to
individuals
e.g.
outlawing
smoking in
public places
Fiscal
policies to
make
behaviours
more costly
e.g. taxation
on cigarettes
Fiscal
policies to
make
behaviours
financially
beneficial
e.g. tax
breaks on the
purchase of
bicycles
Policies
which reward
or penalise
certain
behaviours
e.g. time off
work to
volunteer
Persuading
individuals
using
argument
e.g. GPs
persuading
people to
drink less
Providing
information in
e.g. leaflets
showing the
carbon usage
of household
appliances
Altering the
environment
e.g. traffic
calming
measures
Changing the
default option
e.g. providing
salad as the
default side
dish
Providing
information
about what
others are
doing e.g.
information
about an
individual’s
energy usage
compared to
the rest of
the
community
This analysis supports the overall conclusion of this section that an effective selection of
responses designed to improve the environment will need to include actions that regulate
harmful behaviours (and those that harm others), incentives which either make certain
behaviours less or more attractive, actions which influence people to change behaviour
without financial incentive, and also increasing knowledge and embedding certain
271 Behaviour change, House of Lords Science and Technology Select Committee, 2011,
https://publications.parliament.uk/pa/ld201012/ldselect/ldsctech/179/17902.htm

104
behaviours as part of the “social norm”. All of these tools are available in the
environmental space and can therefore be deployed in concert to bring about the
improvements sought through changing the behaviours of a range of actors.
3.5.1 Segmentation
Segmentation analysis can be useful to help understand the attitudes and motivations of
different sections of the population, or at least to better understand how a large population
can be better broken down to help identify the key issues and so the most suitable
intervention. For example, Figure 3.2 below is from a Defra study ‘Engaging People in
Biodiversity Issues’272 which demonstrates that 30% of people are unaware of biodiversity
loss, either in England or the world.
A tier definition such as in Figure 3.2 can support the prioritisation of audiences and
interventions, by enabling policy developers and analysts to estimate how much effort may
be required to increase the engagement of different tiers and set realistic priorities for
engagement activity. Understanding why people sit in particular tiers may also offer further
insight useful for honing interactions with these groups. Segmentation and tier definitions
can also underpin the development of indicators of engagement.
Decisions on priority behaviours, or broad categories of action, may be needed prior to
developing a segmentation or tier definition, or considering the range of policy
interventions identified above. If so, this is likely to need to take into account the
environmental outcomes desired and the impact of different behaviours on these
outcomes.
Figure 3.2: Five tiers from ‘Engaging People in Biodiversity Issues’
272 Engaging people in biodiversity issues. Final report of the Biodiversity Segmentation Scoping Study.
Christmas et al. report to Defra, 2013,
http://randd.defra.gov.uk/Default.aspx?Menu=Menu&Module=More&Location=None&ProjectID=18411&

105
3.5.2 Other behaviour change approaches
It may be useful to consider a range of other behaviour change approaches. For example,
building on work undertaken by Defra, a practical guide to influencing behaviour
recommends consideration of six main areas of action: Explore, Enable, Encourage,
Engage, Exemplify and Evaluate273. The Behavioural Insight Team’s EAST framework
suggests that interventions should encourage behaviour that is Easy, Attractive, Social
and Timely274.
Behaviour change interventions do not have to be targeted only at individuals.
Frameworks and tools are also available to help influence organisational behaviours275.
The ‘practices’ approach suggests that practices are a better target of intervention for
sustainability policy than ‘behaviour’, ‘choice’ or technical innovation alone. The approach
has developed from sustainable consumption research and recognises that access to
resources, norms of social interaction, as well as infrastructures and institutional
organisation constrain the autonomy of individuals to change their behaviour276.
For example, in the context of increasing contact with the natural environment, the
practices approach might help us to think about the extent to which contact with the natural
world is embedded in everyday life, and look at improved opportunities for active travel,
gardening, contact with nature at school, and urban design.
3.6 Selection of policy interventions
Having identified the suite of potential policy interventions, the question then becomes
which one or ones to select for any given issue. This will depend on the implementation
timeframe, the problem to be addressed (which will influence the different spatial
distribution and degree of change sought) and on the policy preferences to be applied.
When trying to achieve an objective in the most efficient and effective manner, the choice
between alternative policy interventions should be governed by the aim to achieve the
273 MINDSPACE: Influencing behaviour through public policy. The Practical Guide. Dolan et al. for the
Institute for Government and the Cabinet Office, 2010,
https://www.instituteforgovernment.org.uk/sites/default/files/publications/MINDSPACE-Practical-guide-final-
Web_1.pdf
274 Four simple ways to apply behavioural insights. Behavioural Insights Team, 2014,
http://www.behaviouralinsights.co.uk/publications/east-four-simple-ways-to-apply-behavioural-insights/
275 ORGANISER: A behavioural approach for influencing organisations. Department for Energy and Climate
Change, 2016, https://www.gov.uk/government/publications/organiser-a-behavioural-approach-for-
influencing-organisations
276 Interventions in practice: re-framing policy approaches to consumer behaviour, Sustainable Practices
Research Group, 2013, http://www.sprg.ac.uk/projects-fellowships/theoretical-development-and-
integration/interventions-in-practice---sprg-report

106
policy objective at minimum overall cost, including administrative costs such as monitoring
and enforcement. Where society has already determined the optimal level of
environmental quality, responses can be employed that offer the lowest cost way of
achieving that. Where it has not, then both the costs and the benefits of action need to be
taken into account. The following are key factors driving instrument choice277:
Prior conclusions about the allocation of property rights.
Decisions about where in the production chain it is important to intervene and
whether this implies reducing or increasing an activity.
The cost and feasibility of attributing outcomes to individuals and individual
businesses.
The complexity of the environmental relationships, i.e. the extent to which impacts
vary over a number of independent dimensions, such as space, time, business,
output, etc.
Variability across individuals and businesses in costs and benefits;
Uncertainty or lack of information about costs.
The relative sensitivity of environmental benefits and costs to changes in individual
or business effort.
Transaction costs, particularly in comparing grants with regulations in terms of their
relative costs of monitoring and enforcing compliance.
Analysis investigating the most economically efficient policy instruments for acquiring
environmental goods from private land managers, resulted in the development of the
following questions to consider:
Can land managers improve the environment with benefit to themselves and if so, is
this enough to achieve the target level?
Is it necessary for all to comply within the targeted group?
Are there few providers or polluters?
Are we looking at a marketed good?
Does the issue have spatial, timing and /or multidimensional elements?
Is the target level of the environmental objective close to an environmental limit or
treaty obligation?
Is there variation in abatement / improvement cost between land parcels?
Can the harmful output be attributed to individuals?
Are transaction, monitoring and enforcement costs likely to be high relative to the
environmental benefits?
Is there variation in abatement cost between land parcels or uncertainty about the
true level of that cost?
As noted above, the selection of the most appropriate policy intervention may not rest on a
single intervention. As the UK NEA concludes: “the sustainable management of
277 Informed by OECD (2010) Guidelines for Cost-effective Agri-environmental Policy Measures
http://www.oecd.org/greengrowth/guidelines-for-cost-effective-agri-environmental-policy-measures-
9789264086845-en.htm

107
ecosystems and their services typically involves a mix of approaches including regulations,
policies, attitudes, incentives, technologies and voluntarism. This emphasises the need to
manage ecosystems through the adoption of holistic and integrated approaches which
recognise the impacts of actions across a range of sectors and provide opportunities for
collaboration between actors at different levels”. It goes on to say that there may be trade-
offs which can mean the need to make difficult choices. Actions and interventions in one
area can have knock-on effects beyond some of which can be unintended.
3.7 Governance
As outlined in the Land Use Futures: Making the Most of Land in the 21st Century report,
the land system is complex which is borne out in its assessment of land system valuation.
Natural capital and ecosystem services provide a wide range of benefits that support
human wellbeing. As the report points out, there are various market failures which mean
that, left unaided, the land market would be unlikely to generate outcomes that are
acceptable. It also highlights the issues around the importance of governance and
institutional failure. All of this may partly explain the correspondingly large number of
stakeholders at varying spatial levels and with specific interests. Any review or
assessment of these governance arrangements needs to take into account these
complexities278.
3.8 Conclusion
This analysis of “what works” suggests that, in order to determine the correct interventions
to improve the environment, there is a range of issues that need to be borne in mind.
These include:
Responsibility for progress is not all down to government: the private sector has
a role to play
A combination of interventions may be more successful that in isolation
The heterogeneity of stakeholders is high in many situations
The need to understand behaviours and motivations of individual actors and
groups
Segmentation can assist in targeting particular issues or particular sectors
The need to be aware of unintended consequences
Development of responses happens in the context of existing sub-national, national and
international action already underway as well as external factors that will drive change
278 From Land use futures: making the most of land in the 21st century, Government Office for Science,
2010, https://www.gov.uk/government/publications/land-use-futures-making-the-most-of-land-in-the-21st-
century

108
over the period of that response, for example in the case of the environment, climate
change. Therefore derivation and selection of the most effective responses will need to
take place in the context of past, present and future actions. The complexity of this task
underlines the importance of creating responses that can be monitored, evaluated and
adapted as more evidence of their effectiveness becomes available.

109
Section 4: Prioritising action in the Plan
4.1 Context
The 25 Year Environment Plan aims to improve environmental outcomes. This section will
explore how natural capital and ecosystem service thinking is helpful to identify priorities
for improving outcomes.
In order to help prioritise properly it is important to know the value of non-market goods
and services and positive and negative environmental impacts arising from our
interventions. Otherwise we risk ignoring them in decision making, resulting in losses to
economic welfare and wellbeing.
This section will explore some methodologies for prioritisation, how to value natural capital
goods and services, and some issues to be aware of when using a natural capital
approach to prioritisation. It will apply these to give a high-level indication of the benefits
of the goals identified in the Plan and to assist in prioritising actions towards these goals.
As the Plan is reiterated over its 25 year duration, the sophistication with which actions are
designed and prioritised will improve as the techniques and data for doing so also improve.
4.2 The importance of employing a variety of prioritisation and valuation methods
Prioritisation within the 25 Year Environment Plan is at a strategic level considering
national issues. Once direction has been set by the Plan different levels of analysis will be
required before implementation of any actions. This will involve assessing the viability of
the intervention at the appropriate spatial scale and considering the mechanisms that will
be used to deliver it. The different analyses appropriate in different contexts are illustrated
by The Balance Sheet Approach in the UK National Ecosystem Assessment Follow-on279
(Figure 4.1), which recognises the different levels of analysis that will be required along a
spectrum of potential interventions. It shows that decision making must combine
economic, scientific, social, cultural, moral, ethical and legal factors. It will also reflect the
level of information available. Different methods may be appropriate in different contexts.
For example, the right hand side of Figure 4.1 below, ‘Negotiation and Trade-off Analysis
Support’, when dealing with policy issues which are more contested, outlines approaches
such as group-based deliberative methods which encourage discussion and debate but
may not necessarily result in consensus.
279 UK National Ecosystem Assessment Follow-on, UNEP-WCMC, 2014, http://uknea.unep-
wcmc.org/Home/tabid/38/Default.aspx

110
Figure 4.1: The Balance Sheet Approach (Source: UK National Ecosystem Assessment
Follow-on)
Box 4.1: Urgency
The environment is inherently complex. There is a large degree of variability, stochasticity and
a lot of unknowns. Environmental assets may have thresholds below which they show
accelerated non-linear decline. There are also highly likely to be exogenous environmental
“shocks” in the future.
For these reasons there will be actions that it may be argued should not be delayed. Likewise
there will be some that can. Any attempt at prioritisation should take this into account. Priority
should be given to actions that will either not be an option in the future, or show declining
returns if delayed. This requires a more forward-looking options appraisal that is not usually
required in other areas.
4.3 Determining the value of interventions
For cost-benefit analysis we should aim to know the Total Economic Value (Figure 4.2) of
all the variables under consideration:

111
Figure 4.2: Total Economic Value (Source: TEEB, Chapter 5)
A natural capital asset is valued based on the flow of benefits it provides to humans. The
extent to which natural assets provide benefits is determined by four key characteristics:
The quantity of an asset, for example, land availability, or the amount of a land use
of a particular type like woodland;
The quality of an asset, such as the capability of soil to grow arable crops, grass,
vegetables as reflected in the Agricultural Land Classification280;
The location of that asset, for example, where a woodland is geographically
located in relation to people who use it and to other natural habitats as connectivity
supports wildlife populations;
People’s physical exposure to that asset, whether or not people actually take
advantage of the natural asset by using it for example to recreate in.
All four factors are important as they have implications to the flow of benefits as well as
their value, but how important depends on the asset and benefit in question. For example,
the value of carbon captured by woodland does not vary much by location whereas,
280 Regional Agricultural Land Classification Maps, Natural England, 2010,
(http://publications.naturalengland.org.uk/category/5954148537204736)

112
location can be instrumental in determining how beneficial trees are for recreation, for
improving water and air quality and for reducing flood risk. For some assets, like soils,
quality characteristics are often more important that quantity or location.
It is also important to incorporate risk, and potential thresholds. If a deterioration threshold
is crossed there may be a loss of benefits that are disproportionate to the loss of the asset,
as the ecosystem service breaks down. It may also be very costly, or impossible to restore
the asset to optimal levels again. Values should also take into account potential
substitutes, or the lack of them.
It is important to recognise the diversity of values that needs to be taken into account as
part of a natural capital approach, and the range of methods needed to capture this
diversity. For example, the UK NEA Follow-on discusses a range of deliberative and other
approaches to develop understanding of values in four marine and coastal case studies281.
It also employs participatory and interpretative approaches to assess cultural ecosystem
services in case studies including the North Devon Nature Improvement Area and an
exercise to explore community values in relation to farming on the Lizard Peninsula. It
finds, for example, that ‘arts and humanities perspectives are grounded in the ambiguity,
variety, irreducible difference, contingency, unpredictability and incertitude of human
experience. Paying attention to these qualities improves, rather than impedes,
understanding of the values and benefits attached to ecosystems and environmental
spaces’282. Together, these case studies provide useful evidence on how to integrate
different values in decision-making, especially at a local level.
The UK NEA public dialogue project has key findings on the way in which valuations are
perceived and the need to integrate different methods, in order for the decisions based on
these to be seen as valid. It found that monetary valuation techniques are considered as
important, and are especially associated with transparency, objectivity and clarity in
decision-making. However, they are seen as a necessary but insufficient basis for
decision-making, and overall there was a strong message about the need for pluralistic
approaches to valuation, especially in complex contexts at all levels of decision-making283.
Understanding how a policy impacts across a range of environmental outcomes allows for
the identification of win-win policies without a need for a great deal of analysis. Where
trade-offs are identified more consideration is justified. Valuation allows you to weigh up
those trade-offs more objectively.
281 Work package report 6: Shared, plural and cultural values of ecosystems, of the UK National Ecosystem
Assessment Follow-on, UNEP-WCMC, 2014, http://uknea.unep-wcmc.org/Resources/tabid/82/Default.aspx
282 Work package report 5: Cultural ecosystem services and indicators, of the UK National Ecosystem
Assessment Follow-on, UNEP-WCMC, 2014, http://uknea.unep-wcmc.org/Resources/tabid/82/Default.aspx
283 Naturally Speaking… A Public Dialogue on the UK National Ecosystem Assessment, University of Exeter,
2015, http://valuing-nature.net/sites/default/files/documents/NEA_Dialogue_Final_Report_final.pdf

113
4.4 Using prioritisation methods with a suitable level of caution
It is important to be cautious when performing this kind of prioritisation and the reasons for
doing so can be roughly attributed to three categories:
I) Poor data
Often there is a lot of uncertainty in natural capital valuation, this is because natural assets
are interrelated and complex. It is also because error and uncertainty is present throughout
both the scientific and economic stages of the process.
Scientific uncertainty can stem from:
Biophysical uncertainty
Spatial variations
Environmental limits and thresholds
Cumulative effects
Other scientific variabilities, uncertainties and unknowns
Economic uncertainty can stem from:
Personal and localised issues
Valuation errors and biases
Value transferability errors
Inability to assign values
Other economic variabilities, uncertainties and unknowns
It is not currently possible to assign values to all the benefits we get from natural capital.
Many cultural services, and in particular those that relate to the welfare of future
generations, are difficult if not impossible to value. There are examples of approaches
where a mixture of quantitative and semi-quantitative evidence has be used such as in the
Tree Health and Plant Biosecurity Expert Taskforce’s final report284.
II) Misusing data
Even with reliable scientific data and economic valuations it is still important to be cautious
with how we use it. Valuation is an important tool but is only one input into decision
making. Care must be taken to ensure that values, and scientific data, are used in the way
they were intended, and not misinterpreted.
A poignant example of this is the weak substitutability problem. Monetary valuations
should not be regarded as indicating that different forms of natural capital are
interchangeable (or interchangeable with other forms of capital). If we lost all our wetlands
but gained an equivalent value from woodland and open waters we would not be equally
284 Tree Health and Plant Biosecurity Expert Taskforce Final Report: Annex F, 2013,
https://www.gov.uk/government/publications/tree-health-and-plant-biosecurity-expert-taskforce-final-report

114
well off if this calculation was based on average monetary values. This is because values
are not static, and vary with scarcity of an asset, so applying fixed values would not be
appropriate. The problem is compounded as the environmental values used in cost-benefit
analysis are marginal values, so are not always transferable. They are also often
asymmetric; meaning the benefit from a change is not necessarily equal to the cost of an
equivalent change in the other direction.
III) Policy failure
A policy failure would be to rely too heavily on limited evidence, and so take a drastic
course of action that causes more harm than good. It could be by increasing market
frictions to an extent that is more damaging than the initial market failure.
An example of a policy failure particularly applicable to environmental policy would be the
construction of an inappropriately restrictive framework; when conformity to an arbitrary
standard is enforced at the expense of a better functioning solution. Due to the
unpredictable and changing nature of many environmental assets, benefits and indicators,
conformity to strict standards could stifle improvements that require a more flexible
standard.
We also need to be aware of synergies and tensions between interventions, and ensure
we are choosing a bundle of interventions that complement one another, rather than work
against each other. Decisions making must take into account other policies, deliverability
and risk. Furthermore, it is essential that we bear in mind future potential impacts on the
environment and impacts from the environment all of which will have implications for the
evidence base.
Box 4.2: Equity
Analysis and prioritisation of this kind aims to maximise aggregate welfare. It does not concern
itself with the distribution of that welfare.
Good cost-benefit analysis employs social welfare functions in an attempt to correct for this.
Good decision making should go further, including assessments of the impacts on different
parts of society or different places. The increase in spatially disaggregated data on the
environment and people’s interaction with it offer new opportunities for doing this more complex
analysis.
Understanding where costs and benefits accrue will help in choosing the right balance of
policies. This is important geographically, socioeconomically and intergenerationally.
4.5 Evidence base for prioritising interventions in the Plan
For a document as complex and comprehensive as the 25 Year Environment Plan,
systematically prioritising interventions would require taking a long list of all potential

115
options and analysing them in a comparable manner. Our ambition is to work towards the
evidence and methods to allow these systematic comparisons.
To undertake this prioritisation, it is essential to have timely evidence that is appropriately
spatially detailed, and that takes into account the social and economic aspects as well as
the scientific aspects.
It is also vital to acquire evidence from current interventions to inform future interventions.
In other words, as described in Section 3.3.3, knowledge frameworks need to support
more flexible, adaptive management frameworks. That means collecting evidence that can
be analysed and interpreted in order to identify lessons learnt which can then in turn feed
into and inform future interventions and responses.
‘A Living Nature Map’, as detailed in Section 5, demonstrates how new technologies can
provide opportunities to combine data and new analytical approaches that adds value to
the existing evidence base which in turn can better inform the prioritisation of interventions.
Advances in science, technology and economic valuation means the wonders and value of
nature are increasingly being revealed to us.
4.6 High level analysis of the benefits of the goals set out in the Plan
Section 2 of this Evidence Report lays out the current situation of our natural environment
across a range of areas. It has shown that there are concerns across many of these and
that although there have been improvements in some areas, more needs to be done. The
following summarises the issues while Section 4.7 covers the proposed interventions.
Air pollution, including particulate matter, has implications for both human health and the
environment and while most of the measured emissions have declined since the 1970s285
the issue for human health is more one of population exposure than overall levels. Those
living in city centres and near busy roads, often on the lowest incomes, are most exposed
to dangerous levels of air pollution. And while overall UK emissions of greenhouse gases
has declined, when compared to other OECD countries the per capita figure is high,
although falling at one of the fastest rates.
Clean water is used across a vast range of activities including recreation and is essential
for life, and yet there are no pristine freshwater ecosystems in England due to a range of
factors, some dating back centuries, although in recent decades major improvements have
been made. Besides the quality of water there is also the concern of its quantity and that
the management of water is crucial in order to address the risk of flooding as well as water
shortages.
285 Air Quality Pollutant Inventories, for England, Scotland, Wales and Northern Ireland: 1990-2015, National
Atmospheric Emissions Inventory, 2017, http://naei.beis.gov.uk/reports/reports?report_id=895

116
Across its land, freshwater and marine environments, England contains a rich diversity of
animals and plants. While there have been significant declines in species and quality of
habitats, conservation activity is taking place providing improved management and better
protection. However, such activity needs to take into account the fragmented nature of
some of the terrestrial wildlife habitats as this is contributing to declines in the provision of
some ecosystem services and species numbers. The UK’s Overseas Territories must also
be borne in mind with their high levels of unique biodiversity along with vulnerabilities from
such pressures as invasive non-native species, habitat destruction and climate change.
Biosecurity is a further issue especially as increased movements of goods and people
increases the risk of introducing species to new areas.
England’s natural resources provide a wide range of ecosystem services ranging from, for
example, food, timber and fisheries, to providing water, the regulation of air and flooding,
and to cultural services such as recreational activities in the countryside, coastline and in
the sea. However, the provision of such services are under pressure due to, amongst
other things, increasing populations and climate change which is compounded by the fact
that not all of these services fully feature in the market place. So while we see increases in
such ecosystem services such as crop yields which have seen a substantial increase
since the 1940s, we have also seen declines in quality and quantity of other services and
habitats such as water quality, species numbers, heathland and fens. However, there are
in place across the country and marine environment a variety of environmental land and
sea management schemes such as the Countryside Stewardship Scheme and Marine
Protected Areas. These have delivered halts in the declines in some areas and
improvements in others, for example some aspects of the status of the UK’s seas have
improved since 2012, but some measures are still required to secure healthy and
productive seas.
While England is characterised by contrasting landscapes, it must be remembered that the
countryside is a working landscape supporting farm businesses and the wider economy in
rural areas as well as containing natural capital that delivers ecosystem benefits to society.
This landscape is highly valued which is recognised through existing policies such as
Natural Character Areas, National Parks, Areas of Outstanding Natural Beauty and also
Sites of Special Scientific Interest which feature in land, coastal and sea areas. There is
also clear evidence that society values natural places including visiting and engaging with
them as well as supporting environmental organisations. Across the country there is much
of the natural environment that is accessible, such as public rights of way, woodland and
public urban green space. Regarding the latter, over 80% of England’s population live in
urban areas and so in order to provide them with the opportunity for regular engagement
with nature and the environment it is essential that these areas provide green and blue
environments in the form of parks, playing fields, rivers and canals. People also value
recreation and engagement with the sea, for example through visits to beaches and
participation in various water sports. Besides recreation, public engagement with the
natural environment also provides such benefits as improvements to mental and physical
health and wellbeing, and education as well as supporting such industries as tourism.

117
Climate change is resulting in, amongst other impacts, increased risk of flooding, higher
temperatures, shortages of water, new and emerging pests and diseases, ocean
acidification, all of which have implications on our natural assets and the services they
provide. Action is essential to both mitigate and adapt to these pressures and impacts.
Our resource use, both renewable and non-renewable, has an impact on our natural
capital and consequently the ecosystems services we gain from that capital. This includes
litter, for example with the high levels of plastics entering the oceans each year. The size
of impacts will also be affected by such pressures as climate change, economic growth
and population increase. It is therefore essential to look towards minimising waste through
reducing, reusing and recycling materials. Although resource efficiency within the UK is
amongst the highest in Europe and that our raw material consumption per unit of GDP
continues to fall, there are opportunities to increase efficiency further.
4.7 Achieving the goals
The Plan sets out six Strategic Themes through which the goals above will be achieved.
There is deliberately not a one to one relationship between objectives and goals, as the
Natural Capital framework seeks to find more integrated, adaptive solutions to achieving
the overall ambitions in the Plan.
Analysing the cost to government and the wider economy of the various policies that will
be employed over the course of the next 25 years is not feasible. Therefore presented
below is a summary of what has been set out to be delivered by the Plan and the
associated benefits. As the Plan moves to implementation, and policy and other
instruments become more specific, each will be subjected to a fuller analysis. This will go
hand in hand with a broader analysis as set out in the sections above of the impacts
across the natural capital system. By doing this, interventions will be designed to achieve
the greatest positive impacts across multiple natural capital assets and benefit flows most
efficiently.
4.7.1 Using and managing land sustainably
The UK has a unique opportunity to change the way in which we manage our agriculture
and timber industries, changing the balance of responsibility to design a system that
delivers the benefits we want to see.
A renewed approach to land management will ensure we can effectively protect our
national heritage. Our historic environment can be protected and enhanced through
effective management and incentivisation.
We will promote and ensure sustainable food and timber production and resilient
agricultural systems that help maintain ecosystems and strengthen capacity for adaptation
to climate change and flooding, in line with our commitments under Sustainable
Development Goal 3.

118
The Plan sets out to deliver:
Net gain
o The approach is already implemented by a growing number of developers
and Local Plans. Increasing uptake and support, for example through the
development of tools will increase consistency in approaches nationally, and
make the process smoother and more beneficial for developers and
environmental stakeholders.
Improve land management
o Diffuse pollution by nutrients, sediment, pesticides and faecal matter from
agriculture is the most widespread cause of poor water quality. These
emissions damage aquatic ecosystems valued by the general public, may
reduce the amenity of local residents and recreational users (including
anglers) and increase the cost to water companies of treating water for
supply to households. Voluntary approaches have not achieved sufficient
participation so the Plan is seeking to introduce new farming rules for water.
Soil and peatland
o Peatlands make up 11% of England’s total land area but over 70% of this is
in drained or poor condition. Peat bogs and fens are important habitats
which deliver benefits for biodiversity, flood management, water quality and
climate regulation with peatlands being our largest terrestrial carbon store.
o Soil degradation costs in England and Wales could be up to £1.4 billion
annually286, with over 55% of those costs due to Greenhouse Gas (GHG)
emissions, 20% from lost agricultural output, and 20% from flooding.
o There is little incentive for farmers and landowners to improve soil health
and restore peatlands beyond that sufficient for their immediate purposes
but this doesn’t take into account the wider benefits to society of further
improvement. The Plan is seeking to improve soil health along with restoring
and protecting our peatlands - this will include developing a soil health index
and ending the use of peat in horticulture.
Increased woodland cover
o There is a commitment to increase afforestation and to protect and manage
existing woodland. Government manifesto commitments to plant 11 million
trees and 1 million urban trees by 2022 are the centre pieces of Defra
forestry policy, which support the long-term aspiration target to reach 12%
woodland cover in England by 2060.
o Support new woodland creation including a new Northern Forest along the
M62 corridor.
286 Graves, A.R., Morris, J., Deeks, L.K., Rickson, R.J., Kibblewhite, M.G., Harris, J.A., Farewell, T.S., and
Truckle, I. (2015) The Total Costs of Soil Degradation in England and Wales. Ecological Economics. 119.
399-413 https://doi.org/10.1016/j.ecolecon.2015.07.026

119
Reduce risk of harm from flooding
o Through the Plan there will be encouragement to embed Natural Flood
Management (NFM) solutions in the appropriate places, and alongside more
traditional defences where needed.
o The Plan will also look to develop and embed property level resilience
practices for existing and new buildings to enable protection from floods or
speedy recovery when flooding does occur by developing a code of practice
which will save society and government spending far more money in
repairing damages from flooding.
o The benefit of providing cost effective localised sustainable drainage
systems (SuDS) include minimising the load on public sewers and mitigating
flood risks in homes. As these benefits are not directly accrued to
developers, the Plan seeks to increase the uptake and quality of SuDS in
new developments through amendments to the Planning Practice Guidance.
The benefits
Net gain
o This proposal will deliver valuable natural capital generally in close proximity
to new development to the benefit of new and existing communities.
o It is expected to support the delivery of housing by clarifying ecological
requirements. Developers that currently use a net gain approach justify their
investment through reported savings in planning approval processes,
including through reduced local opposition, and the improved appeal of the
final development to buyers.
o Anecdotal evidence from local planning authorities who have adopted a net
gain approach suggests that developers appreciate the transparency of the
approach and that the development process can be expedited as a
consequence of the simplified requirements.
Improve land management
o Supporting farmers to use fertilisers efficiently is expected to provide
benefits by avoiding the release of these into the environment and retaining
them where they can benefit plant growth.
o The consultation Impact Assessment 287 on introducing this regulation
indicated that in addition to the environmental benefits there would be an
overall net benefit to affected farm businesses as efficiency gains outweigh
extra administration and slurry storage costs.
287 Water Quality and Agriculture: Basic Measures, Impact Assessment, Defra, 2014,
https://consult.defra.gov.uk/water/rules-for-diffuse-water-pollution-from-
agriculture/supporting_documents/New%20basic%20rules%20Consultation%20Impact%20Assessment.pdf

120
Soil and peatland
o Peatland restoration delivers a number of natural capital benefits. The
primary benefit is climate mitigation (avoided carbon loss), but there are
additional benefits for biodiversity, water quality, soil health, habitat
resilience, carbon sequestration and flood risk, depending on the nature of
the restoration.
o The value for money from peatland restoration varies on a case-by-case
basis. For example, the benefit-cost ratio (BCR) for restoring upland peat
ranges between 0.5:1 and 7:1, depending on the state of peatland to be
restored while restoring an eroding bog has a BCR of 4:1. This does not
capture biodiversity benefits which would increase this further.
o Good soil management will see improvements in food production, water
quality and regulation, climate regulation, habitats and biodiversity as well
as seen as being an integral part of some of our most treasured landscapes,
and archaeological archives linking us to our past.
Increased woodland cover
o Trees sequester carbon, the by-products of active woodland management
offer a renewable energy supply, timber products used in construction and
other sectors lock-up that carbon, and ultimately, waste wood can be burnt
to generate heat and electricity. Also, planting near water courses helps
improve water quality by preventing the run off of the chemicals (from
pesticides and fertilisers) and animal slurry (ammonia) as well as form part
of catchment wide approach to flood risk management and to flood
alleviation in urban centres. All forestry and woodland contributes to
increasing the biodiversity of our environment by providing habitats for a
wide variety of other plant and animal life. In urban settings well-chosen
trees offer shading and cooling and can help to absorb harmful pollutants.
Wood burning is a sustainable way to generate heat compared with fossil
fuels.
o In addition to these environmental benefits, forestry offers social benefits
too. Many people value their local forests and woodlands for their cultural,
aesthetic and heritage value, and the contribution they make to local
identity. Woodland also offers positive health and well-being benefits to
those able to access them, mostly through recreation and exercise. There is
also growing evidence to suggest a range of health and educational
outcomes are improved when services are delivered in woodland
environments, which provide therapeutic benefit to service users.
Reduce risk of harm from flooding
o NFM is not new, but is an approach that is gaining momentum and requires
ongoing testing to fully appreciate impact and policy implications. The
expected BCR for natural flood management and flood resilience is up to

121
4:1288. Whilst this represents good value for money, traditional flood
defences often provide better BCRs. NFM should be implemented alongside
traditional defences where appropriate to maximise value.
o Strong value for money is expected for new development of SuDS with the
benefits of reduced flood damage, reduced operational expenditure on
public sewers, and savings in drainage construction costs expected to
outweigh the costs of future maintenance.
4.7.2 Recovering nature and enhancing the beauty of landscapes
Nature, both on land and in our seas and freshwaters, is extremely important. Our species
and ecological communities are intrinsically valued for their conservation and also
contribute to other benefits such as clean air and water, food, timber and soil. Our rich
data on the species and ecological communities across the UK shows significant loss
over the last 50 years, with land use change and pollution being major drivers. In the
shorter term, we have achieved stable populations in protected areas with high
conservation priority, but species in the wider environment are still declining. We want our
species and habitats to be resilient to a changing climate. We recognise the extent of the
challenge to preserve healthy ecosystems and biodiversity; by supporting new green and
blue infrastructure across the UK we can establish connected ecosystems to work
towards achieving these ends.
Pressures on biodiversity are felt across the world. By protecting and restoring our
ecosystems to halt biodiversity loss we are contributing to significant global efforts in line
with Sustainable Development Goal 15, ‘Protect, restore and promote sustainable use of
terrestrial ecosystems, halt and reverse land degradation and halt biodiversity loss.’
Landscapes, seascapes and coastlines are at the heart of our identity as a nation and we
value them for their cultural and historical significance. Beautiful spaces boost our
wellbeing through the aesthetic value they provide, and support our economy through
tourism.
We want landscapes, coasts and seas to be conserved and enhanced to maximise
appreciation and enjoyment, and to be more resilient in the future. However they are
under ever increasing and competing pressures, for example, from climate change, pests
and diseases, population growth, housing, transport and other urban development.
The Plan sets out to deliver:
Protect and restore nature
o The establishment of a Nature Recovery Network would comprise a suite of
areas for investment in landscape or catchment-scale ecosystem restoration
288 Eftec (2017), Flood Risk Reduction Benefit Valuation for Natural Flood Management - in press. For
Environment Agency

122
to ensure wildlife thrives and to provide a range of other outcomes such as
carbon capture and natural flood management. Each area is likely to have a
core managed primarily for environmental outcomes, within a patchwork of
wider environmental improvements on more productive land. The recovery
network would link, buffer and support existing areas of high wildlife or
landscape value.
o Based on the Law Commission’s recommendations, conservation covenants
would be voluntary agreements that would form a legally binding and long
lasting agreement between landowners and conservation bodies. The
current legal framework does not contain an appropriate tool to facilitate
private conservation efforts, which in turn has resulted in private actors
using workarounds and, consequently, an expected lower level of
conservation effort overall than is economically optimal.
o The Plan will develop an approach for working with communities to support
the reintroduction of native species. This will involve the development of a
code and best practice guidance to help identify key species that would
likely have the greatest benefits for the environment and biodiversity and
help attract potential partners to take forward proposals.
o There will be an improvement in biosecurity to protect and conserve nature,
including animals, trees and other plants, detecting and where feasible
eradicating high priority invasive species while developing plans to reduce
the risk from priority pathways for invasive species introduction into
England, and support schemes to prevent and eradicate endemic diseases
in UK livestock.
Conserve and enhance natural beauty
o Britain’s first national parks were created by an Act of Parliament in 1949
following the government’s 1947 Hobhouse Report, which remains the basis
for most protected landscape designation in England today
o A ‘21st Century Hobhouse’ Review would enable those areas with the most
important natural assets to be identified. A review of existing protected
landscapes would also enable a means to identify opportunities within them.
This could include improvements in how designated areas deliver their
responsibilities, how they are financed and whether there is scope for
expansion.
Using less water and leaving more for nature
o To encourage the efficient use of water by the consumer it is key to realise
that it has a scarcity element to it and that this is not taken into account in
pricing structures and that in some cases neither is the level of
consumption.
o Also historically, government has licensed the abstraction of water from the
environment but in a way which has not been easy to adapt over time to
rising pressures. The rigid current approach has also not allowed allocations

123
to adjust to economically optimal uses. Government therefore has a role to
reform its abstraction licencing regime so it is fit for the future.
The benefits
Protect and restore nature
o The benefits from a Nature Recovery Network include outcomes that can
only be achieved at the landscape scale, for example the restoration of
ecosystem functions such as peat creation or hydrological management.
There is also the substantial additional benefits for some species of wildlife
through increases in area of contiguous habitat, and greater potential for
public engagement via community involvement in design secures greater
public engagement and buy-in.
o The Natural Capital Committee established that there was very strong
evidence of the benefits of investing in creation and restoration of
ecosystems for multiple benefits and found good evidence of BCRs of
around 4:1289 for investment in woodland planting, wetland creation, upland
peatland restoration and intertidal habitat creation. Grassland and heathland
management and restoration also offer substantial value through
contributions to public access and pollination services.
o There are two main benefits provided by the introduction of conservation
covenants, namely the realisation of conservation opportunities and the
reduction in use of ‘workarounds’ to existing legal mechanisms to achieve
conservation objectives. The conservation covenant is a versatile and low
cost legal tool, which is capable of unlocking significant benefits to society.
o The benefits of re-introducing species are broad. For more iconic species
such as lynx and beaver it captures the imagination of the public leading to
wider engagement on wildlife. Measurable environmental benefits also
include the restoration of eco-systems and the natural balance benefiting
the wider environment and biodiversity. For example beavers can increase
water quality and water retention whilst creating suitable habitat benefiting a
number of species. Non-environmental benefits include an increase in the
local economy and job creation in areas where reintroductions have taken
place. This has been in Scotland following the reintroduction of the white
tailed eagle in Scotland. The low cost of producing the code, and the
integration of net benefit principles could liberate significant external funding
for wide scale economic and social benefit. The value for money of
individual applications would have to be determined on a case by basis.
Published studies suggest the overall benefits of beavers far exceeds the
initial cost over a period of 25 years.
289 Natural Capital Committee’s third state of natural capital report - The State of Natural Capital Protecting
and Improving Natural Capital for Prosperity and Wellbeing, 2015,
https://www.gov.uk/government/publications/natural-capital-committees-third-state-of-natural-capital-report

124
o Regarding biosecurity, an example for demonstrating a good BCR is
Japanese knotweed that we did not intervene to eradicate and thus allowed
to spread. It now costs the GB economy £166 million per annum when an
early (and relatively inexpensive) response by government might have
spared this annual cost.
Conserve and enhance natural beauty
o Final benefits could include, for example, avoiding a decline in natural
capital assets and improved recreational benefits.
Using less water and leaving more for nature
o The benefits of improved water efficiency could include lower bills for
consumers and improvements to the environment through lower levels of
abstraction.
o The benefits from more productive allocation of available water to business,
and administrative savings from a more flexible system are expected to be
greater than the administrative costs to establish and run a new water
licensing system with an estimated BCR of at least 8:1290.
4.7.3 Connecting people with the environment to improve health and wellbeing
Engagement with the outdoors brings many benefits to health and well-being and offers
opportunities to raise awareness about the value of nature and the challenges it faces291.
The evidence also shows that increasing the use of green space, even if motivated by
health reasons, provides wider societal benefits such as great community cohesion and
reduced social isolation. There is low awareness amongst the general public and health
professionals of the evidence on the links between the environment and health, both
physical and mental. Targeting policy in this area can also help us to achieve our goals
around increasing equitable access to green space, giving children the opportunity to
engage with nature and supporting health and wellbeing outcomes. Supporting
interventions to encourage volunteering will contribute towards achieving multiple
benefits, for people, plants, wildlife and our natural landscapes.
290 Future Water Resources Management: Reform of the Water Abstraction Regulation System; Impact
Assessment No: DEFRA1365, October 2015,
https://www.gov.uk/government/uploads/system/uploads/attachment_data/file/492418/abstraction-reform-
ia.pdf
291 Evidence Statement on the Links Between Natural Environments and Human Health, Defra, University of
Exeter, and European Centre for Environment and Human Health, 2017,
http://randd.defra.gov.uk/Default.aspx?Menu=Menu&Module=More&Location=None&ProjectID=19511&Fro
mSearch=Y&Publisher=1&SearchText=BE0109&SortString=ProjectCode&SortOrder=Asc&Paging=10#Desc
ription

125
The Plan sets out to deliver:
Helping people access green space
o Currently there is low awareness of the evidence on the links between the
environment and health amongst the general public and health
professionals, possibly affecting individual behaviour which could impact on
wider government outcomes such as public health, as well as decisions at
local and national level regarding public parks and greenspaces.
o The Plan will provide the leadership and direction to drive cross-sector
working between health and environment. It will implement a programme to
promote the use of the natural environment as a resource for good health
and wellbeing including through nature-based social prescribing and the
development of tools for service providers,
Encouraging children to be close to nature
o The Plan outlines a set of initiatives designed to encourage and support
outdoor activities, particularly where a child has no access to a family
garden.
o Nature Friendly Schools will help primary schools in disadvantaged areas
create nature-friendly grounds.
Green towns and cities
o There is growing evidence on the health benefits of access to good quality
green spaces. The benefits include better mental health and wellbeing,
reductions in inflammatory-based diseases and lower mortality. There is
also unequal access to green space across England. Therefore the Plan will
create more green infrastructure to make sure all people are able to achieve
the benefits of spending time in the environment. Improving urban and peri-
urban green infrastructure (specifically urban green space and urban fringe
forests) was highlighted in the Natural Capital Committee’s 3rd Report as a
national priority investment.
Making 2019 a year of action
o Through the Plan the aim is to encourage more action for the environment.
In particular there is a need to improve the offer for young people and
broaden access so that more can give time to improving the environment.
The delivery organisations in the environment sector require a platform to
help them to create a coherent offer together with the youth sector, and
build capacity to manage larger numbers of young volunteers. The
intervention is to call the sector to action to build capacity so that more
young people are giving time to improve the environment which will help
achieve multiple outcomes and potentially significant social and
environmental impact.

126
The benefits
Helping people access green space
o Recent work by Exeter University estimated that “physically active” visits to
the natural environment were associated with an estimated 109,164 Quality
Adjusted Life Years (QALYs) with an annual value of £2.2 billion292. Given
the likely low cost of any intervention to develop a programme aimed at
reducing barriers, particularly around mental health, it is expected that the
BCR to be very positive even if a fraction of the benefit is realised.
o We know that people from lower socio-economic groups are less likely than
those from higher socio-economic groups to visit natural environments, and
yet according to the evidence they stand to gain disproportionately in terms
of health and wellbeing, if they do visit, so the benefits from visits are likely
to be greater than average for the demographic covered by this programme.
Encouraging children to be close to nature
o Generally positive associations have been found concerning the natural
environment and children’s cognitive development293.
o There is a substantial body of evidence which has examined which
interventions are most effective in promoting children and young people’s
physical activity. This evidence has demonstrated that the natural
environment is an important facilitator, setting and determinant of their
activity and that there are a number of intervention approaches which are
effective in increasing use294.
Green towns and cities
o Based on the University of Exeter’s tool Outdoor Recreation Valuation
(ORVal), the BCR from green infrastructure close to where people live can
be expected to be at least 3.5:1 since ORVal only covers recreation. The
corporate natural capital account work for the London borough of Barnet
suggests the BCR is in excess of 10:1295.
292 White, M. P. et al., (2016) Recreational physical activity in natural environments and implications for
health: A population based cross-sectional study in England,
https://ore.exeter.ac.uk/repository/handle/10871/23047
The study valued each QALY at £20,000, which is the threshold used by the National Institute for Health and
Care Excellence by which healthcare interventions are deemed to be cost effective. The full social value of a
QALY used for appraisal purposes is around £60,000 according to published appraisal guidance.
293 Evidence Statement on the links between natural environments and human health, Defra, 2017,
http://randd.defra.gov.uk/Default.aspx?Menu=Menu&Module=More&Location=None&ProjectID=19511&Fro
mSearch=Y&Publisher=1&SearchText=BE0109&SortString=ProjectCode&SortOrder=Asc&Paging=10#Desc
ription
294 Lovell, B. et al (in press) ‘What works’ briefing on natural environment based health interventions
295 London Borough of Barnet: Corporate Natural Capital Account, Eftec and Jon Sheaff & Associates, 2017,
https://www.eftec.co.uk/project/%20%09london-borough-barnet-corporate-natural-capital-account

127
Making 2019 a year of action
o The benefits are expected to include direct environmental improvement by
volunteers, better health and wellbeing for young people spending time in
the natural environment, skills and capacity building for young people,
building better awareness, understanding, and concern for environment in
the next generation and across wider society, and data and insights to
inform future policy intervention.
4.7.4 Increasing resource efficiency and reducing pollution and waste
Cleaning up our industries and our infrastructure will be instrumental in achieving multiple
benefits for the environment and for people. Transport, housing and food production all
have significant impacts on the quality of air and water, climate change, biodiversity, our
engagement with nature and the environment, our protection from hazards and the
components of our landscapes.
Our environment also impacts upon our economic efficiency. Clean air, clean water and
an equable climate are important in supporting human health which has a large impact on
the economy. We know that well designed and delivered regulation is one of many ways
we can enable clean growth.
The Plan sets out to deliver:
Maximising resource efficiency
o The ambition is to make the UK a world leader in terms of resource
efficiency, productivity and competitiveness with the twin objectives to
maximise the value we extract from our natural resource inputs while
minimising the negative environmental impacts associated with their
extraction, use and disposal.
o Reduce the impact of plastic waste on the environment through extending to
small retailers charging for carrier bags which should reduce their usage,
rationalising packaging formats to those that are recyclable and clearly
labelled as such which should increase recycling, exploring the option of
introducing plastic free supermarket aisles, work with Local Authorities,
waste management companies and re-processors to increase the proportion
of plastic packaging that is collected and recycled post-consumer use, and
encourage and support industry efforts to increase ‘on-the-go’ and other
forms of recycling.
o In 2015 waste crime was estimated to cost the English economy over £600
million. Such activities reduce environmental quality, generate expensive
clean-up costs to government, local authorities and private land owners and
a cost to the Exchequer through lost landfill tax revenues. The Plan will seek
to eliminate waste crime.

128
o Further reducing food supply chain emissions and waste. Food waste has a
value of over £17 billion a year and is associated with around 20 million
tonnes of GHG emissions.296
Reduce pollution
o By taking appropriate action the Plan will tackle chemicals in water at source
including carrying on enforcing source control restrictions on harmful
products.
o We will further clean up our recreational waters and provide warnings when
pollution might be a temporary problem. Pollution by waste from point
sources (sewage treatment works and sewage outflows) and diffuse
sources (livestock farms) reduces amenity for recreational users of bathing
waters and beaches, potentially causing illness and indirectly affecting
tourism businesses.
The benefits
Maximising resource efficiency
o Even with no new initiatives, the estimated potential GVA gain for the UK of
at least £4.2 billion for projections to 2030 through increased
remanufacturing, leasing, repair and recycling297 including long-term savings
to local authorities (from reduced waste treatment costs and increased
savings from selling recyclates) or businesses through zero or low-cost
resource productivity improvements with potential savings of £3 billion per
year298. Wider environmental benefits in greenhouse gas emissions
reductions and reduced environmental impact of landfills and energy from
waste.
o Further reducing the use of carrier bags and packaging could deliver added
savings in litter clean-up costs, carbon savings and with likely benefits to
wildlife. Improved recycling of packaging material can increase the value of
secondary materials markets, reduce costs to local authorities and waste
management companies, and deliver carbon emissions reductions. The
option of plastic free aisles where all food is loose could also reduce the
amount of packaging in the first place and might reduce the amount of fresh
fruit and vegetables wasted by householders who would be able to select
296 Estimates of food surplus and waste arising in the UK, WRAP, 2017,
http://www.wrap.org.uk/sites/files/wrap/Estimates_%20in_the_UK_Jan17.pdf
297 Converted from the €4.568 billion value on page 24 from: Extrapolating resource efficient business
models across Europe, WRAP, 2016, http://www.rebus.eu.com/wp-content/uploads/2017/07/Extrapolating-
resource-efficient-business-models-across-Europe.pdf
298 Business Resource Efficiency – Quantification of the no cost/low cost resource efficiency opportunities in
the UK economy in 2014, Oakdene Hollins report to Defra, 2017,
http://www.oakdenehollins.com/media/452/2017_Business_Resource_Efficiency.pdf

129
the amount they need rather than buying bagged amounts and
subsequently not using all of the contents.
o Although there are costs to extracting plastics from incineration and landfill,
adopting a materials focused approach for residual could deliver significant
environmental benefits in terms of GHGs emission savings. There are also
other environmental benefits such as mitigating the significant negative
externalities of landfill sites, which are unpleasant to have for a community,
cause bad smells and can attract vermin, by introducing new approaches to
more quickly stabilise landfills.
o Reducing criminality in the waste management sector will reduce associated
negative externalities and there will be the promotion of legitimate
competition and enhanced related environmental standards.
o Reducing food supply chain emissions and waste should see less food
waste and associated GHGs savings along with savings to local authorities
for having to dispose of less waste.
Reduce pollution
o Chemical contaminants known to be seriously damaging to human or animal
health have largely been banned or subject to other “source control” but
may still be released from legacy products into sewage works. Some
substances have been impossible to detect at low but potentially harmful
concentrations until recently.
o Higher standards within our recreational waters should increase the amenity
for users of bathing waters and beaches.
4.7.5 Securing clean, healthy, productive and biologically diverse seas and oceans
The UK marine area supports our economy through employment, providing sustainable
seafood and raw materials. It gives millions of people a place for leisure and recreation
(e.g. angling, sailing, rock pooling, diving, and wildlife watching) realising the health and
wellbeing benefits of ‘blue space’. If we want these benefits to be available to us and future
generations it is vital that we continue to manage our seas sustainably and to protect and
enhance our marine environment.
We need to understand the true value of the marine environment and incorporate that into
the decisions we take. Understanding marine economic, environmental and social values
can help incentivise behaviours and practices that support stewardship and sustainability.
Using the natural capital approach we can to help protect and manage the marine
environment by being explicit about our choices in relation to the values associated with
our seas and oceans.

130
The Plan sets out to deliver:
We are seeking a system wide recovery of the state of our marine environment to
deliver social, economic and environmental benefits whilst providing greater
resilience from threats such as climate change, pollution and ocean acidification.
Sustainable fishing and thus the long-term survival of the sector through the use of
maximum sustainable yields.
The completion of the network of well-managed marine protected areas in the UK
and Overseas Territories which will provide protection and enhancement of key
species and habitats. There is also the opportunity to include highly mobile species
as part of the network.
The benefits
In relation to impacts of marine pollution, today, at least 8 million tons of plastics leak into
the ocean each year and the cost of marine plastic pollution is estimated to be at least
$4.7 billion per year in the consumer goods industry alone299. Increasing levels of litter in
the world’s seas and oceans is having a major economic and environmental impact.
Marine pollution has a negative impact both on the economies of industries using the
oceans and on the high values of the ocean itself. Fishing, transportation, tourism and
insurance industries suffer along with governments and communities. Marine litter is an
avoidable cost, not only in terms of impacts to the environment and economies but also in
terms of resource losses: plastics are derived from organic products such as cellulose,
coal, natural gas, salt and, of course, crude oil. Reducing the amounts of waste and
preventing litter entering water courses will therefore reduce the economic and
environmental impact, including clean-up costs.
On sustainable fisheries, we will continue with our current commitment of reaching
maximum sustainable yield (MSY) as this ensures we have a sustainably managed fish
stock that provides benefits for future generations. This is necessary for the longevity of
our fisheries because they are a common good; markets are unable to ensure their future
without intervention. Sustainably managed stocks will bring long-term benefits for the
sector as the level of fish they can land will increase and be sustained following the
recovery period.
Economic research into the benefits of recovering fish stocks include New Economics
Foundation300 which estimated rebuilding most commercial EU fish stocks in North Atlantic
waters to their MSY would deliver around 2 million tonnes of additional fish per year,
enough to meet the annual demand of 89.2 million EU citizens.
299 The Business Case for Reducing Ocean Waste, World Business Council for Sustainable Development,
2017, available at: http://www.wbcsd.org/Clusters/Circular-Economy/Roadmap-for-reducing-Ocean-
Waste/Resources/Reducing-Ocean-Waste
300 New Economics Foundation, http://neweconomics.org/2015/03/managing-eu-fisheries-in-the-public-
interest/

131
Hake stocks in the North-East Atlantic are an example of the potential benefits of reaching
MSY on stock sizes (the speed of this recovery would not be the same for all species).In
the period between 1985 and 2004, these stocks were in continual decline due to
overfishing. At the lowest point in 2003, 2,500 tonnes were landed in the UK, at a value of
£6 million at current prices. From 2006, the EU moved towards setting Total Allowable
Catches (the amounts fishermen are allowed to catch) in line with MSY; Hake stocks are
now around 5 times larger, which allows the UK to land 14,000 tonnes of Hake with a
value of £35 million.
A biologically diverse marine environment is of high value to society and there is evidence
that the UK marine environment is subject to a range of significant pressures. Market
failure in the marine environment occurs because no monetary price is attached to it and it
is difficult to allocate property rights to goods and services. Market mechanisms cannot
ensure that actions are fully paid for by users. In such cases individuals do not have an
economic incentive to contribute to secure their continued existence.
According to economic analysis undertaken in 2012, achieving Good Environmental Status
(GES) of the UK seas could deliver estimated benefits of between £5 million to £50 million
over 13 years. This is likely to be an underestimate as it didn’t include benefits such as
improvements to recreational and cultural benefits from improved fish stocks, habitats or
seabird colonies.
In addition, the economic benefits of Marine Protected Areas have been explored301 which
gave an indicative value to divers and anglers of £730 million to £1,310 million for Britain
and for recreation in England of £1.87 to 3.39 billion. These figures don’t include intrinsic
values.
4.7.6 Protecting and improving our global environment
The Plan sets out to deliver:
Provide international leadership
o The UK will take a global lead, setting high expectations for the actions of
developed countries and supporting less developed countries to do the
same. The Climate Change Act we adopted in 2008 was a prime example of
early leadership. The proposal to introduce a total ban, with only limited
number of narrowly-defined exemptions, on UK sales and the import and
export of ivory for sale to and from the UK will put us front and centre of
global efforts to end this trade.
o We have consistently used our membership of international fora to deliver
high-level agreements on key environmental issues. The UK is party to
more than 300 treaties and agreements related to marine and terrestrial
301 Kenter, J.O., Bryce, R., Davies, A., Jobstvogt, N., Watson, V., Ranger, S., Solandt, J.L., Duncan, C.,
Christie, M., Crump, H., Irvine, K.N., Pinard, M., Reed, M.S. (2013). The value of potential marine protected
areas in the UK to divers and sea anglers. UNEP-WCMC, Cambridge, UK.

132
environments, food and agriculture, chemicals and waste, genetic
resources, and plant and animal health, each with an important role in
protecting and improving the natural world. As existing agreements
progress, or become open for renewal, we will leverage all our influence to
secure international commitment to global targets that are even more
ambitious and stretching.
Help developing nations
o The behaviour of developing countries, which will suffer the worst effects of
climate change, is key to improving the global environment. There is a
pressing need for them to reduce their emissions as their economies grow
over coming decades. If we are to protect and improve the global
environment, we must help strengthen their resilience to climate change and
support sustainable development.
o The UK has an important role in supporting developing countries to become
environmental stewards, ideally placed as they are, to protect and improve
their environment for the good of themselves, and of the rest of the world.
We will help show them how they can reduce poverty when they protect the
marine environment and enable sustainable development
Leave a lighter footprint on global environment
o We are committed to maintaining high standards of protection for
consumers, workers, and the environment in our trade agreements.
o We will also take steps to make sure that policies and strategies are
analysed for potential negative environmental effects overseas. In
partnership with industry, we will explore the possibility of developing
additional tools that support businesses to identify sustainable supply
chains. We will also encourage a better uptake of natural capital reporting,
standards and accounting across government and businesses.
The benefits
Each of the actions under this Theme will be assessed in terms of the benefits they will
deliver and the costs of implementing them in order to ensure positive BCRs. Overall the
UK will help protect and improve the global environment by showing international
leadership, supporting developing countries and reducing our own environmental footprint.
4.8 Conclusion
Prioritisation is necessary to ensure we are getting the greatest benefit possible from our
environmental policy. Better prioritisation is possible only with better information. Therefore
improving environmental outcomes will be achieved by improving the evidence base upon
which decisions are made and by creating a more sophisticated and coordinated approach
to prioritising environmental policies.

133
Environmental policy will need to become more coordinated, reflecting the
interconnectedness of many aspects of the environment. This will allow smarter policies to
be chosen than if they were considered in isolation. This will also make environmental
interventions more comparable against interventions in other sectors.
However caution must be exercised to avoid putting too much weight on spurious and
unsubstantiated evidence, and so a pluralistic decision making process should be
adopted, of which economics and valuation play a part. Decision making must combine
economic, scientific, social, cultural, moral, ethical and legal factors.

134
Section 5: Monitoring, evaluation and adaptive management
5.1 Our approach
The vision of the 25 Year Environment Plan is to improve the environment within a
generation. In 25 years’ time we want cleaner air and water, richer habitats for more
wildlife and an approach to agriculture, land use and fisheries that puts the environment
first. We want to create a beautiful and inspiring environment that leaves a rich legacy for
future generations, boosting wellbeing and supporting the economy. To ensure the Plan is
credible and robust, setting a clear direction for action, we need to define what the vision
means, and how progress towards the goals of the Plan will be measured and evaluated.
This section of the Evidence Report sets out a monitoring and evaluation framework for
the Plan designed so that we can track progress towards this overall vision, as well as to
be able to adjust policies and interventions along the way, to adapt to new challenges and
learn from experience of what works. With reference to the conceptual framework (see
Figure 1.1) the key questions that the monitoring and evaluation framework is designed to
address are:
How are the pressures on our natural assets changing?
How well are our interventions working?
Has our natural environment improved?
How have our natural assets and the benefits they provide changed?
We also need to comply with international environmental standards and deliver on our
international commitments. A robust and accessible evidence base will underpin the UK’s
role in international leadership, helping to drive greater ambition and accountability in
protecting the environment globally.
We have a well-developed infrastructure in place for monitoring many aspects of our
environment and providing information as necessary to national and international bodies,
including under current EU Directives and Regulations. Information is gathered through a
wide variety of means by government agencies, academic institutions, voluntary bodies
and increasingly by members of the public through citizen science. Even so there are
some gaps in the types of information collected, for example, in the regular assessment of
soil health, environmental contamination by chemicals, ecosystem functions and societal
benefits. Exit from the EU provides an opportunity to review these systems to ensure that
they are best suited and well designed to meet our national needs and our continuing
international commitments, as well meeting needs for local decision makers and
businesses, scientific enquiry and public interest. New technologies, such as earth

135
observation and DNA analysis, provide opportunities to add to and improve the systems
that we currently use and develop more integrative and synoptic metrics302 (see Box 5.1).
A natural capital framework can help us to systematically identify where there are gaps
and redundancy in available information. For example, Natural England is undertaking a
review of metrics of change in natural capital. The amount and type of natural capital
assets, their condition and location, and people’s attitudes and behaviours, all influence
the benefits provided. The project is identifying attributes to measure change, based on
quantity (e.g. extent of blanket bog), quality (e.g. soil and hydrological properties) and
spatial configuration (e.g. the location of habitats that can help to reduce downstream
flooding). It is also marrying up these attributes with existing data sets to monitor change,
whilst highlighting current gaps in data.
Box 5.1: Innovation in monitoring and mapping – a living nature map
New technologies provide the potential to produce a national map of all our valued habitats
using a unique combination of new satellite data from the Copernicus programme, volunteer
citizen data collection and innovative new analytical approaches. The approach has been
successfully applied to produce high level land cover maps for pioneer areas – the example
shows the map for Cumbria.
Radar and multispectral data available from the Copernicus programme include images from
satellites from revisits five or six days apart. Cloud based computing is used to meet the ‘big
data’ challenges this brings. Good coverage of ‘ground truth’ information collected on the
ground locally is also an essential component of producing accurate maps that capture more
detailed habitat information. The approach brings together the rich source of imagery available
across the country and widespread engagement with local collectors of information on the
environment.
A living nature map provides the underpinning map of natural assets required to embed a
natural capital approach. It provides the evidence to target and monitor delivery of policies and
activities, increases engagement with a large number of people and groups locally and across
the country, and maintaining the map to show changes, provides information that can be used
to check progress towards longer term outcomes.
302 Here we use ‘metrics’ as a general term for measurements related to the management of natural
environment systems. ‘Indicators’ are a particular type of metric which show a statistical trend over time.
‘Performance measures’ are a metric relating to policy interventions and can be quantitative (e.g. number of
trees planted) or more process based (e.g., new scheme introduced, legislation enacted etc.).

136
A living nature map of Cumbria
Source: Natural England
We are already working with the Office of National Statistics to develop natural capital
accounts. National accounts for woodland, freshwater and farmland habitats are now well-
established, with scoping studies and initial accounts developed for most of the other
broad habitats (marine, mountain and moorland, coastal, urban and semi-natural
grassland)303. These accounts are developing standard approaches to measuring the
state of our natural capital and the services we receive from the environment, and track
any changes over time. The accounts have flexibility to be compiled in both physical and
monetary terms because it is not possible to place a monetary value on all the services or
to reflect all changes in condition of assets in monetary values. In principle, accounts can
be compiled at any geographical and economic scale, from UK level down to parcels of
land owned by individual companies, and a wide range of businesses and other
303 Methodology: Natural Capital, Office for National Statistics and Defra,
https://www.ons.gov.uk/economy/nationalaccounts/uksectoraccounts/methodologies/naturalcapital

137
organisations such as Forest Enterprise are already incorporating natural capital values
into their accounting and reporting systems304.
To put a new system of metrics and monitoring in place will require a collaborative effort
over a number of years across government, other public sector bodies, as well as with the
private, voluntary and academic research sectors.
5.2 An integrated monitoring and evaluation framework
An integrated monitoring and evaluation framework will be developed for the 25 Year
Environment Plan including annual progress checks, periodic comprehensive
assessments, policy evaluations, international comparisons and ongoing publication of
data and statistics. The main components are summarised below.
A. Annual progress checks and metrics
Annual performance and progress towards longer term outcomes and goals of the Plan
will be tracked using a combination of performance measures and outcome indicators.
Performance measures will provide information on the actions taken to implement the
policies set out in the Plan. They will focus on progress with delivery over shorter term
milestones. The actions and the associated performance measures should relate in a
clear and well understood way to intended outcomes and benefits through a ‘theory of
change’305. Some actions may contribute to several outcomes (see Box 5.2).
Performance measures for the 25 Year Environment Plan should be built into delivery
plans and evaluation approaches for relevant policy programmes across government.
Outcome indicators will be used to check progress towards the long-term vision of the
Plan. Using a natural capital approach, they will focus on the outcomes and goals that
we have set out to achieve in terms of reducing pressures, improving the state of
assets and increasing the benefits that we get from the environment. The indicators will
be updated when new data are available and will aim to show statistically reliable
trends over time. The evaluation of trends needs to take account of natural variability
in space and time, uncertainty in measurements and frequency of monitoring. Some
attributes change slowly (e.g. soil chemistry), others vary markedly from year-to-year
(e.g. invertebrate populations) and others change daily (e.g. air pollutants). For some
304 Natural Capital Account 2016-2017, Forestry Commission, https://www.forestry.gov.uk/forestry/beeh-
aptcas
305 Theory of change evaluation is a systematic and cumulative study of the links between activities,
outcomes, and context of a policy intervention. It involves the development of an explicit theory of “how” and
“why” a policy might cause an effect which is used to guide the evaluation. It does this by investigating the
causal relationships between inputs, outcomes and impacts in order to understand the combination of factors
that has led to the intended or unintended outcomes and impacts. The Magenta Book, HMT, 2011,
https://www.gov.uk/government/publications/the-magenta-book

138
of the outcomes data are not collected annually. For these reasons it may take several
years before changes can detected and assessed.
Box 5.2: Examples of links between performance measures and outcome indicators
We propose measuring both actions that we take (performance measures) and long-term
progress towards our goals (outcome indicators). This will enable us to check progress
annually within a longer term context, looking across all the goals of the 25 Year Plan.
Understanding how different interventions contribute to a number of outcomes will help us
review their effectiveness and strengthen the synergies between them. Analysing trends and
considering groups of indicators together will provide a more robust assessment of
environmental change.
In some cases we can use existing indicators and associated data collection and
monitoring programmes. We may need to analyse the information in different ways to be
more specific about the types and locations of changes that are important and the changes
in how whole systems are functioning (see Box 5.3). There are known gaps on soil health,
ecosystem functions, human health and wellbeing benefits and overseas impacts of
domestic resource consumption. There are also new opportunities arising from a range of
technological advances in this area including Earth observation, environmental DNA,
citizen science. The metrics will therefore need to be kept under review during the life of
the Plan. Some examples of existing indicators that could be used to track progress in
outcomes and goals of the Plan are presented in Table 5.1.
Other issues to be considered are the different requirements for metrics for decision-
making and management at local levels, the linkage between national and local scales and
the need to take account of international standards and our international reporting
obligations, where relevant.
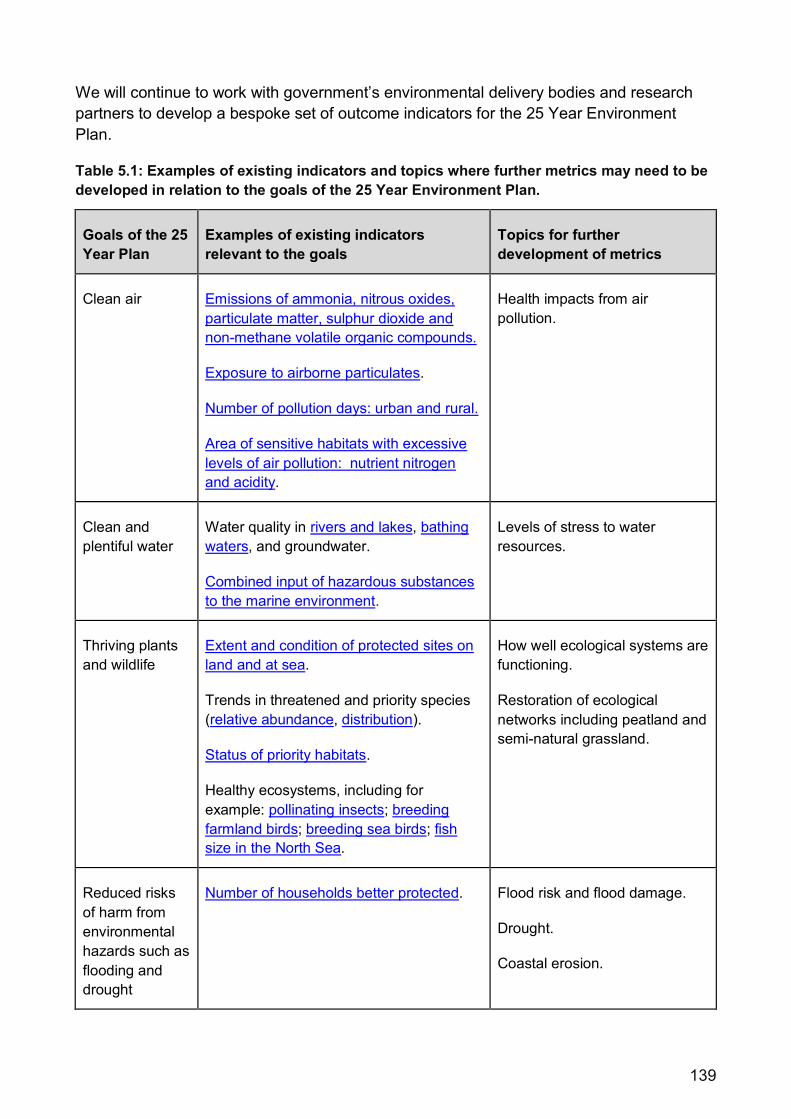
139
We will continue to work with government’s environmental delivery bodies and research
partners to develop a bespoke set of outcome indicators for the 25 Year Environment
Plan.
Table 5.1: Examples of existing indicators and topics where further metrics may need to be
developed in relation to the goals of the 25 Year Environment Plan.
Goals of the 25
Year Plan
Examples of existing indicators
relevant to the goals
Topics for further
development of metrics
Clean air Emissions of ammonia, nitrous oxides,
particulate matter, sulphur dioxide and
non-methane volatile organic compounds.
Exposure to airborne particulates.
Number of pollution days: urban and rural.
Area of sensitive habitats with excessive
levels of air pollution: nutrient nitrogen
and acidity.
Health impacts from air
pollution.
Clean and
plentiful water
Water quality in rivers and lakes, bathing
waters, and groundwater.
Combined input of hazardous substances
to the marine environment.
Levels of stress to water
resources.
Thriving plants
and wildlife
Extent and condition of protected sites on
land and at sea.
Trends in threatened and priority species
(relative abundance, distribution).
Status of priority habitats.
Healthy ecosystems, including for
example: pollinating insects; breeding
farmland birds; breeding sea birds; fish
size in the North Sea.
How well ecological systems are
functioning.
Restoration of ecological
networks including peatland and
semi-natural grassland.
Reduced risks
of harm from
environmental
hazards such as
flooding and
drought
Number of households better protected.
Flood risk and flood damage.
Drought.
Coastal erosion.

140
More
sustainable and
efficient use of
resources
Sustainable management of woodland.
Percentage of wood that grows in English
woods that is harvested.
Fish stocks harvested within safe limits.
UK resource productivity306.
Annual amount of raw materials consumed
in the UK (per capita)307.
Soil health.
Sustainable food production.
Proportion of recycled materials
used.
Enhanced
beauty, heritage
and
engagement
with the natural
environment
Area of broadleaved and coniferous
woodland.
People visiting the natural environment308.
People volunteering for conservation.
Changes in character and
quality of landscapes and
seascapes.
Access to local green space and
high quality natural
environments.
Awareness and concern for
environmental issues and
engagement of young people.
People undertaking pro-
environmental behaviours.
Managing
pressures on
the
environment
Examples of existing indicators
relevant to the goals
Topics for further
development of metrics
Mitigating and
adapting to
climate change
Average annual temperature in central
England.
Greenhouse gas emissions from all
sources.
Removal of greenhouse gases by forests.
A number of adaptation indicators are
reviewed bi-annually by The Climate
Change Committee’s Sub-Committee on
Adaptation.
306 See Figure 4 in the link
307 See Figure 1.10 page 17 in the link
308 See page 20 in the link

141
The UK State of the Climate Report
reports several metrics of climate on an
annual basis.
Minimising
waste
Total waste arising and
proportion of waste going to
landfill.
Carbon footprint of materials
consumed and consumption
relative to gross value added.
Overseas impacts of domestic
resource consumption.
Managing
exposure to
chemicals
Use of polychlorinated biphenyls
(PCBs) and persistent organic
pollutants (POPs), and
emissions of mercury.
Enhancing
biosecurity
Number of tree pests and diseases
established in England in the last 10
years.
Changes in number of established
invasive non-native species.
Disease outbreaks and
damages.
Box 5.3: Developing natural capital metrics
Natural England have undertaken a review of metrics that are suitable for measuring change in
the quantity and quality of natural capital in England and its ability to provide benefits to people.
The project identified a shortlist of potential metrics for a range of natural capital assets and
benefits at a range of scales from local to national. An example is provided below of a shortlist of
metrics that could be used to assess grassland as an asset and its ability to provide pollination
services.
Attributes of grassland related to provision of pollination services:
Hay meadows (extent)
Other semi-natural grasslands (extent)
Soil chemical status (quality)
Plant species diversity (quality)
Linear vegetation features and pockets of semi-natural vegetation (extent, quality and
proximity to insect pollinated crops)
Presence and abundance of pollinator food plants (quality)

142
Abundance and distribution of invertebrate pollinators and seed dispersers (quality)
Source: Natural England
B. Comprehensive state of the environment assessment
The UK National Ecosystem Assessment was completed in 2011 and has been hugely
influential in the development of natural environment policy in England, the devolved
administrations, and internationally, and has been a major stimulus for research. The
assessment was overseen by an independent panel of experts and the authors where
drawn from across the academic, voluntary and practitioner sectors.
A new comprehensive state of the environment assessment will address all three of the
evaluation questions and the interlinkages between pressures, condition of assets and
benefits provided and effectiveness of policy interventions. It will provide an updated
national baseline to inform long-term policy development. It will draw on all available
sources of evidence in addition to information published by government. It will also explore
future scenarios and policy options. The assessment will capture the rapid development of
knowledge and experience of different types of interventions since the National Ecosystem
Assessment. Such a comprehensive assessment depends on the accumulation of new
knowledge and could be undertaken with partners at 10 to 15 year intervals.
C. Policy evaluation and sectoral assessments
Policy evaluations will be undertaken in relation to specific policy interventions and
measures in accordance with HMT guidance309. These will provide early feedback on the
effectiveness of measures undertaken to enable ongoing improvement as well as input to
policy reviews, and cumulative impact evaluation. Policy evaluations will link closely with
the annual progress checks and periodic state of the environment assessment. Other
sector specific reports will be prepared according to statutory and other policy
commitments including, for example: 5-yearly Climate Change Risk Assessments
(CCRAs); and, regular periodic assessments of the state of UK seas under the OSPAR
Convention. Deep dives will be undertaken to better understand the linkages between
pressures, asset status, benefits and policy interventions and associated metrics,
monitoring, data flows and modelling on particular issues. We will develop a clear road
map of these commitments and their inter-dependencies.
D. International reporting and comparative performance
We will honour our commitments to international environmental agreements and will work
with the devolved administrations and Overseas Territories governments to provide timely
information and reports, as necessary. We will endeavour to incorporate these
international requirements and standards into our monitoring and evaluation framework in
order to reduce the additional burden of collecting and analysing information and we will
309 The Magenta Book, HMT, 2011 https://www.gov.uk/government/publications/the-magenta-book

143
work with international partners to simplify and coordinate reporting as far as possible. We
will make sure the information we report internationally is made available in ways that
maximise its accessibility and its value to our citizens. We will continue to engage with
international review and assessment processes and share the approaches we have
developed and the experiences we have gained with the international community. We will
seek to promote comparative analyses of environmental performance, for example, with
the Organisation for Economic Cooperation and Development (OECD). Where
appropriate, we will invite international peer review of our environmental performance and
processes. We will continue to support international assessments such as those
undertaken by the Intergovernmental Platform on Biodiversity and Ecosystem Services
(IPBES) (see Box 5.4).
Box 5.4: Intergovernmental Platform on Biodiversity and Ecosystem Services (IPBES)
The Intergovernmental Platform on Biodiversity and Ecosystem Services is a global scientific
body similar to the Intergovernmental Panel on Climate Change, providing comprehensive,
credible and legitimate scientific knowledge about Earth’s essential life support systems and
their contributions to human well-being; as well as tools and capacity building to help decision
makers identify integrated solutions to pressures on ecosystems, sustainable use of natural
resources and related poverty alleviation. IPBES is funded from voluntary contributions and
currently has 127 member countries.
In 2016, IPBES launched its first two assessments: a methodological assessment for scenario
analysis and modelling of biodiversity and ecosystem services, and a thematic assessment of
pollinators, pollination and food production.
In March 2018, five further assessments will be adopted by the 127 member governments:
Four regional assessments of biodiversity and ecosystem services, covering Africa, the
Americas, Asia-Pacific and Europe and Central Asia; and a thematic assessment on land
degradation and restoration.
The findings of these assessments will provide key input to the comprehensive IPBES global
assessment on biodiversity and ecosystem services, due for release in 2019; the first such
global evaluation since the Millennium Ecosystem Assessment, published in 2015.
The assessment reports will evaluate lessons learned and progress in delivering the
Convention on Biological Diversity’s Strategic Plan (2011–2020) and its Aichi Biodiversity
Targets, the Paris Agreement on climate change, and the implications for the United Nations
Sustainable Development Goals (SDGs), as well as other global environmental agreements.
The reports will also provide vital information for setting global targets for the period after 2020.
The assessments are produced by a regionally balanced, multidisciplinary panel of experts
nominated by governments and other stakeholders. Hundreds of experts are involved as lead
and contributing authors, as well as, in the extensive peer review of the assessments. Each
assessment has a Summary for Policy Makers that is adopted by governments.
For further information visit: https://www.ipbes.net/

144
E. Underpinning data and statistics
We will continue to invest in the systems that we use to collect data on the environment
and people’s engagement with it and, as far as we can, make the data we collect available
externally for others to use. We will continue to look for opportunities to increase the
efficiency with which we collect and access data so that we can provide the widest range
of relevant information to the public and government customers. We will promote an open,
linked data culture that will allow environmental information, regardless of source, to be
interrogated by anyone, anywhere.
We will seek to identify and develop cost-effective ways of collecting or analysing data that
measure the aspects of natural environment that tell us most about the critical aspects of
natural capital and the benefits derived from it and address gaps in existing monitoring
programmes such as soil health. We will develop a more integrated monitoring network for
surface waters targeting the environmental stressors, condition attributes and benefits
which are of most concern. Over time we intend to manage our monitoring and
interventions on the basis of risk rather than impact as this is a smarter, more efficient way
of evidence collection and timely decision making. We will also look to take full advantage
of the range of technological advances in monitoring such as Earth observation, DNA
analysis, mobile applications and data sharing.
We will continue to work with partners through forums such as the UK Environmental
Observation Framework and the UK Marine Monitoring and Assessment Strategy
Community Framework to improve our monitoring systems, coordinate activities and
address gaps.
Alongside partners within government, such as the Office for National Statistics, and with
support from partners outside government, we will continue to publish regular official and
national statistics providing the public with information on the natural environment. We will
adhere to the UK’s Code of Practice for Statistics seeking to ensure that all of the statistics
we produce are trusted and high quality, and meet user needs. We will continue to
collaborate with ONS to establish natural capital accounts for all broad habitats in the UK
by 2020, and will update these on an annual basis thereafter.
5.3 Flexible, adaptive management
Planning responses in the face of uncertainty, as described in Section 1 requires the
adoption of more flexible, adaptive management frameworks that are implemented within
reflexive learning environments and which recognise that mistakes often help to construct
more effective future responses. Knowledge frameworks need to support this adaptive
approach, and lay and local knowledge needs to be adequately recognised as part of this
broader learning environment, especially to get greater involvement of a wide range of
stakeholders in response strategies.
Part of the function of the monitoring and evaluation framework is, therefore, to acquire
evidence from current interventions to inform future interventions. Such knowledge

145
frameworks need to support more flexible, adaptive management. That means collecting
evidence that can be analysed and interpreted in order to identify lessons learnt which can
then in turn feed into and inform future interventions and responses.
Over the period of the 25 Year Environment Plan, as well as retaining a degree of flexibility
and review, it will be necessary to anticipate potential future changes and continuously
adapt, informed by new findings and the best local, national, academic and stakeholder
knowledge.


