24
A guide to a new Geographical Information System for the Chalk of the Thames Basin: The Thames Chalk Information System (TCIS) FutureThames cross-cutting Programme Open Report OR/13/053

A guide to a new Geographical Information System for the Chalk of the Thames Basin: The Thames Chalk Information System (TCIS)
FutureThames cross-cutting Programme
Open Report OR/13/053


BRITISH GEOLOGICAL SURVEY
FUTURETHAMES CROSS-CUTTING PROGRAMME
OPEN REPORT OR/13/053
The National Grid and other Ordnance Survey data © Crown Copyright and database rights 2013. Ordnance Survey Licence No. 100021290.
Keywords
Chalk, Geographical Information System, Stratigraphy, Structure.
Bibliographical reference
WOODS, M A, HASLAM, R B, MEE, K, NEWELL, A J, TERRINGTON, R L. 2013. A guide to a new Geographical Information System for the Chalk of the Thames Basin: The Thames Chalk Information System (TCIS). British Geological Survey Internal Report, OR/13/053. 23pp.
Copyright in materials derived from the British Geological Survey’s work is owned by the Natural Environment Research Council (NERC) and/or the authority that commissioned the work. You may not copy or adapt this publication without first obtaining permission. Contact the BGS Intellectual Property Rights Section, British Geological Survey, Keyworth, e-mail [email protected]. You may quote extracts of a reasonable length without prior permission, provided a full acknowledgement is given of the source of the extract.
Maps and diagrams in this book use topography based on Ordnance Survey mapping.
A guide to a new Geographical Information System for the Chalk of the Thames Basin: The Thames Chalk Information System (TCIS)
M A Woods, R B Haslam, K Mee, A J Newell, R L Terrington
© NERC 2013. All rights reserved Keyworth, Nottingham British Geological Survey 2013

The full range of our publications is available from BGS shops at Nottingham, Edinburgh, London and Cardiff (Welsh publications only) see contact details below or shop online at www.geologyshop.com
The London Information Office also maintains a reference collection of BGS publications, including maps, for consultation.
We publish an annual catalogue of our maps and other publications; this catalogue is available online or from any of the BGS shops.
The British Geological Survey carries out the geological survey of Great Britain and Northern Ireland (the latter as an agency service for the government of Northern Ireland), and of the surrounding continental shelf, as well as basic research projects. It also undertakes programmes of technical aid in geology in developing countries.
The British Geological Survey is a component body of the Natural Environment Research Council.
British Geological Survey offices
BGS Central Enquiries Desk
Tel 0115 936 3143 Fax 0115 936 3276
email [email protected]
Environmental Science Centre, Keyworth, Nottingham NG12 5GG
Tel 0115 936 3241 Fax 0115 936 3488 email [email protected]
Murchison House, West Mains Road, Edinburgh EH9 3LA
Tel 0131 667 1000 Fax 0131 668 2683 email [email protected]
Natural History Museum, Cromwell Road, London SW7 5BD
Tel 020 7589 4090 Fax 020 7584 8270 Tel 020 7942 5344/45 email [email protected]
Columbus House, Greenmeadow Springs, Tongwynlais, Cardiff CF15 7NE
Tel 029 2052 1962 Fax 029 2052 1963
Maclean Building, Crowmarsh Gifford, Wallingford OX10 8BB
Tel 01491 838800 Fax 01491 692345
Geological Survey of Northern Ireland, Colby House, Stranmillis Court, Belfast BT9 5BF
Tel 028 9038 8462 Fax 028 9038 8461
www.bgs.ac.uk/gsni/
Parent Body
Natural Environment Research Council, Polaris House, North Star Avenue, Swindon SN2 1EU
Tel 01793 411500 Fax 01793 411501 www.nerc.ac.uk
Website www.bgs.ac.uk Shop online at www.geologyshop.com
BRITISH GEOLOGICAL SURVEY

OR/13/053; Draft 0.1 Last modified: 2014/01/15 11:42
i
Foreword
This report summarises the key features of a new geographical information system (GIS) resource for the Chalk Group of the Thames Basin, named the Thames Chalk Information System (TCIS). The work was commissioned by the FutureThames project as a means of bringing together disparate data into a single, easily accessible, geographically referenced structure.
Contents
Foreword ......................................................................................................................................... i
Contents ........................................................................................................................................... i
Summary ....................................................................................................................................... iii
1 Introduction ............................................................................................................................ 1
2 GIS construction ..................................................................................................................... 2
3 Description of data themes .................................................................................................... 2
3.1 Chalk Group ................................................................................................................... 2
3.2 Subgroup and Formational data ...................................................................................... 3
3.3 Fault and fold lineaments ............................................................................................... 3
3.4 Chalk stratigraphy interpretations .................................................................................. 4
4 Boreholes ................................................................................................................................. 4
5 Chalk formational Surfaces .................................................................................................. 4
5.1 Source data for surface construction .............................................................................. 5
5.2 Work flow for BoGe data in surface construction .......................................................... 5
5.3 Work flow for formation surface construction ............................................................... 6
5.4 Surface control ................................................................................................................ 7
6 Calculated formational thicknesses ...................................................................................... 8
7 Formational bases .................................................................................................................. 8
7.1 Method ............................................................................................................................ 9
8 Structural Data ..................................................................................................................... 11
9 Chalk Stratigraphy Information ........................................................................................ 12
9.1 Borehole stratigraphy ................................................................................................... 12
9.2 Outcrop sections and boreholes .................................................................................... 13
9.3 Chalk sample localities ................................................................................................. 13
9.4 Lewes Nodular Chalk Formation hardgrounds ............................................................ 13

OR/13/053; Draft 0.1 Last modified: 2014/01/15 11:42
ii
9.5 3D geological models ................................................................................................... 14
10 Data limitations ................................................................................................................. 15
11 Recommendations for future improvements to the TCIS ............................................ 15
References .................................................................................................................................... 16
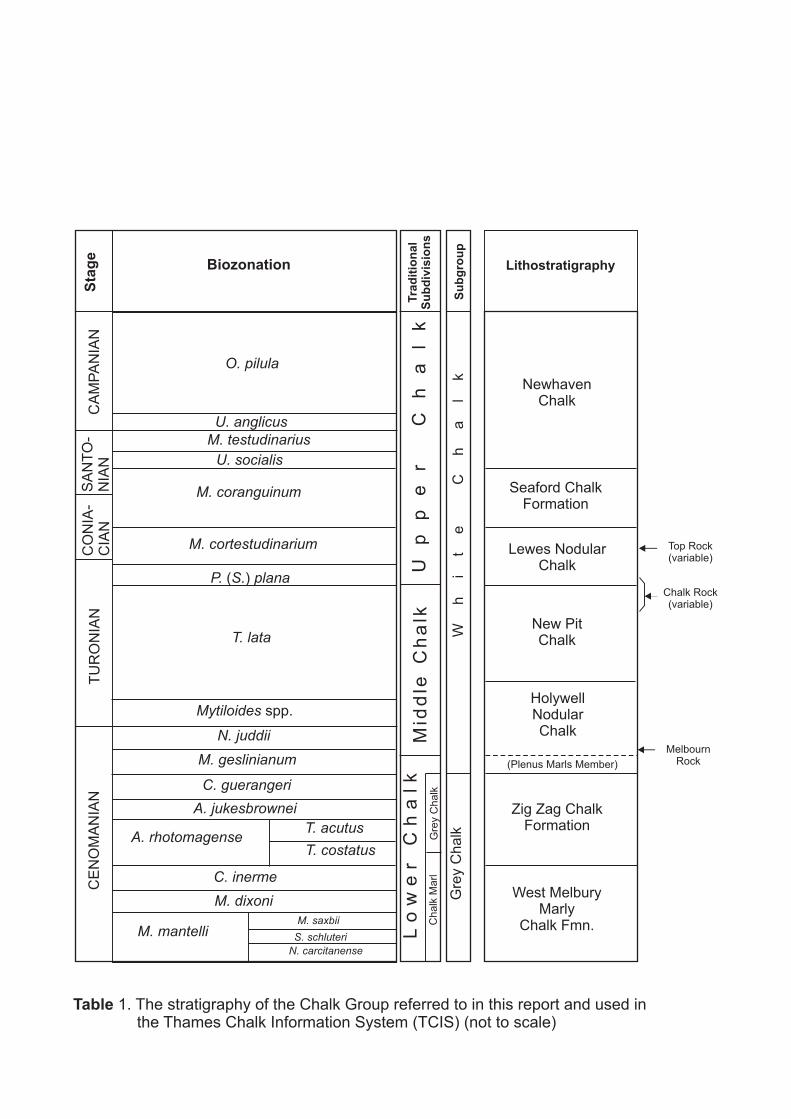
Table 1. The stratigraphy of the Chalk Group referred to in this report and used in the Thames Chalk Information System (TCIS) (not to scale).

OR/13/053; Draft 0.1 Last modified: 2014/01/15 11:42
iii
Summary
BGS work on the Chalk Group of the Thames Basin has amassed large quantities of geological information about thickness, facies, marker-beds, biostratigraphy and structure, only a small part of which is incorporated into the geological map. More recently there has been wider use and interpretation of borehole data to underpin the development of 3D geological models. There is a pressing need to organise these disparate data in a way that can easily be compared and interrogated, as well as to capture the results of relevant published research outside BGS. This project addresses this need by creating a new spatial database, the Thames Chalk Information System (TCIS). The database uses ArcGIS technology to display key information layers about the Chalk. As well as standard topographical and geological information, TCIS includes layers describing: Group, Subgroup, and formational thickness; structural data; detailed stratigraphical data; coverage of 3D geological models that include units or surfaces of the Chalk Group; regions where data coverage limits our understanding of the Chalk. Hydrogeological data is currently being compiled as part of a related project; it is not currently available for incorporation into the TCIS, but will eventually be added. Basic information about the content and methodology used to compile the data in the TCIS is outlined in the main body of this report. Hydrogeological data was delivered through a separate project, and its features are the subject of a separate report. The aim of this report is to provide sufficient background information to allow meaningful use of the TCIS database; there is no new data interpretation.

OR/13/053; Draft 0.1 Last modified: 2014/01/15 11:42
1
1 Introduction
Geological data relating to the Chalk Group of the Thames Basin have expanded dramatically over the last 25 years, particularly since the initiation of new Chalk-focused BGS mapping programmes in the early 1990s. Underpinning the newly-acquired digital geological map data for the Chalk is a wealth of other information, particularly relating to detailed (sub-formation) stratigraphy and regional changes in thickness and facies. In recent years a range of digital 3D geological models have also been developed for the London Basin, leading to new interpretations of regional structure and Chalk basin architecture. Whilst most of these data are held in various corporate archives, there is a need to draw these diverse strands of information together into a single spatially referenced format, allowing easy data comparison and interrogation. This work addresses that need by displaying all these data in a newly developed Arc-GIS format, named Thames Chalk Information System (TCIS). Table 1 summarises the stratigraphy of the Chalk referred to in this report.
In addition to standard topographical and geological map data, the TCIS contains:
1. Depth to top Chalk, depth to base Chalk, and thickness of Chalk Group, displayed as shaded surfaces to emphasise regional trends.
2. Chalk Group, Subgroup and formational thickness information, displayed as greyscale shaded surfaces to emphasise regional trends.
3. Structural information (faults and folds).
4. Chalk stratigraphy information including:
(i) Chalk boreholes with stratigraphy interpretations based (predominantly) on geophysical logs and borehole core. Interpretations are held in the BGS Borehole Geology (BoGe) database.
(ii) Sections and boreholes in the Chalk Group that have been illustrated in publications and BGS reports.
(iii) Chalk sample localities for which information about detailed lithostratigraphy and biostratigraphy is available in publications and reports.
(iv) Distribution of key hardground surfaces developed in the Lewes Nodular Chalk Formation described by Bromley and Gale (1982).
5. Summary of existing 3D geological models of the Chalk of the Thames Basin, and the purpose(s) for which each is best suited.
6. Summary of areas where lack of primary knowledge of the Chalk limits our understanding of its stratigraphy.
7. Hydrogeological data (data delivered as part of a separate project and not discussed further herein).
Information about the assembly and construction of the TCIS is provided in 2 (below), and data relating to each of the above themes (with the exception of hydrogeological data) are briefly discussed in 3 (below), and in greater detail in 4 – 9 (below). Where themes show the distribution of data that require interrogation through secondary sources (e.g. reports, references, corporate databases), information about these is also summarised.
This account does not provide any commentary about the conclusions that may be drawn from analysis of these data.
OR/13/053; Draft 0.1 Last modified: 2014/01/15 11:42
2
2 GIS construction
The Thames Chalk Information System (TCIS) has been created in ArcGIS version 10.0 and can be accessed here:
W:\Teams\SCCP\ThamesBasin\Data\Thames_Chalk_Information_System\GIS\Thames_Chalk_Information_GIS.mxd
For the purposes of the TCIS, each dataset has been clipped to the FutureThames project boundary (formerly the Thames Basin Cross-Cutting Project), with the exception of the fault layers, which have been included if they are within or overlap with the project boundary, but have not been clipped. It is important to emphasise that many of the datasets included in the TCIS extend beyond the FutureThames boundary. A GIS containing the pre-clipped data can be found here:
W:\Teams\SCCP\ThamesBasin\Data\Thames_Chalk_Information_System\GIS\Thames_Chalk_Information_GIS_before_cuts.mxd
The FutureThames project boundary represents the catchment of the River Thames and the Thames Estuary and was defined at the start of the Thames Basin Cross-Cutting Project and hence has been selected as the project boundary for the TCIS.
All of the clipped TCIS layers (shapefiles and raster datasets) can be found in the following geodatabase, for users who wish to incorporate any of the data into their own projects:
W:\Teams\SCCP\ThamesBasin\Data\Thames_Chalk_Information_System\GIS\All_clipped_layers.gdb
ArcGIS layer files (which maintain the symbology created in the TCIS) of all the data within the TCIS, can be found here:
W:\Teams\SCCP\ThamesBasin\Data\Thames_Chalk_Information_System\GIS\Clipped_layer_files
3 Description of data themes
3.1 CHALK GROUP
The following themes appear in the Table of Contents of the TCIS:
□ Top Chalk: Displays extent of Chalk below younger, rockhead-forming strata (predominantly Palaeogene in age).
□ Base Chalk: Displays total extent of Chalk, concealed and unconcealed, within the project area.
□ Boreholes: Displays 3 subsets of boreholes: (i) those proving the contact of Chalk with younger rockhead formations (‘Top Chalk (CK) surface picks (V5)’); (ii) all boreholes that prove the local top of the Chalk Group (‘Top Chalk (CK) all boreholes (V5ii)’; (iii) all boreholes proving the base of the Chalk Group (‘Base Chalk (CK) boreholes (V5)’).
□ Group Surfaces: Shows the top and base of the Chalk group as greyscale surfaces, shaded according to their OD value (pale colour = greater elevation above OD), with maximum (above OD) and minimum (below OD – negative) values indicated. Information about how the Group and the Formational surfaces were created is given below (5).

OR/13/053; Draft 0.1 Last modified: 2014/01/15 11:42
3
□ Surface Control: Top Chalk and Base Chalk. This appears under both the ‘Chalk Group’ and the ‘Subgroup and formational data’ tabs in the GIS Table of Contents. It is a colour coded map of the density of boreholes used to control the calculation of Group, Subgroup and formational surfaces. Areas with a higher density are coloured green, those with lower density in red. The creation of these layers is described in greater detail below (5.4)
□ Thickness (in metres) of the Chalk Group: Displays the thickness of the Chalk Group as a colour-shaded surface (dark colour = greater thickness), with maximum and minimum values indicated. The data are extrapolated for whole project area based on known values from boreholes. The negative thickness values are a spurious feature caused by different levels of data resolution, particularly contrasts between surveyed outcrop margin and modelled formational surfaces (see 10 below).
3.2 SUBGROUP AND FORMATIONAL DATA
□ Outcrop: Displays the concealed and unconcealed (outcrop) extent of each of the named subgroups and formations for which data could be obtained.
□ Borehole distribution: Displays geographical distribution of boreholes that intersect the tops/bases of the named subgroups/formations.
□ Borehole thickness (in metres): Displays geographical distribution of boreholes containing named formations, with thickness ranges in these boreholes indicated by variable symbology (4 below).
□ Formational surfaces: Displays the bases of named formations as greyscale surfaces shaded according to their OD value (in metres; pale colour = greater elevation above OD), with maximum (metres above OD) and minimum (metres below OD – negative) values indicated. Information about how the Formational surfaces were created is given below (5 below).
□ Surface control: As for Group level data above, but shown for each named formation (5.4 below).
□ Formational bases: Displays bases of named formations as surveyed at outcrop within the project area (7 below).
□ Calculated thickness of Chalk formations (in metres): As for Group level data above, displayed as colour-shaded surfaces extrapolated for whole project area based on known values from boreholes. Includes thicknesses of traditional Lower, Middle and Upper Chalk units (6 below).
3.3 FAULT AND FOLD LINEAMENTS
□ Two layers are displayed in the GIS. The first (‘Filtered structures (V1)’), shows all documented records of significant fold and fault lineaments in the project area. The second layer (‘Filtered structures (V10)’) shows only the larger fault lineaments, which in some cases have been linked together on the basis of more detailed structural analysis of marker-horizons and gravity data. See 8 (below) for further details.

OR/13/053; Draft 0.1 Last modified: 2014/01/15 11:42
4
3.4 CHALK STRATIGRAPHY INTERPRETATIONS
□ Displays four layers, summarising details of: geophysical logs and cored boreholes with interpretations listed in BoGe; sections and boreholes illustrated in published media and BGS Technical Reports; chalk localities with stratigraphical details described in BGS Technical Reports; distribution of named hardgrounds forming the Chalk Rock Member in the lower part of the Lewes Nodular Chalk Formation. See 9 below for more details.
4 Boreholes
Formation tops were used as boundary indicators for defining the bases of immediately overlying formation surfaces. These data are shown as OD values listed under T_Depth_OD in the borehole attribute table. For example, the Base_SECK_Top_LECH_V2_0_Boreholes.shp records the Top LECH elevation relative to OD, and equates to the base Seaford Chalk Formation. A borehole dataset was generated for each Chalk formation (excluding combined formations) plus the Top and Base Chalk. An additional dataset was created showing the full borehole stratigraphy for each borehole used to construct the Top Chalk surface (Top_CK_All_Boreholes_V5ii.shp).
Thickness plots for use in GOCAD modelling were generated by identifying matches of boreholes between the different formational borehole datasets. A borehole match between datasets for adjacent formational units indicates that both the top and base of a formation are present in a given borehole, allowing its thickness to be calculated. For example, boreholes containing the Top SECK were matched against those containing Top LECH (equating with Base SECK). For each match in borehole ID, a relevant formational thickness was calculated for that borehole. These thickness values were then used to generate thickness plots for use in constructing formational surfaces.
5 Chalk Formational Surfaces
The following unfaulted formation surfaces have been derived, and are presented in the GIS as theme layers in the Chalk Group tab and the Subgroup and formational data tab:
1. Top Chalk – referred to as Top CK* 2. Base Newhaven Chalk and Base Seaford Chalk combined – referred to as Base NCK SECK* 3. Base Lewes Nodular Chalk – referred to as Base LECH* 4. Base New Pit Chalk – referred to as Base NPCH* 5. Base Holywell Chalk – referred to Base HCK* 6. Base Zig Zag Chalk – referred to Base ZZCH* 7. Base West Melbury Marly Chalk – referred to Base WMCH* 8. Base Chalk – referred to as Base CK*
*in the GIS and model datasets
The Seaford and Newhaven Chalk formations are combined because of sparse data (only 29 boreholes) for the Newhaven Chalk in the Thames Basin.
Each of the surfaces generated have the following naming convention in the relevant datasets:
b_ = Base
t_ = Top

OR/13/053; Draft 0.1 Last modified: 2014/01/15 11:42
5
CK = Chalk
NCK = Newhaven Chalk
SECK = Seaford Chalk
LECH = Lewes Nodular Chalk
NPCH = New Pit Chalk
HCK = Holywell Nodular Chalk
ZZCH = Zig Zag Chalk
WMCH = West Melbury Marly Chalk
‘v1_4’ = relates back to the version of the surface in the GOCAD project.
5.1 SOURCE DATA FOR SURFACE CONSTRUCTION
Source datasets used to construct the formational thickness layers comprise:
NextMap Digital Terrain Model (DTM) at 50 m resolution
RockHead Elevation Model (RHEM) at 50 m resolution
DigMapGB 50k Bedrock
Contours from the Thames Estuary 250k offshore map (Top Chalk only)
Correlation points from the GSI3D models (Top Chalk only) listed below:
o Farringdon Station (Aldiss, 2009) o Lower Lea Valley Model (Royse, 2006 - 2007) o London Lithoframe 50k areas 1 to 14 (Mathers et al., 2005 - 2013) o Southern East Anglia (Colchester and Ipswich models; Mathers, 2004 - 2008) o Thames Gateway Area 5 (Royse et al., 2006 - 2007)
Contours were derived from these correlation points (using Discrete Spatial Interpolation in GOCAD) which were used to constrain the Top Chalk surface. The position of models in the above list shows order of priority for layer construction; highest in list = highest priority and takes precedence over lower priority models where they overlap. The extent of these models is shown on the BGS Geoscience data Index (GDI) models layer.
Corporate borehole database (Borehole Geology – BoGe).
5.2 WORK FLOW FOR BOGE DATA IN SURFACE CONSTRUCTION
The following describes how data from the corporate Borehole Geology (BoGe) database was used in the construction of the GIS.
1. BoGe queried in MS Access for all boreholes with any mention Chalk (‘CHLK’) in the lithology and formation codes. These initial queries excluded combined formations, for example coded LSNCK, because of long processing times. These combined units can be used for future enhancement of formation surfaces (for example addition of faults).
2. Added Single Onshore Borehole Index (SOBI) data. 3. Added pseudo start height to boreholes using NextMap DTM where boreholes did not have a start
height recorded in SOBI. 4. Removed exact duplicates and boreholes not proving formational boundaries. 5. Queried borehole top depth, which is used as the reference for determining formation elevation in
boreholes. Terminal depth (TD) of boreholes is not consistently recorded in BoGe. 6. A point shapefile for each formation was exported which contained only the uppermost elevation
of that formation recorded in a borehole.
OR/13/053; Draft 0.1 Last modified: 2014/01/15 11:42
6
7. The thickness of all Chalk formations in a given borehole was calculated by matching common borehole identifications in the shape files of formations, and subtracting the elevations of adjacent formation-tops, or where the formation is at rockhead, the elevation of rockhead from the elevation of the top of the underlying formation.
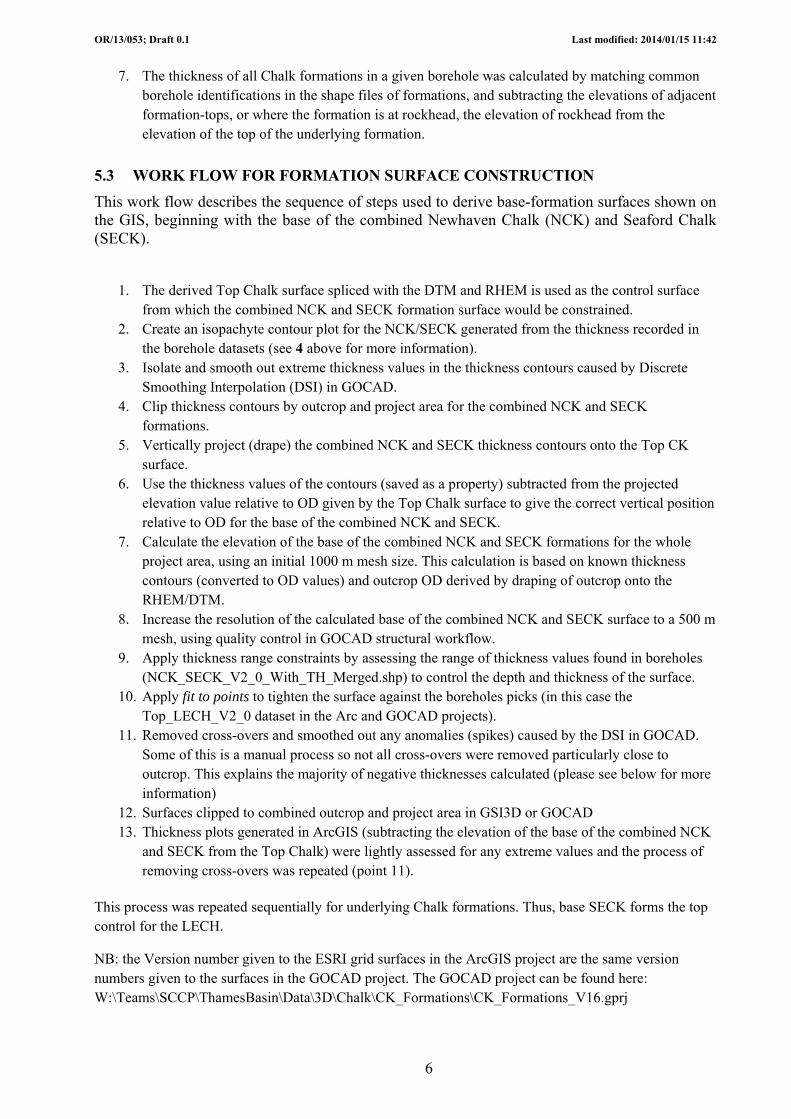
5.3 WORK FLOW FOR FORMATION SURFACE CONSTRUCTION
This work flow describes the sequence of steps used to derive base-formation surfaces shown on the GIS, beginning with the base of the combined Newhaven Chalk (NCK) and Seaford Chalk (SECK).
1. The derived Top Chalk surface spliced with the DTM and RHEM is used as the control surface from which the combined NCK and SECK formation surface would be constrained.
2. Create an isopachyte contour plot for the NCK/SECK generated from the thickness recorded in the borehole datasets (see 4 above for more information).
3. Isolate and smooth out extreme thickness values in the thickness contours caused by Discrete Smoothing Interpolation (DSI) in GOCAD.
4. Clip thickness contours by outcrop and project area for the combined NCK and SECK formations.
5. Vertically project (drape) the combined NCK and SECK thickness contours onto the Top CK surface.
6. Use the thickness values of the contours (saved as a property) subtracted from the projected elevation value relative to OD given by the Top Chalk surface to give the correct vertical position relative to OD for the base of the combined NCK and SECK.
7. Calculate the elevation of the base of the combined NCK and SECK formations for the whole project area, using an initial 1000 m mesh size. This calculation is based on known thickness contours (converted to OD values) and outcrop OD derived by draping of outcrop onto the RHEM/DTM.
8. Increase the resolution of the calculated base of the combined NCK and SECK surface to a 500 m mesh, using quality control in GOCAD structural workflow.
9. Apply thickness range constraints by assessing the range of thickness values found in boreholes (NCK_SECK_V2_0_With_TH_Merged.shp) to control the depth and thickness of the surface.
10. Apply fit to points to tighten the surface against the boreholes picks (in this case the Top_LECH_V2_0 dataset in the Arc and GOCAD projects).
11. Removed cross-overs and smoothed out any anomalies (spikes) caused by the DSI in GOCAD. Some of this is a manual process so not all cross-overs were removed particularly close to outcrop. This explains the majority of negative thicknesses calculated (please see below for more information)
12. Surfaces clipped to combined outcrop and project area in GSI3D or GOCAD 13. Thickness plots generated in ArcGIS (subtracting the elevation of the base of the combined NCK
and SECK from the Top Chalk) were lightly assessed for any extreme values and the process of removing cross-overs was repeated (point 11).
This process was repeated sequentially for underlying Chalk formations. Thus, base SECK forms the top control for the LECH.
NB: the Version number given to the ESRI grid surfaces in the ArcGIS project are the same version numbers given to the surfaces in the GOCAD project. The GOCAD project can be found here: W:\Teams\SCCP\ThamesBasin\Data\3D\Chalk\CK_Formations\CK_Formations_V16.gprj

OR/13/053; Draft 0.1 Last modified: 2014/01/15 11:42
7
5.4 SURFACE CONTROL
For each of the surfaces generated, a borehole control multi-buffer extent was created to show areas in which there was a higher density of boreholes and hence greater borehole control, and those areas that had fewer boreholes controlling the surface. The following categories were generated:
Borehole Control Distance (metres) Key
Very High 0 ‐200
High 200 – 500
Medium 500 ‐1000
Low 1000 – 2000
Very Low 2000 – 5000
Null (little or no borehole control)
Over 5000
This multi-buffer density distribution plot does not take into account any faulting or folding, so should be used with caution. The distances used are arbitrary and can be refined if necessary. The following datasets were generated:
1. Top_CK_BH_Control 2. Base_SECK_BH_Control 3. Base_LECH_BH_Control

OR/13/053; Draft 0.1 Last modified: 2014/01/15 11:42
8
4. Base_NPCH_BH_Control 5. Base_HCK_BH_Control 6. Base_ZZCH_BH_Control 7. Base_CK_BH_Control
The following layer file should be used to visualise the Surface Control layers:
W:\Teams\SCCP\ThamesBasin\Data\3D\Chalk\CK_Formations\CONFIDENCE\SURFACE CONTROL.lyr
6 Calculated formational thicknesses
Based on the calculated formational surfaces shown on the GIS, the following thickness ranges were calculated for each formation:
1. Chalk (generally 0 m to 307 m excluding extreme outliers) 2. NCK and SECK combined thickness (generally 0 m to 150 m excluding extreme outliers) 3. LECH (generally 0 m to 65 m excluding extreme outliers) 4. NPCH (generally 0 m to 80 m excluding extreme outliers) 5. HCK (generally 0 m to 50 m excluding extreme outliers) 6. ZZCH (generally 0 m to 60 m excluding extreme outliers) 7. WMCH (generally 0 m to 30 m excluding extreme outliers) 8. White Chalk (generally 0 m to 240 m excluding extreme outliers) 9. Grey Chalk (generally 0 m to 80 m excluding extreme outliers) 10. Upper Chalk (generally 0 m to 160 m excluding extreme outliers) 11. Middle Chalk (generally 0 m to 115m excluding extreme outliers)
Please use the following layer file to visualise these thickness plots:
W:\Teams\SCCP\ThamesBasin\Data\3D\Chalk\CK_Formations\CHALK_FORMATION_THICKNESSES\CHALK THICKNESSES.lyr
7 Formational bases
The gb_50_bedrock layer is a polygon shapefile which includes formation bases and tops, in addition to many non-geological boundaries between maps of different generations and various combinations of formations. An example of the resulting patchwork of polygons is shown below.

OR/13/053; Draft 0.1 Last modified: 2014/01/15 11:42
9
For example, the base Lewes Chalk is included in five different combinations of single or undifferentiated formations is shown below:
For modelling purposes we require only true stratigraphic contacts as polylines (which can be attributed with an elevation value) along formation bases (or formation tops), an example of the desired output which has been processed from the gb_50_bedrock map above is shown below. All non-geological contacts have been removed and gb_50_bedrock polygons have been processed into polylines along formation bases (or tops).
7.1 METHOD
1. Polygons from gb_50_bedrock were extracted using GP_EQ_D = “CHALK GROUP”.
2. Polygons from the output above were dissolved on LEX_D to remove sheet boundaries and create 36 multipart features for Chalk Formations.
3. Polygons were converted to a polyline feature class selecting the option to identify and store polygon neighbouring information.

OR/13/053; Draft 0.1 Last modified: 2014/01/15 11:42
10
This generated a polyline shapefile with 142 features representing boundaries between different lithostratigraphical units (single or multiple undifferentiated features) or non-geological features.
These were manually sorted and selected to provide true stratigraphic contacts for the Chalk Formations shown below:

OR/13/053; Draft 0.1 Last modified: 2014/01/15 11:42
11
Polyline shapefiles were imported to SKUA (Subsurface Knowledge Unified Approach; a 3D modelling package that uses 'stratigraphical rules' to import and integrate a wide variety of 3D data) and given a Z-attribution using the BGS bald earth digital terrain model.
The Z-attributed linework is shown above with Chalk Group cross-section picks from the NGM GB model. The two datasets can be used to generate a preliminary Chalk structural model.
8 Structural Data
The following shapefiles have been created and added to the Thames Chalk Information System:
1. All Structural data 2. Revised/synthesised fault network

OR/13/053; Draft 0.1 Last modified: 2014/01/15 11:42
12
The source data for the creation of these files are published papers and BGS reports, 3D models and maps. Much of these data are summarised by Haslam (in prep.), which also provides a list of reference sources for individual structures recognised in the project area.
The first layer ('Filtered structures (V1)') contains all the data available at the time of compilation including known structures in the deeper bedrock where no data is available for the Chalk. The lineaments represent either faults or the axial plane traces of folds. The category of each structure is revealed in the ‘Identify’ window when specific lineaments are interrogated in the GIS. No additional interpretation of the extent of lineaments is made in this layer.
The second layer ('Filtered structures V10') represents both a simplification and an interpretation of the first layer, focussing on the larger faults within in the Chalk; it comprises the known distribution of the larger faults seen in the first layer, and their inferred lateral extent based on further structural analysis. Simplification involved removal of duplicate faults, and faults smaller than approximately 2 km. Interpretation involved the linking and extension of the remaining larger fault structures. The methodology for analysing the behaviour of structures used colour-coded depth surfaces for the Top and Base Chalk, as well as borehole markers colour-coded for depth. Combining these data allowed correction for inconsistencies produced by incorrect or apparently incorrect borehole tops, and changes to lithostratigraphical surfaces that are not related to the constraining borehole data. Colour scales on the surfaces were varied to highlight as many changes within the surface as possible, especially in areas where the surface appears uniform due to censoring of the data by a particular colouring methodology. This is particularly important near surface boundaries and in deep sections. Modification of the depth-coded colour range for lithostratigraphical surfaces also allowed identification of structures in apparently uniform parts of surfaces, otherwise masked because the scale of the structures is below the threshold variation of the selected colour-scale.
Finally, to consolidate the lateral correlation of fault lineaments, the 1st vertical derived Bouguer anomaly gravity surface was modelled to the base of the Mesozoic succession. The Bouguer anomaly surface shows clear linear trends which match with published faults, allowing its use as a robust guide for projection of faults into areas with little to no data.
9 Chalk Stratigraphy Information
Chalk Group stratigraphy information in the TCIS comprises: boreholes with interpretations of Chalk Group stratigraphy held in the Borehole Geology (BoGE) database; distribution and bibliographic reference source of illustrated outcrop sections and boreholes; Chalk localities that have descriptions of detailed lithostratigraphy and biostratigraphy in publications and reports; distribution of key hardground units described by Bromley and Gale (1982) in the Lewes Nodular Chalk Formation.
9.1 BOREHOLE STRATIGRAPHY
Borehole stratigraphy information is contained in the ‘Geophysical logs and cored boreholes layer’, and comprises 333 data points. The layer shows the distribution of boreholes for which reliable Chalk stratigraphical interpretations exist in the BGS Borehole Geology (BoGe) database. Details of the SOBI index number for the relevant borehole are accessed by interrogation of data points with the Arc information tool. The SOBI index number can be used to search and view interpretations in BoGe. Access to BoGe requires an Oracle ID and interpreter code arranged through SNS and Ken Lawrie (Murchison House, BGS Edinburgh). Where interpretations are based on geophysical logs, access to the primary log data is either through RECALL (corporate archive for digital log data; information from Sandy Henderson, Murchison House, BGS Edinburgh) or the Intranet Data Access (IDA) at http://bgsintranet/scripts/ida/menus/Geophys_data_menu.cfm for non-digital data. In both cases,

OR/13/053; Draft 0.1 Last modified: 2014/01/15 11:42
13
the SOBI number is the search key for accessing data for individual boreholes. These borehole interpretations provide primary control points for many of the 3D models of the Chalk in the Thames Basin. Assigned numerical values for each formation-base in BoGe indicate relative interpretation confidence.
9.2 OUTCROP SECTIONS AND BOREHOLES
A wide range of publications, particularly BGS technical reports, illustrate outcrop sections and cored boreholes in the Chalk Group of the London Basin. This information is contained in the ‘Illustrated sections and boreholes’ layer, comprising 217 data points. These sections contain a wealth of data that is not captured by the geological map, such as the relative development of lithological features, biozonal data, and the presence of named marker beds that are of value for long-range correlation. Interrogation of individual data points with the Arc information tool reveals the source publication for accessing the illustrated information at the data-point location. Cited non-BGS publications are available through the BGS library. Access to BGS technical reports is through paper archives held in NGRC (National Geoscience Records Centre) or scanned archives. BGS library and NGRC staff can provide information about access to digital and hardcopy report collections. Digital availability of reports is incomplete because many were originally classified as restricted, and only title pages were available for archive by the BGS library.
9.3 CHALK SAMPLE LOCALITIES
In the course of geological mapping, BGS has amassed vast biostratigraphical collections for the Chalk Group. The purpose of the collections is to provide control and evidence for the geological boundaries depicted on published maps. In many cases biostratigraphical data allows classification of the Chalk at a level of greater refinement than shown on geological maps, and can also provide information about the likely development of marker-beds that are important for long-range correlation. Data for macro-fossil sample sites in the London Basin is given in the ‘Chalk localities (biostratigraphy/lithostratigraphy)’ layer, and comprises 775 data points. BGS also has data for micro-fossil collections from the Chalk, but time constraints prevented inclusion of these in the data compilation.
Interrogation of individual data points using the Arc information tool reveals the source reference providing detailed information about Chalk stratigraphy at the data point location. Many of these reports are BGS technical reports spanning the last 20 years. These reports include re-evaluations of older, historical collections of macrofossils as well as material collected since the 1990s. Access to BGS technical reports is through paper archives held in NGRC or scanned archives. BGS library and NGRC staff can provide information about access to digital and hardcopy report collections. Digital availability of reports is incomplete because many were originally classified as restricted, and only title pages were available for archive by the BGS library.
9.4 LEWES NODULAR CHALK FORMATION HARDGROUNDS
Work by Bromley and Gale (1982) described the stratigraphical and spatial development of hardgrounds in strata equivalent to the lower and middle parts of the Lewes Nodular Chalk Formation. Traditionally, these hardgrounds have been grouped into those forming the ‘Chalk Rock’ and those forming the ‘Top Rock’. Bromley and Gale (1982) showed that three suites of hardgrounds (Lower, Middle and Upper Suite) comprise the ‘Chalk Rock’ (= Chalk Rock Member of current BGS terminology; Hopson, 2005), and that the development of these suites of hardgrounds is laterally variable. Stratigraphical details of the hardgrounds and their correlation are provided by Bromley and Gale (1982). The significance of these hardgrounds is that they affect the continuity of the preserved stratigraphy, so lateral variability in the development of hardgrounds occupying different stratigraphical horizons results in significant lateral changes in

OR/13/053; Draft 0.1 Last modified: 2014/01/15 11:42
14
the character of the preserved Lewes Nodular Chalk succession. The spatial extent of the individual suites of hardgrounds is shown in three layers: ‘Lower Hardground Suite’, ‘Middle Hardground Suite’, and ‘Upper Hardground Suite’. Sites where Bromley and Gale (1982) identified hardgrounds comprising the ‘Top Rock’ (= Top Rock Bed of current BGS terminology; Hopson, 2005) are shown by the ‘Top Rock’ layer. The Top Rock Bed appears to have a more restricted spatial development than the Chalk Rock Member, and this may be significantly related to features of basin architecture.
9.5 3D GEOLOGICAL MODELS
The TCIS includes a layer showing the extent of 3D geological models covering parts of the Thames Basin. The key models are as follows:
o Farringdon Station
Author: Aldiss, D T Date: 2009 Key Reference: Aldiss et al. (2012) Limitation: Covers a small geographical area (4Km2)
o Lower Lea Valley Model Author: Royse, K. Date: 2006 – 2007 Key Reference: Royse et al. (2006) Limitation: Focussed primarily on the Quaternary and Lambeth Group strata. Still to be approved.
o London Lithoframe 50k areas 1 to 14 Authors: Mathers, S J, Burke, H, Thopre, S, Ford, J, Cripps, C, Terrington, R. Date: 2005 to 2013 Reference: Ford et al. (2008). Limitation: Modelled at 1:50 000 scale. Many boreholes considered but not all used for the modelling so may miss some key boreholes that prove the top of the Chalk. Some areas, lacking borehole coverage, infer top Chalk using thickness and local knowledge provided by memoirs and map sheets.
o Southern East Anglia (Colchester and Ipswich models) Author: Mathers, S J. Date: 2004 to 2008 References: Mathers, S J. (2012a, b) Limitations: Modelled at 1:50 000 scale. Many boreholes considered but not all used for the modelling so may miss some key boreholes that prove the top of the Chalk. Some areas, lacking borehole coverage, infer top Chalk using thickness and local knowledge provided by memoirs and map sheets.
o Thames Gateway Area 5 Author: Royse, K. Date: 2007 Reference: Royse et al. (2008) Limitations: Modelled at 1:50 000 scale. Many boreholes considered but not all used for the modelling so may miss some key boreholes that prove the top of the Chalk. Some areas, lacking borehole coverage, infer top Chalk using thickness and local knowledge

OR/13/053; Draft 0.1 Last modified: 2014/01/15 11:42
15
provided by memoirs and map sheets.Will soon to be superceded by the London LithoFrame 50k modelling.
10 Data limitations
• Some minor negative thickness values near the outcrop margin of the Chalk result from contrasts between the high-resolution survey data available for controlling the Top Chalk surface compared to the more generalised data used to generate formational surfaces. These negative values have been manually edited out as far as practicable. Negative thickness values are also generated by erroneous cross-over (i.e. intersection) of calculated formational surfaces close to the outcrop margin of formations; these have been reduced but not entirely eliminated (5.3, bullet 11, above).
• When gridding the formational surfaces, some detail has been lost where formation outcrops were constrained at a resolution of 50 m, but modelled at a mesh resolution of 500 m. Some cross-over of formational surfaces may occur in these areas.
• A number of borehole checks have been performed on the Top and Base Chalk datasets to remove duplicates, check start heights and query Top Chalk and Base Chalk levels. These procedures were not repeated at formation level.
11 Recommendations for future improvements to the TCIS
Further refine formation surfaces by addition of faults.
Thickness data are based on true formational thickness values, using boreholes containing formational contacts. It would be useful to incorporate all boreholes that proved a minimum thickness of a chalk formation to ensure that the surfaces are constrained by these depths.
Incorporate data from boreholes where Chalk formations have been coded as combined units, for example, LSNCK (= Lewes Nodular, Seaford and Newhaven Chalk). Location of these additional data: W:\Teams\SCCP\ThamesBasin\Data\3D\Chalk\CK_Formations\ADDITIONAL_DATA
The Borehole Control layer can be further enhanced by scoring the buffers (e.g. 5 = Very High and 1 = Very Low, as used in Geosure and SuDS) and then appropriately adjusting the buffer scores where they overlap.

OR/13/053; Draft 0.1 Last modified: 2014/01/15 11:42
16
References
British Geological Survey holds most of the references listed below, and copies may be obtained via the library service subject to copyright legislation (contact [email protected] for details). The library catalogue is available at: http://geolib.bgs.ac.uk.
ALDISS, D T, BLACK, M G, ENTWISLE, D C, PAGE, D P, AND TERRINGTON, R L. 2012 Benefits of a 3D geological model for major tunnelling works: an example from Farringdon, east-central London, UK. Quarterly Journal of Engineering Geology and Hydrogeology, Vol. 45 (4). 405 – 414.
BROMLEY, R G, and GALE, A S. 1982. The Lithostratigraphy of the English Chalk Rock. Cretaceous Research, Vol. 3, 273 – 306.
FORD, J, BURKE, H, ROYSE, K, and MATHERS, S J. 2008. The 3D geology of London and the Thames Gateway : a modern approach to geological surveying and its relevance in the urban environment. Cities and their underground environment : 2nd European conference of International Association of engineering geology : Euroengeo 2008. Madrid, Spain.
HASLAM, R. in prep. (Summary report of key structures affecting the Chalk of southern England).
HOPSON, P M. 2005. A stratigraphical framework for the Upper Cretaceous Chalk of England and Scotland with statements on the Chalk of Northern Ireland and the UK Offshore Sector. British Geological Survey Research Report RR/05/01.
MATHERS, S J. 2012a Model metadata summary report for the Ipswich-Sudbury LithoFrame 10-50 model. British Geological Survey Open Report, OR/12/080.
MATHERS, S J. 2012b Model metadata summary report for the Colchester LithoFrame 10-50 model. British Geological Survey Open Report, OR/13/001.
ROYSE, K, ENTWISLE, D, PRICE, S, TERRINGTON, R, and VENUS, J. 2006. Gateway to Olympic success. Geoscientist, Vol. 16, 4 – 10.
ROYSE, K, REEVES, H, AND GIBSON, A. 2008. The modelling and visualisation of digital geoscientific data as an aid to land-use planning in the urban environment, an example from the Thames Gateway. 89-106 in Communicating environmental geoscience. LIVERMAN, D G E, PEREIRA, C, and MARKER, B (editors). Special Publication of the Geological Society, London, Vol. 305.
Newhaven Chalk
Seaford Chalk Formation
Lewes Nodular Chalk
New Pit Chalk
Holywell Nodular Chalk
Zig Zag Chalk Formation
O. pilula
U. socialis
M. testudinariusU. anglicus
M. coranguinum
M. cortestudinarium
P. (S.) plana
T. lata
Mytiloides spp.
N. juddii
M. geslinianum
C. guerangeri
A. jukesbrownei
A. rhotomagenseT. acutus
T. costatus
C. inerme
M. dixoni
M. mantelliM. saxbii
S. schluteri
N. carcitanense
LithostratigraphyBiozonation
CA
MP
AN
IAN
SA
NT
O-
NIA
NC
ON
IA-
CIA
NT
UR
ON
IAN
CE
NO
MA
NIA
NS
tag
e
Table 1. The stratigraphy of the Chalk Group referred to in this report and used in the Thames Chalk Information System (TCIS) (not to scale)
West Melbury Marly
Chalk Fmn.
(Plenus Marls Member)
Su
bg
rou
pG
rey
Chalk
Wh
it
e
Ch
al
k
Tra
dit
ion
al
Su
bd
ivis
ion
sU
pp
er
C
ha
lk
Mid
dle
Ch
alk
Lo
we
r
Ch
alk
Gre
y C
halk
Chalk
Marl
Melbourn Rock
Chalk Rock (variable)
Top Rock (variable)


![Deep Borehole Field Test Laboratory and Borehole Testing ... · The characterization borehole (CB) is the smaller-diameter borehole (i.e., 21.6 cm [8.5”] diameter at total depth),](https://static.documents.pub/doc/80x56/5ebe68817151f10bcd35645a/deep-borehole-field-test-laboratory-and-borehole-testing-the-characterization.jpg)


