A Guide to Representational Similarity Analysis forSocial NeuroscienceHaroon Popal,1 Yin Wang,2 and Ingrid R. Olson1,∗1Department of Psychology, Temple University, Philadelphia, PA 19122, and 2Beijing Normal University∗Correspondence should be addressed to Ingrid R Olson, Department of Psychology, Temple University, Philadelphia, PA 19122, USA.E-mail: [email protected]
Abstract
Representational similarity analysis (RSA) is a computational technique that uses pairwise comparisons of stimuli to revealtheir representation in higher-order space. In the context of neuroimaging, mass-univariate analyses and other multivariateanalyses can provide information on what and where information is represented but have limitations in their ability toaddress how information is represented. Social neuroscience is a field that can particularly benefit from incorporating RSAtechniques to explore hypotheses regarding the representation of multidimensional data, how representations can predictbehavior, how representations differ between groups and how multimodal data can be compared to inform theories. Thegoal of this paper is to provide a practical as well as theoretical guide to implementing RSA in social neuroscience studies.
IntroductionNeuroimaging has allowed social neuroscientists unprece-dented access to the neurobiological basis of social behavior. Formany years, the neuroimaging literature in social neurosciencewas dominated by studies using mass-univariate statisticaltechniques. After some time, this was partially supplantedby multivariate techniques, one of which is the focus of thispaper: representational similarity analysis (RSA). Although RSAis over a decade old, its adoption in social neuroscience has beenlimited. The goal of this paper is to provide an easy guide to RSAwith an emphasis on how it can be used in social neuroscienceto test hypotheses and inform theory.
It is already known that mass-univariate neuroimaging tech-niques are limited in their ability to analyze multidimensionalinformation. Mass-univariate methods in functional magneticresonance imaging (fMRI) are typically used to compare theneural activation of one group of stimuli to the neural activationof another group of stimuli, by creating a contrast that averagesthe response of stimuli within a group. For example, if one
wants to study the neural representation of social status, themass-univariate contrast will show us regions of the brain thatrespond more strongly to high social status by subtracting theneural activation for low status faces from the activation forhigh status faces (Chiao et al., 2009). However, this only tells us alittle bit about the neural processing of social status, as relyingon an overall response magnitude across voxels in a regionprovides limited information. A brain region may have a minimaloverall, but consistent, response to low status faces, that isovershadowed by a much larger overall response to high statusfaces (Haxby, 2012). We are unable to determine, for instance,if brain regions that respond more strongly for one categorymight also have some sensitivity to information from anothercategory (Haxby, 2012). We also do not know if regions representinformation about both categories, but in different ways, thatthe task did not account for (e.g. attention, motivation). In addi-tion, some functionally heterogeneous areas can be commonlyactivated by multiple tasks and we cannot determine whetherthe activated brain region is specialized for information integra-tion (e.g. for instance, the anterior temporal lobe [ATL] appears
Dow
nloaded from https://academ
ic.oup.com/scan/advance-article-abstract/doi/10.1093/scan/nsz099/5693905 by Tem
2 Social Cognitive and Affective Neuroscience, 2020, Vol. 00, No. 00
to integrate social, semantic and emotional processing; Olsonet al., 2007), whether it represents the same information butalong different dimensional spaces (e.g. self-relatedness andpositivity are co-represented in medial prefrontal cortex [MPFC];Chavez et al., 2017) or perhaps there is just a lack of spatialresolution to disentangle specialized sub-neural clusters (e.g.social and physical pain are represented next to each otherbut separately in anterior cingulate cortex [ACC]; Woo et al.,2014). Lastly, when multiple neural regions respond to the samecategory, we cannot differentiate the functional specificity ofthese regions. With univariate approaches, there is no infor-mation about what is specifically represented in the activatedregions or how information is architecturally represented, andthis is partially due to the loss of information caused by signalaveraging across many voxels (Norman et al., 2006).
To address some of these limitations, multivariate analyseshave been introduced (Haxby et al., 2001; Lewis-Peacock andNorman, 2014). Multivariate pattern analysis (MVPA) focuses onwhether information relating to specific stimuli is encoded inpatterns of activity across multiple voxels. It does not averagesignals but rather jointly analyzes multi-voxel data to predictor characterize states of the brain (Haxby et al., 2001; Lewis–Peacock and Norman, 2014). In a typical implementation ofMVPA classification, a linear or non-linear classifier is trainedto distinguish stimuli for different categories within a subset ofthe data. The trained model is then tested by using it to predictthe categories of the remaining (independent) data. If a stimuluscan be predicted, or decoded, solely from the pattern of fMRIactivity, there must be some information about that stimulusrepresented in the brain region where the pattern was identified(Chadwick et al., 2012). Accordingly, MVPA goes beyond the sim-ple task/state level of inference that mass-univariate analysisusually draws about a brain region (e.g. ATL plays some rolein identifying people as compared to objects) while also boost-ing the sensitivity to reveal a region’s representational content(e.g. the ATL represents individual person identity; Wang et al.,2017).
Although MVPA classification is a powerful decoding toolthat allows us to infer whether category-level representationoccurs in a region, it is relatively agnostic about what the specificinformation is and in what format that information is organized.There are many aspects of the stimuli or the behaviors (e.g.attentional differences or low-level visual feature differences)that can cause a brain region to successfully classify differ-ent categories, and MVPA classification has limited power fordisentangling these differences. A confusion matrix analysiscan be generated to determine if a classifier for a brain regionresponds similarly to different categories, leading to an indirectmeasure of the geometry of the representation of the categories(Liang et al., 2013). However, this approach is still limited bythe constraints of classification, in that it requires many rep-etitions of trials to train the classifier. In addition, statisticalinference on MVPA classification is prone to false positives whenthe number of categories is high but the sample size is low(Combrisson and Jerbi, 2015; Jamalabadi et al., 2016). Moreover,neural representations of the social world often entail a contin-uous dimension of information (e.g. mental states or subjectivefeeling; Nummenmaa et al., 2018; Tamir et al., 2016) and a largenumber of features, such as body parts (Bracci et al., 2015),stereotype knowledge (Stolier and Freeman, 2016) or action per-ception (Urgen et al., 2019; Wurm et al., 2017). MVPA classificationcan examine these characteristics in a coarse and complicatedway (e.g. via confusion matrix analysis), but stimuli must becategorized in an unnatural way and the individual differences
between every stimulus are typically lost. This loss of within-category features limits the number of features or conditionsthat can be representationally explored, to only the between-category features. Regression-based MVPA decoding analysesalleviate some of these issues, such as being able to explorethe dimensional representation of information. However, thesetechniques still require a large number of trials and these tech-niques are not sensitive to the representation of informationalong a multi-dimensional space. Thus, the family of MVPAdecoding analyses, including classification and regression, lacksthe ability to explore the entire representational space betweenstimuli (Diedrichsen and Kriegeskorte, 2017).
Another type of multivariate method—RSA—lends itself tolooking at higher-order representational space as well as test-ing different computational models of cognition (Haxby et al.,2014; Kriegeskorte et al., 2008a). In RSA, the multivoxel pat-tern responses of stimuli, derived from the same method asclassification-based MVPA, are compared to each other, provid-ing a direct higher-order representation of the stimuli. In ourexample, RSA can be used to compare status representationsacross multiple dimensions (e.g. economic status vs career sta-tus vs reputational status vs body-gesture status vs face-basedstatus; Koski et al., 2017). From this perspective, mass-univariateanalyses provide the first step to understanding the underlyingarchitecture involved in cognitive processes by showing whichareas ramp up in activity, while MVPA decoding can providemore detail about which areas contribute to a process andsome information on how areas can distinguish information.RSA goes further than both by providing information about howregions of the brain represent information, by directly com-paring individual responses to get a complete picture of thestructure of representation of information across some higher-order dimension space, hereby referred to as the geometricrepresentation of information. Different from MVPA confusionmatrix analysis, RSA uses distance measures instead of a classi-fier to characterize the representational space in brain regionsand has the potential benefit of revealing the representationof individual stimuli and not just categories of stimuli. Withthis full representation via RSA, all features of stimuli can becharacterized, whereas MVPA decoding only reveals a subsetof features (Diedrichsen and Kriegeskorte, 2017). Ultimately, thecomparison between MVPA decoding and RSA traces to the dis-cussion benefits and limitations of decoding vs encoding models(Kriegeskorte and Douglas, 2019). A comparison between mass-univariate analyses, MVPA decoding analyses and RSA can befound in Table 1.
A unique feature of RSA is its ability to compare data fromdifferent sources (see Figure 1). For instance, RSA can be usedto compare data from behavioral measures related to socialscenes (e.g. ratings, reaction times, error rates or latent semanticanalysis indices) and data from neural activations in response tothe same stimuli. Indeed, this comparison can even be done fordata from different spatial scales (e.g. single-neuronal recordingvs regional activation) and data from different species (monkeyvs human) (Kriegeskorte et al., 2008b). When linked to computa-tional models, RSA can study not only the fine-grained represen-tations of social information but also explore the dynamic neu-ral computations that undergird social processing (e.g. bottom-up vs top-down processes; Brooks and Freeman, 2018). RSA isbest applied to stimuli or states that can be systematically‘dimensionalized’. In vision research, stimulus dimensions suchas hue, luminance and line orientation can be parametricallymanipulated and the representational sensitivity of visual cor-tex measured. In social neuroscience, many stimuli can also be
Dow
nloaded from https://academ
ic.oup.com/scan/advance-article-abstract/doi/10.1093/scan/nsz099/5693905 by Tem
ple University, tuk12127@
temple.edu on 31 January 2020
3
Table 1. Comparison between different fMRI analytic approaches
Mass-Univariate MVPA Decoding RSA
Granularity ofrepresentational inference
Task/state level of information Category and item level ofinformation
Item level of information
Handling multivoxel data Averaged across voxels Jointly analyze across voxels No requirementInferred format of representation Discrete categories Classification for discrete
Algorithm Linear Both linear and non-linearclassifier
Mostly linear
Data modelling in GLM Single-category modelling andaggregated across runs
Single-category modelling andthen cross-validate across runs
Single-trial modelling, within- orbetween-runs
Optimal study design Factorial design Only few numbers of stimuluscategories (<5), each with manyrepetitions for train-test learning
No limits on number of categories,stimuli with many features
Testing computational models Easy (but univariate encodingmodels have to fit a model firstusing separate data)
Difficult (due to its decodingnature)
Easy (due to its encoding nature)
Linking multimodal data Difficult Difficult Easy
dimensionalized, for instance faces can vary on several dimen-sions (e.g. attractiveness, age, gender and trustworthiness; Dobset al., 2019; Freeman et al., 2018; Stolier and Freeman, 2016; Stolieret al., 2018b), actions can vary on kinematics, effectors, transitiv-ity and intentions (Urgen et al., 2019; Wurm et al., 2017), socialconcepts can vary on affective and psycholinguistic dimensions(Thornton and Tamir, 2017) and friendships can vary in theirsocial distance and network topology (Parkinson et al., 2014;Parkinson et al., 2017). With this new tool, researchers can eveninvestigate complex representations such as morality (Pegadoet al., 2018a; Pegado et al., 2018b; van Baar et al., 2019; Volz etal., 2017; Wasserman et al., 2017) and the development of objectconcepts (Long et al., 2018).
Nuts and bolts: how to do RSA
RSA allows us to explore the underlying representational con-tent of brain regions by comparing the neural response pat-tern (with an emphasis on ‘pattern’) across different stimuli.The basis of RSA is the representational dissimilarity matrices(RDMs), which can be created from any type of data one mighthave: neuroimaging data, behavioral data or even computationaldata. This is an important benefit for analytic flexibility, and RSAshould not be considered an exclusive fMRI technique. Thereare already multiple RSA studies in social neuroscience that donot use fMRI data at all (see Brooks and Freeman, 2018; Costaet al., 2014; Dobs et al., 2019; Stolier et al., 2018b; Thornton andTamir, 2017). Once RDMs are compared across different sources,RSA has the greatest power to link representational informationbetween brain data, behavioral data and computational data(see Figure 1). The analytic pipeline for RSA is actually quitesimple, as outlined in the following paragraphs.
Step 1. Optimize your study design
RSA can be easily implemented in both block and event-relatedfMRI tasks (Mur et al., 2009). However, special attention needsto be given to the spacing of individual trials because the unitof measure for each type of RDM is an individual stimulus.This makes RSA unique among neuroimaging methods becausetypically in neuroimaging, we group the signals from similarstimuli to create a contrast.
In fMRI, trials that are closer together will have more corre-lated signal because of the lag of the hemodynamic response.To fully capitalize benefits of RSA and effectively compare indi-vidual trials, it has been suggested that within-run trials shouldbe randomized between all subjects or if randomization is notpossible, only between-run trials should be compared (Mumfordet al., 2014). Since we are modeling each trial in isolation, we haveto space trials further apart (a jittered design will not help) andinclude more trials per run to increase power (Dimsdale-Zuckerand Ranganath, 2019).
Typically, RSA does not require as many trial repetitionsas MVPA decoding, because RSA does not require machinelearning algorithms. In other words, you don’t need to dotraining then testing. It is important to note that all possiblestimuli within a domain of interest should be included sothat the representational space is completely explored. Forexample, neuroimaging research on semantic memory researchhas traditionally omitted social and abstract words from thestimuli corpus, which leads to findings that fail to include theentire representational space, and also fails to reveal the roles ofsocial brain regions in semantic representation and processing(Leshinskaya et al., 2017; Olson et al., 2007; Troche et al., 2014).Other suggestions for optimizing RSA experimental design (e.g.preprocessing, noise reduction, unequal trial numbers between
Dow
nloaded from https://academ
ic.oup.com/scan/advance-article-abstract/doi/10.1093/scan/nsz099/5693905 by Tem
ple University, tuk12127@
temple.edu on 31 January 2020
4 Social Cognitive and Affective Neuroscience, 2020, Vol. 00, No. 00
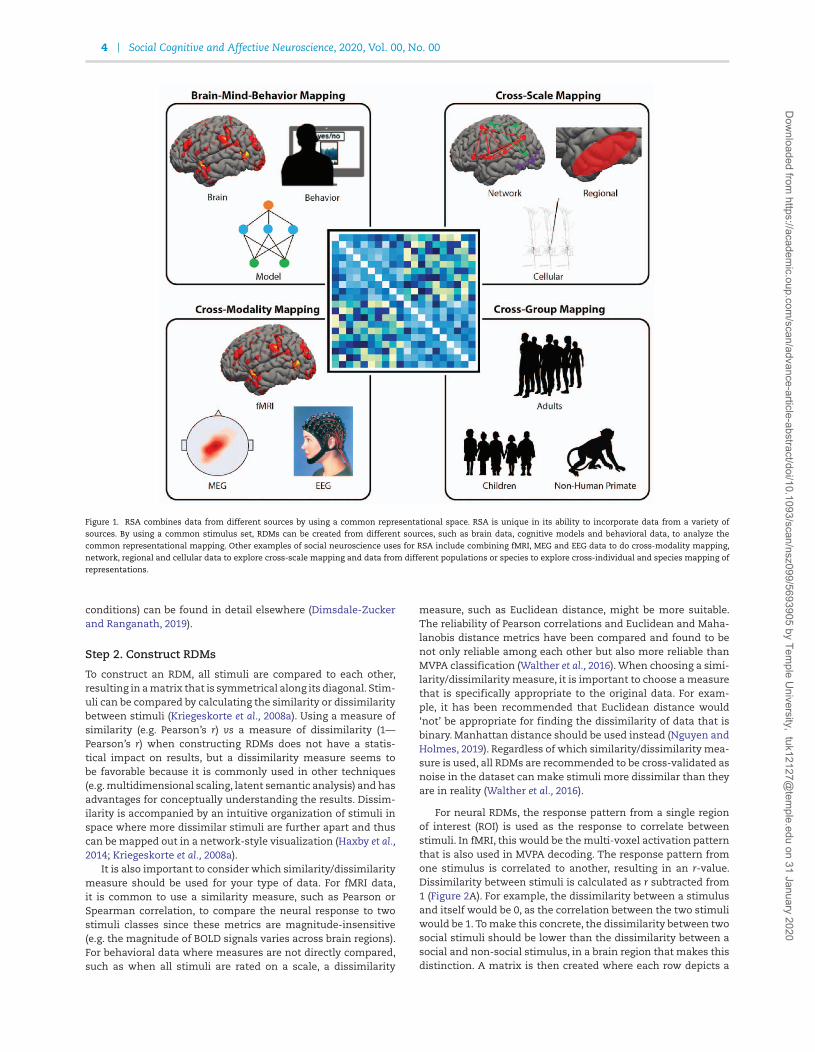
Figure 1. RSA combines data from different sources by using a common representational space. RSA is unique in its ability to incorporate data from a variety of
sources. By using a common stimulus set, RDMs can be created from different sources, such as brain data, cognitive models and behavioral data, to analyze the
common representational mapping. Other examples of social neuroscience uses for RSA include combining fMRI, MEG and EEG data to do cross-modality mapping,
network, regional and cellular data to explore cross-scale mapping and data from different populations or species to explore cross-individual and species mapping of
representations.
conditions) can be found in detail elsewhere (Dimsdale-Zuckerand Ranganath, 2019).
Step 2. Construct RDMs
To construct an RDM, all stimuli are compared to each other,resulting in a matrix that is symmetrical along its diagonal. Stim-uli can be compared by calculating the similarity or dissimilaritybetween stimuli (Kriegeskorte et al., 2008a). Using a measure ofsimilarity (e.g. Pearson’s r) vs a measure of dissimilarity (1—Pearson’s r) when constructing RDMs does not have a statis-tical impact on results, but a dissimilarity measure seems tobe favorable because it is commonly used in other techniques(e.g. multidimensional scaling, latent semantic analysis) and hasadvantages for conceptually understanding the results. Dissim-ilarity is accompanied by an intuitive organization of stimuli inspace where more dissimilar stimuli are further apart and thuscan be mapped out in a network-style visualization (Haxby et al.,2014; Kriegeskorte et al., 2008a).
It is also important to consider which similarity/dissimilaritymeasure should be used for your type of data. For fMRI data,it is common to use a similarity measure, such as Pearson orSpearman correlation, to compare the neural response to twostimuli classes since these metrics are magnitude-insensitive(e.g. the magnitude of BOLD signals varies across brain regions).For behavioral data where measures are not directly compared,such as when all stimuli are rated on a scale, a dissimilarity
measure, such as Euclidean distance, might be more suitable.The reliability of Pearson correlations and Euclidean and Maha-lanobis distance metrics have been compared and found to benot only reliable among each other but also more reliable thanMVPA classification (Walther et al., 2016). When choosing a simi-larity/dissimilarity measure, it is important to choose a measurethat is specifically appropriate to the original data. For exam-ple, it has been recommended that Euclidean distance would‘not’ be appropriate for finding the dissimilarity of data that isbinary. Manhattan distance should be used instead (Nguyen andHolmes, 2019). Regardless of which similarity/dissimilarity mea-sure is used, all RDMs are recommended to be cross-validated asnoise in the dataset can make stimuli more dissimilar than theyare in reality (Walther et al., 2016).
For neural RDMs, the response pattern from a single regionof interest (ROI) is used as the response to correlate betweenstimuli. In fMRI, this would be the multi-voxel activation patternthat is also used in MVPA decoding. The response pattern fromone stimulus is correlated to another, resulting in an r-value.Dissimilarity between stimuli is calculated as r subtracted from1 (Figure 2A). For example, the dissimilarity between a stimulusand itself would be 0, as the correlation between the two stimuliwould be 1. To make this concrete, the dissimilarity between twosocial stimuli should be lower than the dissimilarity between asocial and non-social stimulus, in a brain region that makes thisdistinction. A matrix is then created where each row depicts a
Dow
nloaded from https://academ
ic.oup.com/scan/advance-article-abstract/doi/10.1093/scan/nsz099/5693905 by Tem
ple University, tuk12127@
temple.edu on 31 January 2020
5
Figure 2. Construction of RDMs. (A) An RDM is constructed from neural data by extracting the multi-voxel pattern response from a ROI, from a single participant, for each
individual stimulus. The dissimilarity, or 1 minus the correlation coefficient, is found between all possible stimuli comparison pairs, to create a dissimilarity matrix.
(B) An RDM is constructed from behavioral data by collecting the response from a participant for each individual stimulus. The dissimilarity between all individual
stimuli pairs is found using a distance measure calculation, such as the Euclidean distance. (C) A conceptual model RDM is constructed by pinpointing a feature of
interest from the stimulus set. The dissimilarity matrix represents which stimuli share the common feature and which do not. (D) In the final step of the analysis, the
bRDM and two mRDMs are compared to the nRDM. A noise ceiling (the gray horizontal bar) is calculated to see how well a perfect model would perform. Significance
tests show that the bRDM and the mRDM1 are significantly similar to the nRDM. A pairwise comparison shows that the bRDM performs significantly better than the
mRDM1 and mRDM2, in terms of relating to the nRDM.
vector of the neural response comparisons of one stimulus to allstimuli, including itself. The matrix is an RDM representing thedissimilarity between all stimulus neural responses. To increasepower, trials are often repeated and averaged together. Trialscan also be grouped together based on categories of interest,similar to designs used for mass-univariate analyses or MVPAclassification; however, this is not necessary. RSA has an advan-tage over other techniques in that it allows for stimuli to remainungrouped so that the underlying representational geometry ofthe stimuli can be explicitly explored (e.g. mental states; Tamiret al., 2016). These steps to create a neural RDM can be repeatedfor all subjects, and the subject-level RDMs can be averagedtogether to create a group-level RDM. Alternatively, RDMs can becompared on an individual subject level; for example, a subject’sneural RDM to their behavioral RDM of their ratings from a task.
For behavioral RDMs, the ratings or measures between pairsof stimuli are compared to create an RDM. Comparisons betweentwo different behavioral ratings in a task, for instance, valenceor arousal, can be calculated using measures of distance, suchas Euclidean distance (Freeman et al., 2018; Kragel and LaBar,2016). The RDM is created in the same manner as a neural DMN,resulting in a matrix that is also symmetrical about its diagonaland has the same number of rows and columns, as the samestimuli must be used in both tasks (Figure 2B).
Model RDMs can be used in a few ways depending onthe researcher’s needs. There are two styles of models. Onetype, called a ‘conceptual model’, can be used by creating amatrix based on a presumed relationship between the stimuli(Kriegeskorte et al., 2008a). A conceptual model RDM highlightsthe difference between stimuli along a feature of interest. Thedimensions and stimulus order of a conceptual model RDM
matches the other RDMs that will be compared with the model.In an example where there are two categories of interest, thevalues of the conceptual model RDM will be ‘0’ for stimulithat are of the same category or share a similar feature ofinterest, for instance animate objects, and ‘1’ for stimuli thatare not of the same category or do not share a similar feature ofinterest, for instance, animate objects and inanimate objects(Figure 2C). This is similar to creating a contrast in a mass-univariate analysis; however, the difference is that in RSA betasfrom individual stimuli are first compared to each other, ratherthan grouped and averaged together. Conceptual RDMs can alsobe created to account for multiple categories or features, basedon some hypothesized relationship between stimuli, such asfaces, non-face animate objects and inanimate objects. In thisexample, faces and non-face animate objects will be ‘1’, as theydiffer on only one category (face vs non-face), and faces andinanimate objects will be ‘2’, as they differ on two categories(face vs non-face and animate vs inanimate). The second typeof model is called a ‘computational model’ where values of anRDM are outputs of some function or algorithm. For example,a computational model that mimics the processing of V1 inhumans can be fed images and a computational RDM can beproduced (Nili et al., 2014). This has been done for differenttypes of stimuli including luminance patterns of images (Cichyet al., 2016; Kriegeskorte et al., 2008), semantic features of words(Carota et al., 2017; Chen et al., 2016) and motion trajectorypatterns of action videos (Urgen et al., 2019).
Step 3. Compare the RDMs
A single RDM can be used to complete an analysis, but thegreatest advantage of RSA is the ability to compare RDMs, hence
Dow
nloaded from https://academ
ic.oup.com/scan/advance-article-abstract/doi/10.1093/scan/nsz099/5693905 by Tem
ple University, tuk12127@
temple.edu on 31 January 2020
6 Social Cognitive and Affective Neuroscience, 2020, Vol. 00, No. 00
the word ‘similarity’ in RSA. RDMs can be compared in a vari-ety of iterations depending on the researcher’s questions andhypotheses. In a simple example, a neural RDM and conceptualmodel RDM (e.g. social vs non-social) can be correlated to seehow well social information is represented in the neural RDM(Figure 2D).
Multiple ROIs can be compared to see which region betterrepresents a category. For example, an RDM constructed from theBOLD response in inferior temporal cortex would better repre-sent animate as compared to inanimate objects than a neuralRDM from early visual cortex as the model RDM for animacyis more similar to the neural RDM in inferior temporal cortexthan in early visual cortex (Kriegeskorte et al., 2008). ComparingRDMs among multiple ROIs can also reveal the relationshipsbetween their representations (‘representational connectivity’).In analogy to functional connectivity analyses, this representa-tional connectivity analysis (when combined with a searchlightapproach) can powerfully inform us which regions are represen-tationally connected to a given region(Kriegeskorte et al., 2008a).Just as in RDM construction, instead of using similarity, a second-order dissimilarity can be used to compare RDMs (Kriegeskorteet al., 2008a).
RDMs can be quantitatively compared with different metrics,though it has been recommended that rank-correlation distance(e.g. Spearman correlation, Kendall’s Tau) should be used sincethe noise within each RDM differs based on what the RDM wascreated from [e.g. fMRI data, MEG (magnetoencephalography)data, behavioral measures], therefore avoiding an assumptionof a linear match between the RDMs (Kriegeskorte et al., 2008a).Similarly, when comparing the performance of multiple modelRDMs (e.g. which is more closely related to the measured neuralRDMs), non-parametric signed-rank test should be used (ratherthan the paired Student’s t-test) (Nili et al., 2014). Using thesenon-parametric rank-based tests also has the advantage of beingrobust against outliers. In order to reduce the likelihood of false-positive correlations, it is important that the diagonal and off-diagonal triangle of RDMs be excluded when comparing RDMs,thereby only leaving the lower or upper triangle of RDMs (Ritchieet al., 2017).
There are two general steps that should be taken to deter-mine if RDMs are statistically similar. First, a noise ceiling shouldbe calculated to determine the maximum possible similaritybetween an RDM of interest and the theoretical ‘true’ modelRDM, given the level of noise in the data (for how to compute thenoise ceiling, please read Nili et al., 2014). Second, a significancetest should be done. A popular option is to use a permutationtest, where the labels of the original data are shuffled, and anRDM is calculated on the permuted labels. The resulting per-muted RDM is correlated to a second unpermuted RDM, repeat-edly, in order to find the null distribution under the assumptionthat the RDMs are different (Dimsdale-Zucker and Ranganath,2019; Kriegeskorte et al., 2008a; Nili et al., 2014; Walther et al.,2016). When RDMs are significantly correlated, researchers canarticulate clearer conclusions by stating that the representationof stimuli is more similar in two brain regions, whose RDMs aresignificantly correlated, than in a third brain region, whose RDMis not significantly correlated with the others.
A common technique for exploratory brute-force searchof neural representations is whole-brain searchlight RSA.The premise of this technique is similar to MVPA decodingsearchlight in which a spherical ROI is made around each voxelin the brain for the analysis (Kriegeskorte et al., 2006). A neuralRDM is created for each spherical ROI, and this is compared toother RDMs of interest (e.g. behavioral or model RDMs). Maps
can be created to show which voxels across the whole brain aresignificantly related to the comparison RDMs (Tamir et al., 2016).When using a searchlight, testing for significance is done in thesame manner as traditional fMRI methods, such as by usingan FDR/FWE correction, Monte Carlo simulation or permutationtest (Carlin et al., 2011).
Social neuroscience problems for whichRSA is usefulRSA can be used to investigate social categories anddimensions
RSA has been used to test hypotheses about the neural rep-resentation of social categories and dimensions (Chavez andHeatherton, 2014; Freeman et al., 2018; Pegado et al., 2018; Vidaet al., 2017; Wasserman et al., 2017). In most of these studies, thestimuli that are compared can be dimensionalized along somepredefined metric. For instance, Parkinson et al. (2014) used RSAto ask whether social distance (how psychologically close youare to various friends and acquaintances), physical distance (theproximity between two objects in space and temporal distance(how far apart two events are in time) are represented in a singledomain-general region. A key feature of the experimental designis that psychological closeness can be measured parametricallyin terms of distance, just like real physical distance. The findingsshowed that the right inferior parietal lobule was significantlyrelated to social, physical and temporal distance, suggestingthat some high level social processes co-opted neural processesthat evolved to process basic sensory information about spatial–temporal distance (Parkinson et al., 2014).
RSA has also been used to reveal how the brain representsthe richness and complexity of social knowledge such as theself (Chavez et al., 2017; Feng et al., 2018; Wagner et al., 2018)and others’ mental states (Tamir et al., 2016; Thornton et al.,2019a; Thornton et al., 2019b). For instance, Tamir and colleaguesasked subjects to rate mental state terms (e.g. awe, worry, curios-ity, rage) on a variety of attributes such as warmth, compe-tence, agency, experience and arousal. Their behavioral resultsshowed that individual mental states can be represented byfour unique dimensions (i.e. rationality, social impact, humanmind and valence). They then created a behavioral RDM foreach dimension based on the pairwise similarity of each men-tal state projecting on that dimension. Later, they asked sub-jects to think about each mental state term in the scannerand derived a neural RDM for each region of the brain basedon the pairwise similarity of local neural activation patternsassociated with each mental state. By linking behavioral andneural RDMs using searchlight RSA, they localized the neuralcorrelates of three dimensions (rationality, social impact andvalence) in the MPFC, precuneus, TPJ (temporoparietal junc-tion) and ATL (Tamir et al., 2016). This study demonstrates thatRSA is a very powerful analytic technique to reveal how the brainorganizes a complex and multidimensional system like socialknowledge.
RSA can be used to investigate emotions and valence
RSA has also been used in affective neuroscience to better under-stand the neural representation of emotions and valence (Chika-zoe et al., 2014; Costa et al., 2014; Nummenmaa et al., 2012).RDMs from different ROIs can be compared to see how differentbrain regions represent distinct stimulus features such as the
Dow
nloaded from https://academ
ic.oup.com/scan/advance-article-abstract/doi/10.1093/scan/nsz099/5693905 by Tem
ple University, tuk12127@
temple.edu on 31 January 2020
7
emotional valence of images. Chikazoe et al. (2014) found thatwhen mean activations were used to measure representationsin the orbitofrontal cortex, specificity of valence was not foundas the similarity of between-valence stimuli (positive vs negativestimuli) was similar to within-valence stimuli (positive vs posi-tive and negative vs negative). However, when the pattern of acti-vation across the orbitofrontal cortex was used, valence could beseen to be represented in a dimensional manner where within-valence stimuli had greater similarity than between-valencestimuli. This was interesting because prior meta-analyses ofdata from mass-univariate fMRI studies showed that neuralactivations for positive and negative valenced items tended tooverlap (Lindquist et al., 2012). Chikazoe and colleagues showedthat although mass-univariate analyses can reveal that a regionis activated for stimuli of two opposing sides of a dimension, RSAcan reveal how information of that dimension is represented(Chikazoe et al., 2014).
RSA can be used to compare models with neuralrepresentations
A unique feature of RSA is its ability to compare neural represen-tations with psychological or computational models. In a recentstudy, representations of observed socio-affective touch experi-ences, such as hugging and holding hands, were compared torepresentations of non-socio-affective touch experiences, suchas holding objects (Lee Masson et al., 2018). The mass-univariateanalysis from this study showed that the social vs non-socialtouch contrast implicated social brain network regions such asthe TPJ and superior and middle temporal gyrus. A multipleregression analysis was used to show that a social vs non-socialconceptual RDM could be related to neural RDMs from differentROIs representing various networks and not just the social brainnetwork. The analysis revealed that social information fromtouch experiences can be represented across a variety of regionsbelonging to somatosensory, pain, theory of mind and visualnetworks. Affective information from touch experiences, on theother hand, was selectively represented in regions belonging tosomatosensory and theory of mind regions.
RSA can be used to compare data from different agegroups, diagnostic groups or even species
The neural representation of a category, dimension or task canbe easily compared using RSA between different individuals(Guntupalli et al., 2016; Nguyen et al., 2019; van Baar et al., 2019)and groups (Golarai et al., 2017; Lee et al., 2017). For instance,one could ask: do children and adults have similar or differentneural representations for different visual categories? And infact, using RSA, it has been shown that category representationsof faces, scenes and objects in the ventral temporal cortex doesnot differ between children, ages 7 to 11, and adults (Golarai etal., 2017). In another study with a slightly younger age groupof five to seven-year olds, a univariate analysis showed thatcategory-selectivity was not present in regions that typicallyencode faces, bodies and places. However, RSA was able to showthat response patterns were still similar to adults who did havecategory selectivity in those same regions, suggesting that veryyoung children have distributed response patterns that serve asa foundation for category-selective regions (Cohen et al., 2019).Another study asked whether a mother’s empathy for her child isequivalent to the child’s empathy for their mother. This questionwas based on the premise that empathy, to some degree, blurs
the line between self and other, thus if one group has higherempathy for the other group, there should be greater represen-tational similarity. Using RSA, the results showed that mothershad more similar neural representations for harm to self andharm to family members than did their adolescent children (Leeet al., 2017). When comparing common representational spaceacross individuals, RSA can even be employed for functionalparcellation of the cortex (Guntupalli et al., 2016).
Not only can different groups of human participants be com-pared using RSA but also different species of animals as well. Inan early RSA study, researchers asked if object and face represen-tations in the inferior temporal lobe are similar in macaques andhumans (Kriegeskorte et al., 2008). Humans and macaques wereshown the same images of natural and artificial objects, animatenon-human faces and body parts and human faces and bodyparts while either undergoing an fMRI scan or while having theelectrical activity of neurons recorded. The dissimilarity betweenthe neural response to visual stimuli in human inferior temporalcortex was compared to the dissimilarity of the neural responseto visual stimuli in macaque inferior temporal cortex. The resultsshowed that both species represent objects and faces in a highlysimilar way in inferior temporal cortex. This example shows howRSA can create a bridge to directly compare non-human primateresearch to human research, even when the data that are beingcompared are from distinct methodologies.
RSA can be used to compare data from differenttechniques
As hinted at in the last section, RSA enables us to compareneural data from different modalities. Kriegeskorte and col-leagues (2008) not only compared different species, but they alsocompared fMRI and extracellular recording data (Kriegeskorteet al., 2008). In short, any modality (with different spatial andtemporal scales) can be used in combination together as inputin RSA, as long as the same tasks are used across studies. It canprovide a bridge between data gathered using different modal-ities in social neuroscience (e.g. eye-tracking, electromyographyand electrocorticography). For instance, the sluggish temporalresolution of the BOLD response can be partly overcome byusing RSA to complement fMRI with data from techniques withexcellent temporal resolution such as MEG (Cichy et al., 2017) orEEG (electroencephalography) (Salmela et al., 2018). RSA has alsobeen used to compare data from MEG to EEG (Cichy and Pantazis,2017). RSA can even be combined with diffusion imaging toreveal the neural representation in white matter (Fang et al.,2018). As data accumulate in social neuroscience, comparisonsacross techniques will allow us to gain convergent and compli-mentary viewpoints.
RSA can be used to make predictions about futurebehavior
Since RSA can reveal how information is represented in thebrain, an interesting extrapolation is to use the current stateof an individual’s neural representations to predict the sameindividual’s future behavior. This is particularly useful for per-suasion neuroscience where the aim is to investigate how mes-sages are firstly encoded in the brain and then influence people’smind and subsequent behavior. In one such experiment, studyparticipants who were smokers were recruited and they wereshown images that contained social or health themes relatedto quitting smoking. Conceptual model RDMs were created for
Dow
nloaded from https://academ
ic.oup.com/scan/advance-article-abstract/doi/10.1093/scan/nsz099/5693905 by Tem
ple University, tuk12127@
temple.edu on 31 January 2020
8 Social Cognitive and Affective Neuroscience, 2020, Vol. 00, No. 00
health information, social information and valence of messagecontent. These model RDMs were correlated with neural RDMsto see how well an ROI represented a given type of informa-tion. The correlations from the neural RDM and each of themodel RDMs were inputted into a regression analysis to predictchange in frequency of smoking. It was found that the morehealth information was represented in the MPFC, the more likelyparticipants were to reduce smoking (as indexed by self-report,∼38 days later) (Pegors et al., 2017). Future extensions of thiswork could look to see if neural data predict behavior at longertime frames, which is more relevant for public health, and alsouse direct measures of smoking cessation to improve modelprediction.
RSA has also been used to predict physiological indices offear. Visser et al. (2013) presented participants with visual stim-uli, such as a face or a house, and some of these were paired withshocks. The similarity between neural responses for differentcategory stimuli, which were both presented with an electricshock (and therefore had a shared feature of fear), predictedpupil dilation similarity in a separate test given weeks afterthe initial learning experiment (Visser et al., 2013). Note thatthe average activation to the stimuli was not able to predictpupil dilation, but RSA could—further highlighting RSA’s greatersensitivity over mass-univariate analyses.
RSA limitations
Although the focus of this paper has been on highlighting theadvantages of RSA over other methods, RSA still shares somelimitations of more commonly used techniques. One limitationof RSA is that it is still susceptible to pitfalls of any correlation-based methods. RSA attempts to understand how informationis represented in a brain region by correlating RDMs, whichare themselves made of correlations. Although neural RDMsmay be correlated with model RDMs of a specific attribute (i.e.high-status vs low-status), the correlations will not explain allof the shared variances between stimuli. One solution to thismay be to direct attention during a task to specific attributesthat can tell the researcher how information is represented(Nastase et al., 2017; Popov et al., 2018). Another solutionwould be to use other non-correlation-based representationalanalyses (e.g. encoding analysis, pattern component analysis,multivariate pattern dependence, repetition suppression) tovalidate RSA results in the same study (Anzellotti and Coutanche,2018; Diedrichsen and Kriegeskorte, 2017; Hatfield et al., 2016;Wagner et al., 2018).
A second limitation is that RSA can be heavily influenced byoutliers, in much the same way that all correlation-based anal-yses are. As mentioned previously, a rank-based correlation canbe used to curb the influence of outliers when correlating RDMs,and large sample size (n > 12) and rich stimuli for each condition(>20) are needed for population inference and stimulus-labelrandomization test (Nili et al., 2014).
General discussionRSA can uniquely address questions about the neural repre-sentation of information from features of stimuli. Because RSAdirectly captures the differences between individual stimuli,it has an advantage over mass-univariate methods and MVPAdecoding in analyzing the multidimensional features of stim-uli. This is in addition to its greater sensitivity by accountingfor the multivariate nature of data, rather than an aggregateresponse that is used in mass-univariate methods. Although
some earlier univariate techniques can also be used to study therepresentation of stimulus features, such as repetition suppres-sion (Grill-Spector et al., 2006), these techniques still suffer fromlimitations that multivariate techniques do not have.
In addition, although traditional univariate encoding modelsprovide an alternative to RSA for testing computational modelsof brain information processing (Kay et al., 2008), it first needs aseparate dataset and stimuli for model fitting. In contrast, RSAoffers an easy and simple way of comparing models, naturallyhandles noise correlations between voxels and reduces the needfor a training dataset (Nili et al., 2014). When RSA incorporatesother encoding models (e.g. multiple regression RSA), it can pro-vide a flexible and powerful quantitative means to characterizedynamic, rather than fixed representational spaces, shaped bybottom-up and top-down factors, thus promising better predic-tions of social cognition and behavior (Stolier et al., 2018a).
Future implementations of RSA can be used to explore dif-ferences in representation in clinical populations. Alterationsin the representation of a particular type of information canbe explored in clinical populations that have a clear deficit inrepresentations, such as semantic memory deficits in seman-tic variant primary progressive aphasia or social knowledgein autism spectrum disorders. A novel use of RSA seeks tounderstand individual differences between subjects by havingsubjects as features of RDMs and using inter-subject correlationsto see how subjects respond differently to naturalistic stimuli(Finn et al., 2018).
In sum, RSA is an important and promising computationaltechnique for understanding how our brain represents the socialworld. RSA is easy to use and can fully integrate the entirerepertoire of techniques used in social neuroscience includingsingle-unit recordings, fMRI, EEG, physiological recordings andbehavioral reactions (Figure 1). Several toolboxes exist that allowresearchers to handily use RSA, such as the RSA toolbox (Niliet al., 2014), CosMoMVPA (Oosterhof et al., 2016), The DecodingToolbox (Hebart et al., 2015) and PyMVPA (Hanke et al., 2009).Compared to MVPA decoding, the learning curve for RSA is farlower as users do not need to understand various machinelearning algorithms that if implemented poorly can provideambiguous or even misleading results.
We hope that this introduction to RSA allows researchersto see that the technique is easy to understand and imple-ment, thus paving the way for future research using thistechnique.
Acknowledgements
The content is solely the responsibility of the authorsand does not necessarily represent the official views ofthe National Institutes of Health. The authors declare nocompeting financial interests.
FundingThis work was supported by a National Institute of Health grantto I. Olson [RO1 MH091113].
van Baar, J.M., Chang, L.J., Sanfey, A.G. (2019). The computa-tional and neural substrates of moral strategies in socialdecision-making. Nature Communications, 10(1), 1483. https://doi.org/10.1038/s41467-019-09161-6.
Bracci, S., Caramazza, A., Peelen, M.V. (2015). Representationalsimilarity of body parts in human occipitotemporal cortex.Journal of Neuroscience, 35(38), 12977–85. https://doi.org/10.1523/JNEUROSCI.4698-14.2015.
Brooks, J.A., Freeman, J.B. (2018). Conceptual knowledge predictsthe representational structure of facial emotion perception.Nature Human Behaviour, 2(8), 581–91. https://doi.org/10.1038/s41562-018-0376-6.
Carlin, J.D., Calder, A.J., Kriegeskorte, N., Nili, H., Rowe, J.B.(2011). A head view-invariant representation of gaze directionin anterior superior temporal sulcus. Current Biology, 21(21),1817–21. https://doi.org/10.1016/j.cub.2011.09.025.
Carota, F., Kriegeskorte, N., Nili, H., Pulvermüller, F. (2017). Rep-resentational similarity mapping of distributional semanticsin left inferior frontal, middle temporal, and motor cortex.Cerebral Cortex, 27(1), 294–309. https://doi.org/10.1093/cercor/bhw379.
Chadwick, M.J., Bonnici, H.M., Maguire, E.A. (2012). Decodinginformation in the human hippocampus: a user’s guide.Neuropsychologia, 50(13), 3107–21. https://doi.org/10.1016/j.neuropsychologia.2012.07.007.
Chavez, R.S., Heatherton, T.F. (2014). Representational similarityof social and valence information in the medial pFC. Journalof Cognitive Neuroscience, 10(4), 431–41. https://doi.org/10.1162/jocn.
Chavez, R.S., Heatherton, T.F., Wagner, D.D. (2017). Neural popula-tion decoding reveals the intrinsic positivity of the self. CerebralCortex, 27(11), 5222–9. https://doi.org/10.1093/cercor/bhw302.
Chen, Y., Shimotake, A., Matsumoto, R., et al. (2016). The“when” and “where” of semantic coding in the anteriortemporal lobe: temporal representational similarity analy-sis of electrocorticogram data. Cortex, 79, 1–13. https://doi.org/10.1016/j.cortex.2016.02.015.
Chiao, J.Y., Harada, T., Oby, E.R., Li, Z., Parrish, T., Bridge, D.J. (2009).Neural representations of social status hierarchy in human
Chikazoe, J., Lee, D.H., Kriegeskorte, N., Anderson, A.K. (2014).Population coding of affect across stimuli, modalities andindividuals. Nature Neuroscience, 17(8), 1114–22. https://doi.org/10.1038/nn.3749.
Cichy, R.M., Pantazis, D. (2017). Multivariate pattern analysis ofMEG and EEG: A comparison of representational structurein time and space. NeuroImage, 158, 441–54. https://doi.org/10.1016/j.neuroimage.2017.07.023.
Cichy, R.M., Khosla, A., Pantazis, D., Torralba, A., Oliva, A. (2016).Comparison of deep neural networks to spatio-temporalcortical dynamics of human visual object recognition reveals
Cichy, R.M., Kriegeskorte, N., Jozwik, K.M., van den Bosch, J.J.F.,Charest, I. (2017). Neural dynamics of real—world object
vision that guide behaviour. BioRxiv, 147298, 1–21. https://doi.org/10.1101/147298.
Cohen, M.A., Dilks, D.D., Koldewyn, K. (2019). Represen-tational similarity precedes category selectivity in thedeveloping ventral visual pathway. NeuroImage. 197. doi:https://doi.org/10.1016/J.NEUROIMAGE.2019.05.010.
Combrisson, E., Jerbi, K. (2015). Exceeding chance level by chance:the caveat of theoretical chance levels in brain signal classifi-cation and statistical assessment of decoding accuracy. Journalof Neuroscience Methods, 250, 126–36. https://doi.org/10.1016/j.jneumeth.2015.01.010.
Costa, T., Cauda, F., Crini, M., et al. (2014). Temporal and spatialneural dynamics in the perception of basic emotions fromcomplex scenes. Social Cognitive and Affective Neuroscience, 9(11),1690–703. https://doi.org/10.1093/scan/nst164.
Diedrichsen, J., Kriegeskorte, N. (2017). Representational mod-els: a common framework for understanding encoding,pattern-component, and representational-similarity analysis.PLoS Computational Biology, 13. https://doi.org/10.1371/journal.pcbi.1005508.
Dimsdale-Zucker, H.R., Ranganath, C. (2019). Representationalsimilarity analyses: a practical guide for functionalMRI applications. In: Handbook of In Vivo PlasticityTechniques, Elsevier B.V, pp. 509–25. https://doi.org/10.1016/b978-0-12-812028-6.00027-6.
Dobs, K., Isik, L., Pantazis, D., Kanwisher, N. (2019). How faceperception unfolds over time. Nature Communications, 10(1258),1–23. https://doi.org/10.1101/442194.
Fang, Y., Wang, X., Zhong, S., et al. (2018). Semantic representationin the white matter pathway. PLoS Biology, 16(4), 1–21. https://doi.org/10.1371/journal.pbio.2003993.
Feng, C., Yan, X., Huang, W., Han, S., Ma, Y. (2018). Neural rep-resentations of the multidimensional self in the cortical mid-line structures. NeuroImage, 183, 291–9. https://doi.org/10.1016/j.neuroimage.2018.08.018.
Finn, E.S., Corlett, P.R., Chen, G., Bandettini, P.A., Constable, R.T.(2018). Trait paranoia shapes inter-subject synchrony in brainactivity during an ambiguous social narrative. Nature Communi-cations, 9(1), 1–13. https://doi.org/10.1038/s41467-018-04387-2.
Freeman, J.B., Stolier, R.M., Brooks, J.A., Stillerman, B.A. (2018).The neural representational geometry of social perception.Current Opinion in Psychology, 24, 83–91. https://doi.org/10.1016/J.COPSYC.2018.10.003.
Golarai, G., Liberman, A., Grill-Spector, K. (2017). Experienceshapes the development of neural substrates of face process-ing in human ventral temporal cortex. Cerebral Cortex, 27(2),1229–44. https://doi.org/10.1093/cercor/bhv314.
Grill-Spector, K., Henson, R., Martin, A. (2006). Repetition andthe brain: neural models of stimulus-specific effects. Trendsin Cognitive Sciences, 10(1), 14–23. https://doi.org/10.1016/j.tics.2005.11.006.
Guntupalli, J.S., Hanke, M., Halchenko, Y.O., Connolly, A.C.,Ramadge, P.J., Haxby, J.V. (2016). A model of representationalspaces in human cortex. Cerebral Cortex, 26(6), 2919–34. https://doi.org/10.1093/cercor/bhw068.
Hanke, M., Halchenko, Y.O., Sederberg, P.B., Hanson, S.J., Haxby,J.V., Pollmann, S. (2009). PyMVPA: a python toolbox for mul-tivariate pattern analysis of fMRI data. Neuroinformatics, 7(1),37–53. https://doi.org/10.1007/s12021-008-9041-y.
Hatfield, M., McCloskey, M., Park, S. (2016). Neural representa-tion of object orientation: a dissociation between MVPA andrepetition suppression. NeuroImage, 139, 136–48. https://doi.org/10.1016/j.neuroimage.2016.05.052.
Haxby, J.V. (2012). Multivariate pattern analysis of fMRI : Par-cellating abstract from concrete representations. NeuroImage,62(2), 852–5. https://doi.org/10.1016/j.neuroimage.2012.03.016.Multivariate.
Haxby, J.V., Gobbini, M.I., Furey, M.L., Ishai, A., Schouten, J.L.,Pietrini, P. (2001). Distributed and overlapping representations
Dow
nloaded from https://academ
ic.oup.com/scan/advance-article-abstract/doi/10.1093/scan/nsz099/5693905 by Tem
Hebart, M.N., Görgen, K., Haynes, J.-D. (2015). The decoding tool-box (TDT): a versatile software package for multivariate anal-yses of functional imaging data. Frontiers in Neuroinformatics,8(88), 1–18. https://doi.org/10.4077/CJP.2018.BAG570.
Jamalabadi, H., Alizadeh, S., Schönauer, M., Leibold, C., Gais,S. (2016). Classification based hypothesis testing in neuro-science: below-chance level classification rates and over-looked statistical properties of linear parametric classifiers.Human Brain Mapping, 37(5), 1842–55. https://doi.org/10.1002/hbm.23140.
Kay, K.N., Naselaris, T., Prenger, R.J., Gallant, J.L. (2008). Identifyingnatural images from human brain activity. Nature, 452, 352–5.https://doi.org/10.1038/nature06713.
Koski, J.E., Collins, J.A., Olson, I.R. (2017). The neural repre-sentation of social status in the extended face-processingnetwork. The European Journal of Neuroscience, 46(12), 39–43.https://doi.org/10.1016/j.sbi.2014.03.006.Better.
Kragel, P.A., LaBar, K.S. (2016). Decoding the nature of emotion inthe brain. Trends in Cognitive Sciences, 20(6), 444–55. https://doi.org/10.1016/j.tics.2016.03.011.
Kriegeskorte, N., Douglas, P.K. (2019). Interpreting encoding anddecoding models. Current Opinion in Neurobiology, 55, 167–79.https://doi.org/10.1016/j.conb.2019.04.002.
Kriegeskorte, N., Goebel, R., Bandettini, P. (2006). Information-based functional brain mapping. Proceedings of the NationalAcademy of Sciences, 103(10), 3863–8. https://doi.org/10.1073/pnas.0600244103.
Kriegeskorte, N., Mur, M., Bandettini, P. (2008a). Representa-tional similarity analysis—connecting the branches of sys-tems neuroscience. Frontiers in Systems Neuroscience, 2(4), 1–28.https://doi.org/10.3389/neuro.06.004.2008.
Kriegeskorte, N., Mur, M., Ruff, D.A., et al. (2008b). Matchingcategorical object representations in inferior temporal cor-tex of man and monkey. Neuron, 60(6), 1126–41. https://doi.org/10.1016/j.neuron.2008.10.043.
Lee Masson, H., Van De Plas, S., Daniels, N., Op de Beeck, H. (2018).The multidimensional representational space of observed
Lee, T.H., Qu, Y., Telzer, E.H. (2017). Love flows downstream:mothers’ and children’s neural representation similarity in
perceiving distress of self and family. Social Cognitive andAffective Neuroscience, 12(12), 1916–27. https://doi.org/10.1093/scan/nsx125.
Leshinskaya, A., Contreras, J.M., Caramazza, A., Mitchell, J.P.(2017). Neural representations of belief concepts: a representa-tional similarity approach to social semantics. Cerebral Cortex,27(1), 344–57. https://doi.org/10.1093/cercor/bhw401.
L.F. (2012). The brain basis of emotion: a meta-analytic review.Behavioral and Brain Sciences, 35, 121–43. https://doi.org/10.1017/s0140525x11000446.
Long, B., Fan, J., Frank, M. (2018). Drawings as a window intothe development of object category representations. Journal ofVision, 18(10), 398. https://doi.org/10.1167/18.10.398.
Mumford, J.A., Davis, T., Poldrack, R.A. (2014). The impact of studydesign on pattern estimation for single-trial multivariate pat-tern analysis. NeuroImage, 103, 130–8. https://doi.org/10.1016/j.neuroimage.2014.09.026.
Mur, M., Bandettini, P.A., Kriegeskorte, N. (2009). Revealing repre-sentational content with pattern-information fMRI—an intro-ductory guide. Social Cognitive and Affective Neuroscience, 4(1),101–9. https://doi.org/10.1093/scan/nsn044.
Nastase, S.A., Connolly, A.C., Oosterhof, N.N., et al. (2017). Atten-tion selectively reshapes the geometry of distributed seman-tic representation. Cerebral Cortex, 27(8), 4277–91. https://doi.org/10.1093/cercor/bhx138.
Nguyen, L.H., Holmes, S. (2019). Ten quick tips for effectivedimensionality reduction. PLoS Computational Biology, 15(6),1–19. https://doi.org/10.1371/journal.pcbi.1006907.
Nguyen, M., Vanderwal, T., Hasson, U. (2019). Shared under-standing of narratives is correlated with shared neuralresponses. NeuroImage, 184, 161–70. https://doi.org/10.1016/j.neuroimage.2018.09.010.
Nili, H., Wingfield, C., Walther, A., Su, L., Marslen-wilson, W.,Kriegeskorte, N. (2014). A toolbox for representational sim-ilarity analysis. PLoS Computational Biology, 10(4). https://doi.org/10.1371/journal.pcbi.1003553.
Nummenmaa, L., Glerean, E., Viinikainen, M., Jaaskelainen, I.P.,Hari, R., Sams, M. (2012). Emotions promote social interactionby synchronizing brain activity across individuals. Proceedingsof the National Academy of Sciences, 109(24), 9599–604. https://doi.org/10.1073/pnas.1206095109.
Nummenmaa, L., Hari, R., Hietanen, J.K., Glerean, E. (2018).Maps of subjective feelings. Proceedings of the NationalAcademy of Sciences, 115(37), 9198–203. https://doi.org/10.1073/pnas.1807390115.
Olson, I.R., Plotzker, A., Ezzyat, Y. (2007). The enigmatic temporalpole: a review of findings on social and emotional processing.Brain, 130(7), 1718–31. https://doi.org/10.1093/brain/awm052.
Oosterhof, N.N., Connolly, A.C., Haxby, J.V. (2016). CoSMoMVPA:multi-modal multivariate pattern analysis of neuroimagingdata in Matlab/GNU octave. Frontiers in Neuroinformatics, 10(27),1–27. https://doi.org/10.3389/fninf.2016.00027.
Parkinson, C., Liu, S., Wheatley, T. (2014). A common corti-cal metric for spatial, temporal, and social distance. Jour-nal of Neuroscience, 34(5), 1979–87. https://doi.org/10.1523/JNEUROSCI.2159-13.2014.
Parkinson, C., Kleinbaum, A.M., Wheatley, T. (2017). Spontaneousneural encoding of social network position. Nature HumanBehaviour, 1(5), 1–7. https://doi.org/10.1038/s41562-017-0072.
Pegado, F., Hendriks, M.H.A., Amelynck, S., et al. (2018a). A mul-titude of neural representations behind multisensory “socialnorm” processing. Frontiers in Human Neuroscience, 12, 1–14.https://doi.org/10.3389/fnhum.2018.00153.
Popov, V., Ostarek, M., Tenison, C. (2018). Practices and pitfallsin inferring neural representations. NeuroImage, 174, 340–51.https://doi.org/10.1016/j.neuroimage.2018.03.041.
Ritchie, J.B., Bracci, S., Op de Beeck, H. (2017). Avoiding illusoryeffects in representational similarity analysis: what (not) todo with the diagonal. NeuroImage, 148, 197–200. https://doi.org/10.1016/j.neuroimage.2016.12.079.
Salmela, V., Salo, E., Salmi, J., Alho, K. (2018). Spatiotemporaldynamics of attention networks revealed by representationalsimilarity analysis of EEG and fMRI. Cerebral Cortex, 28(2),549–60. https://doi.org/10.1093/cercor/bhw389.
Stolier, R.M., Freeman, J.B. (2016). Neural pattern similarityreveals the inherent intersection of social categories. NatureNeuroscience, 19(6), 795–7. https://doi.org/10.1038/nn.4296.
Stolier, R.M., Hehman, E., Freeman, J.B. (2018a). A dynamicstructure of social trait space. Trends in Cognitive Sciences, 22(3),
197–200. https://doi.org/10.1016/j.tics.2017.12.003.Stolier, R.M., Hehman, E., Keller, M.D., Walker, M., Freeman, J.B.
(2018b). The conceptual structure of face impressions. Pro-ceedings of the National Academy of Sciences, 115(37), 9210–5.https://doi.org/10.1073/pnas.1807222115.
Tamir, D.I., Thornton, M.A., Contreras, J.M., Mitchell, J.P. (2016).Neural evidence that three dimensions organize mental state
representation: rationality, social impact, and valence. Pro-ceedings of the National Academy of Sciences, 113(1), 194–9. https://doi.org/10.1073/pnas.1511905112.
Thornton, M.A., Tamir, D.I. (2017). Mental models accuratelypredict emotion transitions. Proceedings of the NationalAcademy of Sciences, 114(23), 5982–7. https://doi.org/10.1073/pnas.1616056114.
Thornton, M.A., Weaverdyck, M.E., Mildner, J.N., Tamir, D.I.(2019a). People represent their own mental states moredistinctly than those of others. Nature Communications, 10(1),1–9. https://doi.org/10.1038/s41467-019-10083-6.
Thornton, M.A., Weaverdyck, M.E., Tamir, D.I. (2019b). Thebrain represents people as the mental states they habituallyexperience. Nature Communications, 10(1), 1–10. https://doi.org/10.1038/s41467-019-10309-7.
Troche, J., Crutch, S., Reilly, J. (2014). Clustering, hierarchicalorganization, and the topography of abstract and concrete
nouns. Frontiers in Psychology, 5(360), 1–10 . https://doi.org/10.3389/fpsyg.2014.00360.
Urgen, B.A., Pehlivan, S., Saygin, A.P. (2019). Distinct repre-sentations in occipito-temporal, parietal, and premotor cortexduring action perception revealed by fMRI and computationalmodeling. Neuropsychologia, 127, 35–47. https://doi.org/10.1016/j.neuropsychologia.2019.02.006.
Vida, M.D., Nestor, A., Plaut, D.C., Behrmann, M. (2017).Spatiotemporal dynamics of similarity-based neural rep-resentations of facial identity. Proceedings of the NationalAcademy of Sciences, 114(2), 388–93. https://doi.org/10.1073/pnas.1614763114.
Visser, R.M., Scholte, H.S., Beemsterboer, T., Kindt, M. (2013). Neu-ral pattern similarity predicts long-term fear memory. NatureNeuroscience, 16(4), 388–90. https://doi.org/10.1038/nn.3345.
Volz, L.J., Welborn, B.L., Gobel, M.S., Gazzaniga, M.S., Grafton,S.T. (2017). Harm to self outweighs benefit to others in moral
decision making. Proceedings of the National Academy of Sciences,114(30), 7963–8. https://doi.org/10.1073/pnas.1706693114.
Wagner, D.D., Chavez, R.S., Broom, T.W. (2018). Decoding theneural representation of self and person knowledge withmultivariate pattern analysis and data-driven approaches.Wiley Interdisciplinary Reviews: Cognitive Science, 10, 1–19. https://doi.org/10.1002/wcs.1482.
Walther, A., Nili, H., Ejaz, N., Alink, A., Kriegeskorte, N.,Diedrichsen, J. (2016). Reliability of dissimilarity measures formulti-voxel pattern analysis. NeuroImage, 137, 188–200. https://doi.org/10.1016/j.neuroimage.2015.12.012.
Wang, Y., Collins, J.A., Koski, J., Nugiel, T., Metoki, A., Olson,I.R. (2017). Dynamic neural architecture for social knowledge
retrieval. Proceedings of the National Academy of Sciences, 114(16),E3305–14. https://doi.org/10.1073/pnas.1621234114.
Wasserman, E.A., Chakroff, A., Saxe, R., Young, L. (2017).Illuminating the conceptual structure of the space ofmoral violations with searchlight representational similarityanalysis. NeuroImage, 159, 371–87. https://doi.org/10.1016/j.neuroimage.2017.07.043.
Woo, C.W., Koban, L., Kross, E., et al. (2014). Separate neuralrepresentations for physical pain and social rejection. NatureCommunications, 5, 1–12. https://doi.org/10.1038/ncomms6380.
Wurm, M.F., Caramazza, A., Lingnau, A. (2017). Action cate-gories in lateral occipitotemporal cortex are organized alongsociality and transitivity. The Journal of Neuroscience, 37(3),562–75. https://doi.org/10.1523/jneurosci.1717-16.2017.
Dow
nloaded from https://academ
ic.oup.com/scan/advance-article-abstract/doi/10.1093/scan/nsz099/5693905 by Tem