www.parliament.uk/commons-library | intranet.parliament.uk/commons-library | [email protected] | @commonslibrary BRIEFING PAPER Number 06455, 8 May 2018 A guide to the EU budget By Matthew Keep Inside: 1. EU Budget: spending 2. EU Budget: revenue 3. Negotiating the 2021-2027 budget 4. Member States’ contributions and receipts
Summary In 2015 the EU spent €140 billion. This is equivalent to around 1% of national income across the EU’s Member States. The majority of the EU’s spending goes on policies aimed at supporting farming and agriculture and improving Member States’ economies and competitiveness.
This briefing includes only limited analysis of what the UK contributes to the EU budget and receives from it. Our briefing The UK’s contribution to the EU budget goes into more detail on the subject.
EU spending
The EU plans its spending in ‘financial frameworks’ that generally span seven years. The current framework runs from 2014 to 2020. The framework sets out the maximum the EU can spend each year and allocates spending to broad priorities. However, the framework isn’t a budget covering several years – the EU’s annual budgets are negotiated each year by the European Commission, the Council of Europe and the European Parliament within the limits set by the financial framework.
Over 40% of the €140 billion spent by the EU in 2015 went on its agricultural policies. Subsidies were provided to farmers – which is the EU’s biggest single spending area – and funding was provided to improve rural economies and farming’s productivity. A further 40% or so of the EU’s spending went to programmes aimed at improving the economies of the EU’s poorer regions and countries and improving competitiveness in all EU regions.
The EU’s revenues
The EU must run a balanced budget, its revenues must cover its spending.
The EU’s largest source of revenue are the contributions made by Member States. Member States contribute a share of their adjusted VAT receipts and their Gross National Income (GNI) to the EU. They also collect customs tariffs on behalf of the EU. Member States’ GNI contributions made up close to 70% of EU revenues in 2015.
The EU receives a small proportion of its revenues from other sources such as taxes on EU staff salaries, non-EU countries’ contributions to programmes, interest on late payments, and fines on companies breaching competition law etc.
The UK’s rebate
The UK receives a rebate on its contribution. The rebate was introduced, in 1985, to correct for the fact that the UK was making relatively large contributions to the EU budget but receiving relatively little receipts from it. The rebate is a permanent part of the EU’s revenue regulations. It can only be changed if all Member States, including the UK, agree.
The 2021 – 2027 budget plan
The European Commission has published proposals for EU spending and revenue raising for 2021-2027. This begins negotiations over the next financial framework.
Member States’ contributions to the EU budget and receipts they receive from it
Generally speaking, the richer Member States are net contributors to the EU budget – they contribute more to the budget than they receive from it. Poorer states are generally net recipients – they receive more from the EU budget than they pay in. In keeping with this, the UK made the third largest net contribution to the EU budget in absolute terms, and the sixth largest net contribution per head of population.
• The EU plans its spending over seven-year periods in Multiannual Financial Frameworks (MFFs).
• The MFF is not a budget spanning several years – it sets out maximum amounts that the EU can spend on its priorities. It aims to ensure that the EU’s spending evolves in line with its policies.
• The current MFF covers the years 2014 to 2020. It allows the EU to commit to spend €960 billion (2011 prices) over the period. This is a real terms reduction on the previous MFF 2007-13 of 3.5%.
• MFF 2014-20 allocates around 40% of the EU’s spending to agricultural programmes and 47% to programmes that focus on economic growth, jobs, competitiveness and cohesion.
• The EU has begun negotiations over the next MFF: MFF 2021-2027. Section 3 of this briefing discusses negations.
Annual budgets
• Each year an annual budget is negotiated by the European Commission, the Council and European Parliament. The budget is negotiated within the spending limits set out in the MFF.
• In 2015 the EU’s largest spending programmes focused on subsidies to farmers (32% of total spending), structural funds to improve regional economies (26%), cohesion funds for Member States with lower living standards (9%), funding to develop rural economies (8%) and research and development through the Horizon 2020 programme (7%).
1.1 Planning the EU’s spending: the Multiannual Financial Framework (MFF)
The EU plans its spending over seven-year periods through the Multiannual Financial Framework (MFF).1 The MFF broadly sets out maximum EU spending across different categories. It also sets an overall maximum for the amount of actual payments the EU can make in a year.
The MFF is not a budget spanning several years, but instead provides a framework for the annual budgets that are negotiated each year. It aims to ensure that the EU’s spending evolves in line with its policies.
The MFF is negotiated by the European institutions (see Box 1) and requires unanimous agreement at the European Council – which means each Member States’ head of government must agree to it – and agreement by the European Parliament.
MFF 2014-20 The current MFF covers the years 2014-2020. It allows the EU to commit to spend up to €960 billion over the period and make payments of €908 billion (2011 prices).2 This spending is equivalent to around 1% of
1 The MFF must cover a period of at least five years. 2 These figures do not include revisions to the MFF. For more on these see appendix 1.
The EU plans its spending in the seven year multiannual financial framework (MFF).
The MFF isn’t a budget spanning several years. It provides a framework for the EU’s annual budgets to be negotiated in.
5 A guide to the EU budget
the Gross National Income (GNI) of the whole EU.3 The Institute for Fiscal Studies (IFS) – an economic think tank – notes that this spending is a relatively small component of public spending within the EU.4 In comparison, the UK government’s public spending is equivalent to around 35-40% of GDP.5
The maximum spending allowed in MFF 2014-20 is lower in real terms (after adjusting for inflation) than in its predecessor, MFF 2007-13. This is the first time that spending has fallen from one MFF to the next.6
Under MFF 2014-20 the majority of the EU’s spending falls into two broad categories:
• 47% for ‘smart and inclusive growth’, which includes programmes that aim to achieve the EU’s aims for economic growth, jobs, competitiveness and cohesion.
• 39% for agricultural programmes under the category of ‘sustainable growth: national resources’
Section 1.2 discusses these broad categories in greater detail.
Chart 1. MFF 2014-20 spending categories, % of total
The MFF is negotiated at the same time as the EU negotiates how it will raise revenues to pay for its spending. However, the two are set out in separate regulations (see Box 2). Appendix 1 provides further information on MFF 2014-20 negotiations, subsequent revisions and its mid-term review. Section 3 discusses ongoing negotiations over MFF 2021-2027.
3 GNI is a measure of economic output which values goods and services produced by
the residents of a country. It differs from GDP because it includes income such as dividend and interest payments received from other countries, less similar payments made abroad. GNI measures output produced by residents of a country, regardless of whether they are produced in the country or not.
4 IFS. The budget of the European Union: a guide, 6 April 2016, page 6 5 Office for Budget Responsibility, Public finances databank 6 Council of the European Union News Release PRESSE 439, Council adopts the
multiannual framework 2014-2020, 2 December 2013
0%
10%
20%
30%
40%
50%
Smart andinclusive growth
Sustainablegrowth: natural
resources
Administration Global Europe Security andcitizenship
After adjusting for inflation, spending in MFF 2014-20 will be lower than during its predecessor, MFF 2007-13.
European Council The European Council is the highest-level decision-making forum in the EU, consisting of the heads of state or government of the Member States, together with the Presidents of the European Council and the European Commission. The European Council gives the EU its ultimate political direction, which it does by adopting ‘conclusions’ at the end of its meetings. The European Council has no powers to pass laws. It adopts conclusions on the Multiannual Financial Framework. European Commission (the Commission) The European Commission is the executive of the EU: it proposes legislation and implements policy within the competences laid down by the EU Treaties. It produces drafts of the MFF and annual budget. There are 28 members, one from each Member State, known as Commissioners. The Commission has the following general functions: policy-making; Treaty guardianship; policy implementation and delegated powers; management of EU funds; representation in trade negotiations and other agreements with third countries. The Council of the European Union (the Council) The Council is made up of ministers of the governments of Member States. It is one of the two principal legislative and decision-making bodies of the EU, along with the European Parliament. It also shares responsibility with the Parliament for setting the EU’s annual budget. It is headed by a rotation of Member States which act as its President, otherwise known as the Presidency of the Council of the EU. The composition of the Council varies according to the business under discussion. For example the Economic and Affairs (Ecofin) Council gathers finance ministers to discuss economic policy. European Parliament The European Parliament is the assembly of elected representatives of EU citizens. The representatives are known as Members of the European Parliament (MEPs). The European Parliament debates and passes law; scrutinises other EU institutions; and debates and adopts the EU’s budget.
1.2 The annual budget Each year the European Commission, the Council and European Parliament negotiate the EU’s annual budget within the framework set out by the MFF. The process is described in appendix 2. The annual budget fleshes out the EU’s spending for the year.
Spending in 2015 During 2015 the EU spent around €140 billion across five broad budget categories. Over half of the EU’s spending either went directly to farmers or to programmes that help the least economically developed EU countries and regions.
Most significant items of spending
The EU’s largest individual spending item is the direct payments it makes to farmers. Around 30% of the EU’s spending in 2015 went on these subsidies that support farmers to have a decent standard of living and consumers to have a stable and safe food supply at affordable prices.
The second largest spending area are the EU’s programmes that help the least economically developed EU countries and regions to catch up with the other Member States. These ‘structural funds’, individually known as the European Regional Development Fund and European Social Fund, accounted for over 25% of EU spending in 2015. The funds redistribute funding from richer counties and regions to poorer regions and countries, although all countries receive some funding.
The EU spent close to €140 billion in 2015.
The EU’s largest spending area is direct payments to farmers.
7 A guide to the EU budget
Spending by budget category
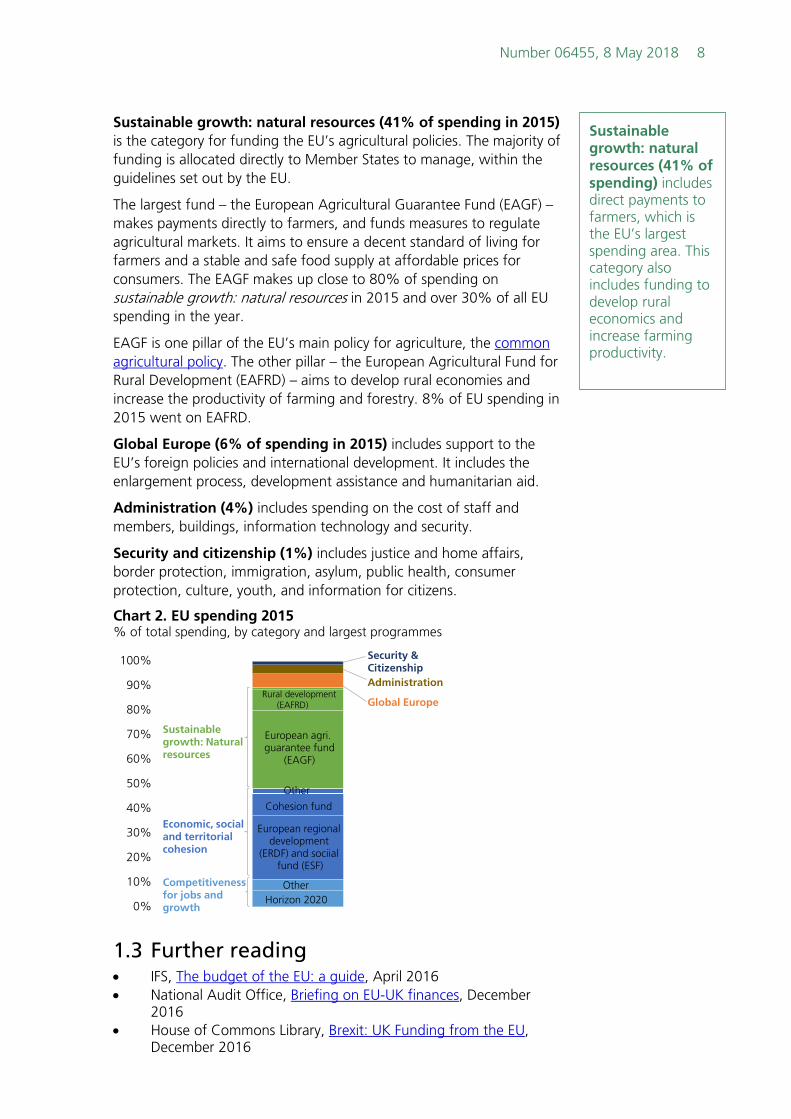
Smart and inclusive growth (47% of spending in 2015) is split into two categories of spending:
(a) competitiveness for growth and jobs (11% of 2015 spending)
This includes programmes aimed at research and innovation, education and training, trans-European networks in energy, transport and telecommunications, infrastructure policy, support for businesses and satellite navigation systems.
Funds in this category are largely managed by the Commission. Organisations interested in participating in the programmes apply directly to the Commission for funding, often on a competitive basis.
The largest programmes under competitiveness for growth and jobs are Horizon 2020, Connecting Europe Facility and Erasmus+:
• Horizon 2020 made up over half of spending under competitiveness for growth and jobs in 2015. Horizon 2020 is the EU’s fund for research and innovation. Universities and research laboratories are typical recipients of funding.
• Connecting Europe Facility (CEF) provides funding for infrastructure investment. The funds support development of trans-European networks in transport, energy and digital services.
• Erasmus+ supports education, training, youth and sport. It aims to boost skills and employability as well as modernising education, training and youth work. It provides opportunities for Europeans to study, train, gain work experience and volunteer abroad.
(b) economic, social and territorial cohesion (37% of spending in 2015)
This includes programmes that help the least economically developed EU countries and regions to catch up with the other Member States. The vast majority of funding is allocated directly to Member States to manage within the guidelines set out by the EU. All Member States receive some funding, but those with a greater concentration of less-developed regions receive relatively more.
The main programmes under economic, social and territorial cohesion include the European Regional Development Fund (ERDF), European Social Fund (ESF) and the Cohesion Fund. The first two of these funds – collectively known as ‘structural funds’ – make up over 70% of spending on economic, social and territorial cohesion in 2015 and over 25% of all EU spending in the year. The ERDF supports local economic growth, focussing on small and medium-sized enterprises, research and innovation and a low-carbon economy. The ESF funds training and skills projects aiming to improve employment and education opportunities.
The cohesion fund is aimed at Member States whose living standards – as measured by Gross National Income per person – are less than 90% of the EU average. The UK does not qualify for this fund. The cohesion fund is aimed at developing transport and the environment.
Competiveness for growth and jobs (11% of EU spending) includes the EU’s research and innovation programme (Horizon 2020), funding for infrastructure investment (Connecting Europe Facility) and support for education, training, youth and sport (Erasmus+).
Economic, social and territorial cohesion (37% of EU spending) includes funding to develop regional economies (structural funds) and funding aimed at the Member States with lower living standard (cohesion funds).
Number 06455, 8 May 2018 8
Sustainable growth: natural resources (41% of spending in 2015) is the category for funding the EU’s agricultural policies. The majority of funding is allocated directly to Member States to manage, within the guidelines set out by the EU.
The largest fund – the European Agricultural Guarantee Fund (EAGF) – makes payments directly to farmers, and funds measures to regulate agricultural markets. It aims to ensure a decent standard of living for farmers and a stable and safe food supply at affordable prices for consumers. The EAGF makes up close to 80% of spending on sustainable growth: natural resources in 2015 and over 30% of all EU spending in the year.
EAGF is one pillar of the EU’s main policy for agriculture, the common agricultural policy. The other pillar – the European Agricultural Fund for Rural Development (EAFRD) – aims to develop rural economies and increase the productivity of farming and forestry. 8% of EU spending in 2015 went on EAFRD.
Global Europe (6% of spending in 2015) includes support to the EU’s foreign policies and international development. It includes the enlargement process, development assistance and humanitarian aid.
Administration (4%) includes spending on the cost of staff and members, buildings, information technology and security.
Security and citizenship (1%) includes justice and home affairs, border protection, immigration, asylum, public health, consumer protection, culture, youth, and information for citizens.
Chart 2. EU spending 2015 % of total spending, by category and largest programmes
1.3 Further reading • IFS, The budget of the EU: a guide, April 2016 • National Audit Office, Briefing on EU-UK finances, December
2016 • House of Commons Library, Brexit: UK Funding from the EU,
December 2016
0%
10%
20%
30%
40%
50%
60%
70%
80%
90%
100%
Horizon 2020OtherCompetitiveness
for jobs and growth
Economic, socialand territorialcohesion
European regionaldevelopment
(ERDF) and sociial fund (ESF)
Cohesion fund
Other
Sustainablegrowth: Naturalresources
European agri. guarantee fund
(EAGF)
Rural development (EAFRD)
Security &CitizenshipAdministration
Global Europe
Sustainable growth: natural resources (41% of spending) includes direct payments to farmers, which is the EU’s largest spending area. This category also includes funding to develop rural economics and increase farming productivity.
Revenues • The EU must run a balanced budget: it therefore needs to raise at least enough revenue to covers
its spending.
• The vast majority of the EU’s revenue comes from Member States’ contributions. In 2015: ─ 13% of EU revenue came from custom duties and sugar levies collected by Member
States. ─ 12% of EU revenue come from contributions related to an adjusted measure of Member
States’ VAT-bases. ─ 69% of EU revenue came from contributions based on Member States’ national income
(as measured by gross national income). The remainder of the EU’s revenue in 2015 came from other sources such as interest on late payments, and fines on companies breaching competition law. The EU also used revenues it didn’t spend in 2014.
The UK’s rebate • The UK receives a rebate on its net contribution to the EU. This is the most famous exception to
the rules governing how Member States contribute to the EU.
• The rebate was introduced in 1985 to lower the UK’s net contribution which was relatively high.
• The UK’s rebate is included in the EU’s regulation for determining Member States’ contributions. It can only be changed if all Member States – including the UK – agree.
2.1 Member States’ contributions: own resources
The EU isn’t able to borrow, it therefore needs to raise at least enough revenue to covers its spending.
Member states’ contributions make up the vast majority of the EU’s revenue.7 Member States contribute through three sources, which are collectively known as ‘own resources’:
• customs tariffs and sugar levies • contributions based on a measure of the VAT-base • GNI-based contributions
Customs tariffs and sugar levies The EU is a customs union with goods coming into the union paying the same tariff irrespective of which Member State they are imported into. Member States collect the tariffs on the behalf of the EU, and these are seen as a natural source of funding for the EU Budget.
Member States pass tariffs collected to the EU but keep 20% to cover their cost of collection. The Institute for Fiscal Studies say that this is a
7 As stipulated in Article 311 Treaty on the Functioning of the European Union
Customs tariffs and levies made up 13% of EU revenues in 2015.
large proportion, given that the average collection costs for taxes are a small fraction of this.8
A very small proportion of revenues (less than 1%) come from a production charge paid by sugar producers. The levy recovers part of the cost of subsidising the export of surplus EU sugar onto the world market.
Belgium and the Netherlands make disproportionately large contributions from custom tariffs.9 This is because many of the goods coming into the EU do so through Belgian or Dutch ports and are collected at the point of entry. This doesn’t mean that the citizens of these countries are paying disproportionately more however since the goods on which the tariffs are paid will also be consumed by residents of other EU countries.
VAT based contributions Member States contribute 0.3% of their adjusted, or harmonised, VAT-base to the EU budget. 10 The adjustment is discussed below.
All Member States are obliged to have a VAT that conforms to requirements set out by the EU. In practice many Member States have obtained exemptions to the requirements and have choices over whether to tax certain products. This means the extent of Member States’ VAT base can be quite different.
Due to the divergence in VAT bases the EU doesn’t require Member States to contribute a proportion of their actual VAT-base. Instead the EU harmonises each Member States’ VAT-base and applies a rate to their harmonised VAT-base. The harmonised base represents what each Member States’ VAT-base would be if they followed the EU’s VAT requirements.
Some Member States’ harmonised VAT base are large relative to their national income. To lower the burden on these States their VAT contribution is capped. If the harmonised VAT base is more than 50% of a Member State’s GNI then the contribution is capped at 0.15% of their GNI.
GNI based contributions The GNI based contribution is used as a balancing item to ensure Member States’ contributions are sufficient to cover the EU’s spending. Each Member State pays the same proportion of its GNI to the EU budget. The proportion is set at a level that raises enough revenue to
8 Institute for Fiscal Studies. The budget of the European Union: a guide, April 2016,
page 2 9 In 2015 Belgium made contributions of €159 per head of population, and the
Netherlands €129 per head from customs duties and levies. The average across EU Member States was €37 per head of population.
10 For 2014 – 2020 Germany, the Netherlands and Sweden will pay a reduced rate of 0.15%
VAT based contributions made up 12% of EU revenues in 2015
GNI based contributions made up 69% of EU revenues in 2015.
make up the difference between the EU’s planned spending and what it expects to raise from all other sources.
In 2015, Member States contributed 0.66% of their GNI to balance the EU’s budget.11
2.2 Other revenues and surplus The EU receives other revenues outside of Member States’ contributions. Contributing around 5% of EU revenues in 2015, other revenues include taxes on EU staff salaries, contributions from non-EU countries to certain programmes, interest on late payments, and fines on companies breaching competition law etc.
While the EU cannot spend more than its revenues, there may be unspent revenues at the end of the year. Such surpluses can be used in the following year. 1% of EU revenues in 2015 came from 2014’s surplus.
Box 2: EU regulation on Member States’ contributions and the MFF
Details of how Member States contribute to the EU budget are laid out in the EU’s Own Resources Decision (ORD). 12 The regulation is negotiated at the same time as the Multiannual Financial Framework (MFF) – which as discussed in section 1, sets out the EU’s spending plans – but the two are set out in different regulations. The MFF is set out in a council regulation of 2 December 2013. A new ORD was adopted by the Council on 26 May 2014 and entered into force on 1 October 2016. 13 There is a time lag between the ORD being adopted and entering into force because each Member State must approve changes to the ORD. The European Union (Finance) Act 2015 provided the UK Parliament’s approval. 14 The new ORD:
• Lowered the proportion of customs duties that Member States could keep to cover collection costs to 20%. Previously it was 25%.
• Provided Denmark (€130 million), the Netherlands (€695 million), and Sweden (€185 million) with gross reductions in their annual GNI contribution. Austria will benefit from reductions up to 2016 of €30 million in 2014, €20 million in 2015, and €10 million in 2016.
• Reduced the VAT call rate – the percentage applied to the harmonised VAT-base – for Germany, the Netherlands and Sweden for the period 2014-20 only. Over the period their call rate shall be 0.15% compared to 0.3% for all other Member States.
The UK receives a rebate to lower its net contribution to the EU budget (see section 2.3). Since being introduced the rebate has been included in the ORD. The new ORD makes no substantive changes to the rebate calculation, but removes some provisions from the regulations which expired at the end of 2013.
11 European Commission, EU budget 2015: financial report, 2016 12 Council of the European Union, Council Decision of 7 June 2007 on the system of
the European Communities’ own resources, OJ L 163, 23.6.2007 13 Council of the European Union, Council decision on the system of own resources of
the European Union 2011/0183 (CNS), 12 February 2014 14 The Library produced a briefing for second reading of the European Union (Finance)
Bill 2015-16.
6% of EU revenues came from sources other than Member States, including 1% which came from a surplus in 2014’s revenues.
2.3 The UK’s rebate There are exceptions to the rules on how Member States contribute to the EU budget. The UK’s rebate on its net contributions is perhaps the most famous.15 The rebate was worth between £3 billion and £4.9 billion to the UK between 2010 and 2016.
The rebate was introduced to address the issue of the UK making relatively larger net contributions than other Member States. When the rebate was introduced, in 1985, the UK received relatively little from the EU budget: it had a small agricultural sector, but most EU spending went on agriculture.16 At the same time the UK made relatively high contributions to the budget, despite being among the less well-off Member States at the time.
The UK’s rebate is included in the regulation that determines how Member States contribute to the EU budget (the own resources decision, see Box 2). This has essentially made the rebate permanent: it can only be changed if all Member States, including the UK, agree.
How does the rebate work? Broadly speaking the formula used means that the UK’s net contribution is reduced by 66%, relative to what it would be without rebate.17 However, certain parts of the EU’s spending are excluded from the deduction, including EU overseas aid, and non-agricultural spending in new Member States that joined the EU after April 2004. This final exclusion was introduced to ensure that the UK contributed to the costs of enlarging the EU.
The basic concept of the rebate has remained the same since its inception, but changes to its calculation have been made over time as the EU and its methods for raising revenues have changed. The changes aim to keep the calculation similar to what it would have been had the overall system not changed since 1985. The Commission calculates the rebate on the basis of its estimates of the likely outturn for payments from the budget in-year and its estimates of Member States’ contributions to the budget. These are then corrected in light of actual outturn figures. Corrections may be made up to three years after the year to which the rebate relates, after which a final reckoning is made in the fourth year. The rebate is deducted from the UK’s contribution a year in arrears.
Who pays for the rebate? The other Member States cover the cost of the UK’s rebate. The cost of the rebate is based on each states’ share of EU GNI, but Germany, the
15 The European Parliament Research Service’s briefing The UK 'rebate' on the EU
budget discusses other correction mechanisms that favour other Member States. 16 Or European Economic Community as it was then known 17 The rebate is calculated by taking the difference between the UK’s percentage share
of contributions to the EU and the UK’s percentage share of EU receipts, multiplying this figure by 0.66 and then multiplying it by total spending.
The UK’s rebate was introduced in 1985 as the UK was making relatively larger net contributions than other Member States.
The rebate is deducted from the UK’s VAT contribution a year in arrears.
Netherlands, Austria and Sweden only pay one quarter of their amount due. The cost of the reductions for Germany, the Netherlands, Austria and Sweden are met by the other Member States.
Box 3: Origins of the rebate
When the UK joined the then-European Economic Community (EEC) in 1973 the UK’s net contribution was high. The UK received relatively little from the budget: it had a small agricultural sector, but most EEC spending went on agriculture. At the same time the UK made relatively high contributions to the budget, despite at the time being among the less well-off Member States. Temporary correction mechanisms to address the imbalance were introduced in 1975 and then 1979. In June 1984 – at a European Council meeting held at Fontainebleau – Member States agreed a specific rebate mechanism that remains largely similar to that used today.
Box 4: The future of EU finances
The EU has been looking at the future of its finances. Two significant pieces of work have been carried out to this end, both with one eye on the 2021 MFF, negotiations for which have now begun (see section 3). High Level group on own resources A group, chaired by former Italian Prime Minister and EU Commissioner Mario Monti, published a review of the own resources system in January 2017. The group was tasked with examining how EU revenues could become more transparent, fair, simple and democratically accountable. A series of recommendations were made by the group that will feed into negotiations over the next MFF and updates to the Own Resources Decision. The group’s report calls for reform on both sides of the EU budget: both spending and revenue. It recommends that there should be more EU revenues stemming from production, consumption and environmental policies. New revenues should, according to the group, alter the composition of the EU’s revenues rather than increase the total revenue available to the EU. The group is also keen that the overall costs and benefits of EU membership should be better reflected and that correction mechanisms should end. Further details are available in Appendix 1 of this briefing Reflection paper on the future of EU finances In June 2017, the Commission published a reflection paper on the future of EU finances. The paper was one of a series on the future of the EU. The reflection paper takes the conclusions and recommendations from Mr Monti’s high level group into account. The reflection paper highlights key principles for driving reform:
• Concentrating on the policy areas with the highest EU added value – that is where the EU can add value additional to the value created by individual Member States acting separately
• Simplifying rules so that EU citizens and businesses are not faced with excessive bureaucracy and red tape
• Ensuring that additional spending instruments outside of the EU Budget are kept to a minimum, so that accountability is increased and the EU Budget follows a democratic and transparent process.
• Strengthening flexibility within the stability of the MFF structure, so that the budget can respond to crises and unforeseen events
The paper analyses five possible scenarios for the future EU Budget: carrying on; doing less together; some do more; radical redesign; doing much more together. No view is taken as to which scenario is best for the EU, but the paper explains what each might mean for the budget and work of the EU. The implications of each scenario are summarised in a table accompanying the paper. The reflection paper concludes that the EU budget will change after 2020, ‘the status quo is not an option’. It goes onto say that the budget needs to be ‘simpler, more flexible, more streamlined and must enable more efficient spending.’
On 2 May 2018 the European Commission published proposals for future EU spending (Multiannual Financial Framework 2021-2027) and revenue raising (own resources). The Commission’s proposals are the starting point for negotiations that will include the European Parliament and the heads of EU Member States who make up the European Council. The Commission proposes spending of €1.13 trillion (in 2018 prices) over the seven years. The Commission say that in real terms – adjusted for inflation – the proposal is “comparable to the size of the current Financial Framework”. If inflation is ignored, the Commission’s proposal would result in spending under MFF 2021-2027 being higher than during MFF 2014-2020. The Commission proposes some rebalancing of the EU’s spending priorities. New and additional spending is proposed for priority areas – such as migration, research and innovation, security and defence and young people – while reduced spending is proposed in the traditional areas of agricultural policy and cohesion policy The Commission proposes changes to how the EU raises revenues. They propose introducing three new own resources, simplifying the revenue raised from VAT and reducing the share of customs duties Member States keep for collection costs. The UK’s withdrawal has led the Commission to propose phasing out all rebates.
3.1 European Commission’s proposals On 2 May 2018, the European Commission published a series of documents setting out their spending proposals for MFF 2021-2027, and how they will be funded.
The Commission’s proposals signal the start of negotiations that will include the European Parliament and the heads of the EU’s 27 Member States. All 27 Member States must agree to the final decisions reached on spending and revenues.
Spending: MFF 2021-2027 The Commission proposes commitments of €1.28 trillion (€1.13 trillion in 2018 prices) over the seven years. This level of spending is equivalent to around 1.11% of EU Gross National Income (GNI). This level of commitments translates into €1.25 trillion (€1.10 trillion in 2018 prices) in payments.
The Commission’s proposals are for MFF 2021-2027 to increase relative to MFF 2014-2020, in cash terms. The Commission say that after allowing for inflation MFF 2021-2027 is “comparable to the size of the current Financial Framework”.18 However, it is difficult to compare the
18 European Commission, The Multiannual Financial Framework for 2021-2027, 2 May
two MFFs, not least because the UK’s withdrawal affects spending, revenues and the size of EU GNI.
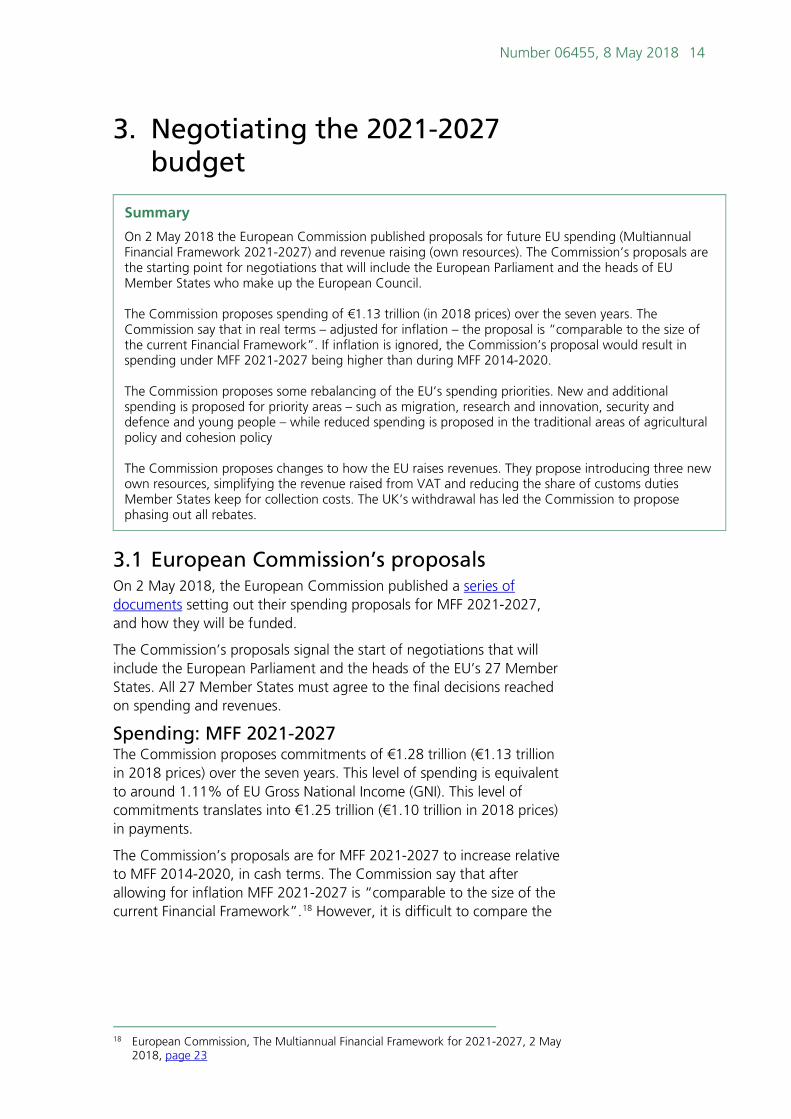
Chart 3 shows how the proposed commitments break down into the seven thematic spending priorities of MFF 2021-2027. The themes are broken down further into individual programmes in current prices and real prices in the Commission’s main proposal. The tables in Appendix 3 of this briefing shows the Commission’s proposals for each year of 2021-2027.
The Commission proposes some rebalancing of the EU’s spending priorities. New and additional spending is proposed for priority areas – such as migration, research and innovation, security and defence and
Chart 3. Multiannual Financial Framework 2021-2027, European Commission proposal, current prices
young people – largely funded through revenue raised from proposed changes to own resources. Reduced spending is proposed for some traditional programmes. The Commission wants to reduce spending on the Common Agricultural Policy and Cohesion policy by 5%. The Commission says that the UK’s withdrawal “requires reductions” in these areas as they “have the largest share of the EU budget”.19
The Commission’s other proposals include:
• bringing the European Development Fund – which provides economic assistance to developing countries in Africa, the Caribbean and the Pacific – into the EU Budget. It currently sits outside of the EU budget;
• reducing the number of EU programmes from 58 to 37; • creating a ‘Union Reserve’ to deal with unforeseen events and
emergencies; • introducing rules that would allow EU funding to be suspended,
reduced or restricted in areas where the rule of law is judged to be deficient
The individual programmes of MFF 2021-2027 MFF need to be established via separate legal bases under the Treaties. Specific proposals, including their budgetary allocation, will be presented in the coming weeks.
Revenues: own resources decision The own resources decision sets out how Member States contribute to the EU’s revenues. As is discussed in Box 2, the own resource decision (ORD) is negotiated alongside the MFF, but the two are set out in separate regulations.
The Commission proposes modernising existing own resources (customs duties, VAT-based and GNI-based contributions), introducing new own resources and phasing out rebates.
There is an annual ceiling on Member States own resources contributions. The ceiling is designed to provide Member States with predictability about their contributions. The Commission proposes increasing the ceiling to 1.29% of the EU-27 GNI in response to the UK’s withdrawal and the European Development Fund being brought into the EU Budget. The current ceiling is 1.20% of EU-GNI.
Modernising existing own resources
Currently Member States keep 20% of the customs duties they collect to cover costs (see section 2.1) – the Commission proposes reducing this share to 10%.
19 European Commission. A modern budget for a Union that protects, empowers and
The Commission proposes simplifying and streamlining the calculation of VAT-based contributions, bringing in an additional €25 billion per year.20
New own resources
The Commission proposes introducing new own resources:21
• 3% of each Member State’s Common Consolidated Corporate Tax Base (CCTB). The CCTB a proposal for a standardised EU approach to the calculation of the tax due on companies’ profits. The Commission estimate this 3% charge will raise €12 billion per year, once the CCTB is introduced;
• 20% of the auctioning revenue of the European Emissions Trading Scheme. The Commission estimate this may raise €3 billion per year
• a national contribution based on the amount of non-recycled plastic packaging waste in each Member State. The Commission estimate this may raise €7 billion per year based on a payment of €0.80 per kilo. The contribution will provide an incentive for Member States to reduce such waste.
The Commission estimate that in 2027 the introduction of the new own resources will contribute around 13% of EU own resources.
Phasing out rebates
A number of Member States benefit from corrections and rebates on their contributions. The largest and most well-known is the rebate the UK receives on its net contribution (see section 2.3).
The Commission suggests that the UK’s withdrawal provides an opportunity to address the “complicated system of rebates”. They propose phasing out all rebates over a period of five years.
Timing and procedure The Commission is keen for political agreement to be reached on MFF 2021-2027 promptly, saying that an early agreement “is not only political desirable. It is also a practical imperative.”22 The Commission state that late adoption of MFF 2014-2020 significantly delayed programmes’ start impacting on their achievement.23
The MFF and ORD require slightly different approvals. While both require each Member State’s approval (unanimity in the European Council):
• the European Parliament must give its consent to the MFF. The Parliament can approve or reject the Council’s position, but cannot amend it;
20 European Commission. Modernising the EU Budget’s revenue side, 2 May 2018 21 ibid 22 European Commission. MFF: Procedures and Timing, February 2018 23 ibid
• the European Parliament is only consulted over the ORD. The ORD requires ratification in Member States’ national parliaments.
19 A guide to the EU budget
4. Member States’ contributions and receipts
Summary
Generally speaking the EU budget is redistributive:
• richer Member States contribute more to the EU budget than they receive from it – they are net contributors to the budget.
• poorer Member States receive more from the EU budget than they contribute to it – they are net recipients from the budget
In 2016 the UK made the third largest net contribution to the EU budget in absolute terms, and the sixth largest net contribution per head of population.
Whether a Member State is a net contributor to, or net recipient from, the EU budget does not constitute an economic assessment of its membership of the EU. It simply considers the direct flows of contributions and receipts to and from the EU budget. An economic assessment of membership must consider all costs and benefits of EU membership, not just those directly related to the EU budget.
In 2016 the UK made the third largest net contribution to the EU budget in absolute terms, and the sixth largest net contribution per head of population. The UK’s net contribution was €9.6 billion, or €146 per head of population in 2016. The figures are based on the European Commission’s figures.
Box 5: Different ways to measure the UK’s net contribution
There are different ways of calculating the UK’s net contribution to the EU budget. Figures produced by HM Treasury, not discussed in this briefing, only include EU receipts that are allocated directly to the UK government to manage. The Commission’s data, used in this briefing, also includes funding that it allocates directly to UK organisations. HM Treasury also allocate payments to years differently to the European Commission. This briefing uses the Commission’s data as it is the only source which offers comparable data across Member States. There is more on this in the Library briefing The UK’s contribution to the EU budget.
The net contribution shouldn’t be confused with an assessment of the overall economic benefit, or cost, to the UK of being in the EU. The net contribution simply looks at the direct flows of contributions to the EU Budget from the UK and spending, or receipts, from the EU to the UK. It doesn’t, for instance, consider benefits to the UK exchequer from being a member of the single market. A number of bodies have attempted an economic cost-benefit analysis of the UK’s EU membership, some of which are discussed in section 6 of the Library’s briefing In brief: UK-EU economic relations.
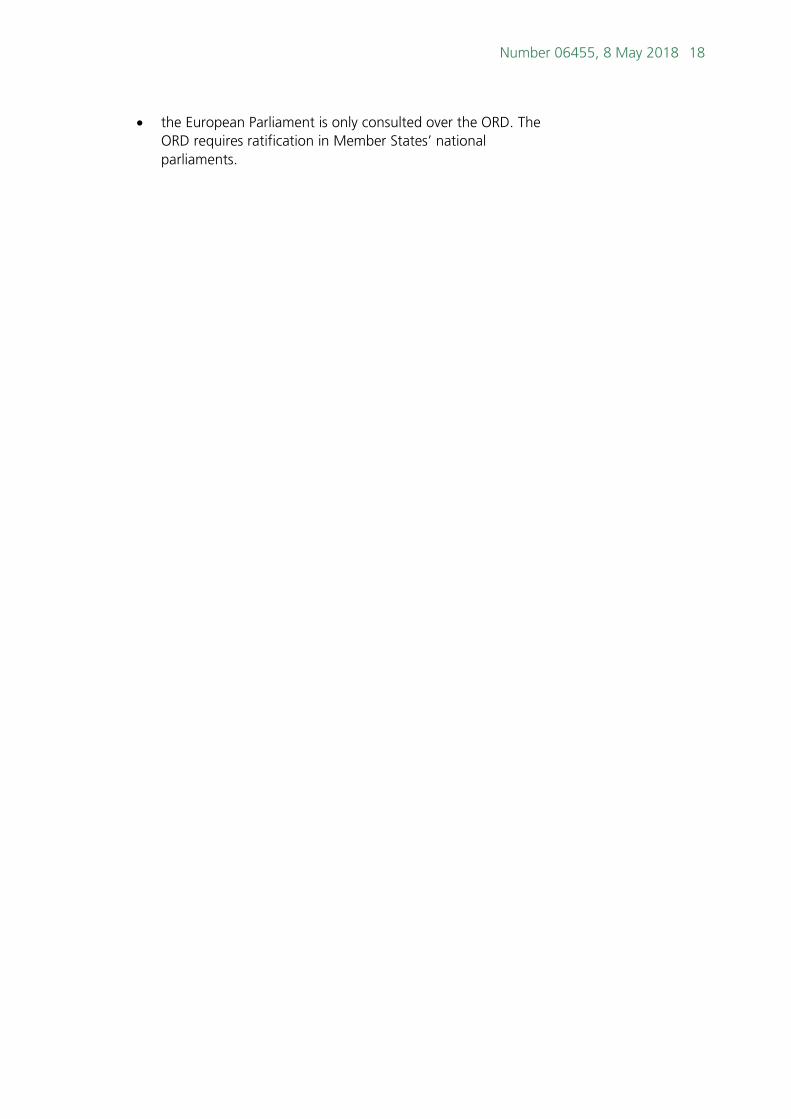
Generally speaking, the richer Member States are net contributors to the EU budget; in other words, they contribute more to the budget than they receive from it. As chart 3 shows, in absolute terms, Germany made the largest net contribution, followed by France and the UK. Per head of population Germany made the largest net contribution, followed by Denmark, France, Netherlands, Sweden and the UK, as shown in chart 4.
Poorer states are generally net recipients – they receive more from the EU budget than they pay in. The 16 states with the lowest GNI per head of population are all net recipients from the EU budget.
There are exceptions to the above statements. Most notably, given their relative economic prosperity, Belgium and Luxembourg are relatively large net recipients from the EU budget. This is largely because they are home to the EU’s headquarters and therefore receive large amounts of the EU’s administration spending. This spending doesn’t disproportionately benefit the citizens of Belgium and Luxembourg and needs to be taken into account when considering the extent to which the people of these countries benefit from the EU budget. The Institute for Fiscal Studies – an economic think tank – looked at the EU budget for 2014 and made some adjustments for the administrative spending. After the adjustments Luxembourg remained a net recipient, although to a much smaller extent, and Belgium became a net contributor.
Generally speaking, richer Member States contribute more to the EU budget than they receive from it. Poorer Member States receive more from the EU budget than they contribute to it.
21 A guide to the EU budget
notes: * since the EU’s headquarters are based in Luxembourg and Belgium these Member States receive large amounts of money from the EU. However, it isn’t correct to say that residents of these countries benefit disproportionately from this administrative expenditure. source: European Commission. EU expenditure and revenue 2014-2020
-30 -25 -20 -15 -10 -5 0 5 10 15
Poland
Romania
Greece
Hungary
Czech Republic
Slovakia
Bulgaria
Portugal
Luxembourg
Belgium
Lithuania
Latvia
Croatia
Estonia
Slovenia
Malta
Spain
Cyprus
Ireland
Finland
Denmark
Austria
Sweden
Netherlands
Italy
United Kingdom
France
Germany
Contributions Receipts
Chart 3. Member state contributions to the EU budget, receipts from the EU budget, and net contribution, 2016, € billion
notes: * since the EU’s headquarters are based in Luxembourg and Belgium these Member States receive large amounts of money from the EU. However, it isn’t correct to say that residents of these countries benefit disproportionately from this administrative expenditure. sources: European Commission. EU expenditure and revenue 2014-2020 Eurostat (demopjan)
-1,000 0 1,000 2,000 3,000
Luxembourg
Greece
Lithuania
Hungary
Slovakia
Estonia
Romania
Czech Republic
Bulgaria
Malta
Latvia
Poland
Portugal
Belgium
Croatia
Slovenia
Cyprus
Spain
Ireland
Italy
Finland
Austria
United Kingdom
Sweden
Netherlands
France
Denmark
Germany
Contributions Receipts
Chart 4. Member state contributions to the EU budget, receipts from the EU budget, and net contribution, 2016, € per head of population
Appendix 1: Multiannual financial framework – further details MFF 2014-20: negotiations When the Council adopted the MFF regulation on 2 December 2013 it brought to an end negotiations between the EU institutions which began two and a half years prior.24
Negotiations began with the Commission putting forward an initial draft proposal. Spending commitments in the adopted MFF regulation were 7.1% lower than in the Commission’s draft proposal.
European Commission
The Commission proposed a draft MFF Regulation in June 2011.25 The proposal froze spending limits at their 2013 level. Amendments were made in July 2012 to take into account Croatia's accession (scheduled for mid-2013), the Commission's new macroeconomic forecasts and new regional and national economic data.26 The amended draft proposed commitments of €1,033 billion and payments of €988 billion.
European Council
At a European Council meeting on 7-8 February 2013 political agreement was reached on the MFF regulation, as detailed in the meeting’s conclusions.27,28
The agreement set the spending limit for commitments at just under €960 billion. This is a real terms reduction of 3.5% compared with MFF 2007-13 and 7.1% below the Commission’s proposals.29 The agreement set a payments limit of €908 billion, 8.4% below the Commission’s proposals.
Political agreement reached
June 2013 saw the Presidents of the Commission, the European Parliament and the Council reach political agreement on an MFF package that confirmed the limits proposed by the European Council, and also included more flexibility for payments and commitments.30,31
24 The Council of the European Union COUNCIL REGULATION laying down the
multiannual financial framework for the years 2014-2020, 25 November 2013 25 COM(2011) 398 final, 29 June 2011 26 COM(2012) 388 final, 6 July 2012 27 European Council. 7/8 February 2013. Conclusions (Multiannual Financial
Framework), 8 February 2013 28 A previous meeting, held on 22- 23 November 2012, failed to reach agreement. 29 Council of the European Union website, Summary of the European Council
agreement, accessed 4 Mar 2013 30 European Commission Press Release, Political Agreement on EU’s Future Budget
2014 -2020, 27 June 2013 31 Further details of these flexibilities are available from the European Commission
On 19 November 2013, the European Parliament gave its consent to the MFF regulation32 paving the way for the Council to adopt the regulation on 2 December 2013.
The European Parliament gave its consent once conditions that it was concerned with, and had raised after the June 2013 political agreement, were met. The major conditions were for all outstanding bills for 2013 to be settled and a high-level group on own resources to be set up (see below).33
MFF 2014-20: revision The late adoption of the MFF 2014-20 meant that some of the funds allocated for 2014 were not able to be used in that year. The MFF has been revised, and adopted, to ensure that the programmes could be fully implemented in 2015.34
The programmes affected include: the European Regional Development Fund, the European Social Fund, the Cohesion Fund, the European Agricultural Fund for Rural Development, the European Maritime and Fisheries Fund, the Asylum, Migration and Integration Fund, and the Internal Security Fund (ISF).
MFF 2014-20: mid-term review The deal negotiated on the MFF included the promise of a review of MFF 2014-20 in 2016 at the latest. The review was to allow for a new European Parliament and Commission to reassess the MFF’s priorities, and potentially revise the MFF 2014-20 regulation.
The agreement reached35 between the Council and Parliament on the mid-term review sees additional support of around €6 billion for the MFF (15% redeployments, 85% unallocated resources). The amount is distributed between new objectives and some already existing spending programmes. €2.4 billion is for jobs and growth, and €3.9 billion is for migration and security.
There is more on the review in the following publications:
• European Parliament Research Service, 2014-2020 Multiannual Financial Framework (MFF): Mid-term revision, July 2017
• European Parliament, Multiannual Financial Framework, May 2017
32 European Parliament, European Parliament legislative resolution of 19 November
2013 on the draft Council regulation laying down the multiannual financial framework for the years 2014–
33 European Parliament, Long-term EU budget negotiations: EP sets out its stance, News Release ref: 20130312IPR06440, 13 March 2013
34 For further detail see: Council of the European Union press release, EU budget: Council preserves funds for promoting growth and jobs, 21 April 2015; and, European Parliament Research Service, Revision of the Multiannual Financial (Article 19, MFF Regulation) 23 March 2015
35 Council Regulation (EU, Euratom) 2017/1123 of 20 June 2017
Appendix 2: annual budget process The process Each year the EU’s annual budget is negotiated by the Commission, Council and European Parliament. The budget is negotiated within the spending limits set out in the MFF.
The process is set out in some detail below, but the Commission has summarised it in the below image.
Commission’s draft budget
The annual budget cycle begins with the Commission proposing a draft budget based on the MFF. The current MFF was set at 2011 prices and an adjustment is made at the beginning of each year to take account of changes in Gross National Income (GNI) forecasts, price changes and other ‘technical’ changes. €
The Commission must submit its draft budget to the Council and European Parliament by 1 September of the preceding year. In practice, the Commission aims to present the draft budget in April/May.
The Council’s and European Parliament’s reading
The Council adopts its position on the draft budget and passes it to the European Parliament before 1 October. The budget is then adopted if, within 42 days, the European Parliament either approves the Council’s position or does not take a decision. If the European Parliament does make amendments and these are accepted by the Council within 10 days then the budget can also be adopted.
Conciliation Committee
If agreement cannot be reached between the Council and the European Parliament a Conciliation Committee is set up, composed of the members of the Council or their representatives and an equal number of members representing the European Parliament. The Committee is tasked with reaching agreement on a joint text within a period of 21 days. If this fails then the Commission has to produce a new draft budget.
Once a joint text is agreed by the Conciliation Committee in early November, the Council and the European Parliament have 14 days to approve or reject it. The European Parliament may adopt the budget even if the Council rejects the joint text. If the Council and the European
Number 06455, 8 May 2018 26
Parliament both reject the joint draft or fail to decide, the budget is rejected and the Commission has to submit a new draft budget.
Failure to adopt a budget
If, at the beginning of the year, the budget has not yet been definitively adopted, the system of ‘provisional twelfths’ kicks in, essentially rolling over 1/12 of the previous year’s budget each month.
The annual budget: amending budgets
The Commission may during the year propose the adopted budget be amended; it does this by submitting draft amending budgets. Similarly the Commission may present a letter of amendment to the draft budget in the light of information which was not available when the draft was established.
27 A guide to the EU budget
The 2018 budget European Commission’s draft
The Commission presented the 2018 draft budget on 30 May 2017. The Commission proposals amounted to commitments of €160.6 billion and payments of €145.4 billion. These figures represent a 1.7% increase in commitments and an 8.1% decrease in payments in cash terms compared with the 2017 budget.3637
Council’s position
The Council formally adopted its position on the 2018 draft budget on 4 September 2017. The Council’s position is for commitments of €158.9 billion and payments of €144.4 billion. These figures – which are lower than Commission’s proposals – represent a 0.6% increase in commitments and a 7.4% increase in payments in cash terms compared with 2017.38
Parliament’s position
The Parliament adopted it position on 25 October 2017, calling for higher commitments (€162.6 billion) and payments (€146.7 billion) than in the Commission’s draft.39
Conciliation Committee
The Council informed the Parliament that it cannot accept all its amendments for the 2018 budget. This triggered a three-week conciliation period beginning on 31 October and ending on 20 November.
The Conciliation Committee reached agreement on commitments of €160.1 billion and total payments at €144.7 billion.40 The EU budget for 2018 was adopted on 30 November following the Council’s and Parliament’s go-ahead.41
36 European Commission Press Release, 2018 EU budget: Commission proposes budget
with focus on jobs, investments, migration and security, 30 May 2017 37 % changes include amending budgets 1 and 2 for 2017. Data are from EU’s draft
general budget of the EU for the financial year 2018, 7 July 2017, page 27 38 European Council Press Release, Council agrees its position for the 2018 EU budget
and backs increase of 2017 EU budget, 12 July 2017 39 European Parliament resolution of 25 October 2017 on the Council position on the
draft general budget of the European Union for the financial year 2018 40 Includes amending letter 1. The amending letter reduces commitments by around
€0.3 billion and payments by around €0.1 billion. 41 Council Press Release, 2018 EU budget adopted
2018 budget negotiations Commission draft budget proposed commitments of €160.6bn and payments of €145.4bn. The Council proposed commitments of €158.9bn and payments of €144.4bn, an increase of 0.6% and 7.4% respectively on 2017. The Parliament proposed commitments of €162.6bn and payments of €146.7bn. Agreement was reached in conciliation committee with commitments of €160.1bn and payments of €144.7bn
The Commission presented the 2017 draft budget on 30 June 2016.42 The Commission proposals amounted to commitments of €157.7 billion and payments of €134.9 billion. These figures represent a 1.7% increase in commitments and a 6.2% decrease in payments in cash terms compared with the 2016 budget.43
Council’s position
The Council adopted its position on the 2017 draft budget on 12 September 2016. The Council’s position is for commitments of €156.4 billion and payments of €133.8 billion. These figures – which are lower than Commission’s proposals – represent a 0.9% increase in commitments and a 7.0% decrease in payments in cash terms compared with 2016.44
Parliament’s position
The Parliament adopted it position on 26 October 2016, calling for higher commitments (€162.4 billion) and payments (€138.0 billion) than in the Commission’s draft.45,46
Conciliation Committee
The Council informed the Parliament that it cannot accept all its amendments for the 2017 budget. This triggered a three-week conciliation period beginning on 28 October and ending on 17 November.
The Conciliation Committee reached agreement on commitments of €157.86 billion and total payments at €134.49 billion. The EU budget for 2017 was adopted on 1 December following the Council’s and Parliament’s go-ahead.47
42 European Commission, Draft General Budget 2017, June 2016 43 European Commission Press Release, Draft EU Budget 2017: Commission proposes a
budget focused on priorities - growth, jobs and a solid response to the refugee crisis, 30 June 2016 & House of Commons European Scrutiny Committee, Eight Report of Session 2016/17, HC71-vi, Chapter 2, 19 July 2016
44 European Council Press Release, EU budget for 2017: Council sets out its position, 12 September 2016
45 European Council Press Release, EU 2017 budget: Council cannot accept EP amendments, 26 October 2016.
46 Figures include appropriations for special instruments 47 Council Press Release, EU Budget for 2017
2017 budget negotiations Commission draft budget proposed commitments of €157.7bn and payments of €134.9bn. The Council proposed commitments of €156.4bn and payments of €133.8bn. The Parliament proposed commitments of €162.4bn and payments of €138.0bn. Agreement was reached in conciliation committee with commitments of €157.9bn and payments of €134.5bn
The 2016 budget On 14 November 2015, the Council and the European Parliament reached an agreement on the 2016 EU budget. Meeting in the Conciliation Committee they agreed to set commitments at €155.0 billion and payments at €143.9 billion.
European Commission’s draft
The Commission presented the 2016 draft budget on 27 May 2015.48 The Commission proposals amounted to commitments of €153.5 billion and payments of €143.5 billion; these figures represent a 5.2% decrease in commitments and a 1.6% rise in payments in cash terms compared with the 2015 budget.
The Council’s and European Parliament’s positions
The Council's position, adopted on 4 September, called for the draft budget to be reduced to €153.3 billion in commitments and €142.1 billion in payments.
On the other hand, the European Parliament called for increases to the draft budget. The Parliament’s position, adopted on 28 October 2015, called for an increase of total commitments to €157.4 billion and total payments to €146.5 billion. The Parliament’s positions were above the ceilings of the multiannual financial framework.49
Conciliation Committee
With the Council and European Parliament unable to agree, a Conciliation Committee was established on 29 October 2015. On 14 November 2015 an agreement was reached which sets commitments at €155.0 billion and payments at €143.9 billion.
On 24 November the Council approved the agreement. The budget for 2016 was adopted on 25 November, when the European Parliament confirmed the agreement.
48 European Commission, Draft General Budget 2016, May 2015 49 Council of the European Union Press release, Conciliation to start on 2016 EU
budget, 28 October 2015
2016 budget negotiations Commission draft budget proposed commitments of €153.5bn and payments of €143.5bn The Council proposed commitments of €153.3bn and payments of €142.1bn Parliament proposed commitments and payments of €157.4bn and payments of €146.5 billion Agreement was reached in conciliation committee with commitments of €155.0bn and payments of €143.9bn
The 2015 budget The 2015 annual budget was agreed in December 2014 following difficult negotiations between the European Parliament and the Council. Commitments are €145.3 billion and payments €141.2 billion;50 these figures represent a 1.8% increase in commitments and a 0.6% rise in payments in cash terms compared with the 2014 budget.
A major stumbling block for negotiations was a growing backlog in payments that have affected the EU budget in recent years. The Council wanted to cut the Commission's estimates of the resources needed. The European Parliament supported stepping up efforts to tackle the payments backlog, to reduce its negative consequences on beneficiaries of EU funds.
European Commission’s draft
The Commission presented the draft EU budget for 2015 in June 2014. The Commission proposed €145.6 billion in commitments, and payments of €142.1 billion.51 In cash terms these figures represent a 2.1% increase in commitments and a 1.4% rise in payments compared with budget 2014.
The Council’s and European Parliament’s positions
The Council agreed amendments to this draft budget in September 2014, proposing to reduce the Commission’s proposal for commitments to €145.1 billion and payments to €140.0 billion.52
50 Council of the European Union website:
http://www.consilium.europa.eu/en/policies/eu-annual-budget/eu-budget-2015/ 51 EC news release, 2015 EU draft budget to help Europe's economic growth despite
financial constraints, 11 June 2014; EC, Draft General budget of the European Union for the financial year 2015, 24 June 2014; and, European Scrutiny Committee, Fifth Report of Session 2014-15, 9 July 2014, HC 219-v 2014/15
52 Council news release, Council adopts position on 2015 EU budget, 2 September 2014
2015 budget negotiations Commission draft budget proposed commitments of €145.6bn and payments of €142.1bn The Council proposed commitments of €145.1bn and payments of €140.0bn Parliament proposed commitments and payments of €146.4bn Conciliation Committee failed to reach agreement. Commission proposed a new draft with commitments of €145.2bn and payments of €141.3bn Agreement reached with commitments of €145.3bn and payments of €141.2bn
In October 2014, the European Parliament provided its position,53 which would have set both commitments and payments to €146.4 billion.
Conciliation Committee and a new draft
With the Council and European Parliament unable to agree, a Conciliation Committee was established. On 17 November 2014 negotiations failed. The Commission presented a new draft budget for 2015 on 27 November 2014, trying to strike a balance between the positions adopted by the Council and the European Parliament. The new draft proposed commitments of €145.2 billion and payments of €141.3 billion. In cash terms these figures represent a 1.8% increase in commitments and a 0.7% rise in payments compared with budget 2014.54
Agreement
On 8 December 2014 negotiators from the European Parliament and the Council reached an agreement on the 2015 budget. The compromise saw commitments of €145.3 billion and payments of €141.2 billion. The deal reached also included some measures to address the payment backlog.55
53 European Parliament, European Parliament resolution of 22 October 2014 on the
Council position on the draft general budget of the European Union for the financial year 2015
54 EC press release, Budget 2015: Commission makes new proposal to Parliament and Council, 28 November 2014; EC Budget Online; European Scrutiny Committee, Twenty-Sixth Report of Session 2014-15, 10 December 2014, HC 219-xxv 2014/15
55 For further information see: European Parliament Research Service, The bumpy road to the 2015 EU budget, 11 December 2014.
The 2014 budget The 2014 annual budget was the first executed under MFF 2014-20.56 It was agreed in November 2013 following a Conciliation Committee. Commitments are €142.6 billion and payments €135.5 billion; both figures are 6.2% lower compared to the 2013 budget.
European Commission’s draft
The Commission presented the draft EU budget for 2014 in June 2013. The Commission proposed €142.0 billion in commitments and payments of €135.9 billion;57 both figures were 5.8% lower compared to the 2013 budget.
The Council’s and European Parliament’s positions
The Council agreed amendments to the draft budget in September 2013, proposing to reduce the Commission’s proposal for commitments to €141.7 billion and payments to €134.8 billion.58
In October 2013, the European Parliament provided its position,59 which would have set commitments to €142.6 billion and payments to €136.1 billion.
Agreement through Conciliation Committee
Agreement was reached through a Conciliation Committee in November 2013. The adopted 2014 EU budget provides for commitments of €142.6 billion and payments of €135.5 billion.60
56 Further details are available in EC. Financial Year 2014. Report on budgetary and
financial management 57 EC news release, Commission tables proposal in tune with today's Europe, 26 June
2013, and EC website 58 Council news release, Council adopts position on 2014 EU budget, 2 September
2013 59 European Parliament, European Parliament resolution of 23 October 2013 on the
Council position on the draft general budget of the European Union for the financial year 2014
60 2014/67/EU, Euratom: Definitive adoption of the European Union’s general budget for the financial year 2014
2014 budget negotiations Commission draft budget proposed commitments of €142.0bn and payments of €135.9bn The Council proposed commitments of €141.7bn and payments of €134.8bn Parliament proposed commitments of €142.6bn and payments of €136.1bn Agreement was reached through Conciliation Committee with commitments of €142.6bn and payments of €135.5bn.
Total outside the MFF ceilings 3,347 3,648 3,950 4,253 4,557 4,812 4,868 29,434
Total MFF + outside the MFF ceilings 170,068 177,341 183,313 187,145 191,604 198,555 200,816 1,308,843as a percentage of GNI 1.14% 1.15% 1.16% 1.14% 1.13% 1.14% 1.11% 1.14%
source:European Commission. The Multiannual Financial Framework for 2021 - 2027 COM(2018) 321 final
* The percentages are without prejudice to the ceiling set out in the Own Resources Decision in force** For the European Investment Stabilisation Function an interest rate subsidy will be provided through external assigned revenues equivalent to a Current prices are calculated by applying annually a fixed deflator of 2% to the amounts in 2018 prices.
OUTSIDE THE MFF CEILINGSSpecial Instruments:
notes:
The Multiannual Financial Framework 2021-2027 (commitments in current prices)
Total outside the MFF ceilings 3,153 3,370 3,577 3,776 3,967 4,107 4,073 26,023
Total MFF + outside the MFF ceilings 160,258 163,836 166,032 166,179 166,803 169,465 168,033 1,160,606as a percentage of GNI 1.14% 1.15% 1.16% 1.14% 1.13% 1.14% 1.11% 1.14%
source:European Commission. The Multiannual Financial Framework for 2021 - 2027 COM(2018) 321 final
* The percentages are without prejudice to the ceiling set out in the Own Resources Decision in force** For the European Investment Stabilisation Function an interest rate subsidy will be provided through external assigned revenues equivalent to a Current prices are calculated by applying annually a fixed deflator of 2% to the amounts in 2018 prices.
OUTSIDE THE MFF CEILINGSSpecial Instruments:
notes:
The Multiannual Financial Framework 2021-2027 (commitments in real 2018 prices)
BRIEFING PAPER Number 06455, 8 May 2018
The House of Commons Library research service provides MPs and their staff with the impartial briefing and evidence base they need to do their work in scrutinising Government, proposing legislation, and supporting constituents.
As well as providing MPs with a confidential service we publish open briefing papers, which are available on the Parliament website.
Every effort is made to ensure that the information contained in these publically available research briefings is correct at the time of publication. Readers should be aware however that briefings are not necessarily updated or otherwise amended to reflect subsequent changes.
If you have any comments on our briefings please email [email protected]. Authors are available to discuss the content of this briefing only with Members and their staff.
If you have any general questions about the work of the House of Commons you can email [email protected].
Disclaimer - This information is provided to Members of Parliament in support of their parliamentary duties. It is a general briefing only and should not be relied on as a substitute for specific advice. The House of Commons or the author(s) shall not be liable for any errors or omissions, or for any loss or damage of any kind arising from its use, and may remove, vary or amend any information at any time without prior notice.
The House of Commons accepts no responsibility for any references or links to, or the content of, information maintained by third parties. This information is provided subject to the conditions of the Open Parliament Licence.