19
A HAVI White Paper: Foodservice Supply Chain Maturity Model

A HAVI White Paper:
Foodservice Supply ChainMaturity Model
Supply Chain Maturity Models – the road maps designed to help organizations track the evolution of their supply chains from its most basic state to a highly sophisticated collaborative business function – are not new. Esteemed consulting organizations such as IBM, Booze Allen and Gartner have all developed supply chain maturity models. Their models are broad and high level which means their conclusions and recommendations can be applied across multiple industries, from manufacturing and healthcare to retail and government. Indeed, many of the world’s most recognized (and some of the less well recognized) brands have used these models to determine the current states of their supply chains and chart courses for performance improvement. The high-level value of these models is great, yet their broad applicability precludes the granularity and relevancy of a more industry-specific measurement tool.
In 2012, HAVI partnered with global research firm Technomic to conduct the first State of the Foodservice Supply Chain study. Leveraging the results of that study, its deep industry knowledge and experience managing some of the world’s largest quick service restaurant (QSR) supply chains, HAVI, with Technomic, developed the only Supply Chain Maturity Model focused exclusively on the foodservice industry, the HAVI Foodservice Supply Chain Maturity Model.
The model accounts for the unique complexities in foodservice supply chains. At its core, HAVI’s Foodservice Supply Chain Maturity Model targets a Demand Driven Value Network (DDVN). Gartner defines1 a DDVN as “a business environment holistically designed to maximize value of and optimize risk across the set of extended supply chain processes and technologies that senses and orchestrates demand based on a near-zero-latency demand signal across multiple networks of corporate stakeholders and trading partners.”
End-to-end synchronization of demand, supply visibility, collaboration, integrated technology platforms, standardization, proven practices, and a culture that encourages new learning are hallmarks of a DDVN. The benefits of this approach to organizations in the form of increased efficiencies, better demand management, and reduced costs are clear. By benchmarking their supply chains against the Foodservice Supply Chain Maturity Model, chain restaurants can assess where they are at each maturity level relative to where they would like to be and create a roadmap for improvement. The model affords restaurants confidence (“this is a proven method”) as well as a touchstone by which to increase the sophistication of their organizations’ supply chains.
Overview
2

3
Collaboration
Roles
Information Systems & Data
Demand/Supply
Planning
Level 1
Siloed Locations
N/A
Procurement/purchasing
MS Office tools
N/A
N/A
N/A
Store master
Key items
Key suppliers and contracts
Monthly POS gross sales
Level 2
Functional Silos
Manual and reactive
Procurement/purchasing, distribution
Moving to systems with continued use of spreadsheets and email
Separate forecasting efforts across marketing, supply chain, finance
Budget-driven forecasting
Visibility to unconstrained demand across all nodes
Suppliers and DCs ItemsSupplier and DC contracts and pricingFreight lanes and ratesReceipts, bill of materialsDC POS, inventories, invoicesRestaurant ordersDaily POS gross sales
Level 3
Supply ChainManagement
Collaboration with DCs
Additional supply chain roles
Multi-point systems
Periodic standard reports
Meetings held but no real consensus Iterative forecasting and scenario planning
Forecasting focused on promotionsPatterns and seasonality reflected
Visibility to invento-ry and movements to match supply with demandTotal demand plan
National marketing calendar
Item specifications
Commodity info
DC shipments, receipts
Supplier inventory and production plans
Store inventory
POS item level
Verified data integrity
Level 4
Extended Collaboration
Collaboration internally and with key suppliers
Additional supply chain roles, including systems, process, and data management
Multiple systemsMoving toward centralized databaseFlexible reporting
Champion drives consensus forecast
Advanced statistical approachUses POS data
Forecasts balanced with supply and optimized given constraintsOrders created
Regional marketing calendar
External data (e.g., demographics, weather)
POS transaction detail
Supplier invoices, ship notices
Level 5
Shared ValueCreation
Fully integrated process from supplier to store
Comprehensive view including planning, strategy, quality and sustainability
Integrated SCM systems
Collaboration with partners
Forecasting function leads functional and external forecast collaboration
Nightly and syndicated data to manage and shape demand
Execution against the optimized plan across the entire supply chain
Fully integrated visibility from supplier to store
Raw material and conversion costs
Real-time data
PROCESS FORMALITY
DEPARTMENT FUNCTIONS AND TITLES
FUNCTIONAL INTEGRATION
GRANULARITY
APPROACH
Table 1. The HAVI Foodservice Supply Chain Maturity Model
4
HAVI’s Foodservice Supply Chain Maturity Model (Table 1) is a powerful framework that provides restaurants a roadmap their supply chain organizations can use to plan their progression from procurement agents to strategic leaders. The model identifies common traits of mature supply chains that, regardless of size, have either processes or are actively pursuing advanced capabilities.
The model is based on Gartner’s supply chain maturity model, but has been customized for the restaurant industry. The HAVI Foodservice Supply Chain Maturity Model, though initially developed with only four levels, features five levels. During the course of development, HAVI found that numerous and meaningful differences exist between companies at levels 2 and 3. By adding a fifth level, the model more succinctly draws delineation between chains’ capabilities and challenges.
The 5-stage maturity model, summarized in the chart on the opposite page, identifies that as companies move through the maturity stages, their processes and tools become more sophisticated and integrated. Collaboration both with internal functions such as marketing, finance, and operations as well as external partners such as distributors and suppliers increase. The supply chain evolves to encompass more capabilities, moving from a purchasing/procurement/distribution focus to a robust definition of supply chain. They have access to increasing amounts of data (distributor, supplier, point of sale data), which is used to improve the planning function.
Finally, the metrics they use to manage their business become more robust and consumer centric, driven in part by the increased availability of data and tools, and by an organizational culture that recognizes the value of sophisticated supply chain management to strategic business growth.
What is Unique about Foodservice?
The foodservice industry is uniquely complex. Consider the variables – dynamic flexible marketing, limited time offers, mobile couponing and the short life cycle of new products (some only have a life of six weeks or less). Shelf life issues and the global nature of the supply chain play a role as well with many items having a short shelf life or temperature controlled storage requirements. The foodservice industry also is highly sensitive to food commodity pricing fluctuations, with food costs representing a significant proportion of Cost of Goods Sold (COGS).
The franchise environment of many restaurants presents an interesting dynamic. Organizations looking to increase the sophistication of their supply chains with technology investments and standards and best practices adoption must first gain the support and full confidence of their franchisees who often – and not surprisingly – are focused on their own store(s) and operating tactically in their best interest.
The HAVI Foodservice Supply Chain Maturity Model
5
The relatively small number of customer SKUs raises the stakes for stock-out costs among restaurants, especially when one considers the limited menus of most QSRs. When a chain’s primary offering is hamburgers, it simply cannot be “out” of hamburgers, and if the supply chain is not managed efficiently, that can require an expensive level of inventory.
Unique benefits of the foodservice industry include direct connections with consumers and the ability to capture consumer insights. Restaurant chains know quickly which items are selling and what consumers think of their products as consumers take to social media to post comments and complaints about the brand. The most mature supply chains use that interaction and information to their advantage.
In addition to contact with consumers, restaurants have direct access to suppliers and distribution centers as well, affording greater power to influence collaboration among all partners throughout the supply chain. The restaurant industry also affords greater likelihood for complete POS (point of sale) data.
The foodservice industry is vulnerable to changes. The changes can be sudden and swift (a spike in commodity prices means fewer consumers are dining out) or they can be more subtle changes that occur over time (a shift in consumer attitudes toward health and nutrition compels chains to offer alternative menu items). Recent trends in the foodservice industry impacting chain restaurants:
• Brands are increasing the number and frequency of limited time offer promotions. • Consumers are demanding more fresh/organic ingredients and locally sourced
food offerings, trends that are increasing commodity prices and presenting shelf life challenges.
• Menu boards are increasing in complexity and restaurants are using more ingredients, which mean there are more items to manage and assure supply.
• The global food supply is interconnected and constricting which can lead to an unpredictable or even volatile commodity market.
• Consumers expect sustainable business practices, which can impact sourcing, supply chain and product delivery.
6
HAVI’s Foodservice Supply Chain Maturity Model charts the progression of restaurant supply chains from rudimentary, insular functions lacking process formality and visibility to highly integrated, adaptive business units that help drive sales, deliver strategic insight and create shared value.
Level 1 Siloed Locations: Business units that are siloed, do not communicate with one another
At this early stage, collaboration across the supply chain is non-existent and there is little, if any, process formality and no visibility or integration of data. Supply chain is very much a purchasing and procurement function. Software tools might be limited to personal computing (PC) solutions and credit card transaction POS systems. Data is captured at the retail level or perhaps through key items and monthly POS gross sales. Demand and supply planning capabilities do not yet exist or are arbitrarily executed.
An example of a restaurant operating within Level 1 would be an owner operator with a small number of retail locations. He likely has few formalized planning processes and plans core item inventory based on re-order points. He may not be very forward-looking when it comes to planning for future demand, anticipating trends or accounting for seasonality or promotions. Information systems likely consist of Excel - (or similar) PC-based solutions. Outcomes of this approach are revenue focused with profit determined after the fact.
Level 2 Functional Silos: Begin to implement policies across groups and begin to improve synergies
At this level, processes are still manual and highly reactive, and while a restaurant may have developed centralized functional expertise, the function is cost focused and often led by procurement. There is a move toward greater software systems use with continued heavy use of Excel and email. No formal collaboration process exists, but there are informal conversations occurring between departments. Restaurants are gathering and integrating supplier, distribution center (DC), item, purchase order, inventory, invoice and freight lanes/rates information as well as daily POS gross sales data. This is a significant advance from Level 1 monthly POS gross sales capture; however, there is not yet a central repository for data nor is there a consistent, formalized process for collecting data. Demand and supply planning is largely based on year over year reports and DC shipments and there are separate budget-driven forecasting efforts occurring across marketing, supply chain and finance. Visibility to unconstrained demand across all nodes exists.
An example of a restaurant operating within Level 2 would be a single owner operator whose business has grown large enough that there are economies of scale to be gained by employing functional experts. Most likely, this first specialist area would be procurement. At this level, there may be a consolidation of suppliers, SKU numbers and competitive supply bids. The owner operator still drives promotions and marketing initiatives. Data likely is still managed on a PC platform with off-the-shelf software.
The Maturity Model Stages

Level 3 Supply Chain Management: Business units begin to form deeper integration with the supply chain
True supply chain management begins to take shape in Level 3 and the result is integrated supply chain decision-making with early connections to product and/or sales. There is more formal coordination between supply chain functions, demand planning, supply planning, procurement, transportation and warehousing. There also is an overall leader of supply chain functions at this level and there may even be additional supply chain roles. Interestingly, while the organization increasingly recognizes the value of this function and the supply chain roles have become more formalized, supply chain still may not be perceived as the equal of marketing and finance functions in terms of strategic business value. That will change as the organization progresses through the maturity stages.
In Level 3, supply chain master data is centrally managed using integrated supply chain planning systems. There is collaboration with distributors and insightful demand plans that may account for seasonality, national promotions and limited time offer promotions as supply chain constraints emerge. POS data granularity has reached item level. Organizations operating in Level 3 can capture supplier inventory and production plans data as well as store inventory and product specifications data. Visibility to inventory and movement permits matching supply with demand. Iterative forecasting and scenario planning is taking place and meetings are held across functions, but no real consensus is achieved at this point.
An organization operating at this level might be a multi-outlet/multi-concept restaurant footprint with a separate supply chain group owned by the restaurants. This group is tasked with optimizing supply chain and minimizing costs. The organization is now big enough to support centralized marketing and product development groups; however, these groups are managed separately from the supply chain. At this level, an organization is not just sending an order to a DC; rather, it is collaborating with DCs, sharing its forecasts and talking through scenarios. Decisions are no longer best guesses, but informed choices based on analysis.
Level 4 Extended Collaboration: A strong alignment is solidified between business units and the supply chain; supply chain is recognized as a driver of growth
Extended collaboration internally across the organization, including supply chain functions, marketing, sales and finance, and externally with key suppliers distinguishes Level 4 from earlier stages of the maturity model. At this level, the supply chain champion is an integral part of business management. The supply chain function has expanded to include more roles such as systems/process and data management. Marketing initiatives – whether limited time offers, television spots or point of purchase – once organized with little regard to supply chain, are now planned and coordinated in collaboration with this strategic business unit.
7

Enabling technology at this level includes multiple systems such as an Enterprise Data Warehouse that makes possible one set of centrally managed master data. Regional marketing calendars, external data such as weather forecasts and demographics information, POS transaction detail and supplier invoices, and ship notices are integrated with processes and systems for greater visibility and planning. At this level, organizations take an advanced statistical approach to demand/supply planning that enables profitable demand-driven fulfillment.
An example of an organization operating at Level 4 is a multi-outlet/multi-concept restaurant footprint with a central head office housing all support functions, including supply chain, finance and marketing. At this level, there is a clear product development stage gate process that has a truly multifunctional team. This group is tasked with optimizing profit from any action, taking account of the effect on the entire sales portfolio. The group will reach out to suppliers for what it considers exceptional requests.
Level 5 Shared Value Creation: Companies work in greater unison internally and with external partners to increase revenue and achieve business goals
Level 5 includes the same characteristics of the previous level, but suppliers are now an equal party in the multifunctional team. Suppliers can bring ideas and issues to the entity and they will be addressed in a mutually beneficial manner. This level reflects a fully integrated process from supplier to retail store. Visibility extends from supplier to store and includes raw material and conversion costs and real-time data. Nightly and syndicated data lets organizations manage and shape demand. Organizations have integrated supply chain management systems software that supports collaboration with partners and they are able to achieve a comprehensive view of the entire supply chain. In Level 5, restaurant chains are executing against the optimized plan across the entire supply chain. The result: Profitable shared value creation through innovation across internal and external networks.
Restaurant chains that are at Levels 4 and 5 typically are higher performing than chains at lower levels. They also are less likely to struggle with inventory obsolescence compared to average and lower level chains. These chains have invested time and effort to advance the supply chain function within their organizations. This investment is critical as the entire supply chain needs to shift behaviors focused on self-centered cost and margins to metrics that are directly tied to the consumer. This shift to an integrated and collaborative forecasting model is difficult and foundational; it requires leadership commitment and personnel who can affect change and build a culture that values the role of supply chain.
8

9
While larger restaurant chains generally have a broader set of supply chain capabilities and resources than mid-sized and smaller chains, those with mature supply chains – Levels 5 and 4 – can be of any size. What leading supply chains share is an organizational belief that supply chain is a strategic business unit that adds significant value to the business growth. They actively pursue collaborative processes, greater systems integration, increased levels of visibility across partners, continuous improvement in forecasting, predictive planning and advanced analytical tools – supply chain capabilities that are all associated with higher levels in the maturity model.
Restaurant chains of all sizes can use this Foodservice Supply Chain Maturity Model to assess their capabilities across a core set of supply chain areas, set priorities to direct more focused improvement activities and create change with confidence.
Specifically, the model enables organizations to:
• Plot where they are on the model and assess their current maturity.• Create a roadmap for improvement.• Target areas for development and learn from others to drive value.• Assess a supply chain and determine how performance and
efficiencies compare to best practices from others in the industry.• Develop a “my business case” for increasing the sophistication of an
organization’s supply chain.
In the foodservice industry where margins are tight and change is constant – whether driven by food regulation, consumer demands, commodity shortages, pricing or other influences – having a well operating supply chain is critical for success. HAVI’s Foodservice Supply Chain Maturity Model provides the framework for restaurant chains looking to optimize their supply chains for competitive advantage.
1Burkett, Michael. Gartner - “Definition: Demand-Driven Value Networks,” July 13, 2012.
Appendix
The following pages include benchmark data across 10 key foodservice supply chain maturity indicators. These benchmarks show how the organizations we polled scored across the 10 indicators we use to determine supply chain maturity. They are provided by restaurant size and by restaurant segment. The scores allow companies to benchmark themselves against peer organizations. Companies can then work with HAVI to determine their score for each of the criteria and where they are on the 5-stage HAVI Foodservice Supply Chain Maturity Model.
Conclusion

10
Benchmark Across 10 Key Supply Chain Maturity Indicators
10.96 out of 37
5.62 out of 9
2.85 out of 7
FUNCTIONALSPECIALIZATION
DEPTH OFCAPABILITIES
CROSS-FUNCTIONALCOLLABORATION
SUPPLY CHAIN ROLES AND COLLABORATION
2.04 out of 4
6.31 out of 14
BREADTH OFPERFORMANCE
METRICS
FORECASTINGGRANULARITY
USE OFPOS DATA
9.27 out of 23
INFORMATION SYSTEMS & DATA
DEMAND/SUPPLY CHAIN PLANNING CAPABILITY
2.62 out of 4
1.42 out of 4
SUPPLY CHAINVISIBILITY
FORECASTINGSOPHISTICATION
SUPPLYPLANNING
SOPHISTICATION
16.88 out of 40
VISION FORSUPPLY CHAIN SYSTEMS
2.96 out of 4
RESTAURANT SIZE: SMALL
HAVI’s Foodservice Supply Chain Maturity Model provides a framework to chart the progression of restaurant supply chains from rudimentary, insular functions lacking process formality and visibility to highly integrated, adaptive business units that help drive sales, deliver strategic insight and create shared value. These benchmarks show how organizations we polled scored across the 10 indicators we use to determine supply chain maturity. The scores allow companies to benchmark themselves against peer organizations. Companies can then work with HAVI to determine their score for each of the criteria and where they are on the 5-stage HAVI Foodservice Supply Chain Maturity Model.

11
Benchmark Across 10 Key Supply Chain Maturity Indicators
FUNCTIONALSPECIALIZATION
DEPTH OFCAPABILITIES
CROSS-FUNCTIONALCOLLABORATION
SUPPLY CHAIN ROLES AND COLLABORATION
BREADTH OFPERFORMANCE
METRICS
FORECASTINGGRANULARITY
USE OFPOS DATA
INFORMATION SYSTEMS & DATA
DEMAND/SUPPLY CHAIN PLANNING CAPABILITY
SUPPLY CHAINVISIBILITY
FORECASTINGSOPHISTICATION
SUPPLYPLANNING
SOPHISTICATION
VISION FORSUPPLY CHAIN SYSTEMS
RESTAURANT SIZE: MEDIUM
13.86 out of 37
7.86 out of 9
2.14 out of 7
1.86 out of 4
9.14 out of 14
7.29 out of 23
3 out of 4
1.71 out of 4
20.43 out of 40
3 out of 4
HAVI’s Foodservice Supply Chain Maturity Model provides a framework to chart the progression of restaurant supply chains from rudimentary, insular functions lacking process formality and visibility to highly integrated, adaptive business units that help drive sales, deliver strategic insight and create shared value. These benchmarks show how organizations we polled scored across the 10 indicators we use to determine supply chain maturity. The scores allow companies to benchmark themselves against peer organizations. Companies can then work with HAVI to determine their score for each of the criteria and where they are on the 5-stage HAVI Foodservice Supply Chain Maturity Model.

12
Benchmark Across 10 Key Supply Chain Maturity Indicators
FUNCTIONALSPECIALIZATION
DEPTH OFCAPABILITIES
CROSS-FUNCTIONALCOLLABORATION
SUPPLY CHAIN ROLES AND COLLABORATION
BREADTH OFPERFORMANCE
METRICS
FORECASTINGGRANULARITY
USE OFPOS DATA
INFORMATION SYSTEMS & DATA
DEMAND/SUPPLY CHAIN PLANNING CAPABILITY
SUPPLY CHAINVISIBILITY
FORECASTINGSOPHISTICATION
SUPPLYPLANNING
SOPHISTICATION
VISION FORSUPPLY CHAIN SYSTEMS
RESTAURANT SIZE: LARGE
13.56 out of 37
7.38 out of 9
3.06 out of 7
2.13 out of 4
4.56 out of 14
10.13 out of 23
2 out of 4
2.19 out of 4
19.44 out of 23
3.36 out of 4
HAVI’s Foodservice Supply Chain Maturity Model provides a framework to chart the progression of restaurant supply chains from rudimentary, insular functions lacking process formality and visibility to highly integrated, adaptive business units that help drive sales, deliver strategic insight and create shared value. These benchmarks show how organizations we polled scored across the 10 indicators we use to determine supply chain maturity. The scores allow companies to benchmark themselves against peer organizations. Companies can then work with HAVI to determine their score for each of the criteria and where they are on the 5-stage HAVI Foodservice Supply Chain Maturity Model.

13
Benchmark Across 10 Key Supply Chain Maturity Indicators
FUNCTIONALSPECIALIZATION
DEPTH OFCAPABILITIES
CROSS-FUNCTIONALCOLLABORATION
SUPPLY CHAIN ROLES AND COLLABORATION
BREADTH OFPERFORMANCE
METRICS
FORECASTINGGRANULARITY
USE OFPOS DATA
INFORMATION SYSTEMS & DATA
DEMAND/SUPPLY CHAIN PLANNING CAPABILITY
SUPPLY CHAINVISIBILITY
FORECASTINGSOPHISTICATION
SUPPLYPLANNING
SOPHISTICATION
VISION FORSUPPLY CHAIN SYSTEMS
RESTAURANT SIZE: CASUAL DINING
12.94 out of 37
1.88 out of 4
6.71 out of 14
6.18 out of 9
2.94 out of 7
9.47 out of 23
2.82 out of 4
1.53 out of 4
16.35 out of 40
2.94 out of 4
HAVI’s Foodservice Supply Chain Maturity Model provides a framework to chart the progression of restaurant supply chains from rudimentary, insular functions lacking process formality and visibility to highly integrated, adaptive business units that help drive sales, deliver strategic insight and create shared value. These benchmarks show how organizations we polled scored across the 10 indicators we use to determine supply chain maturity. The scores allow companies to benchmark themselves against peer organizations. Companies can then work with HAVI to determine their score for each of the criteria and where they are on the 5-stage HAVI Foodservice Supply Chain Maturity Model.

14
Benchmark Across 10 Key Supply Chain Maturity Indicators
FUNCTIONALSPECIALIZATION
DEPTH OFCAPABILITIES
CROSS-FUNCTIONALCOLLABORATION
SUPPLY CHAIN ROLES AND COLLABORATION
BREADTH OFPERFORMANCE
METRICS
FORECASTINGGRANULARITY
USE OFPOS DATA
INFORMATION SYSTEMS & DATA
DEMAND/SUPPLY CHAIN PLANNING CAPABILITY
SUPPLY CHAINVISIBILITY
FORECASTINGSOPHISTICATION
SUPPLYPLANNING
SOPHISTICATION
VISION FORSUPPLY CHAIN SYSTEMS
RESTAURANT SIZE: FAST CASUAL
13.78 out of 37
2.56 out of 4
7.22 out of 14
7.22 out of 9
3.22 out of 7
8.56 out of 23
2.56 out of 4
1.78 out of 4
20.67 out of 40
3.33 out of 4
HAVI’s Foodservice Supply Chain Maturity Model provides a framework to chart the progression of restaurant supply chains from rudimentary, insular functions lacking process formality and visibility to highly integrated, adaptive business units that help drive sales, deliver strategic insight and create shared value. These benchmarks show how organizations we polled scored across the 10 indicators we use to determine supply chain maturity. The scores allow companies to benchmark themselves against peer organizations. Companies can then work with HAVI to determine their score for each of the criteria and where they are on the 5-stage HAVI Foodservice Supply Chain Maturity Model.
15
Benchmark Across 10 Key Supply Chain Maturity Indicators
FUNCTIONALSPECIALIZATION
DEPTH OFCAPABILITIES
CROSS-FUNCTIONALCOLLABORATION
SUPPLY CHAIN ROLES AND COLLABORATION
BREADTH OFPERFORMANCE
METRICS
FORECASTINGGRANULARITY
USE OFPOS DATA
INFORMATION SYSTEMS & DATA
DEMAND/SUPPLY CHAIN PLANNING CAPABILITY
SUPPLY CHAINVISIBILITY
FORECASTINGSOPHISTICATION
SUPPLYPLANNING
SOPHISTICATION
VISION FORSUPPLY CHAIN SYSTEMS
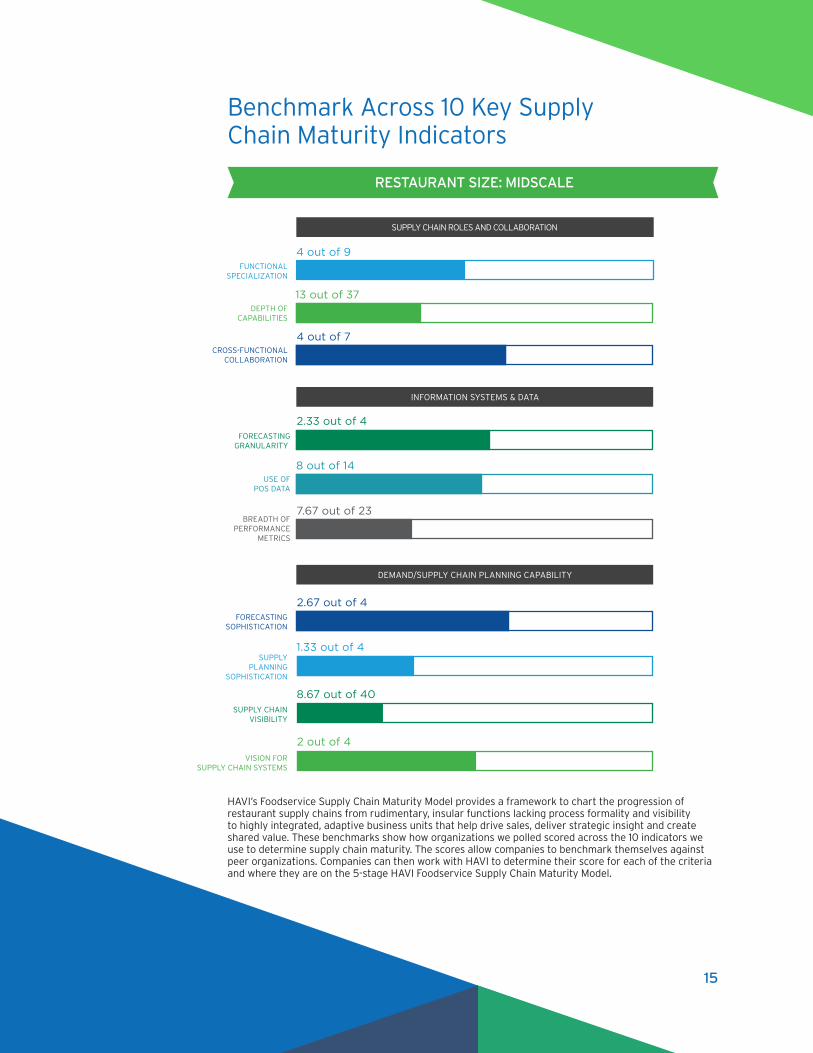
RESTAURANT SIZE: MIDSCALE
13 out of 37
2.33 out of 4
8 out of 14
4 out of 9
4 out of 7
7.67 out of 23
2.67 out of 4
1.33 out of 4
8.67 out of 40
2 out of 4
HAVI’s Foodservice Supply Chain Maturity Model provides a framework to chart the progression of restaurant supply chains from rudimentary, insular functions lacking process formality and visibility to highly integrated, adaptive business units that help drive sales, deliver strategic insight and create shared value. These benchmarks show how organizations we polled scored across the 10 indicators we use to determine supply chain maturity. The scores allow companies to benchmark themselves against peer organizations. Companies can then work with HAVI to determine their score for each of the criteria and where they are on the 5-stage HAVI Foodservice Supply Chain Maturity Model.

16
Benchmark Across 10 Key Supply Chain Maturity Indicators
HAVI’s Foodservice Supply Chain Maturity Model provides a framework to chart the progression of restaurant supply chains from rudimentary, insular functions lacking process formality and visibility to highly integrated, adaptive business units that help drive sales, deliver strategic insight and create shared value. These benchmarks show how organizations we polled scored across the 10 indicators we use to determine supply chain maturity. The scores allow companies to benchmark themselves against peer organizations. Companies can then work with HAVI to determine their score for each of the criteria and where they are on the 5-stage HAVI Foodservice Supply Chain Maturity Model.
FUNCTIONALSPECIALIZATION
DEPTH OFCAPABILITIES
CROSS-FUNCTIONALCOLLABORATION
SUPPLY CHAIN ROLES AND COLLABORATION
BREADTH OFPERFORMANCE
METRICS
FORECASTINGGRANULARITY
USE OFPOS DATA
INFORMATION SYSTEMS & DATA
DEMAND/SUPPLY CHAIN PLANNING CAPABILITY
SUPPLY CHAINVISIBILITY
FORECASTINGSOPHISTICATION
SUPPLYPLANNING
SOPHISTICATION
VISION FORSUPPLY CHAIN SYSTEMS
RESTAURANT SIZE: MULTIPLE CONCEPT OPERATOR
9.2 out of 37
1.6 out of 4
5.6 out of 14
7.4 out of 9
2.6 out of 7
9.4 out of 23
1 out of 4
1.8 out of 4
17.4 out of 40
3.4 out of 4

17
Benchmark Across 10 Key Supply Chain Maturity Indicators
FUNCTIONALSPECIALIZATION
DEPTH OFCAPABILITIES
CROSS-FUNCTIONALCOLLABORATION
SUPPLY CHAIN ROLES AND COLLABORATION
BREADTH OFPERFORMANCE
METRICS
FORECASTINGGRANULARITY
USE OFPOS DATA
INFORMATION SYSTEMS & DATA
DEMAND/SUPPLY CHAIN PLANNING CAPABILITY
SUPPLY CHAINVISIBILITY
FORECASTINGSOPHISTICATION
SUPPLYPLANNING
SOPHISTICATION
VISION FORSUPPLY CHAIN SYSTEMS
RESTAURANT SIZE: QUICK SERVICE
11.33 out of 37
2 out of 4
4.67 out of 14
6.67 out of 9
2.27 out of 7
9.73 out of 23
2.47 out of 4
1.93 out of 4
21.07 out of 40
3.25 out of 4
HAVI’s Foodservice Supply Chain Maturity Model provides a framework to chart the progression of restaurant supply chains from rudimentary, insular functions lacking process formality and visibility to highly integrated, adaptive business units that help drive sales, deliver strategic insight and create shared value. These benchmarks show how organizations we polled scored across the 10 indicators we use to determine supply chain maturity. The scores allow companies to benchmark themselves against peer organizations. Companies can then work with HAVI to determine their score for each of the criteria and where they are on the 5-stage HAVI Foodservice Supply Chain Maturity Model.

18
About Us
HAVI is a global, privately owned company focused on innovating, optimizing and managing the supply chains of leading brands. Offering services in supply chain management, packaging, logistics and recycling & waste, HAVI partners with companies to address challenges big and small across the supply chain, from commodity to customer. Founded in 1974, HAVI employs more than 9,000 people and serves customers in more than 100 countries. HAVI’s supply chain services are complemented by the customer engagement services offered by our affiliated company The Marketing Store.
For more information, please visit HAVI.com.


