UNIVERSITY OF TRIESTE FACULTY OF SCIENCE DOCTORAL DISSERTATION IN PHYSICS – 2005 A HIGH PERFORMANCE DETECTION SYSTEM FOR BREAST TOMOGRAPHY WITH SYNCHROTRON RADIATION CANDIDATE: Anna Bergamaschi UNIVERSITY OF TRIESTE SUPERVISOR: Prof. Edoardo Castelli UNIVERSITY OF TRIESTE PHD COORDINATOR: Prof. Gaetano Senatore UNIVERSITY OF TRIESTE
Transcript
UNIVERSITY OF TRIESTE
FACULTY OF SCIENCE
DOCTORAL DISSERTATION IN PHYSICS – 2005
A HIGH PERFORMANCE DETECTION
SYSTEM FOR BREAST
TOMOGRAPHY WITH
SYNCHROTRON RADIATION
CANDIDATE:Anna Bergamaschi
UNIVERSITY OF TRIESTE
SUPERVISOR:Prof. Edoardo Castelli
UNIVERSITY OF TRIESTE
PHD COORDINATOR:Prof. Gaetano Senatore
UNIVERSITY OF TRIESTE
UNIVERSITA DEGLI STUDI DI TRIESTE
FACOLTA DI SCIENZE MATEMATICHE FISICHE E NATURALI
DOTTORATO DI RICERCA IN FISICA – XVII CICLO
UN SISTEMA DI RIVELAZIONE AD
ALTE PRESTAZIONI PER
TOMOGRAFIA AL SENO CON LUCE
DI SINCROTRONE
DOTTORANDA:Anna Bergamaschi
UNIVERSITA DEGLI STUDI DI TRIESTE
TUTORE:Prof. Edoardo Castelli
UNIVERSITA DEGLI STUDI DI TRIESTE
COORDINATORE:Prof. Gaetano Senatore
UNIVERSITA DEGLI STUDI DI TRIESTE
ACKNOWLEDGMENTS
I would like to thank all the people that shared with me the work during these three years.Among the colleagues and friends, I want to mention:
Cristian Venanzi, companion in the efforts to make the detector work,Silvia Pani, always ready to help,Francesco Bruni, who learned and taught us everything about GTk,Alessandro Olivo, source of ideas and fun, andDiego Dreossi, for his patience and advices.
My gratitude goes to the technicians of the INFN electronics lab for their help, particularly toMauro Bari, who took part in the MATISSE detector design and tests, andPietro Cristaudo, for his useful suggestions.
Thanks also to all the people that partook of many lunches and coffee breaks and to those whoorganized small parties easing the work.
Y A LA META ILEGAMOS CANTANDO, O NO ILEGA NINGUNO
”Una perfecta excusa” – Luis Sepulveda and Modena City Ramblers
i
ii
ABSTRACT
The work performed for the development of detection systems optimized for synchrotron radiationbreast imaging will be discussed.
Breast cancer is the most common tumor in the feminine population and, up to now, onlysurgery and early diagnosis promise a significant mortality reduction. An early detection of thelesions can give a survival expectation higher than 90%.
The SYRMEP (Synchrotron Radiation for MEdical Physics) beamline is operating at theElettra synchrotron light source in Trieste in the field of medical imaging. The beamline hasbeen modified in order to perform mammographic examinations on patients, which are expectedto start next year.
The detection systems described in this thesis are based on a side illuminated silicon microstripsensor with an application specific read out electronics operated in single photon countingmode. The sensor configuration allows a detection efficiency higher than 80% at all energies ofmammographic interest . The visibility of the details in the image is maximized thanks to the singlephoton counting capability, since the image quality is limited only by the intrinsic fluctuation onthe detected photon number.
The FRONTRAD (FRONTier RADiography) detection system has been designed in order toprove the feasibility of clinical synchrotron radiation digital mammography. Silicon sensors withimproved efficiency and low leakage current characteristics have been designed and a fast lownoise custom integrated circuit has been developed for the application. Prototypes of the detectionsystem have been assembled and tested and the results obtained will be discussed in detail.
Tomographic images of the breast present an enhanced contrast with respect to planarmammography and promise to improve the diagnostic power of the examination, since the breaststructures are visible without the overlapping effects present in two dimensional imaging. Byusing a monochromized synchrotron radiation beam and a high efficiency detector, the dose resultscomparable to the one delivered in clinical mammography.
The MATISSE (MAmmographic and Tomographic Imaging with Silicon detectors andSynchrotron radiation at Elettra) project is aiming at developing a detector optimized for breasttomography with synchrotron radiation, while upgrading the SYRMEP beamline in order toperform tomographic examinations on patients. The detection system is based on the samesensors developed for the FRONTRAD experiment, commercially available frontend electronicsand programmable devices for counting and read out functions. The work concerning the designof the system will be described and the preliminary results obtained with the first prototypes willbe presented.
iii
iv
RIASSUNTO
Il lavoro discusso nella presente tesie stato rivolto allo sviluppo di un sistema di rivelazione pertomografia al seno con luce di sincrotrone su pazienti.
Il cancro al senoe il tumore piu diffuso tra la popolazione femminile e al momento ladiagnosi precoce e la chirurgia sono le sole metodologie in grado di diminuire significativementela mortalita. Una rivelazione precoce della presenza di lesioni puo dare un’aspettativa disopravvivenza maggiore del 90%.
La linea di luce SYRMEP (Synchrotron Radiation for MEdical Physics) opera ad Elettra, lasorgente di luce di sincrotrone di Trieste, nell’ambito dell’imaging medicale. La beamlinee statamodificata per poter eseguire esami mammografici su pazienti, che dovrebbero iniziare a partiredal prossimo anno.
I sistemi di rivelazione descritti in questo lavoro, sono basati su sensore a microstrip alsilicio illuminato lateralmente ed elettronica di lettura operante in modalita di conteggio di fotoni.L’orientazione del sensore permette un’efficienza superiore all’80% nell’intervallo di energie utilein mammografia (17-32 keV). La visibilita dei dettagli nell’immaginee massimizzata grazie allacapacita di contare i singoli fotoni, in quanto la qualita dell’immaginee limitata unicamente dalleintrinseche fluttuazioni Poissoniane del fascio di radiazione.
Il sistema di rivelazione FRONTRAD (FRONTier RADiography)e stato progettato al fine didimostrare la fattibilita di esami mammografici digitali con luce di sincrotrone su pazienti. Perl’applicazione sono stati sviluppati sensori al silicio di alta efficienza e bassa corrente di buio edun’elettronica di lettura specifica con caratteristiche di alta velocita e basso rumore. I risultatiottenuti con alcuni prototipi del sistema di rivelazione verranno discussi.
Le immagini tomografiche del seno presentano un accresciuto contrasto e promettono dimigliorare la diagnosi in quanto le struture sono visibili senza le sovrapposizioni presenti nelleimmagini bidimensionali. Ultilizzando un fascio monocromatizzato di radiazione di sincrotroneed un rivelatore ad alta efficienza, la dose risulta confrontabile con quella somministrata nellapratica mammografica.
Il progetto MATISSE (MAmmographic and Tomographic Imaging with Silicon detectors andSynchrotron radiation at Elettra) mira a sviluppare un rivelatore ottimizzato per tomografia alseno con luce di sincrotrone e ad implementare il setup tomografico alla beam line SYRMEP.Il sistema di rivelazionee basato sugli stessi sensori sviluppati per l’esperimento FRONTRAD,un’elettronica di frontend commerciale e memorie programmabili per eseguire le operazioni diconteggio e acquisizione dati. Il progetto del sistema di rivelazione verra descritto e verrannopresentati i risultati preliminari ottenuti con i primi prototipi.
The population of industrialized countries enjoys on average a high standard of living. However,together with the increased life expectancy, the incidence of cancer has become more common.With 1 million new cases in the world each year, breast cancer is the most common malignancyin women and comprises 18% of all female cancers [1]. In industrialized countries, breast cancerincidence is increasing, as shown in figure1, probably due to the life style of women (e.g. more fatsin the diet, older age at first pregnancy). However, although surgery is nowadays the only effectiveway for the cure of the disease, in the last years the mortality is constantly reducing. About 80%of women with breast cancer is cured and the percentage increases to 90% if the tumor is detectedin an early stage. The data suggest that the mortality reduction is related to the screening of thepopulation, with consequent possibility of diagnosis of the disease before it induces metastasis inother organs [2].
Nowadays X-ray mammography is considered the most effective tool for the screening ofthe population. The lesions to be detected are mainly of two kinds: nodules with a size of fewmillimeters, but absorption coefficient very close to that of the neighboring glandular tissue, andmicrocalcification as small as a few hundreds microns but with a significant contrast. Although themammographic examination often allows the detection of the tumor before it becomes palpable,it still has some limitations that result in a high false-positive rate [3]. This problems can beovercome with an improvement of the X-ray source, of the detection system and of the imagingtechniques.
The radiation is generally produced by means of X-ray tubes. The photon energies arethus spread over a large spectrum, most of which contributes to the dose of radiation givento the patient, but not to the image quality. This problem can be solved thanks to the use ofmonochromatic radiation. X-rays produced by a synchrotron light source, besides the possibilityof being monochromized thanks to their high intensity, allow one to broaden the capabilities
Fig. 1: Incidence of and mortality from female breast cancer in England and Wales [4].
3
of X-ray imaging by means of observing the phase alterations of the wave passing through thesample [5]. In chapter1 an overview of synchrotron radiation based medical imaging projects willbe presented.
The attention will be focused on the activity performed at theSYRMEP (SYnchrotronRadiation for MEdical Physics) beam line at Elettra, the Trieste (Italy) synchrotron lightsource [6]. The research activities are mainly directed toward the optimization of themammographic examinations. Given the promising results obtained on test objects andexcised tissues, the beamline has been upgraded for performing clinical examinations. In thefirst phase mammographies will be performed using conventional mammographic screen-filmsystems, however the perspectives are to move toward digital imaging and then tomographicexaminations [7]. The collaboration is thus trying to develop a digital detector optimized forsynchrotron radiation mammography.
Digital detectors that could replace commonly used screen-film systems arise great interestin the medical community [8]. The main advantage of the digital approach is the possibilityof manipulation by post-processing that can help to enhance the image quality and to applyparticular imaging techniques that require data elaboration. In chapter2 the main parameters fordetector evaluation will be presented and some of the digital systems currently used for clinicalmammography will be described.
The possibility of using a side-illuminated silicon microstrip sensor with single photoncounting readout as digital detector for synchrotron radiation mammography will be discussedin detail in chapter3.By orienting the sensor with the strips parallel to the radiation beam (edge onconfiguration), a highabsorption efficiency can be obtained, thus limiting the dose given to the patient [9]. Moreover thephotons are converted into electric charge in silicon, without the intermediate step of conversioninto visible light in a phosphor, thus avoiding the scattering of light that degrades the spatialresolution of the system.
The high sensitivity of silicon (i.e. large charge produced per photon) allows one to performthe read out with a photon counting technique. A counting system is virtually noiseless, thus theonly source of noise is given by the Poisson-like fluctuations of the number of the photons in thebeam. The visibility of the details in the image is maximized and the image quality improved atparity of dose [10].
In chapter4, theFRONTRAD(FRONTier RADiography) detection systems will be describedin detail. Silicon microstrip detectors with improved efficiency in the 17-32 keV have beendesigned and a counting read out integrated circuit able to work at high radiation intensity hasbeen developed [11]. The results obtained with prototypes of such detection system will bepresented and discussed. The newASIC (Application Specific Integrated Circuit) proved a goodrate capability. However, some problems have arisen while developing large prototypes, with anincrease of noise and disuniformities between the channels. Other solutions for what concerns thereadout electronics have thus been investigated.
In particular, the efforts have been directed toward the development of a detection systemoptimized for breast tomography with synchrotron radiation. Thanks to the absence ofsuperimposition effects,3D (Three Dimensional) breast imaging promises an improvement of thediagnostic power of mammography [12]. The contrast of the structures is enhanced and the shapeof the lesions is detected more clearly. The technique still has some limitations mainly the highdose given to the patients and the poor spatial resolution. However the improvement of computedtomography scanners and reconstruction algorithms is very fast and the perspectives are promising.The use of a monochromatic synchrotron radiation beam allows a significant dose reduction andan enhancement of the spatial resolution [13]. Moreover, the efficiency ofedge onsensors isincreased at higher energies and counting detectors perform significantly better than integratingones when few photons per steps have to be detected. In tomography where the energies used
4
are higher than in mammography, since the breast is uncompressed, and the image statistics iscollected over several projections.
The MATISSE (MAmmographic and Tomographic Imaging with Silicon detectors andSynchrotron radiation at Elettra) detection system exploits such solutions and results particularlyappropriate for the tomographic application. The system is based on the same sensors as theFRONTRAD experiment, but a different frontend electronics is used in order to overcome thenoise problems encountered with the previous system. The readout is based on programmablelogic devices and allows thus a completely custom data acquisition [14]. In chapter5 the detectionsystem will be presented in detail and the results obtained with the first prototypes will bediscussed. A 384 channels prototype is now in the testing and optimization phase. The final twolayers 20 cm large detector, is to be delivered at the end of 2005 and the future work to achievethis goal will be outlined.
5
6
1. SYNCHROTRON RADIATIONMAMMOGRAPHY
X-rays were discovered by W. C. Rontgen in November 1895 and the first clinical images weretaken already at the beginning of 1896 [15]. The possibility of exploitation of X-rays for medicalapplications was certainly one of the reasons why Rontgen was awarded with the Nobel prize in1901 [16].
For almost half a century X-rays were exclusively generated by X-ray tubes, until theSR(Synchrotron Radiation) emitted by charged particle was observed in accelerators built for highenergy physics [17].The optimal characteristics of such radiation suggested the construction of facilities dedicated tothis purpose which soon became important centers of X-ray based scientific research.For what concerns the medical field, at the beginningSR was mainly used asgolden standardfor clinical studies performed in hospitals [18]. However,SRspecific medical research began togain importance and in 1986 the first angiographic examinations on patients were performed atStanford SSRL (USA). Since then, several medical applications were developed and optimizedthanks to the peculiarity ofSR.
In this chapter, after describing the properties ofSR, the main activities performed atSRfacilities in the field of medical research will be highlighted and the attention will be focused onthe new clinical mammography facility which is being built in Trieste. TheSYRMEPbeamlineat Elettra updated forin vivo mammographic examinations will be described in detail and theperspectives regarding its activity will be discussed.
1.1 PROPERTIES OF SYNCHROTRON RADIATION
Early synchrotron light sources used photons that were created as the undesirable energy loss ofelectron accelerators operated for high energy physics research. This parasitic use of synchrotronradiation showed such successful results that in the 80’s accelerators were built expressly for thepurpose of generating synchrotron radiation.
A detailed description ofSRgeneration processes can be found in [19].
i . Generation of synchrotron radiation
Electrons are stored in rings where they are kept in a circular orbit. The main components of thestorage ring are illustrated in figure1-1a.Synchrotron radiation is emitted by bending magnets, or insertion devices i.e. wigglers orundulators that can be inserted in the straight regions.Next generation synchrotron radiation sources will also includeFELs (Free-Electron Lasers).
a . Bending magnets
Bending magnets are present in all circular particle accelerators. The particle passing through amagnetic field is forced to follow a circular trajectory and emits radiation due to the acceleration,
7
a) Storage ring
b) Bending magnet
c) Wiggler
d) Undulator
Fig. 1-1: Simplified illustration of the principal components of a SR source.
as shown in figure1-1b.The radiated power of a charge in a magnetic field can be obtained by the Larmor formula andrapidly increases with the energy of the circulating particle [20]. Since the radiation rate resultsinversely proportional to the fourth power of the mass of the particle, allSRsources are based onelectrons or positrons.The spectrum of the radiation is continuous and is characterized by a critical energyEC, whichdivides the spectrum into two parts with equal power [21]. The value ofEC rapidly increaseswith the energy of the circulating electronsE and is inversely proportional to the curvature of theelectron trajectory.The angular distribution of the radiation is highly peaked in the forward direction. The openingangle for photons of critical energy can be approximated with1
γ = mc2
E . The emission cone getsnarrower at higher photon energies.
b . Wigglers
Wigglers are insertion devices used in all accelerators specific forSR production. The wiggleris a special magnet with alternating directions of the magnetic field that cause oscillation of theelectron bunch, as shown in figure1-1c. The electron beam wiggles with a large deviation angle.A bright and spectrally continuous light with short wavelengths is obtained.The photon flux and the radiation intensity are more intense than for the bending magnet of afactor given by the number of poles within the wiggler.
c . Undulators
Undulators are insertion devices where the electron beam wiggles with a small deviation angle,as sketched in figure1-1d. Sharp energy peaks are obtained due to the coherent interference ofradiation emitted at different periods and the photon spectrum is given by harmonic wavelengthsproportional to the square of the energy and inversely proportional to the period length. The energyband becomes sharper as the number of periods increases.The opening angle of the radiation cone is inversely proportional toγ and becomes narrower asthe number of periods increases.
8
Fig. 1-2: Spectral brightness for several SR sources and conventional X-ray sources [23].
d . Free-electron lasers
FELs are expected to increase the brilliance ofSRsources of several orders of magnitude. Theywill be capable of providing intense, powerful beams of laser light that can be tuned to any precisewavelength [22].Accelerated electrons pass through a wiggler that causes the electrons to oscillate and emit lightwhich is captured in the cavity, and used to induce new electrons to emit even more light.
ii . Characteristics of SR
Figure1-2shows the spectral brightness ofSRproduced by bending magnets and insertion deviceswith different electron energy. The spectrum and brightness are compared with the ones producedby X-ray tubes. The latter can be taken as a rough estimate since brightness depends strongly onthe operation parameters (e.g. kVp, mAs, collimation) and fabrication characteristics of the device(e.g. focus size, stationary or rotating anode).
The principal properties ofSRcan be summarized as follows [24]: High intensity broad and continuous spectrum which makes possible the production of
intense tunable highly monochromatic beams. Monochromatization is usually obtained byexploiting Bragg diffraction from crystals [25].TheSYRMEPbeamline at Elettra is equipped with a double crystal monochromator whichallows energy selection in the range 8-35 keV with a resolution of 0.2% [26].
Natural collimation thanks to the narrow cone of emitted radiation. For example, thehorizontal beam divergence at theSYRMEPbeamline at Elettra is only 7 mrad [26].This property enhances the source intensity, since all the emitted radiation is directed to thesample, and avoids the presence of parallax effects and spatial resolution deterioration inimaging studies.
9
Fig. 1-3: Diagram of X-ray absorption by a uniform sample with a denser detail.
High spatial coherence thanks to the small source size, which is mainly determined bythe transverse size of the electron beam, and to the narrow cone of emitted radiation. Forexample, the source size at theSYRMEPbending magnet at Elettra is 135×80µm2 [26].Coherence is essential for diffraction studies.
Linear polarization in the horizontal direction. Light emitted by bending magnets is alsocharacterized by circular polarization in the vertical direction.This property can be useful for the investigation of magnetic domains or for spin-resolvedmeasurements.
Pulsed time structure due to the pulsed structure of the electron bunches.This property can be useful for time-resolved experiments.
1.2 MEDICAL IMAGING WITH SYNCHROTRON RADIATION
Medical imaging techniques implemented at synchrotron radiation facilities are mainly based onabsorption and refraction of X-rays [5].Absorption imaging is largely used for clinical radiography based on conventional X-ray tubes,while techniques that exploit phase effects require a high degree of spatial coherence of theradiation and so far their clinical exploitation seems possible only atSRfacilities.
In this section the basic principles of both absorption and phase techniques will be discussed.The main applications ofSRfor in vitro and clinical studies will be highlighted.
i . Absorption imaging
Conventional radiology wants to discriminate the presence of details of different density in thesample by detecting differences in their attenuation coefficients.
a . Principles of absorption imaging
The intensity of radiation passing through a homogeneous sample of thicknessx is given by [27]:
I(x) = I0e−µ(E)x (1:1)
whereE is the energy andI0 the intensity of the impinging radiation.µ is the linear attenuationcoefficient of the sample:
µ= (σph(E)+σC(E))ρ (1:2)
10
which is related to the atomic densityρ , and to the photoelectric (σph) and Compton (σC) crosssections. The pair production cross section can be neglected in the X-ray energy range used inradiology.The attenuation coefficient is then a function of the sample composition and radiation energy.In the case of polychromatic beams, the attenuation is obtained by integrating over the radiationspectrum.
If we consider a homogeneous sample containing a denser detail as in figure1-3we can definethe contrast as the relative difference between the transmitted intensities outside (I1) and inside(I2) the shadow of the detail:
C =I1− I2
I1=
I0e−µ1(E)D− I0e−(µ1(E)(D−L)+µ2(E)L)
I0e−µ1(E)D= 1−e−(µ2(E)−µ1(E))L (1:3)
whereµ1 andµ2 are the attenuation coefficient of the homogeneous background and of the detailrespectively whileD andL are the sample and the detail thickness respectively.Given the radiation energy, the contrast is essentially a property of the examined sample anddepends on the detail size and on the difference of its attenuation coefficient from theµ of thebackground.
However, the visibility of a detail depends not only from its contrast but also from the imagequality, which is affected by the beam quantum mottle (i.e. the Poisson-like fluctuations on theincident number of photons) and possibly by the noise of the detection system [28].TheSNR(Signal to Noise Ratio) of the detailSNRdetail can be defined as:
SNRdetail =|I1− I2|√σ2
1 +σ22
(1:4)
whereσ1, σ2 is the standard deviation outside and inside the shadow of the detail. In an idealimaging system the fluctuation on the number of photons is purely Poisson-like thusσ1 =
√I1 and
σ2 =√
I2.SNRdetail generally increases with the number of detected photons.
The doseD given to the patient is defined as the energy deposited per mass unit. It dependson the energy of the radiation (being related to the absorption of radiation and consequentlyµ) andon its intensity. Although the calculation of the dose is usually very difficult and time-consuming,it is possible to demonstrate that theFOM (Figure Of Merit):
FOM =SNRdetail√
D(1:5)
is a function of the beam spectrum, of the sample characteristics and of the detection systemfeatures. TheFOM is independent from the radiation intensity and can thus be used in order tooptimize the image quality independently from the dose given to the patient.
b . Advantages of synchrotron radiation
SRoffers several advantages for absorption contrast imaging [18]: The use of monochromatic beams allows the optimization of the energy as a function of the
radiographed sample in order to maximize theFOM. Moreover the hardening of the beamdue to the sample absorption of the low energy photons is avoided, contributing to limit thedose.This feature can be also exploited in order to applyKES (K-Edge Subtraction) [29]. In thiscase, images are acquired at energies above and below the K-edge of the contrast agent used
11
and then the two images are subtracted. The small source size, the negligible divergence and the large distance of the sample from
the source allow a good spatial resolution, which is limited only by the detector. The laminarity of the beam due to the small opening angle in the vertical direction and the
possibility to place the detector at a large distance limit the presence of scattered radiationin the images. However scanning is required for2D (Two Dimensional) imaging.
c . Applications
Some applications ofSRmedical imaging with past experience or perspectives for in vivo studieswill be described [18].
Coronary angiographyClinical coronary angiography is an important diagnostic method, which provides detailedhigh-resolution images of the coronary arteries. It is largely used for follow-up of patientswho have undergone an angioplastic surgery in order to detect in-stent restenosis.However, in clinical practice complications and mortality are too frequent since the contrastagent must contain a high concentration of iodine and must be injected directly into theartery.When usingSR, a much lower concentration of contrast agent can be used and it can besomministrated by intravenous injection [30, 31, 32].Coronary angiography is the only medical application for which synchrotron radiationtechniques have been extensively applied in human research. So far, a total of 500 patientshave been imaged in severalSRfacilities.The experimental setup is implemented by means of a bent Laue monochromator. Theradiation has a vertical energy gradient and two beams of energy above and below the K-edge are obtained by means of a splitter that absorbs the intermediate energies. The twobeams are focused in correspondence of the patient, who is scanned through the beam, andthen detected by two different sensors
BronchographyBronchography can be used for the detection of lung cancer or for the diagnosis ofrespiratory diseases.In lung imaging withSR, xenon mixed with oxygen is used as a contrast agent. Thebronchial tree is clearly visible after a few inspirations, but is then shadowed by the filledalveoli.So far there has been only one human study that demonstrated that the bronchial tree couldbe imaged down to the fourth bifurcation [33].SR bronchography suffers the concurrence of other techniques such as computedtomography who has dramatically improved in the last years. HoweverKESbronchographymaps the ventilation in lungs with good spatial and temporal resolution and is expected tocontribute to the study on lung diseases and on the effect of drugs. Small animal studies forquantitative analysis of lung ventilation and diseases show interesting perspectives [34].
MammographyMammography is the most effective technique for early diagnosis of breast cancer. Inconventional mammography radiation from a fine-focus molybdenum anode X-ray tube isgenerally employed, thus atSRfacilities X-rays in the 15-22 keV energy range are used.SRmammography studies are carried on in order to develop new methodologies to importinto the clinical standard. Experimentations on humans are forseen only in order todiscriminate sick patients from false-positives in case they have undertaken an ambiguousmammogram, before they have to undergo a biopsy, as will be discussed in section1.3.Compared to conventional mammographic units,SR mammography shows a great
12
improvement of the image quality-dose relationship, which is due to the beammonochromaticity and to the high collimation of the beam, which strongly removesthe presence of scattered radiation in the images using a slit instead of anti-scatteringgrids [35, 36].Dual energy mammography is being studied in order to remove the contrast due to thedistribution of the glandular tissue and enhance the intrinsic contrast of pathologicaltissues [37].Recent developments in phase contrast imaging are greatly improving mammographicstudies, as will be described in the next paragraph.
ii . Phase detection imaging
Thanks to the high spatial coherence ofSR, in recent years imaging techniques based on phaseeffects have been largely investigated [38].
a . Principles of Phase detection
The contrast can be achieved by exploiting refraction differences in samples that normally showno or little absorption contrast.
The refraction indexn is composed by an imaginary componentβ related to the absorptionand by a real componentδ which defines the diffraction of the waves [39]:
n = 1−δ+ i β (1:6)
In the energy range suitable for X-ray imaging of biological samples,δ can be considerably largerthanβ.
Phase techniques are sensitive to the gradient of the refraction index, thus strong edgeenhancement effects are visible at the borders of details.The refraction pattern is characterized by positive and negative peaks near the borders. Thecontrast must then be redefined:
C =I1− I2
I0(1:7)
whereI1, I2 are the intensities on the maximum and on the minimum respectively, whileI0 is theintensity in the background.
It is interesting to point out that the mechanism that gives rise to phase contrast deposits nodose in the sample [40]. It is of course impossible to eliminate the processes that produce theabsorption of radiation, but it may be possible to operate in conditions where those are minimized.The real partδ of the refractive index decreases an order of magnitude less than the imaginary partβ for energies that go from 20 keV to 60 keV. By increasing the energy, phase contrast imagingcould allow a significant dose reduction with little deterioration of the image quality. However,more work is needed in order to determine if the loss in absorption contrast that would result inusing higher energy X-rays could be replaced by the information given by phase contrast.
Phase shift effects can be detected mainly with two different experimental setup i.e. in-linephase contrast andDEI (Diffraction Enhanced Imaging).
b . In-line phase contrast imaging
In-line phase contrast is obtained with the same setup of absorption imaging, only by increasingthe distance between sample and detector, and does not require any kind of image reconstructionor wave splitting [39, 41].
Figure 1-4 schematically shows the process that governs phase contrast imaging. The
13
Fig. 1-4: Scheme of the process that governs the in-line phase contrast technique.
interference between elastically scattered waves and the unrefracted waves is detected. Theradiation is elastically scattered at very small angles (∼ 10− 100 µrad) [42]. The contrast isproportional to the second derivative of the electron density of the sample, so that interfaces andboundaries are enhanced in the images. The interference pattern results in in narrow peaks andvalleys along the borders of the details, strongly enhancing the visibility of thin and tiny detailsthat would normally be invisible in absorption based images.
Since the detector has a finite resolution, the distance between the sample and the detectormust be of several meters in order to detect phase effects. The interference pattern must beconvolved with the detector response, resulting in a loss of signal for detectors with a poor spatialresolution. The diffraction pattern must also be convolved with the source shape. The distancemust consequently be optimized as a function of the detector resolution and source size.The beam must be transversely coherent over the detail being imaged, but the longitudinalcoherence is not fundamental, so that even polychromatic radiation can be used [43].
An appropriate high efficiency detection system can prove the feasibility of phase contrastimaging increasing only slightly the dose with respect toSRabsorption imaging [39].
Phase contrast detection can be enhanced by partially illuminating the sensor as describedin [44, 45].
c . Diffraction enhanced imaging
With diffraction imaging, only the photons scattered by the sample at a certain angle aredetected [39]. This is usually achieved by using an analyzer crystal between the sample and thedetector. The analyzer is aligned in order to select only the photons refracted to a certain angle byBragg diffraction. If the analyzer crystal is aligned with the monochromator, the scattered X-rayswill be rejected, while with a slight misalignment only the scattered radiation will be detected. Thescattering angle selection by means of Bragg diffraction can be achieved only with monochromaticradiation, howeverSRis not necessary and monochromized radiation from an X-ray tube has alsobeen used [46].
The diffraction angle is, to the first approximation, proportional to the gradient of the phase-shift term δ, so the border visibility will be enhanced. By acquiring images with opposite
14
misalignments of the analyzer crystal and combining the two, images that carry pure absorptionand diffraction information can be obtained.
A different setup can be obtained by positioning a linear detector slightly out of thebeam [44, 45].By tuning the detector displacement with respect to the beam and the sample to detector distance,the diffraction angle and acceptance window can be selected. With a sample to detector distanceof about 2 m and a displacement of 15-20µm, the scattering angle detected is a few tenths ofmicroradians. In this setup, the large dimensions of the pixel are not a disadvantage up to a certainlimit, since the acceptance window, and thus the signal in the image, increases. Since the photonsare deviated by a very small angle a negligible parallax effect is present and the shape of the detailsis preserved in the image. Although the resulting scattered radiation has a low intensity, a highSNRdetail can be obtained, since the contrast is very high. It is important to notice that with thissetup the detection of scattered radiation can be achieved at no dose expenses simply by addinga further line of pixels just above or below the detector layer used for conventional absorption orphase contrast imaging.
d . Applications
Phase contrast methods strongly enhance the differences between soft biological tissues of verysimilar absorption strengths and thus find application in very challenging diagnostic examinations.Phase contrast techniques, though, have yet to be applied to patients and hence the current “stateof the art” is restricted to small animals and human tissue samples [40].
Cartilage and bone imagingThe imaging of cartilage and bone is important for the development of successful treatmentsfor conditions such as degenerative osteoarthritis and joint diseases.There is considerable interest in using phase contrast to detect early degenerative changes ofcartilage. Phase contrast proved to clearly delineate the interface between air and soft tissueand between soft tissue and cartilage [47]. MoreoverDEI provides distinction betweendegenerated and healthy cartilages [48].
Lung imagingThe large refractive index of air and soft tissues makes the lungs an ideal candidate for phasecontrast imaging. Works in this area are at a very early stage but early comparative studieson small animals and human tissues have been conducted [49, 50].
MammographyThe poor contrast due to small X-ray absorption differences is particularly relevant in thefield of mammography, where low contrast masses and small size calcifications have to bedetected.For this reason phase contrast techniques have been largely applied to the mammographicfield and a number of researchers have imaged breast tissues using in-line phase contrastand diffraction enhanced imaging.In-line phase contrast provides enhanced contrast and spatial resolution with betterdefinition of the glandular component and improved visibility of micro-calcification [39].DEI proved an enhanced visualization of lesion spiculation and architectural distortionand in particular lobular carcinoma, which is a difficult tumor to detect, was betterdiagnosed [51, 52]. DEI mammography has been investigated also with a conventionalsource and an analyzer crystal [46].The mammographic application is the one which shows better perspectives both withconventional sources [53, 54] and synchrotron radiation. The possibility of exploitationof in-line phase contrast imaging is certainly one of the motivation for the construction ofthe beamline for clinical mammography which is being built at Elettra in Trieste and will be
15
a) First floor b) Second floor
Fig. 1-5: Overview of the SYRMEP hutch.a) On the first floor are located the mammographic station,the radiologist room, the experimental room and the beam preparation facilities.b) On the second floor ispositioned the control room.
described in the next section.
1.3 SYRMEP
TheSYRMEPbeam line has been active in the field of medical imaging since 1996 at Elettra, theTrieste (Italy)SRfacility [6].Taking into account the typical energy spectrum at a bending magnet at Elettra (which operates at2 and 2.4 GeV) and considering the very high social relevance of the breast cancer incidence inthe female population in Europe, the local medical community indicated that mammography wasthe most suited medical application for the beamline.
The results on the feasibility studies on conventional and phase contrast imaging on test objectsand human breast tissue samples have been considered very successful by the community ofradiologists [39].The following phase of the study involves the clinical validation of the technique on a limitednumber of patients selected by radiologists according to a predetermined recruitment protocol.In this context, an agreement among the Public Hospital, the University and Elettra in Trieste,have been established in order to implement a medical facility dedicated to mammography.The previous layout of the beamline has been deeply modified in order to performin vivomammographic examinations.
In order to allow enough room for the mammographic station, the spaces have been distributedon two floors, as shown in figure1-5. On the first are located the rooms for the radiologist and thepatient, which are separated by a lead-glass window. On the second floor is located the beamlinecontrol room. Ahead of the mammographic station, on the first floor, a room for performing thestandard experimental activity has been preserved.
In this section the layout of the beam line and of the new mammographic station will bedescribed in detail and an overview of the perspectives for its operation will be pointed out.
16
Fig. 1-6: Layout of the updated SYRMEP beam line.
i . The beamline
Figure1-6shows the main components of theSYRMEPbeamline.The first element after the frontend is a 2 mm beryllium window which divides the ultra-highvacuum of the ring from the beamline and eliminates the low frequency components of theradiation. A system of slits allows to select the beam size and shape with a micrometric precision.The monochromator allows the selection of the energy in the 8-35 keV range with 0.2 % precision.It consists of two parallel silicon crystals cut in〈111〉 orientation. The energy selection is obtainedby Bragg diffraction tilting the crystals. The second crystal can also be translated in order tomaintain the same beam position at all energies.
A second 0.5 mm beryllium window separates the vacuum components of the beamline fromthe rest of the setup. The measured photon flux after this second window is plotted in figure1-7.The radiation intensity can be attenuated thanks to a system of aluminum filters of thicknessranging between 250µm and 8 mm. A second system of slits is used to shape the beam andstop the radiation scattered by the previous elements of the beamline. The maximum beam crosssection is 210×4 mm2 in the patient room.
The beam then enters the experimental room. A system of motors for sample and detectormovement and positioning is located on two optical tables. For the acquisition of planar images
Fig. 1-7: Photon intensity as a function of energy after the second Be window. The intensity has beenmeasured at both the energies of operation of Elettra.
17
a) Upper view b) Lateral view
Fig. 1-8: Pictures of the patient support. In the second picture the detector holder, the rail for its positioning,the breast compressor and the motors group are also visible.
the sample is scanned through the beam, while for tomographic imaging it is rotated in discretesteps. If aSF(Screen-Film) system is used as detecting medium, it will also be scanned in frontof the beam. The film scanning speed is determined by the dose requirements for a correct filmexposure (see section2.1), while the sample scanning speed is chosen in order to preserve theangular velocity with respect to the source avoiding artifacts.Before entering the patient room a system of two identical ionization chambers measures theintensity of the radiation and fast and safety shutters are used for the control of the expositionduring the examination.
ii . The mammographic station
The main upgrades of the beamline for the clinical examinations consist in the implementationof the patient and detector movement and positioning system and of the safety and controlsystems [7, 55].
a . The patient support
An innovative remotely-controlled support has been developed for the positioning and movementof the patient [7, 55] . It consists in a bed with a hole, as shown in figure1-8 and isdesigned and realized by CINEL (Italy) in collaboration with IMS, an Italian producer of standardmammographic units. The patient will be positioned prone with the breast dangling and theexamination will be performed by scanning the organ through the beam. The patient supportis equipped with three motion stages: horizontal, for patient positioning, vertical, for positioningand scanning of the organ, and rotational along an axis orthogonal to the beam, in order to acquireimages with different projections and perform tomographic examinations.The scan velocity can be accurately selected up to 4 cm/s.
The breast compression paddles are located under the hole in the support: they are motorizedand one can also be positioned manually for fast release.
The detector holder is designed in order to contain a mammographic screen-film cassette, asshown in figure1-9a. It is placed on a 2 m long linear guide in order to select the optimal organ-to-detector distance for phase contrast examinations, and is moved vertically simultaneously withthe patient support. Absorption and in-line phase contrast images can be acquired, while the setup
18
a) Detector holder b) Exposimeter
c) Ionization chamber
Fig. 1-9: Pictures of some elements of the SYRMEP mammographic station:a) the detector holder,b) theexposimeter positioned in the detector holder andc) one of the ionization chambers.
for DEI examinations has been considered too challenging for clinical examinations and has notbeen implemented because of the strict requirements on the alignment of the analyzer crystal.Instead of the antiscattering grid used in conventional mammography, the system has a slit alignedwith the beam in front of the detector holder: only the primary and very small angle scatteredbeam will impinge on theSFcassette.
A laser based system for locating the position of the beam on the breast has been implemented.
b . Safety, dosimetry and control systems
The radiation monitors are an upgraded version of the ionization chambers working at the DESYbeamline, calibrated under compliance with ENEA, the Italian metrology institute for ionizingradiation [7, 55]. The picture of one of the chambers is shown in figure1-9cThe beam is parallel to the electric field and the entrance and exit Al-mylar windows arethe electrodes. The uniformity of the ionization chambers response has been investigated bymeasuring the signal output due to a pencil beam moving on the entrance window and parallelto the electric field. The maximum observed difference in response is about 1%. The stability intime has been evaluated in the ENEA laboratories and is compatible with the required nationalstandard stability.
The parameters of the examination will be selected by evaluating the organ characteristicsthanks to an exposimeter. It consists of a photodiode located in the detector holder (as shown infigure1-9b) that will be flashed with radiation before performing the examination. The thicknessof the breast is provided by the compressor and it will be possible to calculate the glandularity ofthe organ (i.e. the fraction of glandular tissue with respect to fat tissue) by comparing the signal ofthe ionization chambers placed before the organ with that provided by the exposimeter. This data
19
are then used for the selection of the X-ray energy and of the scanning speed of the examinationin order to maximize theFOM and obtain the correct exposition of the film [56].
An automated system will control the patient movement and provide the opening and closingof the shutters. The safety system will stop the examinations whenever an emergency isencountered, the patient movement is compromised or the dosimetry system reads out anomalousdata. The time for processing the data and closing the shutters is of only a few tens of milliseconds.The project for the fast and safety shutters has been developed in collaboration with the groups ofDESY and ESRF medical beamlines.The systems have been designed in order to be redundant and fail-safe in order to guaranteecomplete safety to the patient.
Since there are no previous cases ofSRmammography, the development of a protocol for theselection of examination parameters and for the quality control of the entire setup is being carriedon [56].
1.4 OUTLOOK
A monochromatic synchrotron radiation beam is an optimum instrument for X-ray imaging.The peculiar characteristics of synchrotron radiation allow not only to enhance the quality ofradiographic images, but also to apply innovative techniques in order to observe the phasealterations of the radiation transversing a sample.
Synchrotron radiation finds application in many medical tasks. For what concernsmammography, it allows a high resolution detection of low contrast lesions with low doses givento the patient.
The mammographic facility at theSYRMEP beamline is under commissioning and hasrecently been approved by the local Ethical committee, but still needs to be approved by severalinstitutions and in particular by the Italian Health Ministry [7, 55].At an early stage of the clinical studies, only doubtful cases will be examined: women whohave undertaken a conventional mammography with an ambiguous diagnosis will be offered thepossibility of undergoing aSRmammography before executing a biopsy.A set of absorption and phase contrast mammograms on a statistically significant number ofpatients will be acquired. The goal is to perform a comprehensive study on advantages andlimitations of clinicalSRmammography in comparison with conventional mammography.
The next step will be the integration in the mammographic station of the digital detectionsystem that will be described in the next chapters. Digital mammography will be the first stage ofthe examination while a few tomographic slices will be acquired in order to investigate doubtfulstructures. The advantages of breast tomography will be discussed in chapter5.
Long time perspectives, involving clinical research, technology transfer and clinical practice,may arise from the outcome of this research.In case of successful results, a fully mammographic beamline could be implemented in order toto carry out a large number of clinical examinations exploiting other promising and innovativetechniques (e.g. dual energy imaging, diffraction enhanced imaging).Moreover, a still greater interest may arise in upgrading clinical mammographic units in order toprovide characteristics similar toSR facilities (e.g. quasi-monochromatic sources, laser plasmabased sources, breast tomography units).
20
2. DIGITAL MAMMOGRAPHY
Since the mid ’90s there has been a great interest inDM (Digital Mammography), but theshift from SF to digital detections systems has been slowed down by technical challenges andhigh costs due to very strict demands in terms of high image quality and low absorbed dose inmammography [57].Mammography withSFtechnique, in fact, is fast and cost efficient, providing high sensitivity andspecificity [29, 58]. On the other hand, a major feature ofDM is that the processes of imageacquisition, image display and image storage and retrieval are decoupled, allowing each to beoptimized individually [8].
A digital image is built up as a matrix of pixels whose content represents the average of signalacquired by the corresponding detector element.
The main advantage of the digital approach is the possibility of image manipulation by postprocessing. This can be used simply in order to enhance particular image features or for theapplication of special imaging techniques, like dual-energy mammography [59, 60, 61], contrastsubtraction mammography [62, 63] or computed tomography [12, 52, 64, 65]. This last applicationwill be reviewed in detail in chapter5.A digital image is also characterized by ease of storage and retrieval and can be transmitted forremote diagnosis (telemedicine) or processed by computer aided diagnosis software in order toenhance the accuracy of interpretation [66, 67].
Since the performances of the detector play a key role in the image quality obtained, generalconsiderations about the detector evaluation will be pointed out, with a particular emphasis onthe features that are exploited by the detection systems developed in this work. Moreover a briefreview of existingDM systems will be presented.
2.1 DETECTOR EVALUATION
The characteristics of the detector are very important in determining the efficiency with which theimages are produced and their intrinsic quality.The quality of an image is closely correlated with its diagnostic value, but can slightly differ fromit [66]. Since the optimization of the diagnostic effectiveness of the image is the main goal ofmedical imaging, the best way of comparing the performance of different detectors is to study thesensitivity and specificity of the diagnosis obtained with the different detection systems.
Some of the most important features of detector performance are efficiency, spatial resolution,geometrical characteristics and field coverage, dynamic range and uniformity. These features arecorrelated to each other and different technologies need compromises among these factors.
i . Efficiency
The efficiency of a detector is of fundamental importance in order to limit the dose given to thepatient. The possibility of exploiting the information given by the radiation impinging on thedetector is mainly determined by two terms: the efficiency, i.e. the probability of absorption of theradiation inside the detector, and the signal collection efficiency.
21
The absorption efficiencyη of the detector for photons of energyE is given by:
η(E) = 1−e−µ(E)T (2:1)
whereµ is the linear attenuation coefficient of the sensor andT is its thickness. For polyenergeticsources (e.g. X-ray tubes) the effective efficiency of a detector will be obtained by integratingηover the radiation spectrum.If the detector is shielded by its packaging, by a layer of protecting material or by an insensitiveregion in the entrance window of the detector, the efficiency will be lower:
η(E) = (1−e−µ(E)T)e−µs(E)Ts (2:2)
whereµs is the attenuation coefficient of the shielding material andTs is its thickness.The quantum interaction efficiency can be maximized by increasing the detector thickness or
using materials with high atomic number, while reducing the thickness and density of the shield.η depends strongly on the energy of the impinging radiation, which influences both the detectorand the shield absorption.
The efficiency η depends only on the absorption due to the detector and not on itsperformances. It is possible to define theDQE (Detected Quantum Efficiency) of the detectionsystem as the squared ratio between theSNRof the signal at the output of the detector (SNRout)and the maximum possibleSNR, which corresponds to the one at the input of the detector (SNRin):
DQE =SNR2
out
SNR2in
(2:3)
In an ideal system, the signal fluctuations at the input of the detector are due only to the Poisson-like fluctuations (SNRin =
√N) of the beam (quantum mottle), which propagate to the output due
to the finite absorption of the detector (SNRout =√
ηN). In this case theDQEresults exactly equalto the efficiency. However it is not uncommon that the detector adds some noise to the signal, sothat theDQEresults lower thanη.
ii . Spatial resolution
Most detectors for digital radiography are composed ofDELs (Detector ELements), usually ofconstant size and shape.
ThePSF(Point Spread Function) is the image of an ideal point-like object and is often used toassess the spatial resolution of an imaging system. It will be at least one pixel wide (as shown infigure2-1a), but can also consist of a spot of several pixels, brighter in the center and progressivelydarker away from the center.The resolution can be defined as the width within which thePSFdrops to half the maximumvalue, calledFWHM (Full Width at Half Maximum). ThePSFdoes not need to be symmetrical,so there may be different spatial resolutions in different directions. If the object consists of twoideal points, just a distanceFWHM apart, they can be considered separated in the image.
TheMTF (Modulation Transfer Function) is formally defined as the magnitude of the FouriertransformedPSF. The physical meaning of theMTF is to evaluate the fraction of the contrast at aspecific resolution that is transfered by the imaging process. In the optimal case, theMTF value is1, meaning that object and image contrasts are identical.The MTF is computed in the Fourier domain and is thus expressed in spatial frequency units.The MTF usually starts with a value 1 at 0 spatial frequency which represents a homogeneousbackground. It then drops down to zero in a system-specific manner. TheMTF of a detector witha rectangular pixel is shown in figure2-1b.
22
a) Pixel-like PSF b) Pixel-like MTF
Fig. 2-1: Plot of a single pixel point spread function and its relative MTF.
The spatial resolution of two systems can readily be compared by using theMTF: at each spatialfrequency the system with the higherMTF maintains a better contrast. The dimension of the activeportion of eachDEL defines an apertured which determines the spatial frequency response of thedetector, as shown in figure2-2.
The sampling intervalp of the detector is the pitch between sensitive elements ofmeasurements. TheFF (Fill Factor) provides a measure of the detector’s geometric efficiencyand is given by:
FF =dxdy
pxpy(2:4)
considering thatd andp can be different along the two coordinates of the image.Some detectors are not pixellated at the X-ray absorption stage (e.g. photostimulable phosphordetection systems), but the aperture dimension and sampling interval are defined by the read outmechanism.
The sampling theorem states that only spatial frequencies below(2p)−1 (the so called Nyquistfrequency) can be faithfully imaged. If the pattern contains higher frequency components, aliasing
Fig. 2-2: Scheme of the pixel structure of a detector.d is the aperture of the detector element, whilep is thesampling interval.
23
Fig. 2-3: Layout of a scanning system.
occurs. In this case the frequency spectrum of the image pattern beyond the Nyquist frequency isfolded around that frequency.The smallest sampling interval in a single image acquisition isp=d. A method for increasing theNyquist frequency isdithering, which consists in acquiring the image several times with a motionof the detector by a fraction of the pixel pitch. This technique is particularly useful when operatingscanning detection systems.
iii . Geometrical characteristics
The imaging system must be able to record the transmitted X-ray signal over the projected area ofthe organ under investigation.For example a standard mammographic cassette has a dimension of 18×24 or 24×30 cm2, whichcan give an estimate of the required area to be covered in breast imaging.There are two main geometrical approaches: one is to develop full field detectors, the other is touse smaller detectors and scan them, together with a collimation slit, as shown in figure2-3. Themain advantages and disadvantages of the two system types will be presented in section2.3.Full field detectors can be further divided in two general types: replaceable cassettes or captivesensors. The first type has the main advantage of being compatible with most mammographicstations, although it adds to the acquisition the processes of loading, unloading and specificcassette read out.On the other hand a captive receptor, which is permanently mounted on the mammographic station,allows a more simple protocol, but requires higher costs because of the need of designing a custommammographic equipment with integrated detection system. Scanning systems are always captivesensors.
All the geometrical approaches should not impair access to the interesting diagnostic regions(e.g. in mammography the patient’s chest wall) and should minimize the dead regions. This issueis particularly challenging when several detector modules are tiled in order to cover a wider fieldof view.
iv . Dynamic range and sensitivity
One of the main limitations ofSFsystems is their response curve to X-ray exposure. Figure2-4shows the relation that exists between the exposure and the optical density obtained for a film afterdevelopment. For exposures in the toe or in the shoulder region, no detail is visible. The linearregion is usually kept narrow in order to enhance the image contrast, but mistakes in exposure
24
Fig. 2-4: Typical exposure curve of a film.
time selection may lead to the need of repeating the examination. The use of a digital system canovercome this problem.
TheDR (Dynamic Range) of a digital system can be defined as:
DR=Xmax
Xnoise(2:5)
whereXmax is the X-ray fluence providing the maximum signal that the detector can accommodate,while Xnoise is the fluence that provides a signal equal to the quadratic sum of the detector and X-ray quantum noise.The higher the dynamic range, the wider the linear region of the detector response. Inmammography theDR is usually requested to be higher than 210.
In the definition ofDR, the maximum exposure supported by the detector and the minimumdetectable signal assume great importance.Since the final output of all detectors is an electrical signal, the sensitivity of a detector can bedefined in terms of the charge produced in the detector per X-ray quantum of specified energy. Thisis strictly dependent on the conversion efficiency of the specific detector, which can be expressedin terms of the energy required to release a light photon in a phosphor (e.g. 13 eV in GdSO2) orto create ane-h (electron-hole pair) in a semiconductor (e.g. 3.6 eV in high-purity silicon) or aphoto-conductor (e.g. 50 eV in amorphous selenium) or an electron-ion pair in a gaseous detector(e.g. about 30 eV). The higher the sensitivity, the lower isXnoiseat parity of electronic noise.
v . Uniformity
It is important that a radiographic imaging system provides uniformity, i.e. constant sensitivityover the entire area of the image. Patterns that could arise from disuniformities may in fact affectthe diagnostic value of the image.
From the definition ofSNRdetail in equation1:4, one can see that an increase of thedisuniformities between pixels (and thus an increase ofσ1, σ2) leads to a loss in the visibility ofthe detail. In a digital system the difference in response from element to element can be partiallycorrected with a calibration of the detector. This is usually accomplished by imaging an object ofuniform X-ray transmission, recording the detector response and using it it as a correction mask(flat field). If the detector response is linear, also a mask obtained without radiation (dark field),
25
a) Phosphor b) Columnar CsI c) Direct conversion
Fig. 2-5: Schematic of the stages of signal formation in three different kind of detectors.
to be subtracted to both the image and the flat field before the correction, can be requested. If theresponse is not linear, flat fields at various photon fluences must be collected.
Moreover, the detector performances should be monitored in order to maintain the responseconstant over time.
2.2 X-RAY CONVERSION
The basis of most medical X-ray imaging systems is a phosphor layer or scintillating screen. Thesesystems are often used in order to achieve a higher efficiency, but have also some disadvantages.The light quanta produced in the screen must be transmitted to the electronic sensor, which mustbe correctly coupled in order to achieve an efficient signal collection. During the diffusion thelight suffers multiple scattering by the phosphor grains before it escapes the screen, as shown infigure2-5a. The scattering causes image blur and resolution loss. The screen choice is a trade-offbetween X-ray absorption and blurring, since thick phosphor screens provide a higher efficiencybut cause more light spread.
The blurring problem has partially been solved by developing custom geometries for thecoupling between phosphor and detector or through the use of structured scintillating screens. Thelatter are usually fabricated using columnarly grown CsI; the cracks between the columns refractthe light, thus limiting the spread, as shown in figure2-5b. However, theFWHM of the lightspread is generally 1.5 times the thickness for a non-structured phosphor and not much smallerthan the scintillator thickness for columnar CsI.
Detectors avoiding the light conversion stage (figure2-5c) have also been developed. Thee-h(or electron-ion) pairs are driven to the collection region by a strong electric field, thus limitingthe charge diffusion and solving the blurring problem.
The materials used used for direct conversion are photo-conductors, semiconductors or gases.A good efficiency is maintained thanks to the use of high atomic number materials (mainlyselenium [68, 69, 70], but possibly also GaAs [71, 72, 73], CdZnTe [74, 75], InP [76, 77], HgI [78])or of particular geometrical configuration [6, 79, 80] in order to increase the sensitive absorbinglength, as will be presented in section3.2.
Another important advantage of direct conversion detectors is that the sensitivity is usuallymuch higher than that of phosphor screens (particularly in semiconductor materials), so that thecollected charge per X-ray quantum is higher. This allows single photon counting read out, withthe advantages that will be presented in section2.4.
2.3 FIELD COVERAGE APPROACHES
While the main advantage of full field systems is to acquire the whole mammographic imagein one single shot, scanning systems are a way of overcoming the size and costs limitations of
26
available high resolution photo-detectors: the sensor is essentially1D (One Dimensional), whilethe second dimension is acquired by scanning detector and X-ray beam across the patient.
The main advantages of scanning systems are not only the reduced costs of the materials ofthe detector but also the improvement of scattering rejection. Since anti-scattering grids can beavoided, there is an increase of the efficiency of the detector without degradation of the imagequality.
The main disadvantage of the scanning approach is the longer duration of the clinicalexaminations, that can be up to several seconds. This leads to two main consequences:
Overheating of the X-ray tube, since most of the X-ray flux is removed by the collimatorsand its exploitation is inefficient. This problem can be partially solved only by the use ofX-ray tubes with special cooling or of X-ray focusing systems [81, 82].
Unease for the patient, who must have the organ compressed for a longer time. However thescanning does not present additional problems of motion artifacts and can possibly reducethe blurring since the acquisition for each position lasts for a shorter time.
The use of multi-line detectors can strongly reduce the acquisition time.
2.4 READ OUT TECHNIQUES
X-ray detection can be handled mainly in two ways: Integration i.e. the radiation intensity is measured over a frame period by recording the level
of a quantity that typically changes as energy is deposited; Photon counting i.e. single X-ray quanta are detected as they reach the detector by
comparing the signal with a threshold level, and are then counted on a given time slot.The main advantage of integrating devices is that they can support very high input fluxes [83].
However, their noise is usually higher than that of counting systems and depends not only on thePoisson-like distribution on the number of absorbed photonsN = ηN0, but also on the averagecharge created per X-rayg, which is different for photons of different energy introducing furtherfluctuations and attributing different weights to X-rays. In particular the weight is higher for higherenergy photons, though their contribution to the contrast is smaller. The number of electronsne
collected by an integrating device in a given time slot is:
ne = ηN0g (2:6)
where N is the number of photons impinging on the detector. Stochastic amplification of photonnoise by one stage of an imaging system is shown to constitute an effective signal to the nextstage, while the underlying photon-noise component is unaffected by a subsequent scatteringprocess [84]. The fluctuation on the detected charge results:
σ2e = neg
(1+
σ2g
g2
)(2:7)
and considering that both the number of photons and the charge produced per photon are Poissondistributed we have:
σe =√
(g+1)ne (2:8)
Moreover, all integrating detectors exhibit also dark noise (reset noiseσr ) and possibly read outnoise. These are often related to temperature and cooling can help, however these noise sourcesset a limit on the sensitivity of the detector. Modern detectors present an electronic noise that canbe of the order (or smaller) than the charge created by a single photon:
σ =√
(g+1)ne+σ2r (2:9)
27
Fig. 2-6: SNRout of a counting detector compared with the one of an integrating one, as a function of thenumber of detected X-rays. The conversion factorg of the integrating system has been set to 100e−/photonand the electronics noise has been set to 200e−. η has been set to 1 in both cases.
TheSNRat the output of the detector (SNRout) results:
SNRout =ne√
(g+1)ne+σ2r
=ηN0g√
(g+1)ηN0g+σ2r
(2:10)
and is plotted in figure2-6 compared to the purely Poisson-likeSNRout =√
ηSNRin of a noisefree counting system.The DQE of an integrating system results always lower than the one of a counting system(equation2:3):
DQEintegration=g
(g+1)+ σ2r√
ηN0 g
DQEcounting< DQEcounting (2:11)
The difference is particularly significant when less then 1000 photons are detected, as can bein low dose applications, scanning systems or computed tomography where the statistics on theimage step is low.
Integrating devices can also saturate due to the accumulation of a high quantity of energy. Thissets a limit on the flux that can be integrated before the detector is read out and the pixel reset.However, frequent acquisition slots increase the reset noise component and the dead time, sincethe detector is insensitive during the read out. When minimizing the dead time by increasing theread out speed, the read out noise increases, thus limiting the sensitivity of the system.
Integrating read out is largely used (e.g. image plates,CCDs, flat panels) since it does notimpose strong requirements on the sensors and indirect detection techniques can also be applied.
On the other hand, photon counting devices reduce the read out noise and the dead time due toread out essentially to zero, but impose strict limits on the maximum input flux [10]. SPC(SinglePhoton Counting) sensors have to be chosen in order to provide the highest possible signal foreach particle to be detected, and this is usually done by using semiconductor materials (e.g. Si,GaAs, CdZnTe) or gas avalanche detectors. The signal collected from the detector element is thencompared with a threshold in order to discriminate it from the electronic noise and then counted.Several thresholds can be implemented in order to obtain energy resolution capability, allowingone to perform spectral analysis.
28
The main advantages of counting systems are: Contrast maximization, since low energy photons, which carry the contrast information
about the detail, have the same weight as high energy ones, that in integrating devicesdegrade the image quality. An absorbed high energy photon deposits a relevant fractionof energy, and since there is small intensity variation of high energy photons intensity inproximity of the detail, in integrating systems they result as a constant component which isadded to the signal due to the low energy photons. This constant component is present alsoin counting system, but its weight is lower since it is not proportional to energy;
Signal-to-Noise ratio maximization, since the only source of fluctuation on the number ofdetected photons is given by the Poisson statistics;
Perfectly linear behavior and virtually unlimited dynamic range, since the increment ofthe counters is linear and the dynamic range can be defined independently from thecharacteristics of the sensor (i.e. there is no saturation).
The noise of a correctly operated counting system is virtually zero. It depends only on thethreshold level and will be described in detail in section3.4, where the working principles ofthe read out electronic chain will be discussed.
The main limitation when using photon counting systems is given by their rate capability: if asecond photon arrives during the time required to record the previous one, it might generate a lossof efficiency of the detection system [85, 86]. The phenomena that determine this effect will bedescribed in section3.4.A loss of efficiency corresponds to a loss in the contrast resolution of the imaging system. If thedetection system efficiency does not depend on the impinging X-ray intensity, the contrast of adetail is given by equation1:3. Taking into account the efficiency loss of the electronics at highrates the measured contrast becomes [11]:
Cm =ε(I1)I1− ε(I2)I2
ε(I1)I1= C+
ε′(I1)ε(I1)
I1C (2:12)
which is valid for low contrast details and is obtained by expanding in series the efficiency as afunction of the detected intensity.Cm results lower thanC since the derivative of the efficiency isnegative and the contrast ranges between 0 and 1. The difference between the theoretical and themeasured contrast is a function of the theoretical contrast itself. The loss in contrast is smaller forlower contrast details.
Because of these characteristics the choice of photon counting devices should be preferred tothe integrating ones in particularly in presence of low intensities since a better image quality canbe obtained with a smaller number of X-ray quanta, thus limiting the dose.
2.5 EXISTING DIGITAL MAMMOGRAPHY DETECTORS
In this section a brief overview of digital detectors used for clinical mammography will bepresented.
i . Image plate
This kind of system is based on photostimulable phosphors and is probably the most widely useddigital system for radiography since the beginning of the ’80s [57].The phosphor used is usually barium fluorohalide (BaFX:Eu, where X is a halogen, usually acombination of Br and I), which contains traps in the form of atomic energy levels of the Euactivator, wheree-h pairs created by the X-rays are stored [87]. The system is contained in acassette and after acquisition it is read out by a custom device: the storage phosphor is irradiatedwith red laser light and emits deexcitation blue light [29]. Erasure of the storage phosphor is
29
performed by intense illumination by visible light before it can be used again.The pixel size of image plates is usually 100×100µm2 but 50×50 µm2 can be achieved by
using a higher sampling frequency. The phosphor is composed of fine grains in order to enhancethe image sharpness by reducing the structured noise.
These systems can be designed with single or double sided reading [88]. In systems withdouble side reading the phosphor is deposited on a transparent support, thus the blue light emittedcan be collected on both sides. The extra-light and increased thickness of the phosphor increasethe efficiency and sensitivity of the system.
ii . CCD
The use ofCCD (Charged Coupled Device)s is well established in photographic imagingand is frequently used also in digital mammography, where the devices are coupled to aphosphor [29, 89, 90, 91].
Due to the technical problems and high costs in manufacturing large area devices, thesedetectors are often used for stereotactic imaging, where the field of view is only few cm, ortiled together in scanning systems, coupled to the phosphor via a demagnifying fiber optictaper [92, 93].
CCDs are characterized by a very small pixel size, that can be down to few microns, althoughthe spatial resolution is often degraded by the light spread in the phosphor. Moreover these systemsare affected by dark noise so that cooling is usually needed.However, the greatest disadvantages of this kind of system are the long read out time and the needof shielding the device from X-rays during the read out. The charge is in fact transfered from onepixel to its neighbor down to the read out line. This problems have been partially solved with thedevelopment of scanning system withTDI (Time Delay Integration) read out.TDI sensors haveseveral parallely arranged photosensitive lines. The visual information is synchronously movedwith the movement of the object to be scanned from one line to the following one. Beside a noisereduction, there is much higher sensitivity [94].
iii . Amorphous silicon flat panel
aSi(Amorphous Silicon) flat panels are the state-of-the-art detectors for digital mammography [8,29, 66, 95].
One advantage of these systems is that they can be made large enough for full fieldDM. Theactive matrix is a large area integrated circuit consisting of manyTFT (Thin Film Transistor) [96].The photons are converted inside a phosphor, which is generally evaporated directly on thesensor [97]. A photo-diode of amorphous hydrogenated silicon converts light to electric chargeon the storage capacitance of eachDEL. The TFT is connected to a data-line for read out anddigitization. When the sensor is exposed, all the switches are in “off” state, while during the readout the switches are activated row by row and the charge is sent to the readout electronics where itis amplified and digitized. The detector is thus sensitive also during the read out phase. However,acquisition rates up to 30 frames/s can be achieved [98].TheTFT and other electronics occupy part of the pixel area, thus reducing the sensitive area of thedetector. The ratio between the photodiode and the pixel size gives the fill factor (usually between50 and 90%), which decreases when the pixel size is decreased. Standard pixel sizes for detectorsbased on such a technology are 100µm or 50µm, but the resolution is affected by the use ofscintillating phosphors.
30
iv . Amorphous selenium flat panel
Flat panels withaSe(Amorphous Selenium) as conversion element allow high efficiency directconversion of X-rays [68, 69, 99].WhenaSeis hit by X-rays, thee-hpairs created can be guided to the photo-conductor surface bythe applied electric field. The charge is then collected by electrodes with an electronics similar tothe one used inaSiflat panel.Since the field lines can be bent, the charge is collected more efficiently and the fillfactor can be kept close to 100%. The pixel size can thus be reduced without loss ofgeometrical efficiency [100]. Thanks to its high atomic number, the conversion efficiency in themammographic energy range is high and this feature, together with the increased spatial resolutiondue to direct conversion, leads to a better image quality at parity of dose with respect toaSiflatpanels. However, since the average charge created by a 17 keV X-ray is 500 e−, aSeis not feasiblefor photon counting.
The readout can also be implemented withCMOS (Complementary Metal-OxideSemiconductor) sensor arrays [101] and selenium can be replaced with other photo-conductorssuch as PbI2 and HgI2 [102].
v . Silicon counter array
This kind of system will be reviewed in detail in chapter3. The sensor consists in asilicon microstrip detector oriented with the strips parallel to the incoming radiation (edge ongeometry), so that the absorbing length is given by the strip length, that can be up to severalcm [6, 11, 103, 104, 105, 106]. The pixel size is determined by the strip pitch (down to 50µm)times the detector thickness. Several detectors are tiled together in order to cover a larger area. A20 keV photon creates in silicon about 5500e-hpairs, which are then collected by the strips. Thecharge produced by photons is discriminated from the electronics noise in a counting modality.Thanks to the high absorption efficiency and the absence of anti-scattering grids, examinationscan be performed with 1/5 of the dose with respect to traditionalSFsystems [107].
vi . Gas counter array
The use of gas detectors allows one to amplify the charge created by the X-rays through avalanchephenomena, allowing the use of counting techniques.
Parallel plate avalanche chambers with a segmented anode have been tested for X-ray imagingapplications [108]. The chambers have a thin gap filled with krypton and a strong electric fieldinduces the avalanche multiplication of the charge produced by the X-rays.
The problem of the low absorption efficiency of gases can also be solved by using longabsorption length in anedge ongeometry, where the gas chamber electrodes are oriented parallelto the impinging beam. This kind of detection system consists is 50µm RPC(Resistive PlateChamber) filled with gas at atmospheric pressure [79, 109, 110]. The X-rays convert in theRPClength with an efficiency of about 80% and the charge created undergoes a fast avalanche beforebeing collected and discriminated by the counting read out electronics. The amplitude of the signalis independent from the photon energy and the requirements on the read out are less stringent thanwith semiconductor detectors, where the avalanche stage is not present. The detector can achievea rate capability of 107 Hz/cm2, about 1 kHz/pixel
Experimental studies on the performances of MICROMEGAS and multistage GEMs are beingcarried on [110]. Some interesting results are being obtained also with micro-channel platedetectors [80].
31
2.6 SUMMARY
So far the introduction of digital X-ray mammography has been very slow compared to most otherX-ray examinations due to high costs and technical challenges to meet the high demands on imagequality and dose in mammography as well as the demands on specialized workflow support forscreening mammography [57].
Digital mammography systems are currently commercially available, both with a small areaand with full field technique. The development of full field digital systems is now intense, aswell as the development of dedicated workstations, computer aided diagnosis and other specialtechniques. Hard copy reading of digital mammograms has been the most common display modeso far, but to take full advantage of the digital concept, diagnostic as well as logistic, soft copyreading must be applied.
Full field DM is equivalent or better thanSFmammography in the detection of calcificationsand low-contrast objects in mammograms at about the same dose. Due to the higherDQE, there isa potential ofDM systems for significantly higher image quality or significantly lower dose thanconventional ones [8].
A lot of R&D work is being carried on the development of innovative systems that exploitingtheir direct conversion capability or a photon counting technique could still improve the imagequality to dose relationship with respect to commercially available digital systems [14, 68, 79,107].
The investment costs are much higher for digital than screen-film mammography today.Nevertheless digital mammography will most likely replace screen-film mammography to a largeextent, especially in large-scale operations.
32
3. EDGE ON SILICON SENSORS WITHSINGLE PHOTON COUNTING READ OUT
The detectors developed during this work are based on side illuminated silicon sensors with singlephoton counting read out.In this chapter, after highlighting the main properties of silicon and the features of microstripsensors, theedge onconfiguration for efficiency enhancement will be described. The mainrequirements for microstrip detectors read out will be shown and the electronics used for photoncounting, with the advantages already highlighted in section2.4, will be discussed, with someexamples of existing detection systems.
3.1 SILICON MICROSTRIP DETECTORS
Silicon microstrip detectors are largely used in many fields of physical research [111].The search for a new semiconductor material to replace silicon has not been successful yet becauseof the wide diffusion of the techniques for the fabrication of silicon sensors and electronicsdevices [112].
In this section the properties of silicon as a detecting material will be discussed. The workingprinciples of microstrip detectors will be described and the main issues of sensor design will bepointed out.
i . Basic properties of silicon
Semiconductors are crystalline materials whose outer shell atomic levels exhibit an energy bandstructure with a small forbidden gap. An exhaustive description of their properties can be foundin [25, 113].
Charge transport in a semiconductor is due to both electrons and vacancies (holes). Thenumber of intrinsic charge carriers depends on the temperature and on the energy gap betweenvalence and conduction band in the material. In silicon the energy gap is 1.1 eV and the intrinsiccarriers concentration at room temperature results 1.5·1015 cm−3 [114].
In pure semiconductor crystals the number of electrons is equal to the number of holes in theconduction band. This balance can be changed by introducing a small amount of impurity atomshaving one more (donors) or less (acceptors) electron in their outer atomic shell. The dopantsintegrate themselves into the lattice and introduce an additional energy level in the forbiddenenergy gap between the valence and conduction band. The presence of a level inside the forbiddengap shifts the Fermi level of the semiconductor.In the case of donors the level is close to the conduction band, thus creating an excess of conductionelectrons, while the acceptor level is close to the valence band and causes an excess of holes ascharge carriers. A semiconductor doped with donors (n-type semiconductor) has electrons asmajority carriers, while when the dopant is an acceptor (p-type semiconductor) the majority ofcharge carriers are holes.
33
ii . The p-n junction
All semiconductor detectors are based on the formation of a junction, usually obtained from thejuxtaposition of an n-type with a p-type semiconductor (figure3-1.(a)) [111, 115, 116]. Becauseof the difference of the Fermi level in the two materials, electrons drift to the p side, while holesdrift to the n side. The result is a charged region depleted from charge carriers near the junction,as shown in figure3-1.(b),(c). This region is known as depletion region, or space charge region.The charge distribution generates a built-in electric field and thus a potential difference V0, knownas contact potential, generally of the order of 1 V.Charges created or entering the depletion region will be swept out of it by the electric field.The electric field and potential as a function of the depth inside the junction are shown infigure3-1.(d),(e).
The depletion depth can be tuned by applying an external potential to the sides of the junction.When a positive voltage is applied to the p-type and a negative one to the n-type side (direct-bias)the depletion region size will decrease until the semiconductor starts behaving like a conductor.At the opposite, when a reverse bias is applied (negative to the p-side and positive to the n-side) thedepletion zone will be enlarged. The potential differenceV will be given byV0 +VB whereVB isthe external reverse bias voltage applied. It can be shown that the depletion region is proportionalto√
V.The depletion layer has also a certain capacitance, that can be easily calculated as the
capacitance of a plane plates capacitor with distance equal to the depletion depthd and is inverselyproportional to
√V, reaching a constant value when the detector is fully depleted.
iii . Silicon detectors
The primary advantage of semiconductors over other detectors is the very small average energyneeded in order to produce an electron-hole pair. The required energy is about 3.6 eV forsilicon, about one order of magnitude less than in gases and two orders of magnitude less thanin scintillators [117].
When a charged particle crosses a p-n junction (or a photon is absorbed in it) the depositedenergy creates e-h pairs, that start drifting to the electrodes under the influence of the appliedelectric field.The bias is usually chosen so that the depletion region extends throughout the silicon bulk in orderto maximize the size of the region sensitive to radiation and to reduce the noise.
The junction can be segmented as in microstrip detectors, in order to obtain position resolutionand decrease the sensor capacitance. The charge cloud drifts to the closest strip (figure3-2) andall the strips behave as independent junctions. Common strip pitches are as low as 50µm and theresolution is almost independent from the strip width.
Common microstrip detectors consist in highly doped p strips (p+ doping) on the surface of ndoped bulk. The fabrication techniques of silicon detectors are described in detail in [111].
The strip capacitance is given by the sum of the junction capacitance and the inter-stripcapacitance. The first one depends on the strip width, while the second one depends on the inter-strip distance (i.e. difference between strip pitch and strip width). The inter-strip capacitance isusually at least one order of magnitude higher than the junction capacitance.
Electrodes are deposited on the strips. Sometimes the strips can beAC (Alternate Coupling)coupled to the read out electronics by interposing an oxide layer between the strips and the metal.The coupling capacitance is much higher than that of the strip and can be neglected in the totalcalculation since the two are connected in series.
The strips can be biased through resistors connected to a common bias line. The polysiliconresistors value needs to be high (in general>20 MΩ) and uniform enough in order to obtain goodnoise performances and avoid cross talk between the strips.
34
Fig. 3-1: (a) Sketch of a p-n junction and plots of (b) charge carriers concentration and (c) charge densitydistribution, (d) electric field and (e) electric potential as a function of the distance from the junction.
35
Fig. 3-2: Structure of a simple variant of microstrip detector. A charged particle crossing the detector andcreating charge is represented with the dashed line.
Another biasing technique is the so called FOXFET biasing, which exploits the punch-trougheffect of a completely separate biasing structure [118, 119].
A n+ doped layer is needed on the backplane of the detector in order to apply the positive biasvoltage
iv . Noise of microstrip detectors
The noise of a microstrip detector is mainly due to three terms [120]: Shot noise created by the leakage current of the detector, mainly due to the intrinsic
leakage currentIdark flowing through the junction. Idark is given by the sum of threeterms: (i) Surface current due to the charges moving on the crystal surface: it is mainlydetermined by the detector fabrication technology and can be limited by the use of guardstructures; (ii) Diffusion current due to the carriers diffusion from the undepleted regions ofthe semiconductor: it depends on temperature and on the depletion depth and it is usuallynegligible at room temperature and full depletion of the detector; (iii) Bulk current due tothe charges thermally generated in the depletion region under the effect of the electric field:it strongly depends on the temperature and on the applied bias voltage and it is proportionalto the detector volume.
Thermal noise from the detector biasing resistors. The spectral current density isproportional to the inverse of the resistance value and is negligible when the potential dropacross the bias resistor due to the leakage current is of the order of 50 mV [117].
Series resistance noise due to the metal strip resistance. The spectral power density isproportional to the strip resistance.
The leakage current and biasing resistors component introduce parallel noise, while the stripresistance introduces thermal serial noise.All the three sources of noise are white i.e. do not depend on frequency.
36
a) Edge onconfiguration b) Efficiency
Fig. 3-3: a) Sketch of theedge ongeometric configuration. The cutting distance is indicated withd. b)Efficiency of a 1 cm strip long detector in edge on configuration with 450µm cutting distance.
3.2 EDGE ON SILICON SENSORS
The main problem related to the use of silicon strip detectors for medical X-ray imaging is thatthe absorption length of silicon in the energy range 10-100 keV is of the order of (or larger than)one mm so that only a small fraction of the X-rays are converted in the commonly used 300µmthick detectors when the radiation impinges on the surface of the detector (face onconfiguration).This low absorption efficiency means that the undetected radiation increases the dose to the patientwithout contributing to the image formation.Moreover, when using double sided detectors with crossed strip to acquire a two dimensionalimage, the read out needs to be faster than state of the art electronics in order to avoid ambiguitiesfor multi-hit events [121, 122, 123, 124]. These problems can be solved by orienting the detectorswith the strips parallel to the incoming X-ray beam [9].
i . The edge on configuration
Theedge ongeometric configuration was first proposed by the SYRMEP collaboration [125, 126]and is sketched in figure3-3a.The pixel size is given by the strip pitchp times the detector thicknesst. The absorbing thicknessis therefore given by the full strip lengthl , that can be of several cm. The main limitation onthe efficiency of the detector is given by the size of the undepleted region which is present inthe entrance window of the detector between the end of the strip implants and the edge of thedetector. The thickness of this region is mainly defined by the distanced between the end of thestrips and the scribe-line. This cutting distance is usually about 1.5 times the wafer thickness inorder to limit the leakage current due to the cut, but can be reduced by using innovative fabricationmethods [127, 128, 129]. The size of the undepleted region is usually smaller thand and can betuned by changing the bias voltage of the detector [130]. Figure3-3b shows the efficiency of a1 cm strip long detector with standard cutting distance of 450µm.
The efficiency of the detector inedge onorientation is much higher than inface onconfiguration and generally higher than the one of conventional screen-film systems, resultingin a significant reduction of the patient dose.
37
The X-rays are converted into electric signal without the intermediate step of conversion intovisible light with the advantages already highlighted in section2.2.Theedge onconfiguration determines an essentially1D detector and scanning is required with theconsequences pointed out in section2.3.
ii . Overview of existing edge on detectors
In this section a brief overview of some projects usingedge ondetectors will be presented. Theexperiments described are active in the field of spinal radiography and mammography.Some detectors are used in a slit-scan geometry in conjunction with an X-ray tube as shown infigure2-3. Since the divergence of the beam is not negligible, the detectors are designed with aslight strip fan out in order to avoid any parallax problem.The SYRMEP detector, optimized for SR mammography will be described in detail.The differences on the detector design resulting from the different requirements of the examinationwill be discussed.
a . Spinal radiography
Spinal cord X-ray imaging is commonly used for the diagnosis of vertebral lesions. This typeof examination is usually performed with the patient standing. The area to be imaged is about50×120 cm2 wide. A resolution higher than 1 mm is required and the optimum X-ray energy forthe examination is about 50 keV.
A “quantum X-ray radiology apparatus” based on a silicon microstrip detector inedge onconfiguration was optimized for spinal radiography by B. Hilt et al. [131, 132]. Both the thicknessof the silicon sensor and the strip pitch are 500µm. The strip length is 5 cm, corresponding toa stopping power of more than 90% for 50 keV photons. Signal processing is performed by ananalog ASIC followed by a digital one [133].Eight detectors are arranged in a linear array covering a length of about 50 cm with a dead zoneof only three strips between the modules.Dose measurements show that with this detection system it is possible to reduce the dose givento the patient by at least a factor of ten. A second version of the apparatus with an optimizedgeometry, improved spatial resolution and spectroscopic capabilities is under development.
b . Digital mammography
The requirements of a mammographic detection system have been described in detail in chapter2.A mammographic examination is usually performed in the 15-20 keV energy range so theabsorption due to the undepleted region can be very strong.
Several experiments of reducing the cutting distance have been performed at the Jozef StefanInstitute in Ljubljana (Slovenia) [134, 135]. The prototype detectors used have a strip length of4 mm, a thickness of 220µm and a strip pitch of 100µm.The detectors were tested on wafer and with cutting distances between 400µm and 136µm [104].An increase of leakage current of one order of magnitude at full depletion voltage has beenobserved only for the detector cut at 136µm. However, all detectors were operated without anyobservable increase of noise when connected toSPCread out electronics [136]. The resultingefficiency of the detector is of about 90% for 22 keV X-rays.
Instead of reducing the cutting distance, researchers of the Royal Institute of Technology inStockholm (Sweden) have proposed to tilt the detector in front of the beam in such a way thatthe device is irradiated beside the undepleted region, as shown in figure3-4 [105, 137, 138].The resulting effective dead layer ranges between 20 and 50µm. Some of the higher energyphotons escape from the backplane of the detector but lower energy ones are totally absorbed.
38
Fig. 3-4: Schematics of anedge ondetector tilted in order to increase the efficiency.
This approach is particularly effective when a polychromatic beam from an X-ray tube is used andthe low energy component is considerable.
The strip length of the detectors is 1 cm and, after the optimization of the tilt angle (about4.5), the detection efficiency is of about 95% [105, 106]. The dose can be reduced down to 1/5than in a conventional mammographic examination [107].
The strip pitch of the detectors is 50µm, and the vertical pixel size is reduced to 50µm bymeans of a slit placed in front of the detector. Several detectors are arranged in a grid in order toreduce the scanning time.
The X-ray beam is focused on the detector by means of X-ray lenses in order to reduce thescanning time and the heating of the X-ray tube [81, 82].
This detector is now produced by Mamea Imaging AB [139] and commercialized by SectraAB [107].
c . The SYRMEP detector
The research and development studies onedge ondetectors withSPCread out started at thebeginning of the ’90s [125]. The detector is optimized for synchrotron radiation applications.Scanning is not a disadvantage in this case, because the sample movement is intrinsic in the SRsetup. In order to exploit the maximum beam dimension it is necessary to stack several detectorstogether. Tilting the multi-layer detector would not be an effective way of increasing its efficiencysince the upper layers would shield the lower ones and the spatial resolution of the detector wouldbe degraded. Since the beam divergence is negligible, the strips of the detector are parallel.
The first detector prototype had 500×500µm2 pixel and only 15 channels were equipped withdiscrete read out electronics [126]. The detector has evolved in order to prove the feasibility ofclinical examination withSPCedge ondetectors.
An AC coupled FOXFET biased detector has been developed [6]. The strip length is 1 cm,while, on the basis of simulations and measurements on design structures, the cutting distance hasbeen fixed to 250µm [130]. The average undepleted thickness has been evaluated from efficiencymeasurements to be less than 150µm. The overall efficiency is about 80% at 20 keV.The pixel size is 200µm in the horizontal direction and 300µm in the vertical one, but the verticalresolution can be improved by scanning the sample in front of the beam with a step smaller thanthe wafer thickness [140]. A filtered deconvolution algorithm is then applied to the acquired data.In this way, the spatial resolution obtained is determined by the scanning step rather than by thepixel size.
Figure3-5shows how the sensors are assembled in order to obtain a multi-layer module [141,142]. The detectors were designed with an innovative trapezoidal geometry. “Full” structures arealternated to layers of “half” structures in order to allow enough space for the wire bonding tothe read out electronics and power supply [130]. A three layer prototype has been assembled andtested [45].The overall statistics of the image is obtained by summing up the information of correspondingpixels belonging to different layers, thereby reducing the acquisition time and the negative effectsdue to noisy or dead pixels [143]. The pixels in superimposed layers are aligned with a precisionof about 10%, and the space between the two half modules is of only two strips [45]. A distanceof 50 µm was kept between the layers by using kapton foils of the same thickness with holes for
39
a) Multi-layer detector stacking b) Final multi-layer assembly
Fig. 3-5: Scheme of the stacking of the SYRMEP three layers detector.
glue dripping as spacers, avoiding cross-talk effects. The width of the prototype is about 5 cm, butit would be possible to place several modules tiled in order to cover a wider area.
Further improvements of the sensors will be described in section4.1.The high efficiency of the SYRMEPedge ondetector allows the acquisition of medical images
using phase techniques still delivering a low dose to the sample [44]. The pixel size has beenreduced to 100µm by means of a slit in order to detect the narrow interference peaks.Moreover, the use of a three layers detector makes it possible to simultaneously acquire imagesbased on different techniques (e.g. absorption, diffraction enhanced, small angle scattering) ondifferent detector layers by means of a specific setup [45]. This technique results in an increase ofthe information extracted from the sample without increasing the dose delivered.
A feasibility study of breast computed tomography onin vitro tissues has been carried out withpromising results and will be reviewed in detail in section5.1[65].
3.3 FRONTEND ELECTRONICS FORX-RAY DETECTION
X-rays absorbed in a silicon detector usually interact by photoelectric effect [27]. The chargecreated is of only a few thousand e-h (about 5500 e-h for a 20 keV photon) and must be collectedby the read out electronics.It is then important that the charge collection efficiency is good and the read out electronics doesnot add noise to the signal at the amplification and shaping stages.
The signal processing is usually performed by integrated circuits [144].
i . Charge preamplifier
The first operation performed by the electronic chain is to amplify the charge collected from thedetector [145]. A charge sensitive preamplifier is commonly used. It usually consists in anOP-AMP (Operational Amplifier) with capacitive feedback, as shown in figure3-6a.We can consider that the chargeQ is stored on the feedback capacitorCF and thus the outputvoltageVout results:
Vout = − QCF
(3:1)
A large value resistorRF is inserted in parallel withCF in order to discharge the capacitor. Thefalling edge of the signal will behave like a negative exponential with time constantτ = RF ·CF .Since the feed back capacitance is usually about 1 pF and the resistor is of the order of someMΩ, the discharge time constant results of the order of some microseconds and the signal needs areshaping in order to support high rates.
It is important to notice that trying to change theRF and CF values to improve the rateresponse results in higher noise when decreasing the resistance and lower gain when decreasing
40
a) Preamplifier b) Shaper
Fig. 3-6: Basic diagram ofa) a charge sensitive preamplifier andb) a CR-RC filter with pole zerocancellation.
the capacitor value.
ii . Signal Shaping
Shaping is usually obtained by means of simple resistive and capacitive nets behaving as a band-pass filter [145]. Figure3-6bshows a simple CR-RC filter with pole zero cancellation.The CR filter at the beginning of the chain (C1,R1) basically derives the input signal and theresponse to the signal coming from the discriminator results in a falling exponential curve witha time constant that can be arbitrarily decreased. However the tail of the signal results in anundershoot, so a pole zero resistor (RPZ) is needed in parallel to the capacitor in order to avoid thebaseline shift. The signal decay constant can be chosen short enough in order to improve the ratecapability of the detector. However if the signal decay is too fast, it is difficult to detect the peakof the signal. An RC filter (R2,C2) behaving like an integrator usually follows so that the signaldecay at the shaper output results slower. Often several orders of CR-RC filters are used in orderto improve the shaping of the signal.
The peaking time of the signal can then be a good estimate of the rate capability of the system,but often a compromise has to be found in order not to decrease the signal height.The time decay characteristic of the signal is called shaping time and plays an important role inorder to evaluate the speed and noise performances of the system.
iii . Noise
Solid state detectors readout implies the measurement of charge delivered by a capacitive sourceCD that corresponds to the detector capacitance, as shown in figure3-6a[145].An infinitely narrow distributed charge Q from the detector would appear at the amplifier outputas a gaussian distribution of standard deviationENC (Equivalent Noise Charge). TheENC givesan estimate of the noise of the detection system and is usually expressed in units ofRMS (RootMean Squared) electrons.
The noise of the readout electronics is mainly due to three terms dependent on the inputtransistor fabrication [111]:
Flicker noise, Channel thermal noise, Bulk series resistance noise.
All the terms are considered to be in series with the input transistor and the first has a 1/ fdependence while the others exhibit a “white” behavior.
The overall noise of the detection system will be given by [120]:
ENC2 = ENC2detector+ENC2
readout= (3:2)
41
Fig. 3-7: Simulation of the signal formation inside a counting system: first the photon distribution is created,the noise is added and then the signal is propagated with a doubly triangular shape.
= (ENC2leakage+ENC2
polarization+ENC2metal)+
+ (ENC2f licker +ENC2
channel+ENC2bulk)
All noise terms in series (i.e. detector metal strip resistance, transistor flicker, channel and bulkresistance noise) are proportional to the detector capacitance.The noise of the detection system is then proportional to the detector capacitance and can beexpressed as:
ENC= A+B·CD (3:3)
A,B depend both on the shaper settings, as all the noise sources do.
3.4 SINGLE PHOTON COUNTING
The main advantages of the use of a counting system with respect to an integrating one havealready been pointed out in2.4.
In this section the behavior of the comparator, that digitizes the signal, will be described andthe major issues in the operation of counting read out electronics will be highlighted.
A simple simulation of the behavior of a counting system has been performed. Noise andsignal events have been generated with a random number generator. The shaping is simulated byconvolving the input signal with a shaping function, as shown in figure3-7. The signal with apositive triangle and the undershoot with a negative one. The approximation is certainly poor butit allows to extract some interesting data about the behavior of the counting system.
The main parameters for signal generation (e. g. rate, amplitude) and shaping (e.g. rising andfalling time, undershoot amplitude and duration) can be selected trough a Graphical User Interface(GUI). The simulation program is written in C [146, 147].
42
i . Comparator
A comparator is basically given by an open-loopOP-AMP (i.e. without feedback) [148]. If thesignalV is higher than the threshold levelVthres the output is driven to the positive supply voltage,while it is driven to the negative supply voltage ifV < Vthresh. The switching time is limited by theslew rate of theOP-AMP.
In order to stabilize the switching against rapid triggering by noise as the signal fluctuatesaround the threshold level, a Schmitt trigger is often implemented [149]: negative feedback isused to prevent switching back to the other state until the input passes through a lower thresholdvoltage.
A flash ADC (Analog to Digital Converter) can be designed as a net of resistors andcomparators with encoding logic [150], thus the circuit design rules used for analog to digitalconversions should be applied also to counting systems.
ii . Noise in single photon counting systems
A well operated photon counting system is virtually noise-less.However, since the electronics noise events have a gaussian distribution with a standard
deviationENC, the probability that an event is higher than the threshold is finite and will begiven by [151]:
P =∫ +∞
Qthr
e−x2
ENC2 dx=1−er f( Qthr
ENC)2
(3:4)
WhereQthr is the threshold value expressed in signal charge.If one considers white noise, its average frequency will be defined by the shaper settings and wecan approximate it with half the inverse of the shaping timeTs.The number of noise countsNnoise in a time interval∆t will then be:
Nnoise∼∆t2Ts
1−er f( QthrENC)
2(3:5)
An increase of the rate capability of the system by decreasing the shaping time of the signalworsens the noise characteristics of a counting system because the noise detection rate is increased.
The presence of noise, however affects also the detection capability of photons, since theirsignal also have height fluctuations with standard deviation given by theENC, so that somephotons will be lost. The threshold value will then have to be placed at a level considerablyhigher than theENC, but still lower than the signal height.
The behavior of the counting system for differentENC values has been simulated. Figure3-8shows threshold scans simulated for variousENC values, a shaping time of 250 ns and 100 kHzphotons with Poisson-like distribution. It is clear that theSNRsignal must be greater than 4 in orderto correctly operate the counting system.
iii . Flat field correction
A detector usually present disuniformities which are caused by sensitivity fluctuations of theelectronics or of the sensor over the active area [10].
The correction of pixel-to-pixel variations is important in order to increase the visibility of thedetails in the image as discussed in section2.1.
One of the reasons for a non-uniform threshold distribution is the area-dependent mismatchbetween transistors, which affects both gain andENC of the channel. This does not seem to playa major role for a counting system if the threshold is set comfortably above noise and below thebeam energy, while threshold adjustment is essential for applications with threshold settings close
43
Fig. 3-8: Threshold scan of a at various ENC values
to the beam energy.Disuniformities of the electronics can be corrected by calibrating each pixel individually. This
can obtained by using a threshold tuning circuitry in order to adjust the threshold on a channel bychannel basis narrowing the distribution on the whole detector.
The sensor can contribute to the non-uniformities because of local fluctuations in materialresistivity, doping, impurity and defect level distribution [152]. These characteristics can affectthe radiation absorption, charge creation and collection in the sensor.
These differences are usually corrected by means of aflat field correctionas described insection2.1. This method is effective in most cases though it shows some limitations in case thebeam is polychromatic, due to the beam hardening after the sample [153].If the detector response depends on the signal rate, flat fields must be acquired over a range ofintensities.
iv . Charge sharing
Some problems can occur when the charge cloud generated by a single photon is spread overseveral pixels [105]. In this case the behavior of the device depends on the threshold settings: ifthe threshold value is high, the photon will not be counted in any of the pixels, while if it is lowthe signal could be higher than the threshold in several pixels and then counted by many of them.
In order to overcome the problem, the ideal threshold value should be exactly half of the pulseheight, so that the signal would be assigned to only one pixel. This is not possible when usingpolychromatic beams because different energies correspond to different signal heights, but it isvery difficult even with monochromatic radiation because of noise and disuniformities betweenchannels.
The charge sharing imposes limits on the size of the pixels that should not be smaller than50µm.
The only way of fully overcome this problem is to keep a low threshold and analyze thepresence of coincidences between neighboring channels. An improvement of the spatial resolutionof the detector could come from the search of the center of mass of the signal, that can be obtainedwith a amplitude resolution for signals in coincidence over neighboring channels. However this
44
Fig. 3-9: Processes that lead to a loss of efficiency at high rates: when two signals pile up the loss ofefficiency happens at low threshold values, while when the baseline is not properly restored the efficiencyloss is measured at high threshold values.
improvement of the detection system would also require an enhancement of the rate response anda reduction of noise.
v . Rate capability
The dependence of a counting system performances from its rate response have been described insection2.4.
In counting systems, the loss of efficiency at high rates is mainly determined by signal pile-upand baseline shift, as shown in figure3-9. When the signals pile up in the region around the peakof the signal, a loss of efficiency can be observed at low threshold value, while in the second case,where the latter signal rises upon the undershoot of the first, the efficiency loss can be measured athigh threshold value. An optimization of the threshold level is then important in order to improvethe behavior of the system and has to be made as a function of rate and pulse height.The pile up determines a paralizable behavior of the detector, with a dead time of the order of theshaping time, while the baseline shift effect has a mixed behavior since its dead time is delayedfrom the event [115, 116].
The response of a counting system to various photon rates has been simulated. Figure3-10ashows the signal waveform at different rates, as obtained from the simulation for a peaking time
a) Waveform b) Threshold scan
Fig. 3-10:a) Simulation of the signal at the entrance of the comparator at different rates andb) Thresholdscans of a counting system with various photons rates. The peaking time has been set to 250 ns, the shapingtime to 1µs and the undershoot to 10 % of the signal amplitude for 500 ns.
45
a) Peaking time b) Threshold
Fig. 3-11: Simulated efficiency of a counting systema) with different shaping settings (Tp=100 ns,Ts=500 ns,Tu=250 ns, U=10%;Tp=250 ns,Ts=1 µs, Tu=500 ns, U=10%;Tpeak=500 ns,Ts=2 µs, Tu=1 µs,U=10%) and threshold set at half of the signal amplitude;b) different threshold settings (half, equal to and1.5 times the signal amplitude) with shaping settings as in figure3-10.
Tp=250 ns, a shaping timeTs=1 µs and an undershoot amplitude U=10% of thePH(Pulse Height)and durationTu=500 ns. Figure3-10bshows the simulated threshold scans of the same countingsystem as a function of the impinging Poisson-like rate. With these settings the signal pile-up is themost important effect, resulting in a loss of counts at low threshold values. However, the pile-updetermines an increase of counts at high rates for thresholds higher than the signal amplitude.
Figure3-11ashows the efficiency of the counting system for three different shaping settings(Tp=100 ns,Ts=500 ns,Tu=250 ns,U=10% ;Tp=250 ns,Ts=1µs,Tu=500 ns, U=10%;Tpeak=500 ns,Ts=2 µs,Tu=1 µs, U=10%) and threshold set at half of thePH.The data have been fitted with the efficiency function of a paralizable detector and the resultingdead time are 350 ns for the fast settings, 800 ns for the intermediate ones and 1.5µs for the slowsettings. The results are compatible with the signal triangular shape and, with these settings, thepredominant effect is the signal pile up.
Since the rate response of the detection system is very sensitive to the threshold settings, theefficiency of a counting device with different threshold levels has been simulated, as shown infigure3-11b.When the threshold is set at exactlyPH, the efficiency is about 50 %, but the dead time resultssmaller than when the threshold is 0.5·PH since the time that the signal is over the threshold isshorter.By setting the threshold higher than the signal amplitude, the simulated efficiency results verysmall at low rates, but increases with the photon intensity.
It is also interesting to point out that at high rates, the variance on the number of countsbecomes lower than the mean [86]. Figure3-12ashows that this effect is present for all thresholdvalues. The variance and mean of the counts are calculated on 500 pixels.
Since the fluctuations on the number of counts become smaller with rate, theDQE(defined inequation2:3) will increase at high rates. Figure3-12bshows theDQE for threshold set at half ofthe signal amplitude, at exactlyPHand at 1.5·PH.
Figure3-13ashows the simulated measured contrast as a function ofthe counting rate for a
46
a) σ2/Mean b) DQE
Fig. 3-12:a)Variance to mean ratio andb) DQE simulated for threshold set at half of the signal amplitude,at exactly the pulse height and at 1.5 times PH. The legend refers to the threshold settings, while the shapersettings are the same as in figure3-10.
detail of theoretical contrast 10%. For threshold set at half of the signal amplitude or equal toPHthe contrast gets lower with rate, as expected from equation2:12. Since the efficiency for thresholdset atPH is more constant with rate, also the contrast is less influenced by the photon flux.For threshold higher than the signal amplitude, the contrast results much higher than the theoreticalone. This could also be expected from equation2:12 since in this case the derivative of theefficiency as a function of rate is positive.
Figure3-13bshows theFOM (defined in equation1:5) calculated for a detail of 500 pixels and10% contrast. It is expressed in arbitrary units since it is simply obtained by dividing theSNRdetail
for the square root of the number of photons generated by the simulation program. It is interestingto point out that at high rates theFOM is higher for higher thresholds.
Though with these settings theFOM never reaches the one obtained at low thresholds and lowrates, it is possible to severely reduce the acquisition time. However theSNRdetail can be increasedby increasing the statistics using a slightly longer acquisition time. This is certainly a bad solutionin medical imaging applications, where the dose given to the patient should be limited, but couldhelp to reduce the acquisition time and increase the visibility of low contrast details for examplein industrial imaging.Moreover, an increase of the threshold could further enhance theSNRdetail in noisy systems, wherethe presence of noise counts at low thresholds can determine a loss of visibility of the details.
The counted intensity cannot be directly used for evaluating the absorption coefficient ofthe sample (as needed e.g. in tomography) but has to be converted back to the real number ofimpinging photons. This operation is possible thanks to the highSNRdetail, knowing the efficiencyof the system as a function of rate.Moreover the use of a threshold higher than the pulse height improves the contrast only in a welldefined range of intensities and could not be used for applications where a very high dynamicrange is required (e.g diffraction experiments).
However, the implementation of a double threshold would allow a strong improvement of therate capability of the system. Figure3-14shows the efficiency of the detection system obtainedby summing up the counts collected with a threshold set at half of the signal amplitude, with those
47
a) Contrast b) FOM
Fig. 3-13: a) Ratio between measuredCm and theoreticalCt contrast andb) FOM simulated for a 10 %contrast detail with threshold set at half of the signal amplitude, at exacly the pulse height and at 1.5 timesPH. The legend refers to the threshold settings, while the shaper settings are the same as in figure3-10.
with threshold set at 1.5·PH.The efficiency with such setup decreases at half the speed of the case with threshold set at halfthe pulse height. The loss of efficiency is due to the triple pile-up phenomena that arises at veryhigh rates. Multiple thresholds can further enhance the rate capability. This implementation isrelatively simple with monochromatic radiation. However, methods for increasing the electronicsspeed have been implemented also for the detection of polychromatic radiation [154].
Fig. 3-14: Efficiency of a counting system with threshold set at half and 1.5 times the signal amplitude andobtained by summing up the counts obtained at both thresholds. The shaper settings are the same as infigure3-10.
48
vi . Overview of photon counting ASICs
In this paragraph a few existingSPCASICs will be described in order to evaluate the state-of-the-art and compare their performances with the read out electronics used for this work. Thisreview does not mean to be exhaustive and only fewASICs used for the read out of silicon stripdetectors will be described. The attention will be focused on their limitations in order to highlightthe R&D work that is still needed for the optimization of an ideal photon counting detector. ThenewASIC FROST(Frontrad Read Out sySTem) developed for improving theSYRMEPdetectorperformances will be presented in detail in the next chapter.
a . CASTOR
CASTOR has been designed at LEPSI (France) in order to operate theSYRMEP microstripdetector [136].
TheASIC fabricated in 1.2µm CMOStechnology and is made of 32 channels each consistingof a charge preamplifier, a CR-RC shaper, a comparator and a 16-bit counter with serial readout.
The gain is 190 mV/fC while theENCis 95 e− for a detector capacitance of 2 pF and the noiseslope is 17 e−/fC [155]. The simulated peaking time is 850 ns, but the measured shaping resultedof severalµs and the undershoot duration is of the order of 10µs [143]. A loss of efficiency canalready be observed with a rate of 10 kHz.
TheASIC has been largely used for the development of theSYRMEPdetector, assembling athree-layer detector of 256 channels per layer, as described in section3.2[142].
b . RX64
The RX64ASIC has been designed for dual energy imaging in mammographic and angiographicexaminations [156]. It is derived from the previous RX32 and COUNT32ASIC [157].
TheASIC is formed by 64 channels, each consisting in a charge preamplifier, a shaper and acomparator. The signals are counted by 20-bit asynchronous counters.I/O (Input/Output) handlingand acquisition controls are integrated on theASIC.
The gain is in the range 370-650 mV/fC, while theENC is 170 e− for a detector capacitanceof 2.5 pF with 700 ns peaking time. The peaking time can range between 500 ns and1 µs [158, 159, 160].
Prototypes of 128 and 384 channels have been assembled and tested. A new version of theASIC with a double threshold is now under design.
c . DIFFEX
DIFFEX is a module designed at CCLRC Rutherford Appleton Laboratories (UK) for themeasurements of 5-20 keV X-rays in diffraction experiments atSRfacilities [161].The ASIC is formed by 64 channels, each featuring a low noise charge preamplifier, a CR-RCshaper, a discriminator, a 4-bitADC and eighteen 15-bit counters for storage. TheASIC can workin photon counting mode. A high counting rate modality can be selected in order to enable aspecial dead time circuit to improve the counting rate capability. However it can also be operatedas a 16 channels multichannel analyzer, with 15-bit capacity for each bin. A charge sharing checkbetween neighboring pixels can be enabled and shared events are stored in separate counters. Theenergy spectrum is thus cleaned up by low amplitude events due to charge sharing and the spatialresolution is enhanced.
The readout can be carried on while acquiring new data for dead time free operation.TheENCis 140 e− for a 2 pF detector capacitance and the noise slope is 40 e−/pF with 100 ns
peaking time. The peaking time can be selected down to 50 ns. In this case theASIC can operate
49
at rates higher than 1 MHz without energy resolution.The detector module is obtained by assembling 16ASICs, direct bonded to 1024 100µm pitch
microstrips [162], however there are no data about an installed DIFFEX system.
d . MYTHEN
MYTHEN is a module designed at the Swiss Light Source for diffraction experiments.EachASIC consists of 128 channels each made of a charge sensitive preamplifier, two shapers, asingle level comparator and a 18-bit pseudo-random counter. Each channel has a 4-bit DAC forthe fine tuning of the comparator threshold [163].
The input pad pitch is 50µm in order to allow direct bonding to the detector. TheASICs aredesigned in order to be daisy-chained.TheENC of the system is 240 e− and the peaking time is of about 250 ns, allowing a maximumcounting rate of 1.4 MHz.
A 15000 channels system is operating at the Swiss Light Source.TheASIC was designed inDMILL (Durci Mixte Isolant Logico Lineaire) technology, but a
new improved 0.25µm CMOSversion is now under test [164].
3.5 DISCUSSION
Edge onsilicon microstrip detectors have been largely used for X-ray imaging applications due totheir high efficiency in the energy range 10-100 keV. Interesting results regarding further efficiencyenhancements can arise from novel manufacturing techniques [127, 128, 129]. The “active edge”fabrication technique has proved cutting distances as small as 15µm, thus leading to almost 100%efficiency.
In this geometrical setup it is necessary to rely on scanning techniques. Due to theserequirements, the main limitation connected with the use ofedge ondetectors in clinicalexaminations is the long duration of the acquisition. This problem has been overcome byassembling arrays of detectors covering large areas [45, 142] and by developing fast low noiseread-out electronics, reducing therefore the time of each acquisition step [11, 143]. In this way thetime of image acquisition is compatible with the constraints of a clinical examination.
The search for a new material to replace silicon in electronics has been active for years but hasnot been yet successful. On the sensor side, a lot of efforts have been spent on the development ofGaAs pixel detectors [71, 72, 73, 165], but the only material different from silicon that is currentlyused in medical imaging is selenium [68, 69]. However, the low sensitivity of the photoconductordoes not allow to perform photon counting read out.
Counting detectors allow the maximization of the visibility of the details in the image. Themain issues in frontend electronics design are:
the noise, in order to detect low energy photons; the speed, in order to exploit high radiation fluxes, like in SR experiments; the possibility of assembling large area systems, which is mainly determined by the space
occupancy of the ASICs and by the possible disturbs that one chip creates to the neighbors(mainly cross-talk and electromagnetic noise).
Current counting systems are able to discriminate photons of energy lower than 10 keV, with acounting speed higher than 1 MHz, however there is only one operating detector with a largenumber of channels [164].
There is a trend toward an energy characterization of the detected photons. When usingpolychromatic beams a spectroscopic capability could be used in order to better characterize theimaged sample, or in order to apply innovative techniques like dual energy imaging [59, 60, 61]and K-edge subtraction [62, 63]. The implementation of multiple thresholds can be useful also in
50
applications using monochromatic radiation in order to enhance the spatial resolution or the ratecapabilities of the system.
Counting pixel systems are also rapidly developing, with the advantage of a reducedcapacitance of the detection system [70, 166, 167].
51
52
4. FRONTRAD
The FRONTRAD experiment aims to upgrade theSYRMEPdetection system in order to provethe feasibility of clinical digitalSRmammography [143].
In the geometry used at the SYRMEP beam line, the duration of a mammographic exam isgiven by the time needed for each step of the acquisition times the number of vertical steps. Thetime slot for each step depends on the statistics required, the intensity of the incident beam, theorgan thickness and the efficiency of the detector. Figure4-1 shows the total duration of theexamination as a function of the maximum electronics rate. It is represented by a band insteadof a curve since it shows the duration of the exam for breasts of various thicknesses (from 2.5to 6 cm when compressed). The minimum duration of the exam has been estimated requiring astatistics of 5000 photons per pixel (100×300 µm2) using a monochromatic beam of the energythat minimizes the acquisition time for each breast thickness; 250 vertical steps are required inorder to scan a 15 cm sample with a two 300µm thick layers detector.At low electronics rates the exam duration is limited by the maximum rate accepted by theelectronics, while at high rates it is limited by the detected X-ray flux, which depends on theintensity of the beam, the detector efficiency and the absorption by the organ.
CASTOR is able to support an incident rate up to 10 kHz without considerable efficiency loss,so that the time duration of the exam would be of about 2 minutes. The goal ofFRONTRADis todevelop a digital system able to work with the full intensity of the used synchrotron beam [168].
a) 2 GeV b) 2.4 GeV
Fig. 4-1: Total duration of a mammographic examination for various breast thicknesses as a function of themaximum electronics rate, using a two layer FRONTRAD digital detection system. The two plots representthe two possible electron energies at which Elettra is operated.
53
Fig. 4-2: Detectors distribution on the wafer.
A great improvement is needed in particular in order to enhance the rate capability of the readoutelectronics with respect to CASTOR.
In this chapter the new sensors and readout electronics developed the project will be describedand the measurements acquired with the first prototypes will be presented.
4.1 THE SENSORS
TheFRONTRADsilicon microstrip detectors have been manufactured by Hamamatsu (Japan) onhigh resistivity silicon wafers [169].
Seven different types of detectors were designed on the same set of masks, as shown infigure 4-2. All the detectors are 300µm thick. The strip pitch can be 50µm or 100µm, thestrip length varies between 1 cm and 2.1 cm. The width ranges between a few centimeters (fordetectors used for test purpose) and 13.5 cm.
Thanks to the high resistivity of the wafer (>4 kΩ) and to the good quality of the fabricationprocesses, the leakage current results lower than 10 nA/cm2 in all wafers for bias voltages up to100 V, as shown in figure4-3a. Full depletion is reached at about 40 V, but the detectors areoperated at 60 V in order to reduce the size of the undepleted region and increase the chargecollection efficiency of the sensor.
The detectors have been designed in order to minimize the undepleted region in the entrancewindow of the sensors. For this purpose, they have a guard ring on only three sides, as shownin figure 4-4. The distance between the border of the detector and the bias ring ranges between240 and 440µm. No significant difference in the detector leakage current has been measured indetectors with different cutting distances, as shown in figure4-3b[11].
Figure 4-5 shows the efficiency of theFRONTRAD detectors as estimated from theirgeometric characteristics. It is represented by a band instead of a curve since it depends on thestrip length and on the cutting distance, which are different for the various designs.
The detectors have been designed and fabricated in order to limit the sensor noise contributionto the overallENC, as described in section3.3. Figure4-6 shows the various noise componentsas a function of the readout electronics peaking timeTpeak, as calculated in [120]. Since theENC
54
a) Current density b) Cutting distance
Fig. 4-3: a) Average leakage current density of the FRONTRAD sensors andb) total leakage current fortwo detectors of type det4 with different cutting distance.
Fig. 4-4: Design of the detectors and picture in detail of a corner of the sensor. The guard ring is on onlythree sides.
Fig. 4-5: Efficiency of the FRONTRAD detectors.
55
a) ENCleakage b) ENCpolarization c) ENCmetal
Fig. 4-6: Noise components due to the detector as a function of the readout electronics peaking time.a) ENCleakagehas been calculated for 50 pA leakage current per strip, whileb) ENCpolarization has beencalculated for biasing resistors of 50 MΩ (as measured by the producer) andc) ENCmetal for 20 Ω stripresistance and for a strip capacitance of 5 pF (dashed line), 10 pF (dotted line) and 15 pF (solid line).
due to the leakage current and to the polarization resistor is in parallel, it is proportional to thesquare root ofTpeak, so that better noise performances can be obtained by reducingTpeak. On theother hand, theENCdue to the resistance of the metal strip is in series and consequently inverselyproportional to
√Tpeak. Considering that this last component is much bigger than the other two,
great care has to be taken in controlling the strip resistance in order to operate the detectors at highrates. Moreover,ENCmetal is proportional to the strip capacitanceCstrip, which also influences thereadout electronics noise performances (equation3:3).
Cstrip is mainly determined by the strip width, from which depend both the junction and theinter-strip capacitance. Figure4-7shows the total strip capacitance for detectors of 100 and 50µmpitch. The interstrip capacitance has been approximated to that of two wires spaced as the strips(i.e. strip pitch minus width) [169]. Cstrip is proportional to the strip length, which in this case isup to 2 cm.
In order to limit the capacitance without compromising the charge collection efficiency of thedetector, the strip width has been set to 2/3 of the strip pitch, so thatCstrip is of the order of 6 pFfor 2 cm strip detectors.
The read out electronics isAC-coupled and the coupling capacitance are 70 pF for 50µm and160 pF for 100µm strip pitch. In both cases the coupling capacitance is higher than 10 timesCstrip,in order not to increase the detector capacitance.DC (Direct Coupling) pads are also present.
4.2 THE FRONTEND ELECTRONICS
In order to improve the rate capability of the detection system, a new photon countingASICcalledFROSThas been designed by a collaboration betweenINFN (Istituto Nazionale di FisicaNucleare) Trieste and Aurelia Microelettronica [168].
FROSTis a mixed analog-digitalASIC consisting of 64 channels fabricated inVLSI (VeryLarge Scale of Integration)CMOS0.8µm technology (figure4-8a). The channels are completelyindependent and they work in parallel during the acquisition phase, while their content is sent outserially during the read out.
Each channel consists of (figure4-8b): a low noise folded cascode preamplifier with capacitive feedback with adjustable
polarization voltage;
56
a) 100µm pitch b) 50µm pitch
Fig. 4-7: Strip capacitance per cm as a function of the strip width fora)100µm andb) 50µm strip pitch.Thecases of strip with zero or equal to the strip pitch are obviously senseless.
a) FROST b) Channel layout
Fig. 4-8:a)Picture of the ASIC FROST andb) layout of a channel.
57
Fig. 4-9: Schematic layout of the readout system.
a CR-RC2 shaper with pole-zero cancellation; a discriminator with a variable threshold with Schmitt trigger and hysteresis; the threshold
is composed of a part common to all channels generated by a 6 bitDAC (Digital to AnalogConverter) and a part adjustable for each channel generated by a 3 bitDAC;
an asynchronous 16 bit counter with serial readout in both directions and with a maximumreadout speed of 140 MHz.
The shaper output of channel 0 is buffered and taken out for monitoring the working conditionsof theASIC analog section. A calibration input with a 200 pF internal test capacitor is provided.The digital section allows both an acquisition and a readout test mode and generates an overflowlevel if any of the channels count more than 216-1. TheASICs are designed in order to be daisy-chained.
4.3 MEASUREMENTS
Several prototypes of the detection system of different size have been developed in order toevaluate the performances of theASIC.
A schematic of the readout system used is shown in figure4-9. Several multilayer printedcircuit board have been designed byINFN Trieste and produced by Ilfa (Germany) in order to test
a) Repeater b) I/O register
Fig. 4-10: Picture ofa) the FROST repeater andb) the VME 16 bit I/O register.
58
Fig. 4-11: Picture of the single ASIC FROST PCB.
theASICs. The system assembly andASIC bonding have been performed by MIPOT (Italy).A PCB(Printed Circuit Board), calledFROSTrepeater, has been developed in order to distributethe supplies and the signals to theASIC PCB(figure4-10a).
The timing signals are controlled by aPC(Personal Computer) and sent to the repeater througha VME (VERSA Module Eurocard) 16 bitI/O register (figure4-10b) [170]. The acquisitionprogram is written using the Tcl/Tk graphical interface and shared libraries implemented inC [147, 171]. The sample movement is controlled by micrometric motion stages addressed byGPIB (General Purpose Interface Bus) [172].
i . Single ASIC system
The first measurements usingFROST have been performed using a singleASIC in order toevaluate the main characteristics of this new read out electronics.
The detector used for the first tests is a silicon microstrip detector manufactured by SINTEF(Norway) with 50µm strip pitch and 300µm thickness. Each readout channel was bonded to twostrips in order to obtain a pixel size of 100µm . The dead zone in front of the strips is 0.9 mm,while the strip length is 1 cm. Ten guard rings keep the dark current very low (few nA) but theabsorption efficiency of the detector results also quite low.
Figure 4-11 shows the picture of the singleASIC system. TheASIC absorbs a current of140 mA and the power consumption is about 11 mW per channel.
Figure 4-12a shows the shape of the analog signal ofFROST channel 0 using photonsgenerated by an241Am source. The peaking time is of about 240 ns and the signal ends within1 µs. No significant undershoot is present.
In order to evaluate the noise of the electronics, the buffered analog output of channel 0 oftheASIC has been fed into anADC LeCroy 3511. Figure4-12bshows the spectrum of a241Amsource. By calculating the ratio between the 60 keV photon peak position and itsFWHM, it ispossible to evaluate theASIC electronic noise, which results to be about 870e−, very close to thedesign requirements of 800e−. The signal had to be differentiated before being put into theADCand this derivation step can easily explain the difference.
TheASIC has been tested using a HP33120A pulse generator in order to evaluate its gain andoffset.
Figure4-13ashows the 6 bit threshold scan for different 3 bitDAC values for aFROSTchannelfor 1 fC pulses injected using the calibration input of theASIC. TheLSB (Least Significative Bit)value of the 3 bitDAC is the opposite of the angular coefficient of the line obtained by fitting the3 bit DAC value and the threshold scan flex point position. The distribution of the 3 bitDAC LSBvalue has a 10% spread among the channels.
Stair pulses of different amplitude have been injected using the calibration inputs in order to
59
a) Analog signal b) Spectrum
Fig. 4-12:a)FROST analog signal andb) spectrum of 60 keV photons from a241Am source. The solid linefitting the photon peak is a gaussian whose parameters are shown.
measure theASIC gain. The input charge has been evaluated using for the internal calibrationcapacitance the nominal value of 200 pF. Figure4-13bshows threshold scans for different inputcharge values for aFROSTchannel. The gain is given by the angular coefficient of the lineobtained by fitting the input charge versus the flex point position. The mean gain for the 64FROSTchannels examined is about 125 mV/fC with a 4% spread, while the offset has a spread ofonly 2% after the 3 bit threshold has been adjusted.
a) DAC 3bit b) Signal amplitude
Fig. 4-13: Threshold scan of one FROST channel ofa)1 fC pulses at different 3 bit threshold values andb)for input stair pulses of different amplitude. In both cases, aner f function is fitted with the experimentalpoints.
60
a) Threshold scan b) Efficiency
Fig. 4-14:a) Threshold scan for 1.2 fC Poisson-distributed pulses at different rates.b) Mean efficiency of64 FROST channels compared with CASTOR efficiency.
A fixed number of Poisson-distributed pulses has been injected at different rates in thecalibration inputs in order to evaluate theASIC behavior at high rates. Figure4-14ashows thethreshold scan curve as a function of rate. A loss of counted pulses is observed at high rates, dueto the pile up phenomena described in section3.4. The expected increase of counts for thresholdhigher than the pulse height is also observed.TheASIC efficiency can be calculated from the ratio between counted and injected pulses. Themean efficiency is shown in figure4-14band is very uniform on all the channels of theASIC. Theefficiency is 100% up to 50 kHz and remains higher than 90% up to 200 kHz, in agreement withthe results of the simulation in figure3-11afor timing settings close to theFROSTspecifications.
The singleASIC system has also been tested withSRat theSYRMEPbeam line. The use ofphotons allows to obtain data without the possible signal distortions due to the pulse generator.However, the setup the the beamline is more noisy.
The gain has been calculated by acquiring threshold scans with photons of different energies,considering that it takes about 3.6 eV to generate ane-hpair. The data are then fitted with aner ffunction and the energy linearity and gain of theASIC are evaluated by fitting the charge producedand the flex points position with a straight line. The calculated mean gain is 120 mV/fC with aspread of about 5% on the channels, while the offset spread is just 2% after the fine threshold hasbeen adjusted. The gain value is slightly lower than that measured in laboratory possibly due to amiscalibration of the input capacitance.
The highSR intensity allows to evaluate the rate response of the ASIC at very high rates.Figure4-15ashows a threshold scan at 32 keV for different incident photon rates obtained byputting aluminum filters of various thickness between the monochromator and the detector. Thethreshold scan shape at high rates is very different from theer f function expected, and for rateshigher than 1 MHz the number of counts results lower than at 700 kHz in the same time interval.The efficiency decreases at higher thresholds and this result can be due both to a baseline shift orto a high noise level, as discussed in section3.4. The latter is probably the cause of the efficiencyloss in the case ofFROST, since negligible undershoot is observed in the analog signal.
Figure4-15bshows the relationship between photons counted by the detection system andnumber of X-rays that impinges on each detector pixel. The incident flux is evaluated from the
61
a) Threshold scan b) Efficiency calculation
Fig. 4-15:a)Threshold scans at 32 keV for different X-ray rates for a FROST channel andb) efficiency lossas a function of rate: the straight line interpolates the experimental points at low incident rates and showsthe expected detected rate for 100% electronic efficiency.
a) Efficiency b) σ2/Mean
Fig. 4-16: a) Mean FROST efficiency as a function of rate at different energies compared with CASTORefficiency. b) Variance to mean ratio for the images background at different rates. The acquisition time is0.1 s except where differently specified.
62
a) b) Contrast
Fig. 4-17: a) Image of a column of disks of the C/D phantom acquired at 22 keV and 100 kHz andb)measured contrast for the disks of the contrast detail phantom as a function of the rate. The solid lines arecalculated from equation2:12using the mean efficiency of the ASIC at 22 keV from figure4-16a.
current measured by the ionization chamber. If the electronics efficiency were 100% at all rates,the points should lay on a straight line, whose angular coefficient is the silicon sensor efficiencyη. The sensor efficiency can be evaluated by fitting the experimental data at low rates (wherethe electronics efficiency is considered 100%) with a straight line. The measuredη is closeto the values evaluated from the geometric characteristics of the detector. This means that thediscrimination between noise and signal is good enough to count all the photons impinging on thedetector.
In order to evaluate the contribution to efficiency given by the electronics, it has beenconsidered the ratio between the data and their projection on the straight line of figure4-15b, whichrepresents the photons absorbed by the detector. The mean efficiency is plotted in figure4-16afordifferent energies. It results to be quite uniform on all the channels and is in good agreementwith the efficiency measured in laboratory (figure4-14b). The dependence of the efficiency fromthe photon energy is negligible, however there is a slight increase at 32 keV due to the higherSNRsignal.
Figure4-16bshows the ratio between the variance and the mean calculated for the backgroundof the images taken at different rates. If the detection system followed the Poisson statistics thisratio should be 1. For low rates increases the acquisition time, and so the number of noise events,resulting in a variance higher than the mean. For rates higher than 300 kHz the electronics saturatesand the variance results to be less than the mean. This behavior is compatible with the simulation,as shown in figure3-12a.
The single ASIC system has also been used in order to acquire images of aC/D(Contrast/Detail) phantom (Gammex,RMI 180) for contrast resolution measurements at differentrates, as shown in figure4-17a. The phantom consists of plexiglas disks of different thicknesses,whose theoretical contrast can be calculated from equation1:3by using the attenuation coefficientof plexiglas.
Figure4-17bshows the measured contrasts for the disks of theC/D phantom as a function ofrate. There is no considerable loss of contrast up to 100 kHz. The solid lines in figure4-17barecalculated from equation2:12using the mean efficiency of the ASIC at 22 keV from figure4-16a.
63
Fig. 4-18: Picture of the 4 ASICs system.
ii . The four ASICs system
The first multi-ASIC system is made of 4FROSTs bonded to a 244 channels Hamamatsu detector(described in section4.1) and is shown in figure4-18.
Gain and efficiency measurements have been performed on the system and the results werecompletely compatible with the ones obtained for the singleASIC assembly.
Images of aC/D phantom have been acquired in order to measure the contrast resolution atdifferent rates. The measured contrasts for the disks have been compared to the theoretical ones.The experimental points were close to the predictions and showed little correlation with the photonrate up to 200 kHz (figure4-19). The faintest visible disk has a contrast of 0.6%.
Figure4-20shows an image of the Ackermann phantom (Gammex, RMI 160) [173] acquiredat 25 keV and 80 kHz. The phantom contains mammographic details of decreasing size. Thedetails of the first four series are visible. Since the acquisition time is not adjusted via a real timesystem, some lighter horizontal lines are visible, due to fluctuations in the timing of the acquisition
a) b) Contrast
Fig. 4-19:a) Image of a C/D phantom at 25 keV at 90 kHz andb) plot of the measured contrast for the 6thickest disks at 25 keV as a function of rate.
64
a) 300µm
b) 100µm
Fig. 4-20:a) Image of the Ackermann phantom acquired at 25 keV at 80 kHz with 300µm vertical step andb) of a detail acquired at the same energy and rate with a 100µm vertical step.
system.
iii . The 10 cm ASICs assembly
A 16 ASICs system has been assembled, as shown in figure4-21. The 1024 channels are bondedto a 12 cm long Hamamatsu detector with 100µm strip pitch described in section4.1. The widthcovered is 10 cm.
Test measurements have been performed on the system. The complicate structure of thePCBmade the system quite noisy. The DAC current bias is shared between all theASICs causing amalfunctioning of the system. The reference voltage of the DAC was very dishomogeneous on thevariousASICs and the adjustment of the threshold on a channel by channel basis is not possible.The problems found can be probably solved with a redesign of thePCB.
The system has been tested at theSYRMEP beam line in order to acquire images of
65
Fig. 4-21: Picture of the 16 ASICs assembled system.
mammographic phantoms.Figure4-22shows an image of an Ackermann phantom obtained at 22 keV. The image quality ispoor and the counts acquired by the ASICs are very inhomogeneous. These problems are probablydue to the malfunctioning of the PCB. Since the system was very noisy, a very high threshold hasbeen kept resulting in a low counting rate and in a normalized image not properly corrected fordisuniformities between channels.
4.4 PERSPECTIVES
The measured characteristics of FROST correspond to the specifications and are synthesized inthe following table:
Fig. 4-22: Image acquisition of an Ackermann phantom at 22 keV using the 10 cm system.
66
Gain >100 mV/fCENC 800 e−
Tp 240 nsTs 1 µs
The good rate response ofFROST should allow the acquisition of an entire examination atcounting rates higher than 100 kHz. The duration would then be less than 10 s, as shown infigure4-1.
However, the ASIC still presents some critical points for what concerns the noiseperformances. The problem becomes more important when manyASICs are operated together andthe noise due to neighboring channels and to perturbations of the power supply create a disturb.
Moreover, the pad pitch of theASIC is 140µm and pads are present on all the sides of thedie. This means that, for a strip pitch of 100µm, a width almost double than that of the sensor isneeded in order to place theASICs. The limitation becomes stronger when using a smaller strippitch of the detector. For example for 50µm strip pitch the space needed for the electronics is fourtimes the width of the sensor.The problem becomes important for systems with manyASICs since the distribution of the signalsand power supplies becomes problematic and the high parasitic capacitance of the fan-in to thedetector can determine cross-talk effects and signal loss [174].
Although an improvement of the performances of the system could certainly be obtained bymodifying the design of thePCBs, new difficulties would certainly come out from the need ofassembling of a still greater system of 20 cm, which is the size required for mammography. Forthis reason new solutions for what concerns the read out electronics have been investigated.
67
68
5. MATISSE
TheMATISSE experiment aims to develop a photon counting system for SR breast tomography.In this chapter the principles that allow tomographic reconstruction will be presented and thepromising studies about the application ofSR CT (Computed Tomography) to breast imagingwill be discussed. TheMATISSE detection system will be described in detail and the firstmeasurements performed with prototypes will be shown.
5.1 BREAST COMPUTED TOMOGRAPHY
The Nobel prize for Medicine in 1979 was awarded to A. M. Cormack and G. N. Hounsfieldbecause their work in the development of computed tomography“ushered medicine into the spaceage” [175].Though neither of the laureates had a medical background, their work received immediateacceptance from the medical community thanks to the clear images of cross-sectional views ofthe human body that can be produced with this technique.
The main advantages of the computed tomography technique with respect to planar X-rayimaging are:
Absence of superimposition of structures; Depth resolution; Contrast enhancement of soft tissues; Indication on absolute values for variations in tissue density.
The first three advantages are common also to tomosynthesis, which is the other main techniquefor obtaining three dimensional images.
After illustrating the principles for image reconstruction for both tomosynthesis and CT, theirapplications to breast imaging will be highlighted. The attention will then be focused on the resultsobtained with breast tomography with synchrotron radiation.
i . Digital tomosynthesis
If the image receptor and the X-ray generator are moved linearly in opposite directions, objectsabove and below the fulcrum are blurred proportional to their distance from their plane of focus,whereas the objects in the focal plane appear stationary [176]. The resulting image exhibit clearlythe objects in the plane of interest, with anatomy from distant planes not visible because ofblurring. The geometry of the acquisition is shown in figure5-1a. In some cases the X-ray tubeor both the X-ray tube and the image receptor are rotated around a center of motion. In this casesome transform must be done to reduce the data to the case of parallel motion.
Before applying any reconstruction algorithm, a logarithmic transform must be performed onthe acquired data. The resulting image is then linearly related to the attenuation of the sample(equation1:1) and it is possible not only to render the structures in the focus plane (which couldbe done also with non linear data), but also to remove the blurring of superimposed anatomy.
The main reconstruction algorithm used in tomosynthesis consists in shifting and adding the
69
a) Tomosynthesis acquisition b) Reconstruction of planes
Fig. 5-1: Schematic ofa) image acquisition in tomosynthesis andb) reconstruction of two planes with theshift and add technique[177] .
image obtained over the different projections, as shown in figure5-1b. The structures present inthe plane of interest are brought in coincidence while the superimposed objects are smeared out.However, the contrast of the object in the focal plane is lowered due the blurred structures, so thatdeblurring algorithms are required. For this reason, significant advances in this technique havebeen achieved only with the diffusion of digital image receptors and advances in computing.
Tomosynthesis has been applied to many clinical tasks, among which angiography [178],dental applications [179], chest imaging [180], imaging of joints in orthopedic [181] andmammography [182].
ii . Computed tomography
The fundamental concept underlying the technique of computed tomography is the capability ofreconstructing or synthesizing a cross-section of the internal structure of a sample from multipleprojections of a beam of radiation passing through the object [183, 184]. The technique is notlimited to transverse sections, since cross-sections in other planes can be synthesized by secondaryreconstruction using transverse cross sectional data.
A projection consists of the detected transmission values with the detector and radiation sourceoriented in the same direction, as shown in figure5-2a. The image given by a set of suchprojections is called sinogram (figure5-2b) [29].
a) Tomographic setup b) Cross-section and sinogram
Fig. 5-2:a)Scheme of the setup of a tomographic acquisition andb) image of a cross section of the Shepp-Logan phantom and its sinogram.
70
Fig. 5-3: Geometry of the Radon transform.
The reconstruction of the tomographic image is usually achieved by analytical or iterativealgorithms [185].
Iterative techniques are based on the principle of successive approximations: the value of theattenuation coefficient for each voxel is iteratively corrected so that the projection set acquired isbest approximated. These techniques are usually employed in the reconstruction of single photonand positron emission computed tomographies (SPECT, PET) where the statistics acquired is verylow and the noise contribution too high in order to reconstruct the cross-sections analytically.
The most used analytical method for tomographic image reconstruction is usually referred toas filtered back-projection method [186]. It dates back the work of the Austrian mathematicianJ. Radon, that in 1917 demonstrated that a three dimensional object could be replicated from theinfinite set of all its projections [187].
Figure5-3 shows the conceptual view of the problem. The Radon transformpθ(t) is definedas the line integral of the functionf (x,y) at a given angleθ:
pθ(t) =∫ +∞
−∞f (t cosθ−ssinθ, t sinθ+scosθ)ds (5:1)
In X-ray computed tomography, the goal is to map the attenuation coefficients of the samplestarting from a sinogram acquired at discrete steps. From equation1:1 one can see that thelogarithm of a projection is the Radon transform ofµ.
The Radon inverse problem (i.e. the reconstructions of an object from multiple projections)can be solved thanks to the Fourier central slice theorem, which relates the two dimensionalFourier transformF(νx,νy) of f (x,y) with the 1D Fourier transformPθ(ν) of pθ(t):
Pθ(ν) = F(νcosθ,νsinθ) (5:2)
71
With enough projectionspθ, one can thus calculatePθ filling the Fourier space. By changingcoordinate system from (ν,θ) to (νx,νy), f (x,y) can be obtained as Fourier anti-transformed ofF(νx,νy):
f (x,y) =∫ +∞
−∞
∫ +∞
−∞F(νx,νy)e−2πiνxxe−2πiνyydνxdνy = (5:3)
=∫ π
0
∫ +∞
−∞Pθ(ν)e−2πiν(xcosθ+ysinθ) |ν|dνdθ
One can define the filter functionb(t) as the Fourier antitransformed of|ν| and one can write:
f (x,y) =∫ π
0pθ(xcosθ+ysinθ)dθ (5:4)
wherepθ = pθ ∗b is the convolution between the Radon transform off and the filterb.In clinical practice, the Radon transform ofµ is sampled on thet axis and the number of
projections is finite, thus the Fourier transforms must be calculated in discrete steps (i.e. sumsinstead of integrals). One can only obtain an approximated solution and different filters can beused in order to improve the image quality [186].The choice of the right filter for image reconstruction is of paramount importance in order toenhance the desired details. The weight assigned to frequencies close to the Nyquist frequency isparticularly critical, since these spatial frequencies introduce statistical noise in the image.Filters that assign different weights to high and low frequencies can be used. In particular ahigh-pass spatial filtering enhances the edges but also increases the noise in the images, so it isoften used for the imaging of high contrast areas (e.g. bones), where noise does not interferewith interpretation. On the other hand, filters that reduce the weight of high spatial frequenciesare preferable for examining low contrast areas (e.g. brain, abdomen). Commonly used filterfunctions are the Hamming and the Shepp-Logan filters [186].
The tomographic reconstruction is a very critical task and artifacts in the image can arise ifthe acquisition or the reconstruction are not carried on properly. The reason for some of the mostcommon artifacts are:
An insufficient angular sampling, that can lead to the presence of artifacts in proximity ofsharp intensity changes.
Insufficient rotation amplitude that results in an undersampling of the reciprocal space(νx,νy). The overall rotation angle must be at least 180, but 360 are used if the X-rays aredivergent and some geometric transform must be applied in order to fill the Fourier space.
Presence of very high absorbing details (e.g. metal) that absorb completely the radiationand lead to missing data in their shadow.
Artifacts due to the patient motion, such as respiration and heart beat during data acquisition. High noise level, that can be compensated with a higher dose given to the patient in order to
increase the visibility of structures. Finite resolution of the detector, that leads to the so called partial volume effect: a nonlinear
response is obtained when the object structure or edge occupies only part of the X-ray beammeasured by a single detector element. This results in streak artifacts that occur tangential tohigh contrast objects. Artifacts connecting details that occupy only part of the slice thicknesscan arise.
Beam hardening when using polychromatic radiation since the low energy components areabsorbed more than the high energy ones and thus the reconstructed attenuation coefficientof the sample results dependent on its thickness. Beam hardening artifacts appear ascupping, or a reduction of the reconstructed attenuation coefficient toward the center ofa large object.
72
iii . Three dimensional breast imaging
Despite its high cancer detection accuracy, the capability of X-ray mammography is limited by itstwo-dimensional representation of a natural three dimensional entity [12]. Since breast containsoverlying dense fibroglandular tissues, a deterioration of the contrast of the lesions is given bythe superimposition of structures, particularly when dense breasts are imaged. Consequently, asmall carcinoma of few millimeters in size is difficult to detect, resulting in a high false-positiverate [98].
A better diagnostic accuracy could be achieved with the use of3D techniques, such as digitaltomosynthesis and computed tomography. By slicing the breast volume into two dimensionalimages, the interior of the breast can be scrutinized and quantitatively analyzed using conventional2D image processing techniques.
Moreover, the possibility of mapping the effective attenuation coefficients of the tissues allowsa simpler application of texture characterization. An enhanced contrast and an improved detectionof the edge shape can help a better discrimination between benign and malignant lesions. Three-dimensional breast imaging opens up new perspectives in volume representation, which as a resultsimplifies constituent analysis and spatial measurements.
The potential clinical benefits are a reduced recall rates and a better diagnostic accuracy thatcould avoid unuseful biopsies, while still improving the cancer detection capability particularlyin women with heterogeneously dense breast [12]. Since compression is not needed, theexamination can be better tolerated by women that are particularly sensitive to the unease ofcompression. Moreover, the depth information obtained from tomographic images can be usefulfor performing biopsies and selective surgery. The overall final result would certainly be a bettertumor detectability.
iv . Breast computed tomography scanners
The shortcomings of planar X-ray mammography have partially been overcome by stereopsis3Dreconstruction from two or more views or by tomosynthesis.Digital tomosynthesis systems for breast imaging have been developed [177]. Typically, the tubeis rotated around±15o and 7 to 12 exposures are obtained during a total scan of about 10 s, withthe same dose of a planar mammogram. In modern digital tomosynthesis systems, the imagesare reconstructed with a slice separation of 1-2 mm, so that about 50 reconstructed slices can beobtained for each study. Rapid reconstruction time is essential and the post-acquisition processingshould be kept to less than 30 s. The detector is usually given by a flat panel (see section2.5).Since the images are presented with reduced tissue overlap, objects are visualized with improvedclarity leading to faster and more confident readings of the images.
However, a volumeCT reconstruction can provide a more faithful and quantitative3Drepresentation in terms of X-ray attenuation coefficient. In the mid 1970s, a CT system specificallydesigned for fan-beam computed tomographic mammography was built and a clinical trial wasconducted. The setup of the system is shown in figure5-4a: the detector and X-ray source arerotated around the sample. A translation of the sample is needed in order to acquire more than oneslice. The data suggested that breast tomography can differentiate potentially precancerous lesionsfrom benign fibrocystic disease, especially if coupled to the use of a contrast agent [188]. Howeverthe technique was not considered suitable for screening of asymptomatic women because of thehigh dose given to the patient and the long scanning time that lead to motion artifacts. A largeslice thickness and poor spatial resolution made difficult the detectability of small lesions
CT scanners have evolved a lot and in recent years the development of dedicated systems forbreast imaging is becoming popular. In order to reduce the scanning time, two kinds of setup aremainly applied:
Multi-detectorCT scanners can acquire multiple data sets with each rotation of the X-
ray tube and can scan through large anatomic areas three to seven times faster than cansingle-detector fan-beamCT scanners. The high speed and the thin collimation of the beamimprove the spatial and time resolution of the images acquired [189].Recent studies prove that the technique is superior to mammography and sonography in thedepiction of the margins of the tumor invasion [190].
Cone-beamCT is based on full field digital detectors, mainly flat panels (see section2.5),which have now a high spatial resolution and a high frame rate which allow real time imagegrabbing [98]. The patient lays in prone position with the organ dangling and the breast iscompletely illuminated by the cone beam. Detector and X-ray source rotate, as shown infigure5-4b. The reconstruction algorithms are more complex than in the fan-beam case andthey introduce approximations and noise in the reconstructed image.However, the acquisition is very fast and the system can provide significantly betterlow-contrast detectability of tumor masses and a more accurate localization and volumevisualization of the lesion with respect to planar imaging [12, 64, 98, 191, 192].
Since the breast is uncompressed, higher X-ray energies are employed. X-ray tubes withtungsten anode and 80-120 kVp have been used. This allows to limit the dose of radiation: forthin breasts, the radiation level results almost double than in planar mammography, but for densebreasts the dose can be kept at the same level as in a conventional mammogram [64].
These techniques still have some limitations concerning spatial resolution and dose, butthese problems will probably disappear as the hardware (i.e.CT scanner) and software (i.e.reconstruction algorithms) improve [12].
v . Synchrotron radiation breast computed tomography
Synchrotron radiation experiments represent a further step forward with respect to conventionalX-ray tubes:
The laminar beam allows the removal of scattered radiation, thus increasing the imagequality.
The negligible divergence of the beam allows the use of reconstruction algorithms simplerthan in the fan-beam case, thus introducing less approximations and noise in the image.Moreover, the rotation can be performed on only 180.
The possibility of selecting the most suitable energy for each clinical case accordingto the organ thickness and composition, allows a significant reduction in the delivereddose [193]. Furthermore, the use of monochromatic beams removes beam hardeningartifacts, which result in decreased contrast and poor quantitative analysis capability whentypical mammographic spectra are used [194].
74
a) Conventional mammography b) SR tomography
Fig. 5-5: Images of an excised breast tissue.a) is obtained at the clinical mammograph at the Trieste publichospital with 27 kVp and 110 mAs. The sample thickness is 4 cm.b) is a tomographic slice obtained at theSYRMEP beamline at 28 keV. The sample diameter is 10.5 cm.
A more accurate tissue characterization is possible thanks to the possibility of recoveringthe map of the absolute attenuation coefficients of tissues, instead of the effective ones as inthe polychromatic case.
In SR tomography, since the beam is stationary, the sample will rotate.The rotating object is ideally divided into slices parallel to the beam plane. If the rotation axis isnot orthogonal to the beam, a detail will move into contiguous slices during a rotation. The detailcontrast will thus be spread across several slices. An alignment better than 0.05 is required inorder to avoid the presence of artifacts in the reconstructed image [193].
Figure5-5 shows the image of a breast sample acquired at the conventional mammographicstation at the hospital in Trieste and a tomographic slice of the same sample acquired at theSYRMEP beamline [13]. In the planar mammography case, the visibility of the anatomic patternsis strongly limited by the superimposition of the structures. The geometry of figure5-5ais notrepresentative of a conventional mammogram, but it is used in order to compare the image with thetomography in figure5-5b. The improvement in the visualization of structures in the tomographicimage is very strong and a volume segmentation can be applied. The dose given to the sample is1.6 mGy.
The results show the possibility of using breastCT as a second-examination tool, providingfurther information with respect to conventional mammography, and delivering a dose comparableto that delivered in clinical mammography [13, 65, 193, 195].
Diffraction based tomographic characterization of breast tissues has shown an optimumcorrelation between the structures detected in the images and the results obtained in histology [52].However, the dose used in the acquisition is still much higher than in planar examinations. A strongdose reduction can certainly come out from a compromise on the image quality.
DEI-CT images show the pure image of the out-of-plane gradient of the X-ray index ofrefraction with no artifacts [196]. Yet, CT exploiting phase effects still presents some criticalpoints in image reconstruction [197]. The application of the standard filtered backprojectionalgorithm, in fact, allows only qualitative reconstruction, allowing one to obtain the location ofthe boundaries of the regions with different refraction index with poor quantitative information.
75
The problem can be solved by a two step approach, first retrieving the radon transform of the phaseinformation and then applying the backprojection algorithm [198], or by implementing a completemathematical theory that can relate the phase function and the projection data [197].
vi . Detector requirements
The tomographic examination differs from mammography and imposes then differentrequirements on the detection system. In particular:
The breast is uncompressed and the examination is performed at higher energies A highefficiency is thus required in the 25-32 keV energy range;
Only a few hundreds photons must be acquired in each projection in order to keep low thedose of the examination. For this reason, the detector noise should be negligible in order toobtain an high image quality.
The first requirement is satisfied byedge onsilicon detectors (see section3.2). The detectorefficiency results still higher in the tomographic than in the mammographic energy range, as shownin figure3-3b.The spatial resolution obtained with a 100µm pitch microstrip detector and a parallel radiationbeam is better than what can be obtained for examples with flat panels in cone-beam geometrysince both thePSFof the flat panel coupled to the phosphor screen usually have aFWHM of fewhundreds microns and the X-ray geometry introduces blurring in the image reconstruction.
By avoiding the presence of reset and read out noise, photon counting allows to minimizethe fluctuations on the number of detected photons (see section2.4). The difference betweenthe counting and integrating read out is particularly strong when a small number of photons isdetected, as shown in figure2-6. Since the photon energy is higher, the noise requirements on theelectronic chain are slightly less stringent.
In order to reconstruct the image, the whole organ must lay in the field of view of the detector.Both the sensor and the read outASIC should then be feasible for assembling large systems.
5.2 THE MATISSE DETECTION SYSTEM
For the reasons highlighted in the previous paragraph, theMATISSE detection system, optimizedfor SRbreast tomography, is based on a silicon microstrip detector with application specific readout electronics operating in single photon counting mode. A sketch of the detection system isshown in figure5-6.
The detector requires a width of at least 20 cm. Since the maximum sensor width available is13 cm, it will be made out of two layers, each consisting in two detectors tiled on the side parallelto the strips. The insensitive region between the two sensors will be misaligned one layer from theother, so that the full set of data needed for the image reconstruction will be available if the datafrom the two planes are summed up.
The thickness of the tomographic slice will then be given by the detector thickness and willbe of approximately 700µm. When performing multi-slice acquisition, the slice thickness canbe reduced by scanning the sample with vertical steps smaller than the detector thickness. Anhelical sample movement has also been applied with acceptable results for what concerns theimage reconstruction [199]. If only one slice is imaged, another way for reducing its thicknessis the use of a thin beam illuminating only partially both the layers. In this case, if not shieldedby means of a slit, the undetected radiation in the region between the layers would have a higherweight in the dose calculation.
Since the pixel size is 100µm, more than 2000 channels will be present on each layer.The detector will be completely integrated in the examination control system, and will have to
satisfy strict safety rules needed in order to perform examinations on patients.
76
Fig. 5-6: Scheme of the final MATISSE detector.
The silicon sensors have been largely described in section4.1. In the following, the photoncounting frontend electronics and theFPGA(Field Programmable Gate Array) basedDAQ (DataAcQuisition) will be presented.
i . The frontend electronics
The requirements ofSR tomography concerning the read out electronics are fulfilled by theva64 tapandls64ASICs by IDEAS ASA (Norway), fabricated in 0.8µm CMOStechnology [200,201]. Theva64 tap has been originally designed for the readout of the hybrid photodiodes of thering imaging Cherenkov detector of the BTEV experiment at Fermilab (USA) [202].Theva64 tap ENC specification is 500e− with a detector capacitance of 10 pF, that should allowaSNRsignal of 10.The layout of a channel is shown in figure5-7. The preamplifier together with the selectable gain-stage can reach a gain of 100 mV/fC. The output is filtered by a CR-RC fast shaper with a peakingtime of 75ns. Each channel has a discriminator, with a 4-bitDAC to reduce threshold spread.The ASIC has 64 parallel trigger outputs (one per channel) encoded as a current, and should beterminated with low impedance.
A trig out signal is given as the wired-or of the outputs of all the channels and can be enabledby the digital configuration register of theva64 tap.The gain and shaping of the signal and the time duration of the output logic signals can be tunedby means of external analog signals.
The outputs of theva64 tap are directly bonded to thels64 ASIC, as shown in figure5-8.
Fig. 5-7: Layout of a MATISSE channel.
77
Fig. 5-8: Picture of ava64 tap (on the left) directly bonded to als64ASIC (on the right).
The ls64works as 64 parallel level shifters, converting the logic signals from a current open drainlogic intoLVTTL (Low Voltage Transistor-Transistor Logic)CMOSlevels (i.e. 0-3.3 V). Thels64should minimize the coupling between the digital circuitry and the noise sensitive analog chip.
The parallel digital outputs are then fed into aPLD (Programmable Logic Device) that carriesout the counting and read out functions.
ii . The data acquisition
Figure5-9 shows the blocks that control the detection system. The acquisition can be divided inthree main blocks, that also correspond to three different components:
The va64 tap configuration register allows to select the activation of the gain stage, theselection of the threshold polarity and the enabling of the global trigger output and of acircuitry for the compensation of the detector leakage current [200]. It is also possibleto enable a single-channel test modality, disable some channels and adjust the 4-bit fine
Fig. 5-9: Scheme of the read out blocks of the MATISSE detector.
78
threshold on a channel by channel basis. The configuration string is written serially and theregister provides a serial output in order to daisy chain the ASICs.
A digital potentiometer allows one to set the global threshold value. An incrementalDAChas been used [203].
A FPGAthat performs all the main functions for the control of the acquisition systems. TheFPGAfunctionality has been implemented by means ofVHDL (Very high speed integratedcircuit Hardware Description Language) programming [204, 205] and can be further dividedin sub-blocks:
A configuration register, that allows to select the acquisition time∆t by seriallyintroducing the binary string corresponding the the number of timing clock countsgiven in the time slot. The timing clock is obtained by means of a 4 MHz quartzoscillator.
A timer, that counts the timing clock pulses and enables the acquisition for a time equalto the value set in the configuration register. When∆t has passed, the timer disablesthe counters and produces aLAM (Look At Me) signal.
A 16-bit counter implemented for each channel. The counter is reset at the beginningof each acquisition and the acquisition is enabled by the timer. The counter inputpulses are the detector outputs or, in case the test modality is enabled, a digital signalcommon to all channels. Whenever one of the counters reaches the maximum value(in this case 216−1) an overflow signal is generated.
A loadable shift register for the serial read out of the counters. After the shift registeris loaded, the timer and counters are reset.In order to implement the shift register more efficiently, it is subdivided in 16-bit shiftregisters (one per channel) that are enabled one at a time. Thanks to this solution it ispossible to operate large shift registers, that would not work otherwise because of thepropagation delay of the shift-clock signal.
Figure5-10shows the flowchart of the acquisition. With this architecture the counting andreadout operations can be performed simultaneously and the acquisition can be stopped inevery moment. The process on the left is completely controlled by the user, while the oneon the right is executed in background by theFPGA.Since theFPGA is completely configured via software, it can be modified with the onlyrestrictions given by the device connections.The devices chosen are APEX 20K by Altera [206]. The gate density and pin-out dependon the size of the prototypes assembled.
5.3 MEASUREMENTS
The printed circuit board shown in figure5-11a(MATISSE repeater) has been developed in orderto distribute the power supplies and the logic signals to theASICs andFPGA. On thePCB arealso mounted the quartz oscillator that generates the timing clock signal, theDAC for theASICglobal threshold settings and anEPROM(Erasable Programmable Read Only Memory), i.e. aconfiguration device that downloads the read out implementation on the FPGA every time thepower is turned on [207]. TheEPROMcan be reconfigured with the appropriate software by meansof a JTAG connector mounted on the repeater. Since every configuration device can program upto 8 identicalFPGAs at a time, the repeater can be used to control multi-ASIC and multi-FPGAsystems.
All the acquisition is controlled with theVME 16-bit I/O register of figure4-10b and theexperimental setup is almost the same of figure4-9 [170].
Moreover the possibility of remotely controlling the electronics and detector power supply, thepulse generator and the oscilloscope viaGPIBbus has been added [172].
79
Fig. 5-10: Flowchart of the acquisition of the MATISSE detection system.
a) Repeater b) Alignment system
Fig. 5-11:a)Picture of the MATISSE repeater andb) sketch of the detector alignment system.
80
Fig. 5-12: Picture of the single ASIC MATISSE board.
Since the alignment of the detection system with the beam plane is a critical task, a micrometricpositioning system has been designed. It is made of a vertical movement stage, two goniometersand a rotation stage, as shown in figure5-11b, and can be remotely controlled with the serial RS-232 interface. Thanks to its small size, the alignment system can be positioned on the rails behindthe patient support of the mammographic station atSYRMEP.
The acquisition program has been written in C and the GTk library has been used for thegraphical user interface [146, 147].
i . The single ASIC system
A singleASIC multilayerPCBhas been designed for test purposes and is shown in figure5-12. Forthis first prototype, theMATISSE repeater had not been designed yet, and a general purposePCBwas used to distribute the power supplies. For this reason, theEPROM, the voltage regulators andmost passive components are placed on the detectorPCBitself. NoDAC for threshold adjustmentis present, so that the threshold must be changed manually by means of a potentiometer.
Pulses of various frequencies have been injected through theva64 tapanalog inputs in order totest theASIC efficiency response at high frequencies. The counted pulses linearity was optimumand no efficiency loss was observed for pulse rates up to 3.5 MHz, as shown in figure5-13a. Thishigh rate should allow to perform an examination exploiting the whole synchrotron radiation flux.
The prototype was also tested in order to detect photons from a241Am radioactive source.The profile of the source placed in the center of the detector is shown in figure5-13bfor severalthreshold values.The gaussian profile of the source is clearly visible although the data were not normalized forthreshold value dishomogeneity. A plateau is not completely reached for intermediate thresholdvalues because of the presence of a charge sharing effect between neighboring channels (5-10%) [105].
Images of a mammographic test object have been acquired at theSYRMEP beam line atElettra. Figures5-14aand 5-14b show the images of a column of theC/D phantom acquiredat 28 and 32 keV respectively. The two energies were chosen because they are suitablefor CT examinations of thick breasts, which are performed at energies higher than planarmammographies.
81
a) Rate response b) Threshold scan
Fig. 5-13: a) Rate response of the detection system using pulses injected in theva64 tap inputs andb)threshold scan performed by using a241Am source.
Figure5-14cshows the measured contrasts for the disks, which result close to the theoretical onesat both energies.The faintest visible disks have a contrast lower than 1% with a statistic of about10000 counts/pixel.
ii . The six ASICs assembly
A new printed circuit board containing sixASICs (384 channels) was designed and connected toa silicon sensor. The sensitive width is 3.84 cm (figure5-15). This circuit is a good candidate to
a) b) c) Contrast measurement
Fig. 5-14: Image of a C/D phantom acquired ata) 28 keV andb) 32 keV andc) comparison between themeasured and theoretical contrast of the disks.
82
Fig. 5-15: Picture of the six ASICs MATISSE board.
become the module that will constitute the final detector by means of replication of this schemeup to reach the desired dimensions.
Some preliminary tests were performed with the prototype. After acquiring images of highcontrast objects using an X-ray tube with molybdenum anode, the system has been tested at theSYRMEPbeam line.
Figure5-16ashows the image of some of the simulated tissues of the Ackerman phantom [173]acquired at 25 keV.
The figure5-16b shows the image of theC/D phantom obtained at 20 keV. The measuredcontrasts are comparable with the ones that can be calculated from the attenuation coefficient ofplexiglas.
However, the disuniformities between channels are strong and many channels do not workproperly. A further optimization of theASIC’s parameters has to be done in order to improve theperformances of the detector for reaching the characteristics of low noise and high speed requestedby the project.
5.4 FUTURE WORK
The first results obtained with theMATISSE detection system are encouraging for what concernsthe rate response and the noise capability, however some work is still needed in order to optimizethe performances of the last prototype.
As soon as the problems with the current 3.84 cm prototype will be solved, the work will bedirected toward the development of the large detection system sketched in figure5-6. The nextmilestones are:
a) Simulated tissues b) C/D phantom
Fig. 5-16: Image ofa) simulated tissues of the Ackermann phantom acquired at 25 keV andb) a C/Dphantom acquired at 20 keV.
83
a) va64 tapprobecard b) ls64probecard
Fig. 5-17: Picture of thea)va64 tapandb) ls64probecards.
All the ASICs need to be electrically and functionally tested before being mounted on thePCB. Since the yield loss of theASIC production is about 10%, almost 20% of theva64 tap-ls64pairs should be replaced i.e. more than 10ASIC pairs in the final detection system. Thiswould increase the assembling time and costs, thus a test system has been developed.The two probecards (one perASIC type) shown in figure5-17 have been designed andproduced by Technoprobe (Italy).The PCBs have been designed with particular care in order to limit the noise. The probedensity is very high since the minimum distance between the pads of theASIC is 80µm.A program that allows an automatic test of theASICs has been written in C withGTk graphical interface. The defined test protocol is going to: (i) measure the powerconsumption of theASIC; (ii) scan the configuration register of theva64 tap; (iii) performa threshold scan for each channel with pulses injected in the calibration pad or in eachchannel input. The tests will possibly give interesting informations also concerning theASIC’s optimal operation parameters.
The 2000 channels detection will be designed with great care for what concerns the noiseperformances. Three prototypes will be assembled and the two with the best performanceswill be chosen and mounted back-to-back in order to build the two layer system. For thisreason particular attention has to be taken in order to satisfy the mechanical requirements ofthe final assembly.
A new DAQ system will be implemented. Due to the large data amount that has to betransfered for each acquisition step (2000 channels× 16 bit), the time needed for serial readout would result much larger than the counting time slot, leading to a non negligible deadtime in the acquisition.A customVME board with larger data input connector (at least 64 bit) and a memorycapable of store all the data of a complete examination will be implemented. With theseconfiguration the data will be rapidly transfered from theFPGA on the detectorPCB totheDAQ board, with a clock given by a quartz oscillator of several MHz and a large datatransfer bus, and then collected by the user with the time delays due to the 16-bit data busand clock speed of theVME interface used.
The detector will be integrated in theSYRMEPbeamline for clinical mammography. Thismeans that the detection system will be able to communicate with the control and safetysystems of the mammographic station. In particular, it will generate an emergency stopsignal in case that some danger situation is detected and will be able to control the shuttersand patient support movement.
The final MATISSE detection system should be delivered at the end of 2005. It is intended
84
to be the prototype from which to start the engineering of a detector for tomographic clinicalexaminations.
85
86
CONCLUSIONS
This thesis describes the work on the development of detection systems optimized for breastimaging.
Breast cancer is the most common tumor and the second cause of death for women living in theindustrialized countries [2]. The key to surviving breast cancer is early detection and treatment.According to the American Cancer Society, when breast cancer is confined to the breast, the five-year survival rate is close to 100%. The early detection of breast cancer helps to reduce the needfor therapeutic treatment and minimizes pain and suffering, allowing women to continue leadinghappy, productive lives.
A high-quality mammogram is the most effective examination for screening the generalpopulation to detect breast cancer at early and treatable stages. However, mammography has somelimitations: as many as 17% of cancers go undetected and the risk of a false-positive resultingfrom a screening mammogram is higher than 10%. Research suggests that, among women whoreceive annual mammograms for 10 years, half will have at least one suspicious finding leading toadditional tests showing it to be a false alarm. Dense breasts are particularly critical since massesand microcalcifications are easly occult in the overlying glandular tissue.
Besides its limitations and drawbacks, mammography holds the greatest potential to savelives over other new screening and detection technologies, at least in the immediate future.Improvements in the mammographic examination can come from advances in the radiationcharacteristics and in the detection capability, connected mainly to the development of innovativeX-ray sources and digital detection systems. These upturns can also lead to the exploitation ofnew imaging techniques that can broaden the diagnostic power of X-ray breast imaging.
A monochromatic X-ray beam of tunable energy allows one to maximize the image quality todose relationship, since the soft X-rays of a polychromatic spectrum are not present [5]. In the firstchapter it has been shown that a high intensity radiation beam produced by a synchrotron radiationmachine can be monochromized still obtaining a radiation flux intense enough in order to performclinical examinations [24]. Moreover, the synchrotron radiation beam is coherent and allowsthus the observation of the phase alterations of the radiation traversing a sample by detecting thescattered photons or the interference between the diffracted and undiffracted wave [40]. Severalmedical tasks exploiting both absorption and phase contrast effects have been implemented atSR facilities world-wide in order both to optimize imaging techniques that can successively beexploited in hospitals and for performingSRexaminations [18].
Currently the only synchrotron radiation project with perspectives of clinical application in thenear future is the mammographic facility which is being built at Elettra, the TriesteSRsource [7].TheSYRMEP(SYnchrotron Radiation for MEdical Physics) beamline has been deeply modifiedin order to allow perform clinical mammographic examinations and is now expecting the necessaryauthorizations in order to start its activity. Although the accessibility of synchrotron radiationfacilities is poor,SRpresents such characteristics that are not achieved by any other X-ray source.The mammographic facility is obviously not built for screening purposes, but in order to examinewomen that present a particularly dense breast or have a high risk of contracting breast cancer (e.g.familiarity, previous tumor).
In the first phase, the examinations will be performed using conventional screen-film system
87
in both absorption and phase contrast modality, but the goal is to move toward digital and, finally,tomographic imaging.
Digital mammography systems are greatly improving and slowly becoming available in mosthospitals. Studies comparing conventional and digital mammography have shown that digitaldetectors perform with the same or better results with respect to screen-film systems in termsof detecting breast cancer. In the near future, digital mammography may provide many benefitsover standard film mammography, mainly by improving the contrast between dense and non-dense breast tissue, by providing easier image storage, by allowing the physician to manipulatebreast images for more accurate detection of cancer, by preventing the problem of over-exposureavoiding thus the repetition of mammograms and by permitting transmission of images for remoteconsultation [57]. The main disadvantage of digital mammography systems is the initial cost,which is partially compensated by avoiding the expenses of film material and development andby strongly reducing the cost for image storage. Some of the commercially available digitalmammography detectors have been presented in Chapter2.
The detection systems developed in this work rely on a direct conversion sensor and a countingread out, as discussed in Chapter3.Silicon microstrip detectors oriented with the strips parallel to the impinging beam provide a highdetection efficiency for X-rays in the mammographic energy range, since the absorption depth isgiven by the strip length [9]. The pixel size is determined by the strip pitch and by the waferthickness and, with a strip pitch of 100µm, the spatial resolution is improved with respect tophosphor based clinical digital systems of at least a factor two. The high sensitivity of siliconallows one to perform the read out by counting single photons.Photon counting detectors allow the maximization of the visibility of the details in the image [10].However the development of counting frontend electronics still presents some critical points,mainly the noise level, in order to detect low energy X-rays, and the speed of the electronic chain,for the exploitation of high radiation fluxes as in synchrotron radiation experiments.
In Chapter4, the detection system developed for theFRONTRAD experiment has beendescribed. New silicon sensors with a high efficiency and a low leakage current have beendesigned and fabricated [11]. The system is optimized for synchrotron radiation mammographicexaminations and the frontend electronics improvements are directed toward an enhancementof the speed of the electronics. TheASIC developed for the experiment has demonstrated noefficiency loss up to 100 kHz counting rate, so that the duration of a synchrotron radiationexamination is shorter than 10 s. The main limitations of theASIC concern the non negligiblenoise and the large pad pitch. Both the problems lead to difficulties when trying to assemble largedetection systems, as needed in order to cover the field of view needed in mammography [174].
In the last chapter, the advantages of three dimensional breast imaging have been discussed.The two techniques that allow3D reconstruction are tomosynthesis and computed tomography.Volumetric imaging has the potential to revolutionize the practice of mammography by providingsuperior breast cancer detection with no additional radiation exposure and with improved patientcomfort compared to conventional mammography [12]. The techniques are expected to enhancethe detection of small occult lesions that may be missed by current mammography systems, andto give radiologists an increased confidence in their diagnoses. With respect to tomosynthesis,computed tomography allows quantitative evaluation of the absorption differences between thetissues, which could result in an improvement in the diagnosis.
In this contest,SRbreast tomography results particularly promising [13]. The dose is limitedthanks to the possibility of selecting the most appropriate energy for the examination. Themonochromaticity of the radiation allows also to calculate the absolute values of the attenuationcoefficients of tissues, which could be useful for a better discrimination between benign andmalignant lesion. Moreover, the spatial resolution of the reconstructed image is enhanced becauseof the negligible divergence of the beam and scattered radiation is not detected thanks to the beam
88
laminarity.The MATISSE detection systems is based on a commercially available fast and low noise
counting electronics with full custom read out implemented by means of programmable logicdevices. The detector is optimized for tomography, for which theedge onconfiguration andcounting read out present clear advantages [14]. The system is still in the testing and optimizationphase. Further improvements are also required in the data acquisition system. The goal is thedevelopment of a two layers 20 cm detection system before the end of 2005.
An engineering phase should then start in order to build a detector in order to perform clinicaltomographic examinations at theSYRMEPbeamline. The examination will consist first in a lowdose planar digital scan. A few mammographic slices will be acquired in the regions where thesuspicious structures are present. Thanks to its enhanced contrast and to the possibility of tissuecharacterization, the tomographic examination should help to solve the diagnosis when the natureof the detected lesion is still not clear. The volumetric reconstruction will give to the physiciansuseful informations on the position and size of the lesions in case a biopsy or surgery has to beperformed. The goal is to reduce psychological pain and unnecessary biopsies and treatment inpatients with a false-positive diagnosis.
89
90
ACRONYMS
1D One Dimensional2D Two Dimensional3D Three DimensionalAC Alternate CouplingADC Analog to Digital ConverteraSe Amorphous SeleniumaSi Amorphous SiliconASIC Application Specific Integrated CircuitCMOS Complementary Metal-Oxide SemiconductorCCD Charged Coupled DeviceC/D Contrast/DetailCT Computed TomographyDAC Digital to Analog ConverterDAQ Data AcQuisitionDC Direct CouplingDEI Diffraction Enhanced ImagingDEL Detector ELementDM Digital MammographyDMILL Durci Mixte Isolant Logico LineaireDQE Detected Quantum EfficiencyDR Dynamic RangeDTS Digital TomoSynthesise-h electron-hole pairENC Equivalent Noise ChargeEPROM Erasable Programmable Read Only MemoryFF Fill FactorFPGA Field Programmable Gate ArrayFBGA Fine Ball Grid ArrayFEL Free-Electron LaserFOM Figure Of MeritFRONTRAD FRONTier RADiographyFROST Frontrad Read Out sySTemFWHM Full Width at Half MaximumGPIB General Purpose Interface BusGUI Graphical User InterfaceIC Integrated CircuitINFN Istituto Nazionale di Fisica NucleareI/O Input/OutputJFET Junction Field Effect TransistorKES K-Edge SubtractionLAM Look At Me
I
II
LVTTL Low Voltage Transistor-Transistor LogicLSB Least Significative BitMATISSE MAmmographic and Tomographic Imaging with Silicon detectors and Synchrotron
radiation at ElettraMOS Metal-Oxide SemiconductorMTF Modulation Transfer FunctionOP-AMP Operational AmplifierPC Personal ComputerPCB Printed Circuit BoardPET Positron Emission TomographyPH Pulse HeightPhC Phase ContrastPLD Programmable Logic DevicePSF Point Spread FunctionRMS Root Mean SquaredRPC Resistive Plate ChamberSF Screen-FilmSNR Signal to Noise RatioSPECT Single Photon Emission Computed TomographySPC Single Photon CountingSR Synchrotron RadiationSYRMEP SYnchrotron Radiation for MEdical PhysicsTDC Time to Digital ComverterTDI Time Delay IntegrationTFT Thin Film TransistorVHDL Very high speed integrated circuit Hardware Description LanguageVLSI Very Large Scale of IntegrationVME VERSA Module Eurocard
REFERENCES
[1] K. McPherson, C.M. Steel, and J.M. Dixon. ABC of breast cancer – epidemiology, riskfactors and genetics.British Medical Journal, 321:624–628, 2000.
[2] J.E. Joy end E.E. Penhoet and D. B. Petitti, editors.Saving Women’s Lives: Strategiesfor Improving Breast Cancer Detection and Diagnosis. Committee on New Approachesto Early Detection and Diagnosis of Breast Cancer, Institute of Medicine and NationalResearch Council, 2004.
[3] S. Hofvind, S. Thoresen, and S. Tretli. The cumulative risk of a false-positive recall in thenorwegian breast cancer screening program.Cancer, 101:1501–1507, 2004.
[4] National Statistics Online. http://www.statistics.gov.uk/cci/nugget.asp?id=575, 2003.
[5] F.E. Carrol. Tunable monochromatic X-rays: a new paradigm in medicine.AmericanJournal of Roentgenolgie, 179:583–590, 2002.
[6] F. Arfelli et al. Mammography of a phantom and breast tissue with synchrotron radiationand a linear-array silicon detector.Radiology, 208(3):709–715, 1998.
[7] R. Longo et al. Synchrotron radiation mammography at Elettra. InProceedings of the7thInternational Workshop on Digital Mammography, 2004.
[8] M.J. Yaffe. Digital mammography - detector considerations and new applications.NuclearInstruments and Methods in Physics Research A, 471:6–11, 2001.
[9] A. Bergamaschi et al. ”Edge on” detectors for medical imaging. InProceedings of Vertex,2003. to appear in Nuclear Instruments and Methods in Physics Research A.
[10] B. Mikulec. Development of segmented semiconductor arrays for quantum imaging.Nuclear Instruments and Methods in Physics Research A, 510:1–23, 2003.
[11] A. Bergamaschi et al. FROST: an ASIC for digital mammography with synchrotronradiation.Nuclear Instruments and Methods in Physics Research A, 510:51–56, 2003.
[12] Z. Chen and R. Ning. Why should breast tumor detection go three dimensional?Physics inMedicine and Biology, 48:2217–2228, 2003.
[13] S. Pani et al. Breast tomography with synchrotron radiation: preliminary results.Physicsin Medicine and Biology, 49:1739–1754, 2004.
[14] A. Bergamaschi et al. A detection system for clinical breast tomography with synchrotronradiation.Nuclear Instruments and Methods in Physics Research A, 535:88–92, 2003.
[15] W.C. Rontgen. On a new kind of rays.Nature, 53:274, 1896.
[16] C.T. Odhner. Presentation speech of the 1901 nobel prize in physics. InNobel Lectures,Physics 1901-1921. Elsevier Publishing Company, 1967.
[17] A.L. Robinson. History of synchrotron radiation. InX-ray data booklet. Center for X-rayoptics and advanced light source, 2001.
III
IV
[18] P. Suortti and W. Thomlinson. Medical applications of synchrotron radiation.Physics inMedicine and Biology, 48:R1–R35, 2003.
[19] J. Als-Nielsen and D. McMorrow.Elements of Modern X-Ray Physics. John Wiley & Sons,Ltd, 2001.
[20] J. D. Jackson.Classical Electrodynamics. John Wiley & Sons, Ltd, 3rd edition, 1998.
[21] J. Schwinger. On the classical radiation of accellerated electrons.Physical Review,75:1912–1925, 1949.
[22] N. Patel. Shorter, brighter, better.Nature, 415:1105, 2002.
[23] Kwang-Je Kim. Characteristics of synchrotron radiation. InX-ray data booklet. Center forX-ray optics and advanced light source, 2001.
[24] G. Margaritondo. A primer in synchrotron radiation: Everything you wanted to know aboutSEX (Synchrotron Emission of X-rays) but were afraid to ask.Journal of SynchrotronRadiation, 2:148, 1995.
[25] C. Kittel. Introduction to Solid State Physics. John Wiley & sons, 1971.
[27] R. D. Evans.The Atomic Nucleus. McGraw-Hill, 1955.
[28] F. H. Attix. Introduction to Radiological Physics and Radiation Dosimetry. Wiley-Interscience, 1986.
[29] J. Beutel, H.L. Kundel, and R.L. Van Metter, editors.Handbook of Medical Imaging. SPIEPress, 2000.
[30] E. Rubenstein et al. Synchrotron radiation coronary angiography in humans. In B. Chance,editor,Synchrotron Radiation in the Biosciences, pages 639–645. Oxford University Press,1994.
[31] W.R. Dix et al. Comparison of intravenous coronary angiography using synchrotronradiation with selective coronary angiography.Journal of Synchrotron Radiation, 10:219–227, 2003.
[32] H. Ellaum et al. First human transvenous coronary angiography at the EuropeanSynchrotron Radiation Facility.Physics in Medicine and Biology, 45:L39–L45, 2000.
[33] J.C. Giacomini et al. Bronchial imaging in humans using xenon K-edge dicromography.Nuclear Instruments and Methods in Physics Research A, 406:473–478, 1998.
[34] S. Bayat et al. Quantitative functional lung imaging with synchrotron radiation usinginhaled xenon as contrast agent.Physics in Medicine and Biology, 46:3287–3299, 2001.
[35] R. Moeckli et al. Objective comparison of image quality and dose between conventionaland synchrotron radiation mammography.Physics in Medicine and Biology, 45:3509–3523,2000.
[36] R. Moeckli et al. Assessment of the image contrast improvement and dose reduction inmammography with synchrotron radiation compared to standard units.Nuclear Instrumentsand Methods in Physics Research A, 467:1349–1352, 2001.
[37] S. Fabbri et al. Signal-to-noise ratio evaluation of dual-energy radiography with synchrotronradiation.Physics in Medicine and Biology, 47:4083–4105, 2002.
[38] F. Arfelli. Synchrotron light and imaging systems for medical radiology.NuclearInstruments and Methods in Physics Research A, 454:11–25, 2000.
V
[39] F. Arfelli et al. Mammography with synchrotron radiation: Phase-detection techniques.Radiology, 215(1):286–293, 2000.
[40] R.A. Lewis. Medical phase contrast X-ray imaging: current status and future prospects.Physics in Medicine and Biology, 49:3573–3583, 2004.
[41] A. Snigirev et al. On the possibilities of X-ray phase contrast microimaging by coherenthigh energy synchrotron radiation.Review of Scientific Instruments, 66:5486–5492, 1995.
[42] F. Arfelli et al. Low-dose phase contrast medical imaging.Physics in Medicine and Biology,43:2845–2852, 1998.
[43] A. Pogany, D. Gao, and S.W. Wilkins. Contrast and resolution in imaging with a microfocusX-ray source.Review of Scientific Instruments, 68:2774–2782, 1997.
[44] A. Olivo et al. An innovative digital set-up allowing a low-dose approach to phase contrastapplications in the medical field.Medical Physics, 28(8):1610–1619, 2001.
[45] A. Olivo et al. A multilayer edge-on single photon counting silicon microstrip detector forinnovative imaging techniques in diagnostic radiology.Review of Scientific Instruments,74(7):3460–3465, 2003.
[46] V.N. Ingal et al. Phase mammography – a new technique for breast investigation.Physicsin Medicine and Biology, 43:2555–2567, 1998.
[47] K. Mori et al. Application of synchrotron X-ray imaging to phase objects in orthopedics.Journal of Synchrotron Radiation, 9:143–147, 2002.
[48] J. Mollenhauer et al. Diffraction-enhanced X-ray imaging of articular cartilage.Osteoartrithis and Cartilage, 10:163–171, 2002.
[49] Y. Suzuki, N. Yagi, and K. Uesugi. X-ray refraction-enhanced imaging and a method forphase retrieval for a simple object.Journal of Synchrotron Radiation, 9:160–165, 2002.
[50] M.J. Kitchen et al. On the origin of speckle in X-ray phase contrast images of lung tissue.Physics in Medicine and Biology, 49:4335–4348, 2004.
[51] E.D. Pisano et al. Human breast cancer specimens: Diffraction-enhanced imagingwith histologic correlation-improved conspicuity of lesion detail compared with digitalradiography.Radiology, 214:895–901, 2000.
[52] S. Fiedler et al. Imaging lobular breast carcinoma: comparison of synchrotron radiationDEI-CT technique with clinical CT, mammography and histology.Physics in Medicineand Biology, 49:175–188, 2004.
[53] E.D. Pisano et al. Diffraction Enhanced Imaging for breast cancer detection and diagnosis.In Proceedings of Medical Applications of Synchrotron Radiation, 2004.
[54] R.H. Menk. Future perspectives of DEI with SR. InProceedings of Medical Applicationsof Synchrotron Radiation, 2004.
[55] R. Longo et al. Synchrotron radiation breast imaging at Elettra. InProceedings of theMediterranean Conference on Medical and Biological Engineering, 2004.
[56] S. Pani et al. Dosimetric requirements and protocols for in vivo breast imaging withsynchrotron radiation. InWorkshop on radiation dosimetry: basic technologies, medicalapplications, enviromental applications, volume XXIX of Frascati Physics Series, pages11–116, 2002.
[57] B. Hemdal et al. Mammography - Recent technical developments and their clinical
[58] S. Webb, editor.The Physics of Medical Imaging. The Institute of Physics, 1988.
[59] D.S. Brettle and A.R. Cowen. Dual-energy digital mammography utilizing stimulatedphosphor computed radiography.Physics in Medicine and Biology, 39:1989–2004, 1994.
[60] M. Marziani et al. Dual-energy tissue cancellation in mammography with quasi-monochromatic X-rays.Physics in Medicine and Biology, 47:305–313, 2002.
[61] A. Taibi et al. Dual-energy imaging in full-field digital mammography: a phantom study.Physics in Medicine and Biology, 48:1945–1956, 2003.
[62] R.A. Jong et al. Contrast-enhanced digital mammography: Initial clinical experience.Radiology, 228:842–850, 2003.
[63] J.M. Lewin et al. Dual-energy contrast-enhanced digital subtraction mammography:feasibility. Radiology, 229:261–268, 2003.
[64] J.M. Boone et al. Dedicated breast CT: Radiation dose and image quality evaluation.Radiology, 221:657–667, 2001.
[65] S. Pani et al. Breast tomography with synchrotron radiation. InPhysics of medical Imaging,volume 4682, pages 228–235. SPIE, 2002.
[66] M.J. Yaffe and J.A. Rowlands. X-ray detectors for digital radiography.Physics in Medicineand Biology, 42:1–39, 1997.
[67] H.G. Chotas, J.T. Dobbins III, and C.E. Ravin. Principles of digital radiography with large-area, electronically readable detectors: A review of the basics.Radiology, 210:595–599,1999.
[68] J.A. Rowlands et al. Flat-panel digital radiology with amorphous selenium and active-matrix readout.Radiographics, 17:753–760, 1997.
[69] D. Mah, J.A. Rawlinson, and J.A. Rowlands. Detective quantum efficiency of an amorphousselenium detector to megavoltage radiation.Physics in Medicine and Biology, 44:1369–1384, 1999.
[70] T.O. Tumer et al. High-resolution pixel detectors for second generation digitalmammography.Nuclear Instruments and Methods in Physics Research A, 497:21–29, 2003.
[71] M.G. Bisogni, A. Colaand, and M.E. Fantacci. Simulated and experimental spectroscopicperformance of GaAs X-ray pixel detectors.Nuclear Instruments and Methods in PhysicsResearch A, 466:188–193, 2001.
[72] G.I. Ayzenshtat et al. GaAs detectors for medical imaging.Nuclear Instruments andMethods in Physics Research A, 509:268–273, 2003.
[73] S.R. Amendolia et al. A prototype for a mammographic head and related developments.Nuclear Instruments and Methods in Physics Research A, 518:382–385, 2004.
[74] S. Yin et al. Direct conversion Si and CdZnTe detectors for digital mammography.NuclearInstruments and Methods in Physics Research A, 448:591–597, 2000.
[75] C. Scheiber and G.C. Giakos. Medical applications of CdTe and CdZnTe detectors.NuclearInstruments and Methods in Physics Research A, 458:12–25, 2001.
[76] A. Owens et al. The X-ray response of InP.Nuclear Instruments and Methods in PhysicsResearch A, 487:435–440, 2002.
VII
[77] A. Owens et al. The X-ray response of InP: Part B, synchrotron radiation measurements.Nuclear Instruments and Methods in Physics Research A, 491:444–451, 2002.
[78] R. Turchetta et al. Imaging with polycristalline mercuric iodide detectors using VLSIreadout.Nuclear Instruments and Methods in Physics Research A, 428:88–94, 1999.
[79] I. Crotty et al. High-rate, high position resolution microgap RPCs for X-ray imagingapplications.Nuclear Instruments and Methods in Physics Research A, 505:203–206, 2003.
[80] P.M. Shikhaliev et al. Scanning-slit photon counting X-ray imaging system using amicrochannel plate detector.Medical Physics, 31:1061–1071, 2004.
[81] B. Cederstrom et al. Focusing hard X-rays with old LP’s.Nature, 404:951, 2000.
[82] B. Cederstrom, C. Ribbing, and M. Lundqvist. Multiprism X-ray lens.Applied PhysicsLetters, 81, 2002.
[83] R. Lewis. Position sensitive detectors for synchrotron radiation studies: the totoise and thehare?Nuclear Instruments and Methods in Physics Research A, 513:172–177, 2003.
[84] M. Rabbani, R. Shaw, and R. Van Metter. Detective quantum efficiency of imaging systemswith amplifying and scattering mechanisms.Journal of the Optical Society of America A,4:895–901, 1987.
[85] M. Bordessoule and M. Lemonnier. High-rate counters versus integrating devices insynchrotron experiments.Nuclear Instruments and Methods in Physics Research A,481:592–600, 2002.
[86] D.F. Yu and J.A. Fessler. Mean and variance of single photon counting with deadtime.Physics in Medicine and Biology, 45:2043–2056, 2000.
[87] H. von Seggern et al. Physical model of photostimulated luminescence of X-ray irradiatedBaFBr:Eu2+. Journal of Applied Physics, 64:1405–1412, 1988.
[88] K.A. Fetterly and B.A. Schueler. Performance evaluation of a “dual-side read” dedicatedmammography computed radiography system.Medical Physics, 30:1843, 2003.
[89] S. Hejazi and D.P. Trauernicht. System considerations in CCD-based X-ray imaging fordigital chest radiography and digital mammography.Medical Physics, 24:287, 1997.
[90] D.S. Evans, A. Workman, and M. Payne. A comparison of the imaging properties of CCD-based devices used for small field digital mammography.Physics in Medicine and Biology,47:117–135, 2002.
[91] J.G. Mainprize et al. A slot-scanned photodiode-array/CCD hybrid detector for digitalmammography.Medical Physics, 29:214, 2002.
[92] S. Vedantham et al. Mammographic imaging with a small format CCD-based digitalcassette: Physical characteristics of a clinical system.Medical Physics, 27:1832, 2000.
[93] A. Karellas et al. Charge-coupled device detector: Performance considerations andpotential for small-field mammographic imaging applications.Medical Physics, 19:1015,1992.
[94] D.W. Holdsworth, R.K. Gerson, and A. Fenster. A time-delay integration charge-coupleddevice camera for slot-scanned digital radiography.Medical Physics, 17:876, 1990.
[95] N.C. Virgil III et al. Evaluation of detector dynamic range in the X-ray exposure domainin mammography: A comparison between film–screen and flat panel detector systems.Medical Physics, 30:2614, 2003.
VIII
[96] M. Powell. The physics of amorphous silicon thin film transistors.IEEE Transactions onElectronic Devices, 36:2753–2763, 1989.
[97] S. Vedantham et al. Full breast digital mammography with an amorphous silicon-based flatpanel detector: Physical characteristics of a clinical prototype.Medical Physics, 27:558,2000.
[98] B. Chen and R. Ning. Cone-beam volume CT breast imaging: Feasibility study.MedicalPhysics, 29:755, 2002.
[99] W. Zhao and J.A. Rowlands. X-ray imaging using amorphous selenium: feasibility of a flatpanel self-scanned detector for digital radiology.Medical Physics, 22:1595–1604, 1995.
[100] G. Pang, W. Zhao, and J.A. Rowlands. Digital radiology using active matrix readout ofamorphous selenium: Geometrical and effective fill factors.Medical Physics, 25:1636,1998.
[101] M.P. Andre et al. Integrated CMOS-selenium X-ray detector for digital mammography. InPhysics of Medical Imaging, volume 3336, page 204. SPIE, 1998.
[102] Y. El-Mohri et al. Evaluation of direct detection and indirect detection active matrix flat-panel imagers (AMFPIs) for digital mammography. InPhysics of Medical Imaging, volume5030, pages 168–180. SPIE, 2003.
[103] F. Arfelli et al. Silicon X-ray detector for synchrotron radiation digital radiology.NuclearInstruments and Methods in Physics Research A, 353:366–370, 1994.
[104] S. Stres et al. New silicon microstrip detector for digital mammography - test andevaluation.Physics in Medicine and Biology, 45:2029 – 2041, 2000.
[105] M. Lundqvist et al. Computer simulations and performance measurements on a silicon stripdetector for edge-on imaging.IEEE Transactions on Nuclear Science, 47(4):1487–1492,2000.
[106] M. Lundqvist et al. Evaluation of a photon-counting X-ray imaging system.IEEETransactions on Nuclear Science, 48(4):1530–1536, 2001.
[107] Sectra AB. http://www.sectra.se.
[108] T. Francke et al. Dose reduction in medical X-ray imaging using noise free photon counting.Nuclear Instruments and Methods in Physics Research A, 471:85–87, 2001.
[109] C. Iacobaeus et al. The development and study of high-position resolution (50µm) RPCsfor imaging X-rays and UV photons.Nuclear Instruments and Methods in Physics ResearchA, 513:244–249, 2003.
[110] M. Danielsson et al. Novel gaseous detectors for medical imaging.Nuclear Instrumentsand Methods in Physics Research A, 518:406–410, 2004.
[111] G. Lutz. Semiconductor Radiation Detectors. Springer, 1999.
[112] H.F.-W. Sadrozinski. Applications of silicon detectors.IEEE Transactions on NuclearScience, 48:933–941, 2001.
[113] N. W. Ashcroft and D. Mermin.Solid State Physics. International Thomson Publishing, 1st
edition, 1976.
[114] A. Peisert. Silicon microstrip detectors. In F. Sauli, editor,Instrumentation in High EnergyPhysics. World Scientific Publishing Co., 1992.
[115] G. F. Knoll. Radiation detection and measurement. John Wiley & sons, 2nd edition, 1989.
IX
[116] W. R. Leo.Techniques for nuclear and particle physics experiments - A How-to approach.Springer-Verlag, 1987.
[117] A.G. Chilingarov. Semiconductor coordinate detectors in elementary-particle physics.Sovietic Journal of Particle and Nuclear Physics, 23, 1992.
[118] M. Laakso et al. Operation and radiation resistance of a FOXFET biasing structure forsilicon strip detectors.Nuclear Instruments and Methods in Pisics Research A, 326:214–221, 1993.
[119] P.P. Allport et al. Double-sided FOXFET biased microstrip detectors.Nuclear Instrumentsand Methods in Pisics Research A, 348:416–420, 1994.
[120] G. Barrichello et al. Performance of long modules of silicon microstrip detectors.NuclearInstruments and Methods in Pisics Research A, 413:17–30, 1998.
[121] M. Conti. Silicon microstrip detectors for X-ray imaging with TDC and transputer DAQ.Nuclear Instruments and Methods in Physics Research A, 360:287–289, 1995.
[122] A. Del Guerra et al. A high-rate X-Y coincidence VLSI system for 2D imaging detectors.Nuclear Instruments and Methods in Physics Research A, 394:191–198, 1997.
[123] R.D. Speller et al. Digital X-ray imaging using silicon microstrip detectors: a design study.Nuclear Instruments and Methods in Physics Research A, 457:653–664, 2001.
[124] G.J. Royle et al. Development of a 2D silicon strip detector system for mammographicimaging using particle physics technology.Nuclear Instruments and Methods in PhysicsResearch A, 493:176–188, 2002.
[125] G. Barbiellini et al. Solid state detectors for X-rays from synchrotron radiation. InTopics onbiomedical physics, pages 79–87. Italian Association of Biomedical Physics - AIFB, WorldScientific, 1991.
[126] F. Arfelli et al. SYRMEP (SYnchrotron Radiation for MEdical Physics). Performance ofthe digital detection system.Physica Medica, IX(1):229–233, 1993.
[127] D. Krizaj and S. Amon. Numerical analysis of edge effects in side illuminated strip detectorsfor digital radiology. Nuclear Instruments and Methods in Physics Research A, 439:451–457, 2000.
[128] S.I. Parker, C.J. Kenney, and J. Segal. 3D - A proposed new architecture for solid stateradiation detectors.Nuclear Instruments and methods in Physics Research, 395:328–343,1997.
[129] C.J. Kenney, S.I. Parker, and E. Walckiers. Results from 3-D silicon sensors with wallelectrodes: near-cell-edge sensitivity measurements as a preview of active-edge sensors.IEEE Transactions on nuclear science, 48:2405–2409, 2001.
[130] F. Arfelli et al. Design and evaluation of AC-coupled, FOXFET biased, ”edge-on” siliconstrip detectors for X-ray imaging.Nuclear Instruments and Methods in Physics ResearchA, 385:311–320, 1997.
[131] B. Hilt et al. New quantum detection system for very low dose X-ray radiology.NuclearInstruments and Methods in Physics Research A, 442:38–44, 2000.
[132] B. Hilt et al. The quantum X-ray radiology apparatus.Nuclear Instruments and Methods inPhysics Research A, 442:355–359, 2000.
[133] P. Fessler et al. An important step forward in contnuous spectroscopic imaging of ionisingradiations using ASICs.Nuclear Instruments and Methods in Physics Research A, 421:130–
X
141, 1999.
[134] T. Mali et al. Characterisation of an X-ray imaging setup for digital mammography basedon a silicon microstrip detector. In M.J. Yaffe, editor,Digital Mammography: IWDM 2000,5th International Workshop, 2000.
[135] D. Vrtacnik. Side-illuminated 100µm pitch X-ray detector for digital radiology.Sens.actuators A Phys., 85:209–216, 2000.
[136] G. Comes et al. CASTOR: A VLSI CMOS mixed analog-digital circuit for low noisemultichannel counting applications.Nuclear Instruments and Methods in Physics ResearchA, 377:440–445, 1996.
[137] E. Beuville et al. An application specific integrated circuit and data acquisition system fordigital X-ray imaging.Nuclear Instruments and Methods in Physics Research A, 409:337–342, 1998.
[138] E. Beuville. High resolution X-ray imaging using a silicon strip detector.IEEE Transactionson Nuclear Science, 45(6):3059–3063, 1998.
[139] Mamea AB. http://www.mamea.se.
[140] A. Olivo et al. Experimental evaluation of a simple algorithm to enhance the spatialresolution in scanned radiographic systems.Medical Physics, 27(11):2609–2616, 2000.
[141] F. Arfelli et al. A multilayer silicon microstrip detector for single photon counting digitalmammography.Informacije MIDEM, 29(1):26–31, 1999.
[142] F. Arfelli et al. A multilayer edge-on silicon microstrip single photon counting detector fordigital mammography.Nuclear Physics B, 78:592–597, 1999.
[143] F. Arfelli et al. At the frontiers of digital mammography: SYRMEP.Nuclear Instrumentsand Methods in Physics Research A, 409:529–533, 1998.
[144] H. J. M. Veendrick.Deep-Submicron CMOS ICs - From basics to ASICs. Kluwer AcademicPub, 1999.
[145] E. Gatti and P.F. Manfredi. Processing the signals from solid state detectors in elementaryparticle physics.Rivista del Nuovo Cimento, 9:1, 1986.
[146] S. Griffith. Gtk+ Programming in C. Prentice Hall Inc., 2002.
[147] W. K. Kenighan and D. M. Ritchie.The C programming language. Prentice Hall SoftwareSeries, 2nd edition, 1988.
[148] P. Horowitz and W. Hill.The Art of Electronics. Cambridge University Press, 1980.
[149] R. E. Simpson.Introductory Electronics for Scientists and Engineers. Allyn and Bacon,2nd edition, 1987.
[150] R. J. Tocci.Digital Systems. Prentice-Hall, 5th edition, 1991.
[151] A.K. Kamal and N. Malaviya. A theory of optimum photon-counting detectors.International Journal of Electronics, 37:817–820, 1974.
[152] L. Tlustos et al. Fixed pattern deviations in Si pixel detectors measured using the medipix1readout chip.Nuclear Instruments and Methods in Physics Research A, 509:102–108, 2003.
[153] D. W. Davidson et al. Limitations to flat-field correction methods when using an X-rayspectrum.Nuclear Instruments and Methods in Physics Research A, 509:146–150, 2003.
[154] A.V. Nikitin, R.L. Davidchack, and T.P. Armstrong. Many-fold coincidence pileup in
XI
silicon detectors: solare X-ray response of charged particle detector systems for space.Nuclear Instruments and Methods in Physics Research A, 386:431–438, 1997.
[155] C. Colledani et al. CASTOR 1.0: A VLSI CMOS mixed analog-digital circuit for pixelimaging applications.Nuclear Instruments and Methods in Physics Research A, 395:435–442, 1997.
[156] G. Baldazzi et al. X-ray imaging with a silicon microstrip detector coupled to the RX64ASIC. Nuclear Instruments and Methods in Physics Research A, 509:315–320, 2003.
[157] P. Grybos et al. Characterisation of silicon strip detectors with a binary read out chip forX-ray imaging. Nuclear Instruments and Methods in Physics Research A, 454:214–220,2000.
[158] D. Bollini et al. Energy resolution of a silicon detector with the RX64 ASIC designed forX-ray imaging. Nuclear Instruments and Methods in Physics Research A, 515:458–466,2003.
[159] G. Baldazzi et al. A silicon strip detector coupled to the RX64 ASIC for X-ray diagnosticimaging.Nuclear Instruments and Methods in Physics Research A, 514:206–214, 2003.
[160] P. Rato Mendes et al. Silicon strip detectors for two-dimensional soft X-ray imaging atnormal incidence.Nuclear Instruments and Methods in Physics Research A, 509:333–339,2003.
[162] http://www.ins.clrc.ac.uk/MicroelectronicsDesign/Projects//X-raydetection/DIFFEX/files/DataSheet.pdf. DIFFEX – A linear solid-state detector and hybrid front-end readout mod-ules. Technical report, RAL Microlectronics Group, 2003.
[163] B. Schmitt et al. Mythen detector system.Nuclear Instruments and Methods in PhysicsResearch A, 501:267–272, 2004.
[164] B. Schmitt et al. Development of single photon counting detectors at the Swiss LightSource.Nuclear Instruments and Methods in Physics Research A, 518:436–439, 2004.
[165] C. Da Via et al. Gallium arsenide pixel detectors for medical imaging.Nuclear Instrumentsand Methods in Physics Research A, 395:148–151, 1997.
[166] N. Wermes. Pixel detectors for particle physics and imaging applications.NuclearInstruments and Methods in Physics Research A, 512:277–288, 2003.
[167] M. Novelli et al. Semiconductor pixel detectors for digital mammography.NuclearInstruments and Methods in Physics Research A, 509:283–289, 2003.
[168] M. Prest et al. A low-noise high-rate photon counting ASIC for X-ray applications.NuclearInstruments and Methods in Physics Research A, 441:435–439, 2001.
[169] M. Prest. The new FRONTRAD silicon detectors. Technical report, INFN, 2000.
[170] W.D. Peterson.VME bus Handbook. VITA, 4th edition, 1997.
[171] J. K. Ousterhout.Tcl and the Tk toolkit. Addison-Wesley professional computing series,1994.
[172] J.M. Pieper.Automation measurement control. Rhode and Schwarz.
[173] J. Law. A new phantom for mammography.The British Journal of Radiology, 64:116–120,1991.
XII
[174] A. Bergamaschi et al. High-speed single photon counting read out elctronics for adigital detection system for synchrotron radiation mammography.Nuclear Instruments andMethods in Physics Research A, 518:415–417, 2003.
[175] T. Greitz. Presentation speech of the 1979 nobel prize in physiology or medicine, 1992.
[176] J.T. Dobbins III and D.J. Godfrey. Digital X-ray tomosynthesis: current state of the art andclinical potential.Physics in Medicine and Biology, 48:R65–R106, 2003.
[177] A. Smith. Full field breast tomosynthesis. Hologic Inc. Whitepapers,http://www.hologic.com/prod-mm//pdf/W-LM-TOMOTomosynthesis.pdf, 2003.
[178] G.M. Stiel et al. Digital flashing tomosynthesis: a promising technique forangiocardiographic screening.IEEE Transactions on medical imaging, 12:314–321, 1993.
[179] R.A.J. Groenhuis, R.L. Webber, and U.E. Ruttimann. Computerized tomosynthesis ofdental tissues.Oral surgery Oral Medicine Oral Pathology, 56:206–214, 1983.
[180] S. Sone et al. Development of a high-resolution digital tomosynthesis system and its clinicalapplication.Radiographics, 11:807–822, 1991.
[181] J. Duryea, J.T. Dobbins III, and J.A. Lynch. Digital tomosynthesis of hand joints for arthritisassesment.Medical Physics, 30:325–333, 2003.
[182] T. Wu et al. Tomographic mammography using a limited number of low-dose cone-beamprojection images.Medical Physics, 30:365–380, 2003.
[183] G.N. Hounsfield. Computed medical imaging. InNobel Lectures, Physiology or medicine1971-1980. World Scientific Publishing Co., 1992.
[184] A.M. Cormack. Early two-dimensional reconstruction and recent topics stemming fromit. In Nobel Lectures, Physiology or medicine 1971-1980. World Scientific Publishing Co.,1992.
[185] K.A. Jessen. State of the art in CT scanning, CT dosimetry and CT image qualityparameters, 2002.
[186] A. C. Kak and M. Slaney.Principles of computerized tomography imaging. IEEE Press,1988.
[187] J.H. Radon. Uber die bestimmung von funktionen durch ihre integralwerte langsgewisser mannigfaltigkeiten.Berichte Schsische Akademie der Wissenschaften. Leipzig,Math.Phys.Kl., pages 262–277, 1917.
[188] C.H.J. Chang et al. Preoperative diagnosis of potentially precancerous breast lesions bycomputed tomography breast scanner: preliminary study.Radiology, 129:209–210, 1978.
[189] Hui Hu et al. Four multidetector-row helical CT: Image quality and volume coverage speed.Radiology, 215:55–62, 2000.
[190] M. Inoue et al. Dynamic multidetector CT of breast tumors: Diagnostic features andcomparison with conventional techniques.American Journal of Roentgenology, 181:679–686, 2003.
[191] J.H. Siewerdsen and D.A. Jaffray. Optimization of X-ray imaging geometry (with specificapplication to flat-panel cone-beam computed tomography).Medical Physics, 27:1903,2000.
[192] J.H. Siewerdsen and D.A. Jaffray. Cone-beam computed tomography witha flat panelimager: magnitude and effects of X-ray scatter.Medical Physics, 28:220–231, 2001.
XIII
[193] S. Pani et al. Tomographic imaging with synchrotron radiation.Physica Medica,XVI(3):155–159, 2000.
[194] F.A. Dilmanian et al. Single- and dual- energy CT with monochromatic synchrotron X-rays.Physics in Medicine and Biology, 42:371–387, 1997.
[195] R. Longo et al. Morphological breast imaging: tomography and digital mammography withsynchrotron radiation.Nuclear Instruments and Methods in Physics Research A, 497:9–13,2003.
[196] F.A. Dilmanian et al. Computed tomography of X-ray index of refraction using thediffraction enhanced imaging method.Physics in Medicine and Biology, 45:933–946, 2000.
[197] A.V. Bronnikov. Theory of quantitative phase-contrast computed tomography.Journal ofthe Optical Society of America A, 19:472–480, 2002.
[198] P. Cloetens et al. Holotomography: quantitative phase tomography with micrometerresolution using hard synchrotron radiation X-rays.Applied Physics Letters, 75:2912–2914,1999.
[202] R.J. Mountain. Development of a hybrid photo-diode and its front-end electronics for theBTEV experiment.Nuclear Instruments and Methods in Physics Research A, 502:183–188,2003.


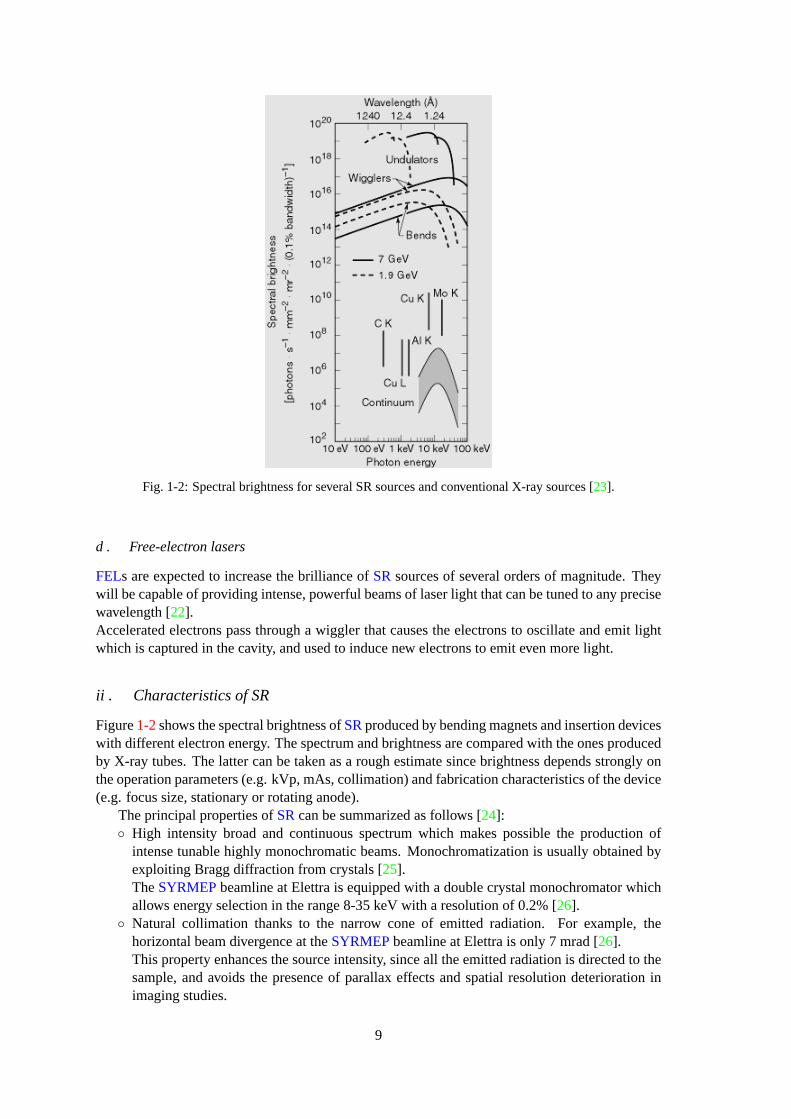


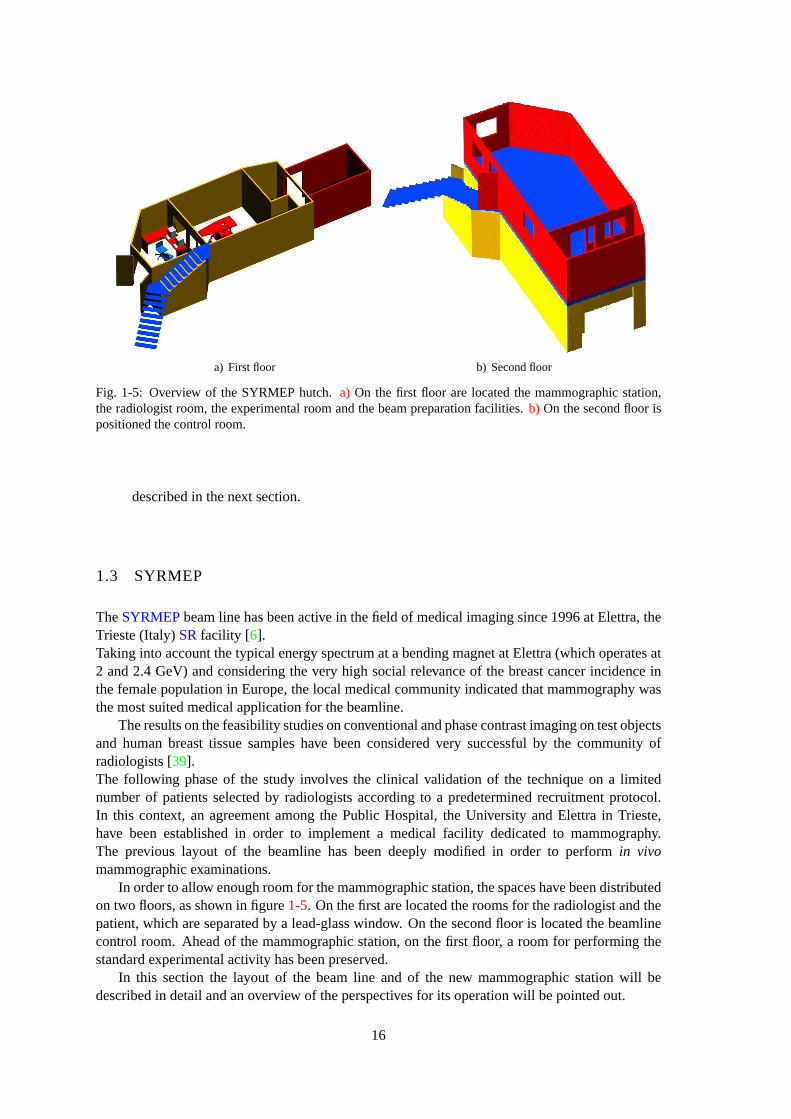
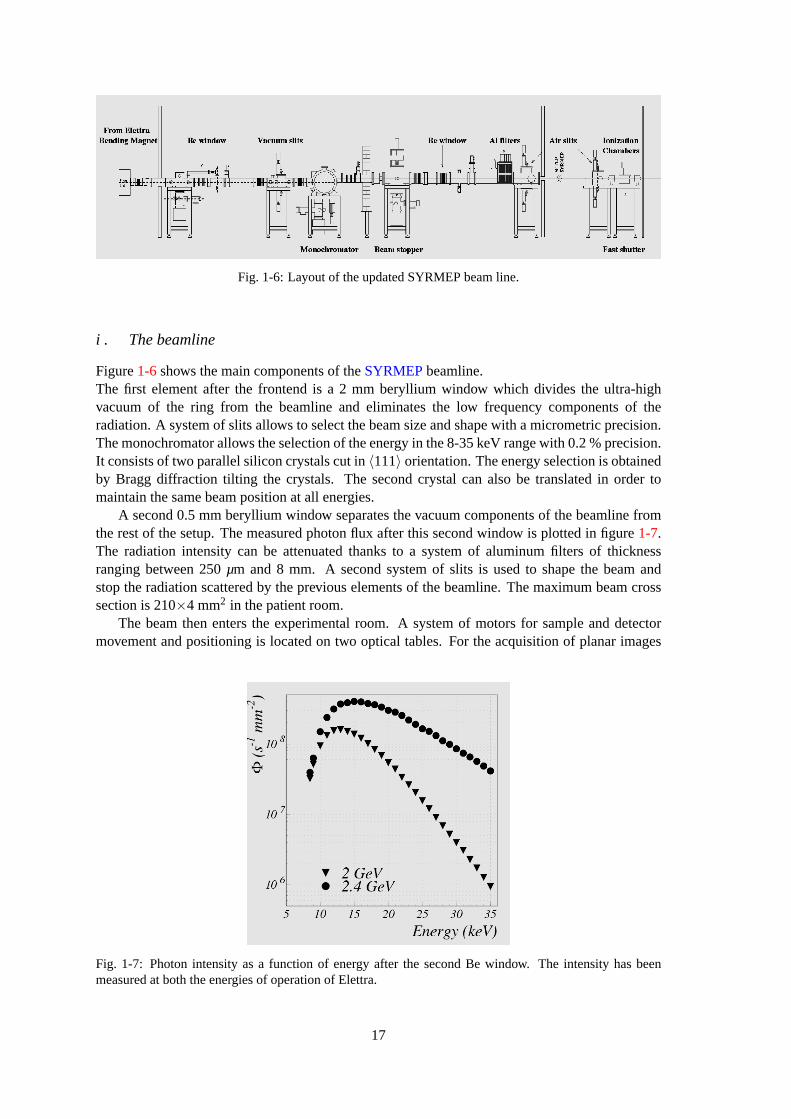


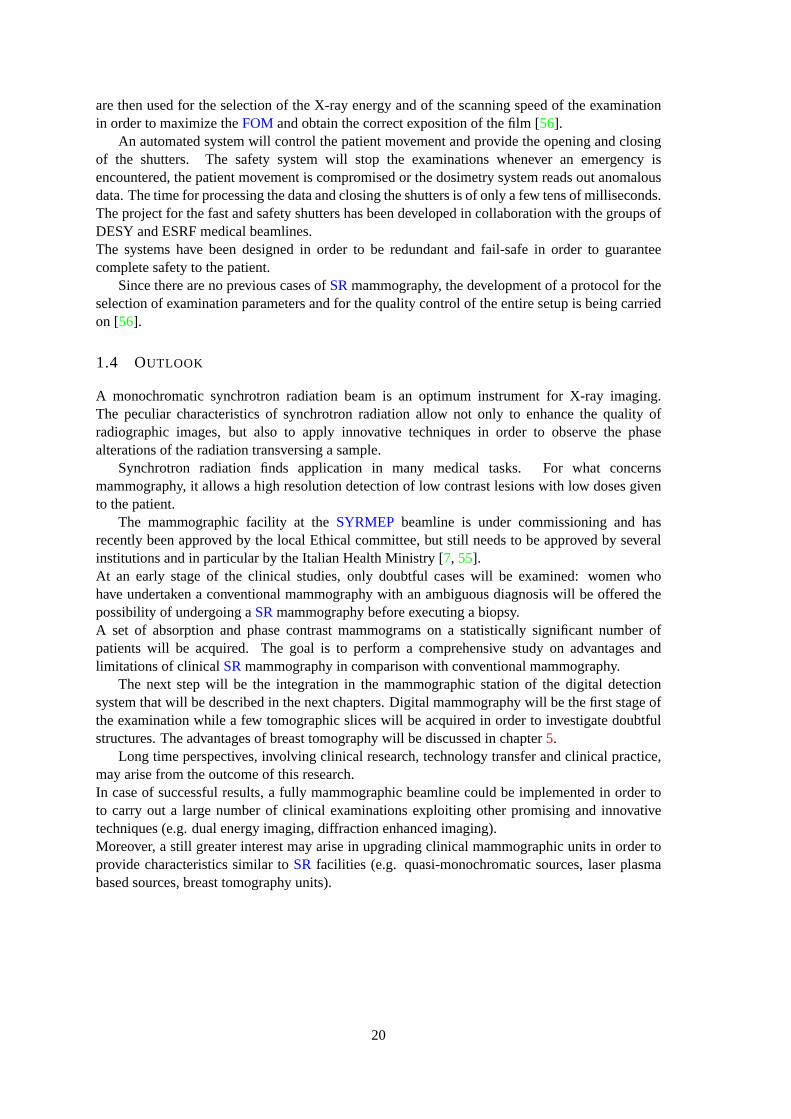


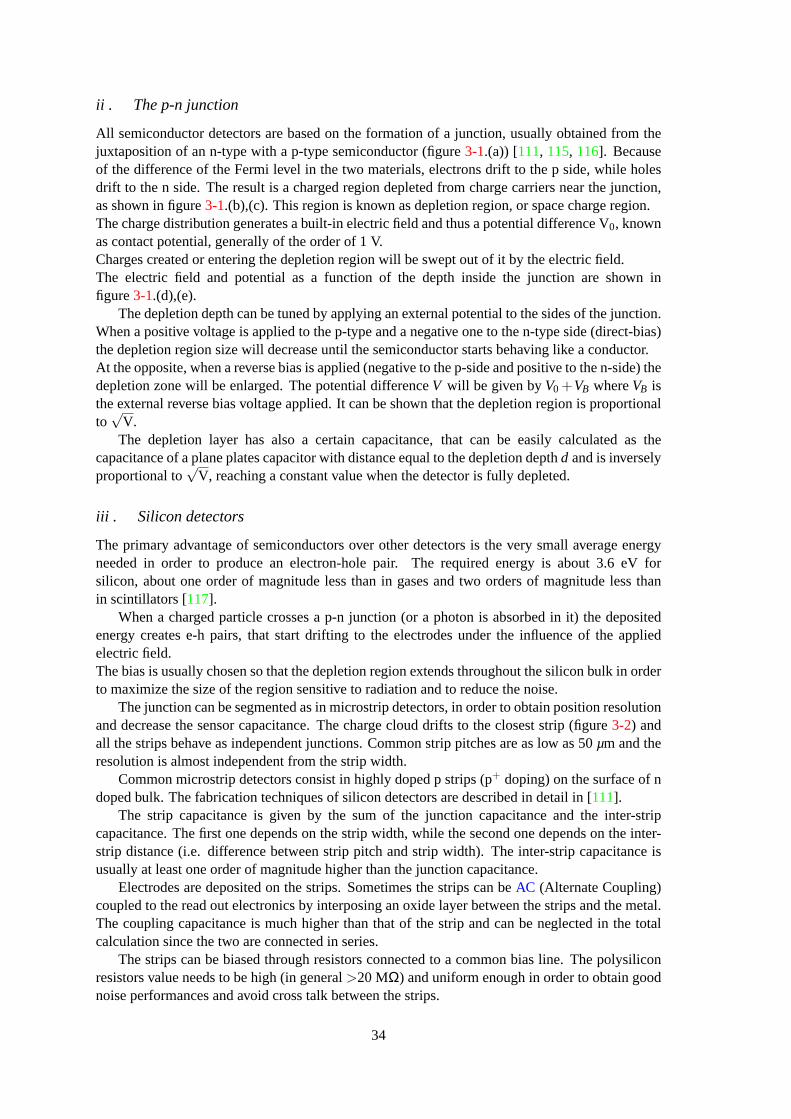


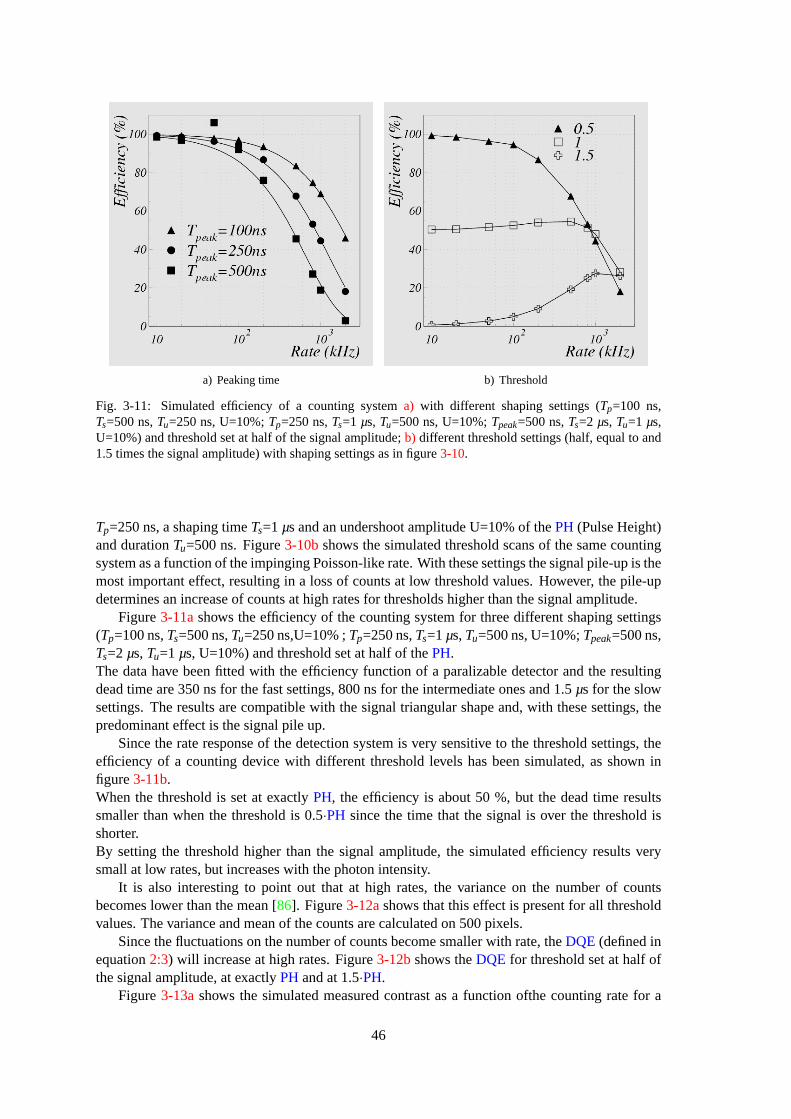

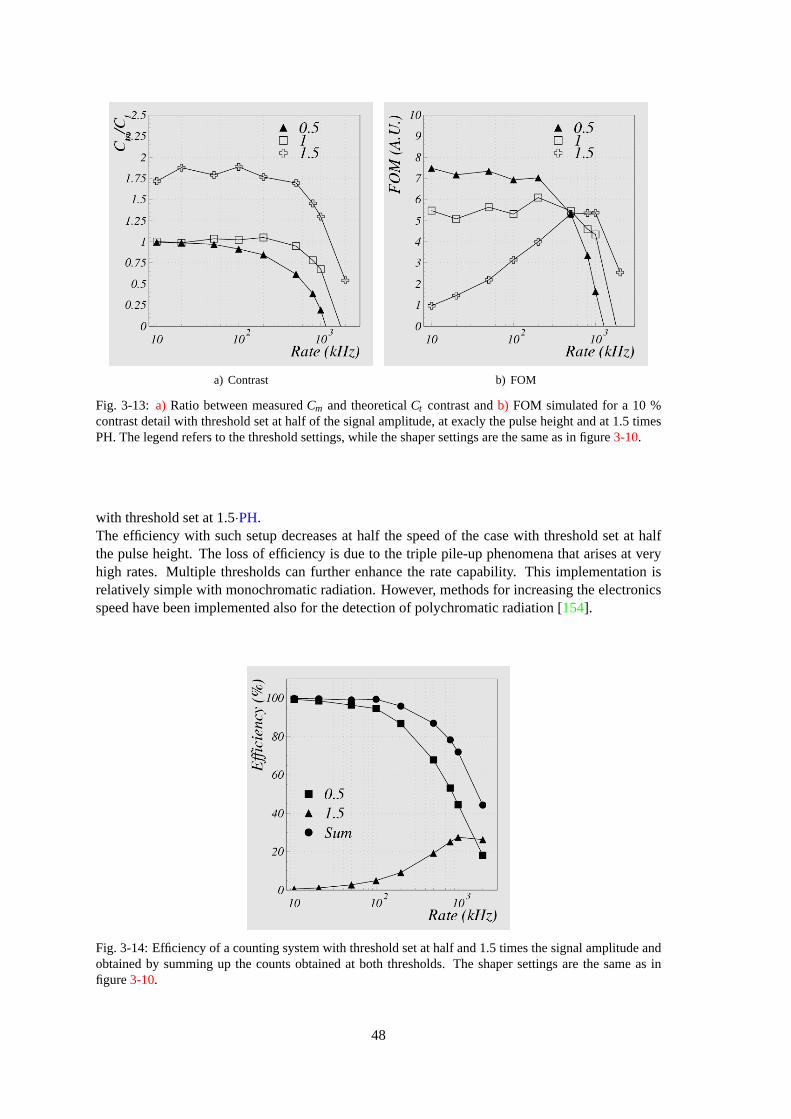


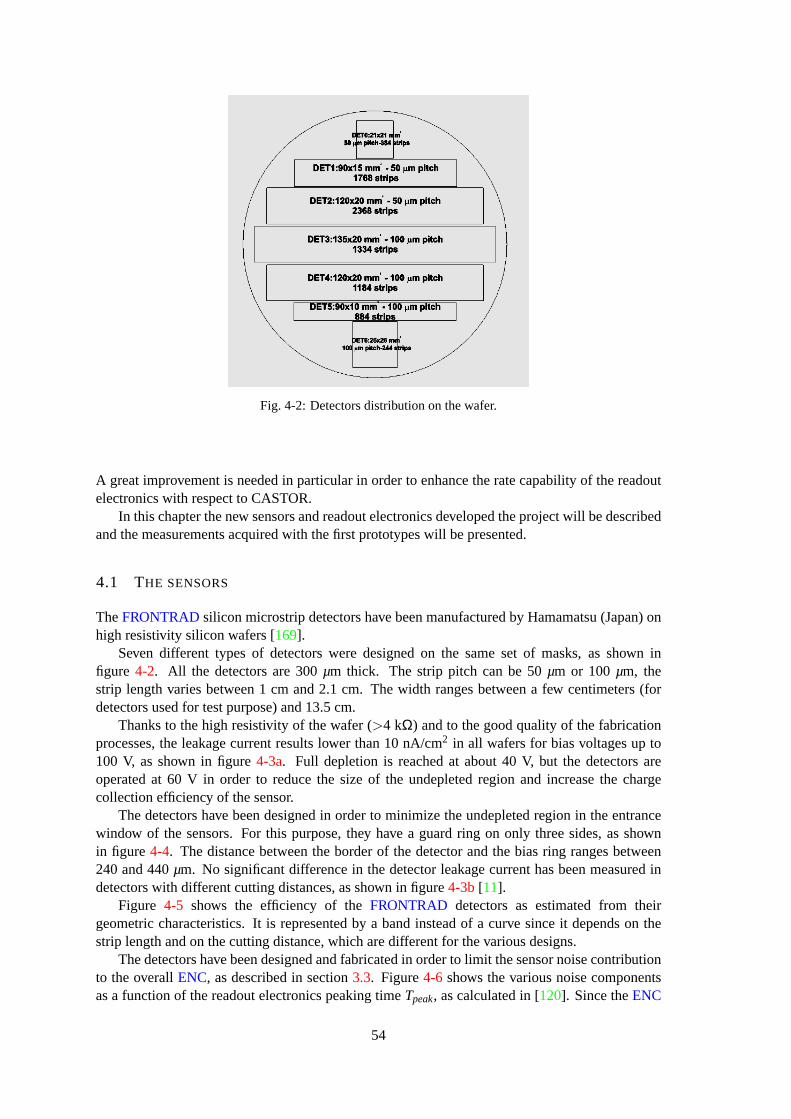


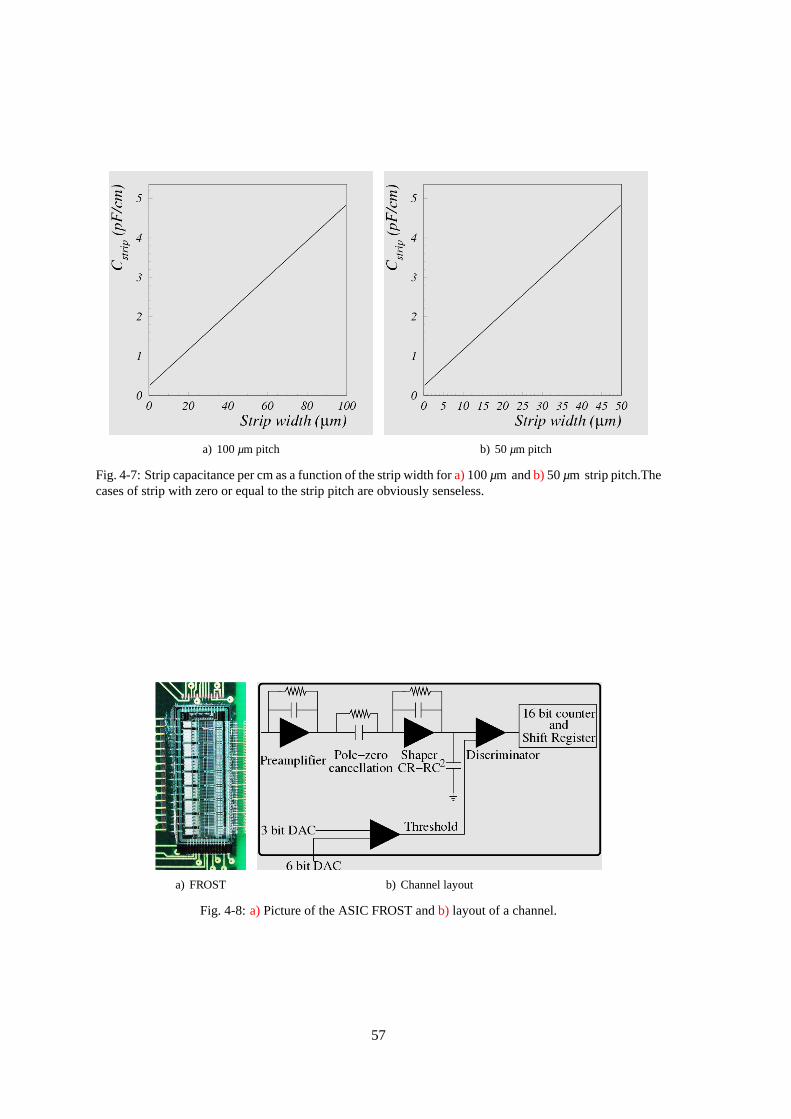


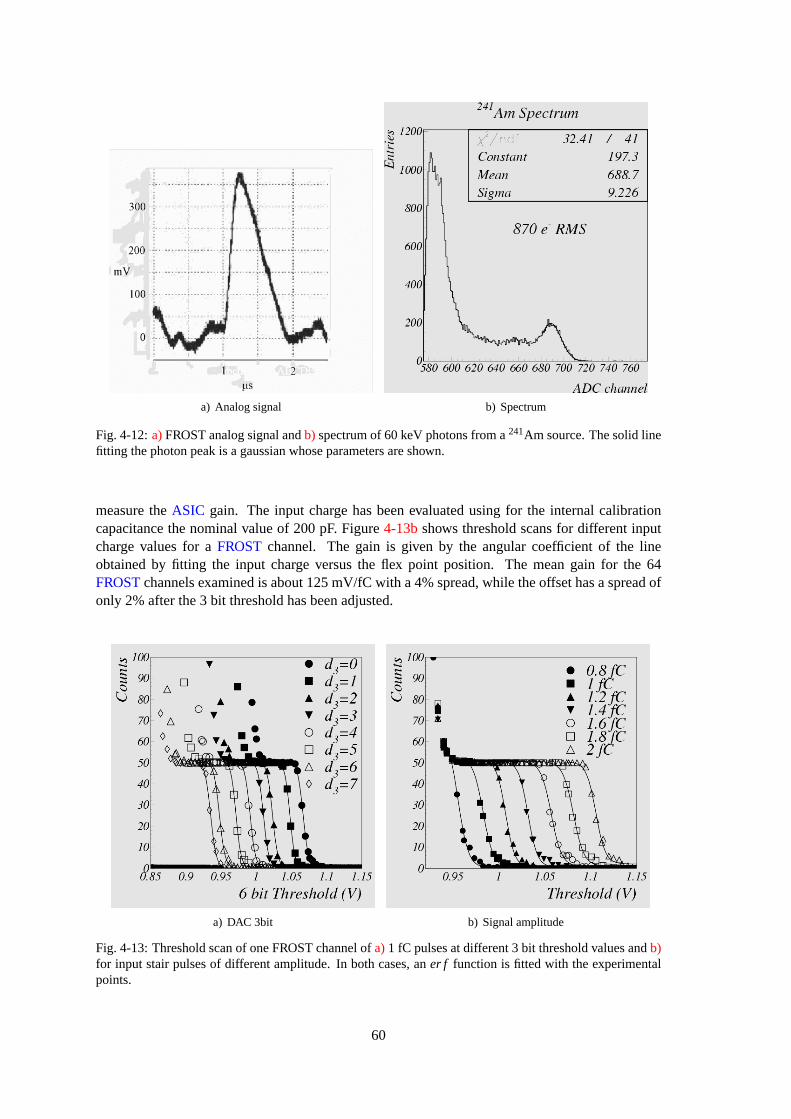

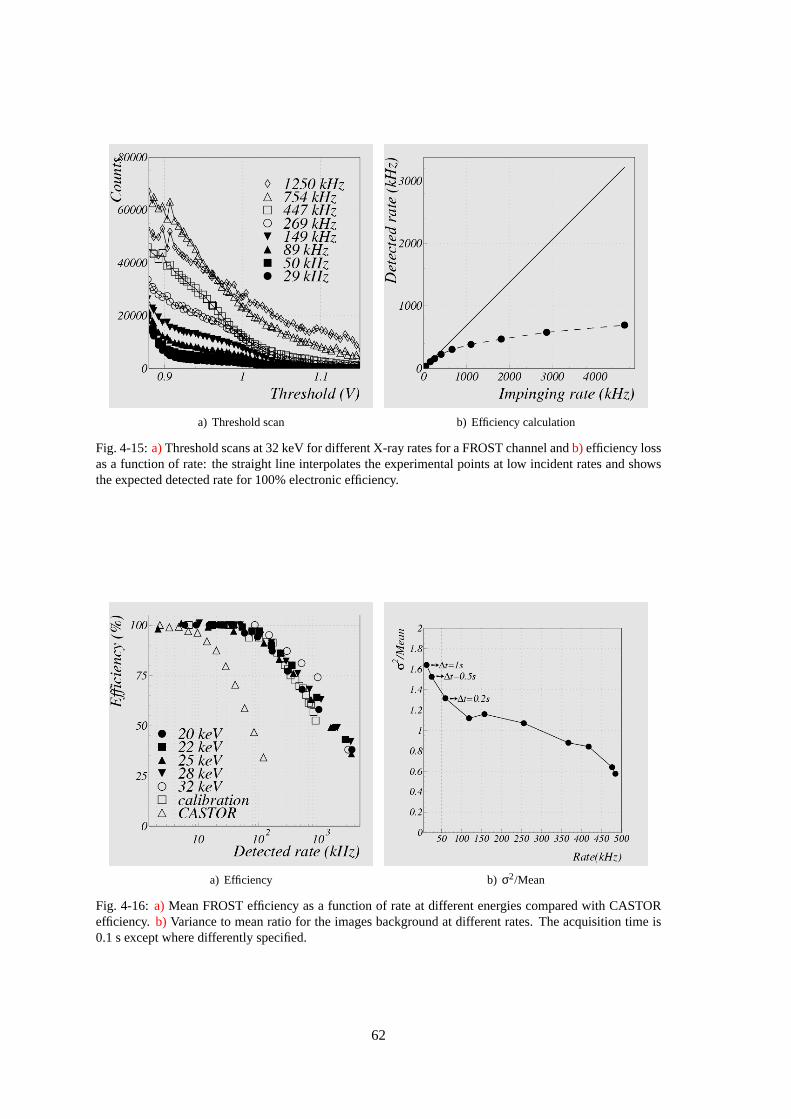
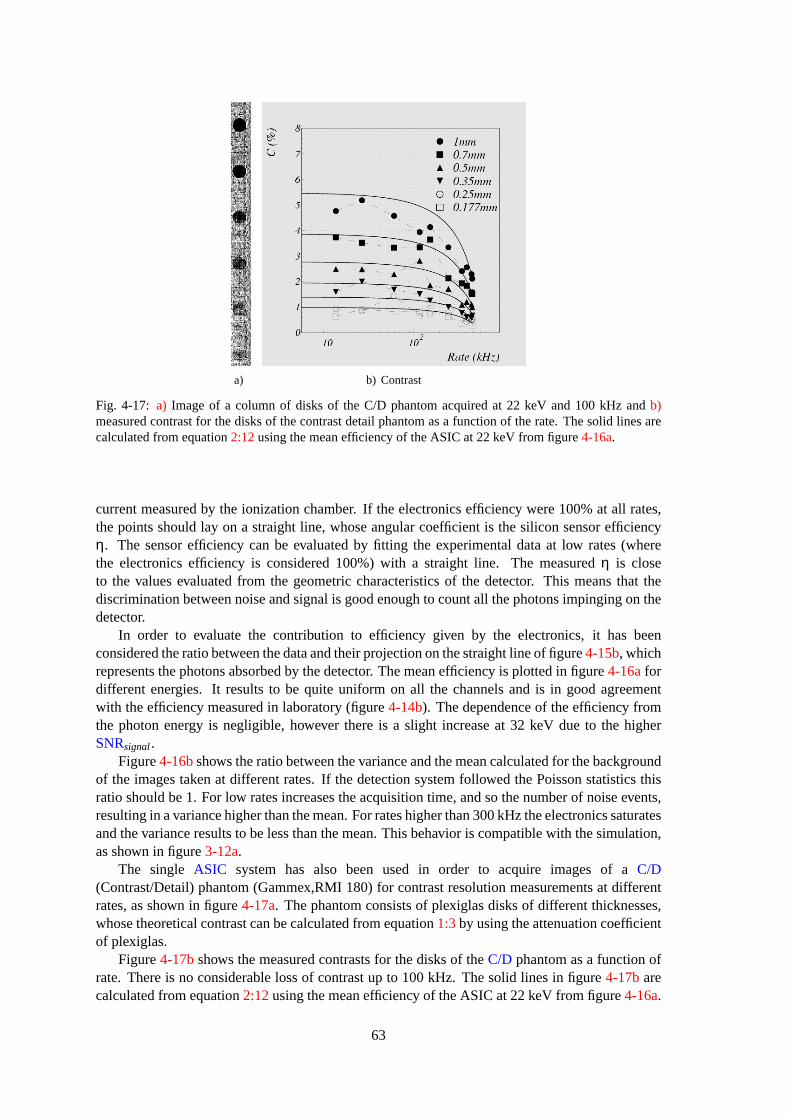


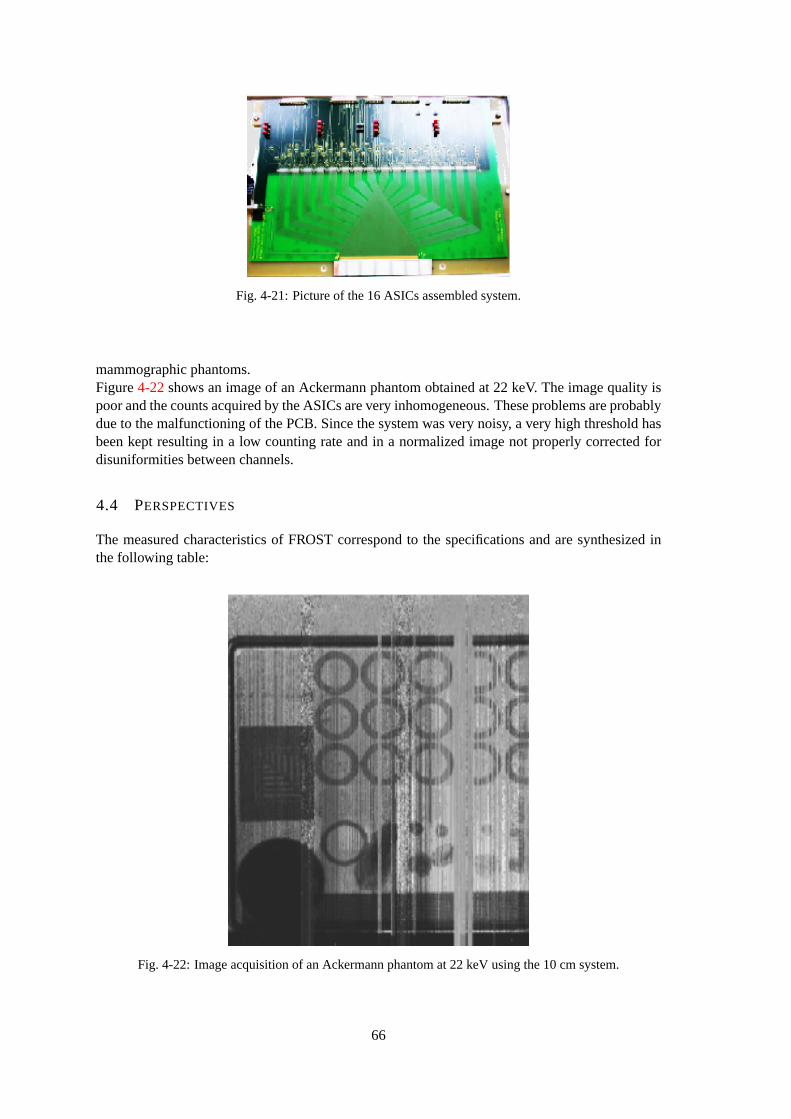
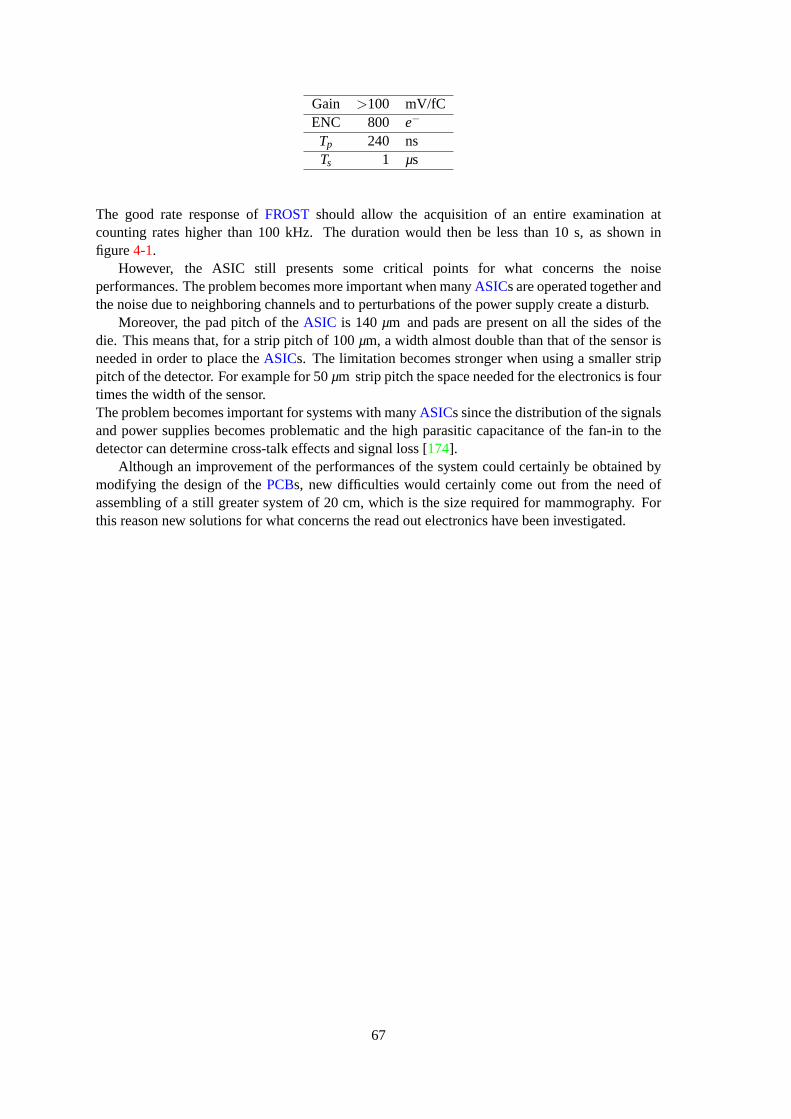


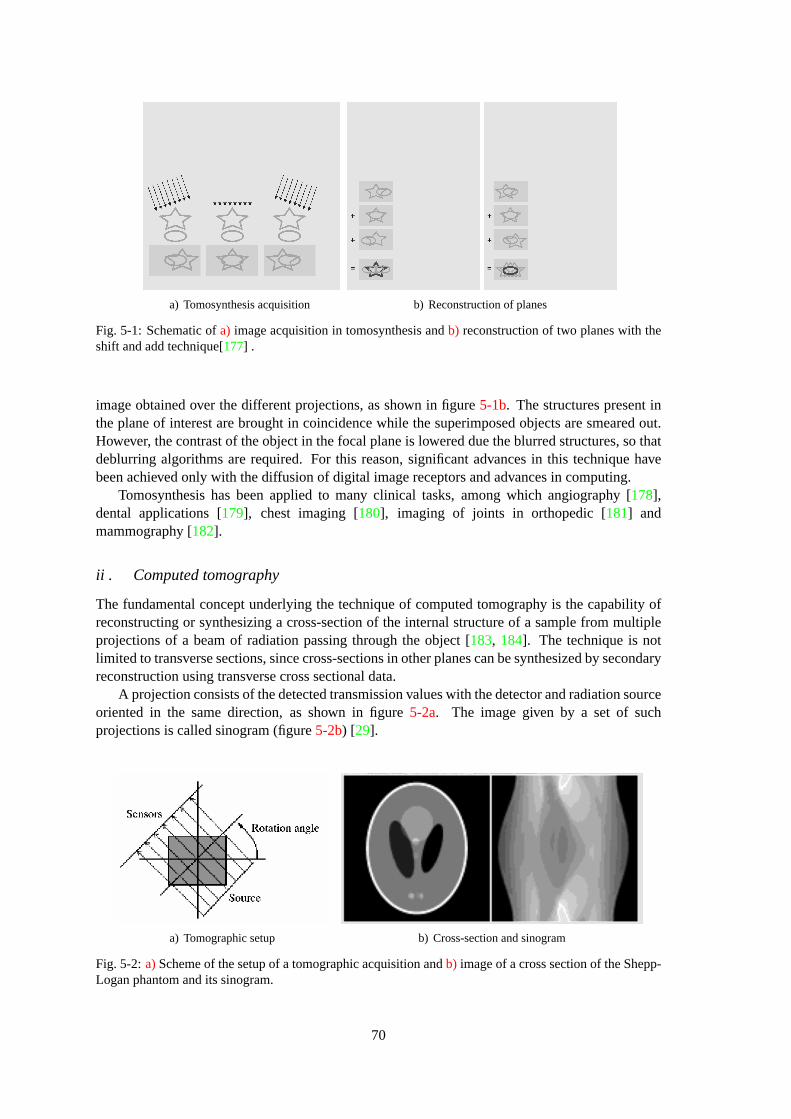
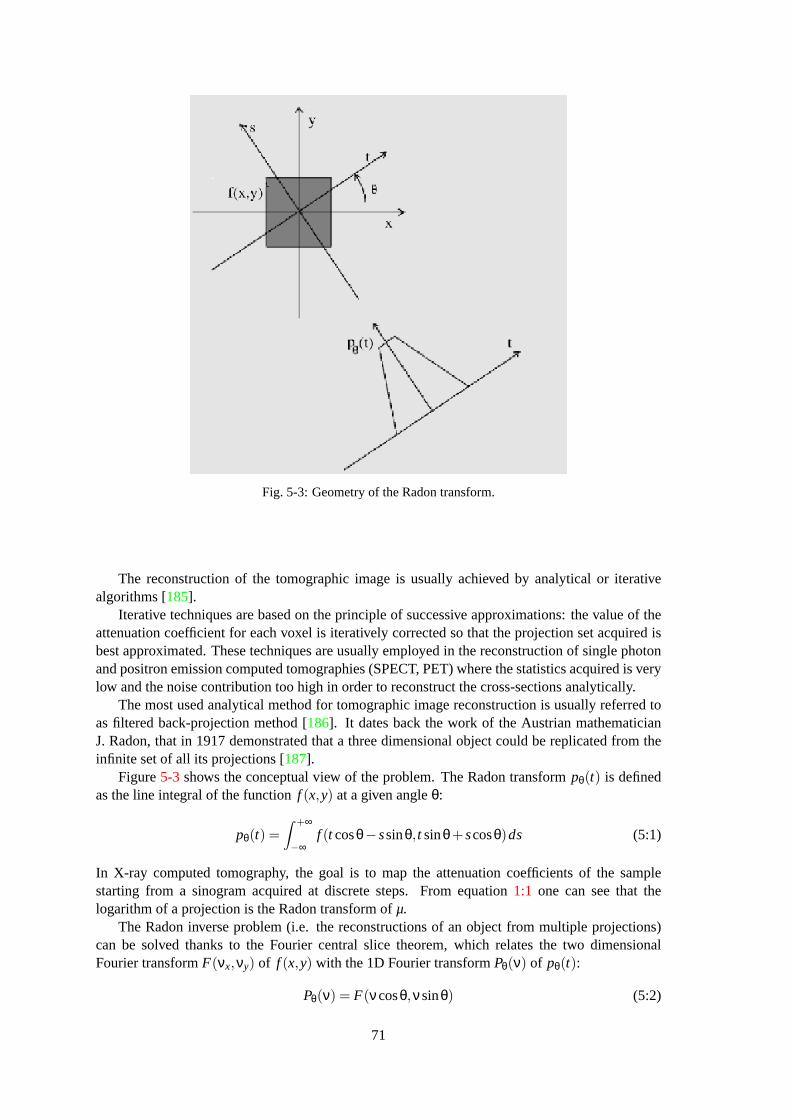


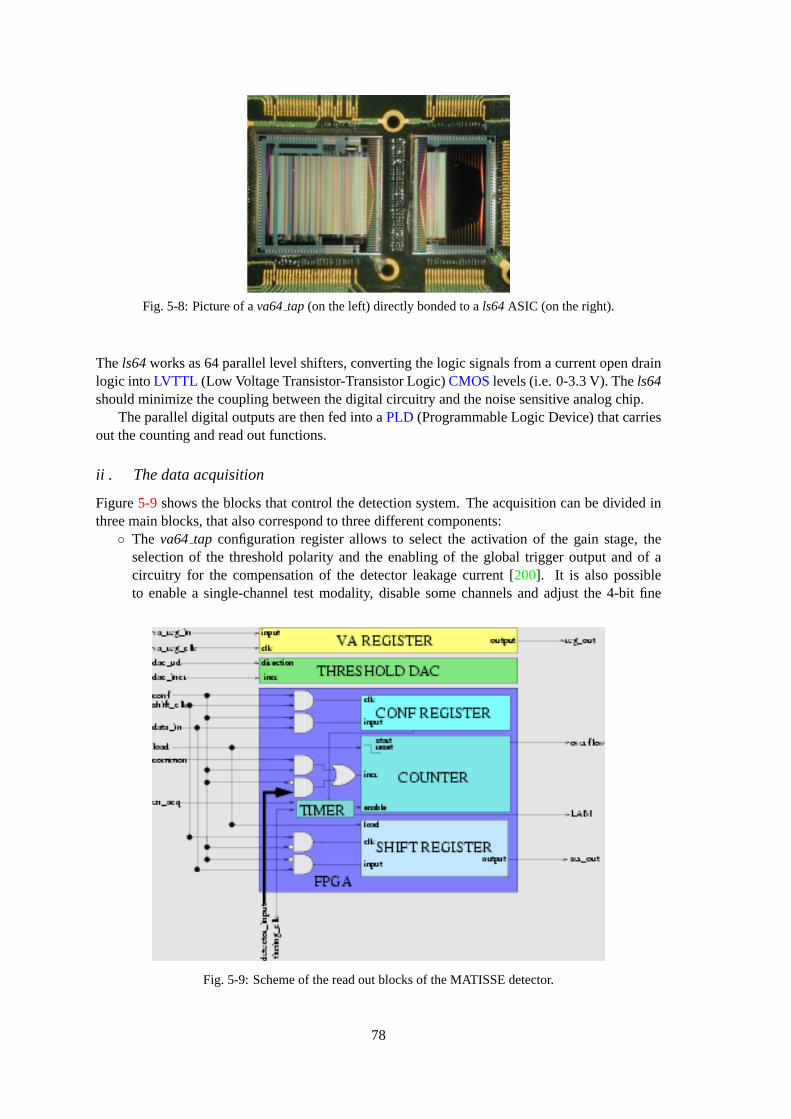


![Argomentare & Dimostrare - math.unipa.itmath.unipa.it/~fbenanti/CrittografiaRM20180306.pdf · • Il canto, l'uso di strumenti musicali [. . . ] ... Sia presso gli Assiri che i Babilonesi,](https://static.documents.pub/doc/80x56/5c69406809d3f27c028cd105/argomentare-dimostrare-mathunipa-fbenanticrittografiarm20180306pdf-.jpg)


