I ! Marine Chemistry, 24 (1988) 239-252 Elsevier Science Publishers B.V., Amsterdam - Printed in The Netherlands 239 A High Sensitivity Method for the Determination of Nanomolar Concentrations of Nitrate and Nitrite in Seawater with a Technicon AutoAnalyzer II - C. OUDOT and Y. MONTEL Centre Orstom, B.P. 1386, Dakar (Senegal) (Received March 15,1988) ABSTRACT Oudot, C. and Montel, Y., 1988. A high sensitivity method for the determination of nanomolar concentrations of nitrate and nitrite in seawater with a Technicon AutoAnalyzer II. Mar. Chem., 2 4 239-252. A high sensitivity manifold for the determination of trace quantities (nanomolar concentra- tions) of nitrate+nitrite and nitrite alone is described. The method uses a classical Technicon AutoAnalyzer II usually employed for shipboard analysis. A reproducibility of & 1 nmol dm-3 for nitrate plus nitrite and nitrite alone was obtained, with an analytical rate of 40 samples h-l. INTRODUCTION Nitrate, the most abundant form of inorganic nitrogen, is frequently consid- ered as the limiting factor in the primary productivity of phytoplankton in the oceans, since this form of nitrogen is usually present in concentrations below the detection limit of classical analytical techniques. Nevertheless, Garside (1985) has recently shown that in a well-known oligotrophictropical area (the Sargasso Sea) it is possible to observe a vertical gradient of nitrate concentra- tions in the surface mixed layer, generally considered to be exhausted of ni- trate. For this he used a high precision chemiluminescencetechnique ( ? 2 nmol ~lm-~) (Garside, 1982) since he considered the colorimetric technique not sen- sitive enough (detection limit t- 50 nmol d~n-~). Using a commercial Technicon AutoAnalyzer II we succeeded in lowering the determination limit of nitrate and nitrite in seawater to a level comparable to that obtained using Garside’s technique, while still preserving a high ana- lytical rate. This paper describes modifications to the classical autbmated methods of 0304-4203/88/$03.50 O 1988 Elsevier Science Publishers B.V. ORSTOM Fonds Documentaire
Transcript
I
!
Marine Chemistry, 24 (1988) 239-252 Elsevier Science Publishers B.V., Amsterdam - Printed in The Netherlands
239
A High Sensitivity Method for the Determination of Nanomolar Concentrations of Nitrate and Nitrite in Seawater with a Technicon AutoAnalyzer II
- C. OUDOT and Y. MONTEL Centre Orstom, B.P. 1386, Dakar (Senegal) (Received March 15,1988)
ABSTRACT
Oudot, C. and Montel, Y., 1988. A high sensitivity method for the determination of nanomolar concentrations of nitrate and nitrite in seawater with a Technicon AutoAnalyzer II. Mar. Chem., 2 4 239-252.
A high sensitivity manifold for the determination of trace quantities (nanomolar concentra- tions) of nitrate+nitrite and nitrite alone is described. The method uses a classical Technicon AutoAnalyzer II usually employed for shipboard analysis. A reproducibility of & 1 nmol dm-3 for nitrate plus nitrite and nitrite alone was obtained, with an analytical rate of 40 samples h-l.
INTRODUCTION
Nitrate, the most abundant form of inorganic nitrogen, is frequently consid- ered as the limiting factor in the primary productivity of phytoplankton in the oceans, since this form of nitrogen is usually present in concentrations below the detection limit of classical analytical techniques. Nevertheless, Garside (1985) has recently shown that in a well-known oligotrophic tropical area (the Sargasso Sea) it is possible to observe a vertical gradient of nitrate concentra- tions in the surface mixed layer, generally considered to be exhausted of ni- trate. For this he used a high precision chemiluminescence technique ( ? 2 nmol ~ l m - ~ ) (Garside, 1982) since he considered the colorimetric technique not sen- sitive enough (detection limit t- 50 nmol d ~ n - ~ ) .
Using a commercial Technicon AutoAnalyzer II we succeeded in lowering the determination limit of nitrate and nitrite in seawater to a level comparable to that obtained using Garside’s technique, while still preserving a high ana- lytical rate.
This paper describes modifications to the classical autbmated methods of
0304-4203/88/$03.50 O 1988 Elsevier Science Publishers B.V.
ORSTOM Fonds Documentaire
amplifying the output signal of the colorimeter.
OUTLINE OF THE METHODS 1
It should be recalled that nitrate in seawater may be reduced to nitrite by
Nitrate (+ nitrite) The analytical circuit for the automatic determination of nitrate ( +nitrite)
is shown in Fig. 1. This manifold consists of two parts. In the first part the sample stream is mixed with ammonium chloride solution and passed through the reduction column. The second part, from the column outlet, is the same as the manifold for the determination of nitrite (Fig. 2).
The first part of the nitrate manifold involves two configurations of the junc- tion of the tubes for the pumping of the sample and the complexant (ammo- nium chloride). The first configuration (I) is used when low levels of nitrate (range 0-5000 nmol dmF3) are to be determined and has the highest analytical sensitivity. The second configuration (II) is used for the determination of high levels of nitrate (up to 35 pmol dm-3) but with a lower precision. '
241
Waste
F!OW (m1:min-l)
Air 0.42
I Sample 2.50
- II D I W
' . " I . .
f . t Debubbler I 1.00 I
. ,
I
I /
I
I I -. II Somple I I
~ Waste
Fig. 1. Schematic diagram of the manifold for determination of nitrate+nitrite: (I) configuration for low analytical range (up to 5000 nmol dm-3); (II) configuration for high analytical range (up ,
to 35 pmol dmb3). DIW, deionized water; SA, sulphanilamide; NED, N-l- naphthylethylenediamine.
I . . . . . .
I Debubbler
I -I I A i r 0.42 r
Colori- 10 meter turns loturns 45 turns
Filter 550nni
Flowcell 0.10 50mm
2.00
I A S A
N E D
+' I E?+ - - - I-
I
Fig. 2. Schematic diagram of the manifold for determination of nitrite. Abbreviations are as in Fig. 1. . . .
242
. . . . . . . .
We can already note a difference with the classical manifolds: the pumping rates of sample and reagents. In configuration I the sample is diluted with reagent solutions in the ratio 2.60/2.50 in the first part of the manifold and 2.17/2.02 in the second part (after the column), i.e. a final ratio of 1.117. In the most sensitive procedure range (100-7000 nmol dm-3) of Strickland and Parsons (1972) this ratio was 3.14/2.50= 1.256, and in the manifold of Hansen and Grasshoff (1983) the dilution ratio was 3.867. The lower dilution of the sample in our method leads to a higher absorbance of the solution measured in the colorimeter.
Nitrite Nitrite could be determined using the nitrate manifold by simply bypassing
the reduction column. Nevertheless, we believe that it is preferable to use two separate manifolds (the one for nitrate+nitrite, the other for nitrite alone) in order to perform the two determinations simultaneously on the same sample. The schematic layout of the manifold for nitrite is illustrated in Fig. 2. The dilution ratio of the sample is lower than that for nitrate at 1.075, and the sensitivity of the nitrite determination should be slightly higher than that for nitrate.
Reduction column . . :< ' -
The copperized cadmium granules used as the reduction column filling were prepared exactly as described by Wood et al. (1967). When the column (PVC Technicon tube i.d. 0.254 cm, length 30.5 cm had been filled and the granules well compacted, a small plug of absorbent glass wool was added at each end of the column. When not in use, the column was kept closed by sealing each end with a plastic nipple.
Before use, a new column was activated by passing a nitrate solution (30 pmol dmW3) through the column for 30 min in order to achieve maximum reduction.
REAGENTS
The concentrations of the reagents were changed in comparison with clas- sical automated methods in order to take the modification of the flow rates into account.
- -
Ammonium chloride solutions
Two different ammonium chloride solutions were used according to the cho- sen configuration (I or II) in order to keep the same ammonium chloride con- centration in the stream passing through the reductor. As in the procedure of
Strickland and Parsons (1972), no ammonia was added to adjust the ammo- nium chloride solutions to pH 8.5.
(1) Configuration I (low analytical range, 0-5000 nmol dm-3) 200 g am- monium chloride were dissolved in 1 dm3 deionized water.
(2) Configuration II (high analytical range, 0-35 pmol dm-3) 10 g ammo- nium chloride were dissolved in 1 dm3 deionized water.
Sulphanilamide (SA)
,
!
10 g sulphanilamide and 100 cm3 concentrated hydrochloric acid were dis- solved and made up to 500 cm3 with deionized water.
N-1 -naphthylethylenediamine dihydrochloride (NED) I
, I
1 g NED was dissolved in 250 cm3 deionized water. Five drops of BRIJ 35 .
(surfactant supplied by Technicon) were then added to the solution.
PROCEDURES
,'. . Before and after each series of analyses the analytical circuit was rinsed by I . .
pumping dilute hydrochloric acid solution (10% v/v) through the sample tube for 10 min.
In order to limit the risk of contamination arising from sample transfer, the needle of the automatic sampler extracted seawater from the subsampling bot- tles directly without using the usual plastic sample cups. Measurements were made in duplicate and the operator changed the samples manually every other cycle of sampling-rinsing. The subsampling bottles, 100-ml glass flasks, in , which the seawater was withdrawn from the Niskin PVC bottles, were rinsed I
with dilute hydrochloric acid solution and deionized water before use. In order to attenuate chemical hydraulic and proportioning pump noise, the
colorimeter was operated in the Damp 1 mode. The full capabilities of the range expander of the colorimeter were used by adjusting the standard calibration control. The usual range expander settings are 9.8, 9.0, 6.0, 3.0 and 0.5. The standard calibration control permits the setting of full scale recorder sensitiv- ity from 0.05 absorbance units at a dial setting of 10 to 2.00 absorbance units at a dial setting of 0.0. The 10 setting is difficult to use ã€Seä bëcauge*l%idF'T - -' -..-
ground noise problems; we chose a setting of 9.8 for the highest sensitivity (nitrate range 0-330 nmol dm-3; nitrite range 0-300 nmol dm-3). When the output signal of the colorimeter exceeded the full scale of the recorder, the standard calibration control was adjusted to a lower position. The attenuation ratio of the output signal (height of the peak on the recorder) when the range I
expander setting was modified from 9.8 to a lower value, was calibrated at regular intervals. The standardization curves (Figs. 3 and 4) were constructed
taking the attenuation ratio into account. The pen of the chart recorder was adjusted to zero with the baseline control
244
50 100 150 200 250 I t I I
(a) n m ~ l . d m - ~ NO3
t2000
I (b) n m o l . d r r ~ - ~ NO3
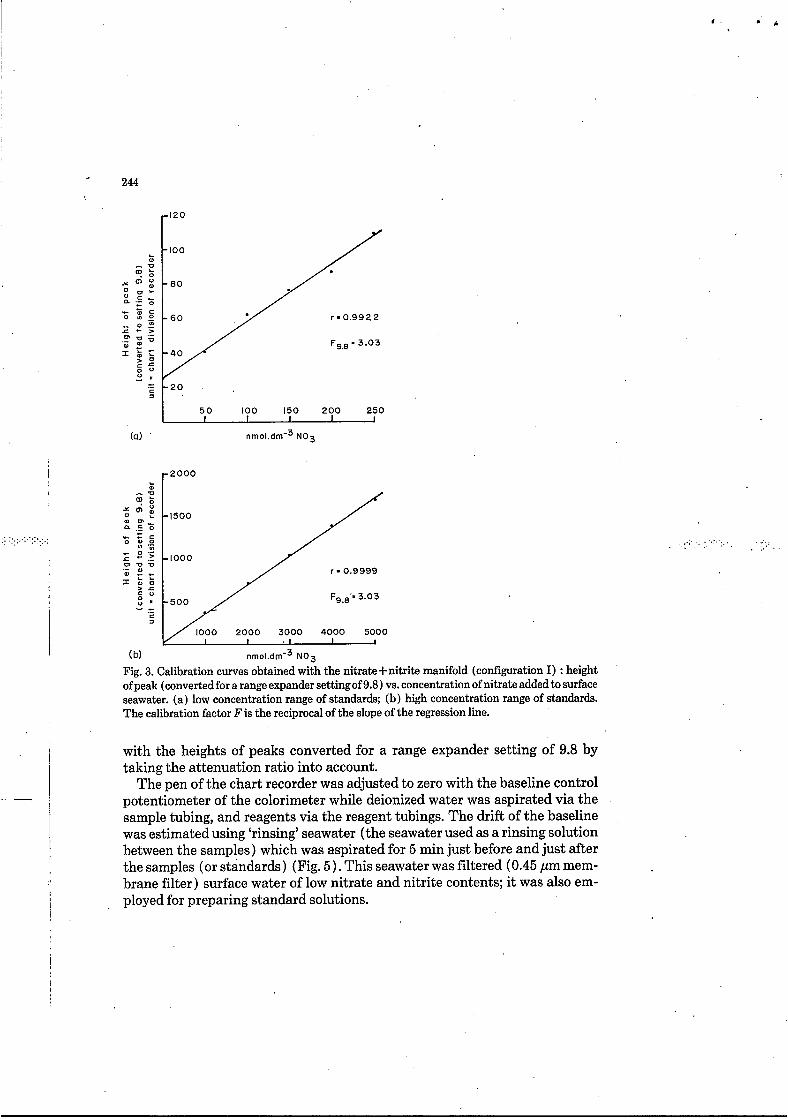
Fig. 3. Calibration curves obtained with the nitrate+nitrite manifold (configuration I) : height ofpeak (converted for a range expander setting of 9.8) vs. concentration of nitrate added to surface seawater. (a) low concentration range of standards; (b) high concentration range of standards. The calibration factor F is the reciprocal of the slope of the regression line.
Fig. 4. Calibration curves obtained with the nitrite manifold : height of peak (converted for a range expander setting of 9.8) vs. concentrations of nitrite added to surface seawater. (a) low concentration range of standards; (b) high concentration range of standards. The calibration factor F is the reciprocal of the slope of the regression line.
According to the expected nitrate concentrations either configuration I or configuration II was chosen; conversion from one to the other was easy by changing the connections of three pumping tubes (Fig. 1: sample/ NH4C1- NH4C1/DIW-DIW/sample ) .
t .
Calibration
Figure 3 shows two calibration curves for nitrate using the high sensitivity manifold (configuration I). The diagrams represent the heights of the peaks (converted to a range expander setting of 9.8) versus concentrations of nitrate added to surface seawater. To run the low range of the standard concentrations (Fig. 3a) the standard calibration control was adjusted to a setting of 9.8 then
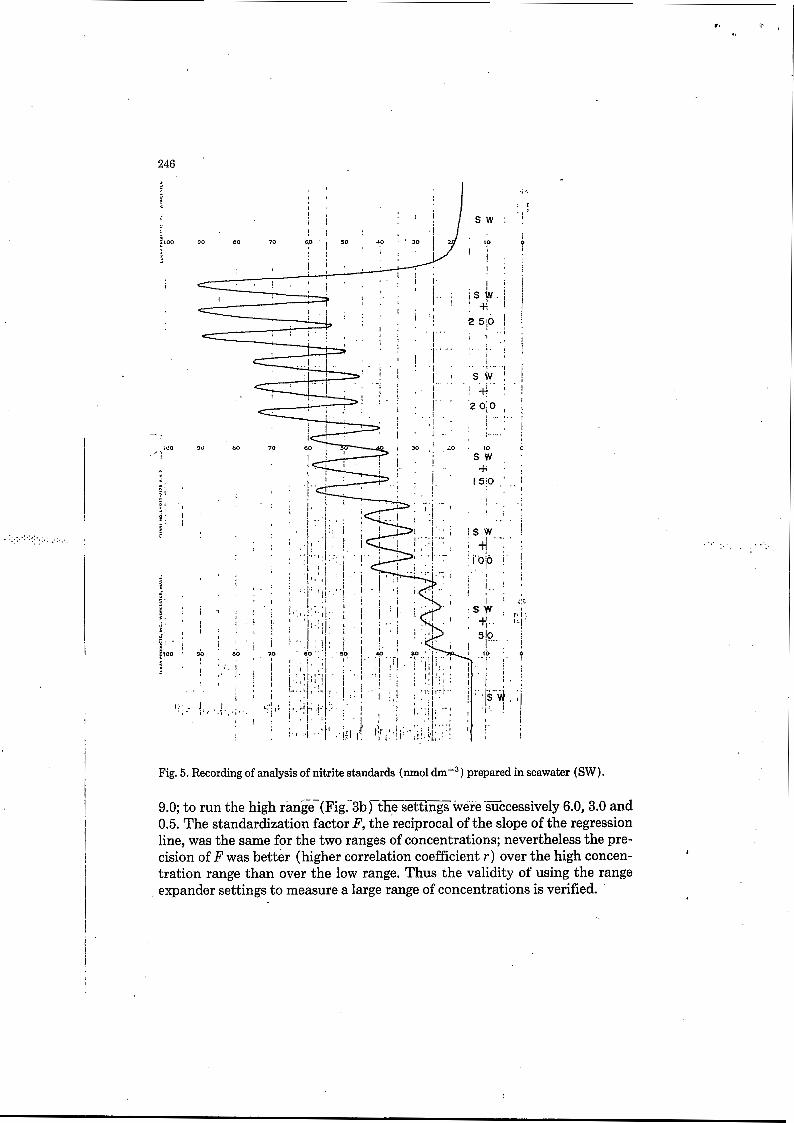
Fig. 5. Recording of analysis of nitrite standards (nmol dm-3) prepared in seawater (SW).
9.0; to run the high rangë(Fig.-3bYthe settings were successively 6.0,3.0 and 0.5. The standardization factor F, the reciprocal of the slope of the regression line, was the same for the two ranges of concentrations; nevertheless the pre- cision of F was better (higher correlation coefficient r ) over the high concen- tration range than over the low range. Thus the validity of using the range expander settings to measure a large range of concentrations is verified.
Figure 4 shows the standardization curves for nitrite. The low range of stan- dards (0-250 nmol dm-3; Fig. 4a) was performed with a range expander setting of 9.8'and the high range (0-2500 nmol dm-3; Fig. 4b) with settings of 9.0,6.0 and 3.0. Here again, factor F was unchanged whatever the range expander setting. The value of F would be expected to be lower for nitrite than for nitrate considering the lower dilution ratio of the sample with reagents, as previously
Fig. 7. Recording showing part of the reproducibility of analysis experiment (run three times) for twelve replicate samples of surface seawater spiked with 100 nmol dmF3 nitrite (see Table 2). Note the low drift of the baseline, 2 chart divisions (range expander setting of 9.8) after 60 min of running.
I
. . . . .
i
249
Calculation and precision
Two corrections were applied to the peak heights before converting them into concentrations through multiplication by the standardization factor F. The first correction was necessary because of the drift of the baseline. As pre- viously mentioned, this was estimated using ‘rinsing’ seawater which was as- pirated before the first sample and after the last. For each intermediate sample a linear interpolation was made. The drift of the baseline was generalIy small: 2-3 chart divisions (range expander setting 9.8) after 60 min running time (Figs. 5-7 ) .
The second correction was for the salt effect. This effect, well-known in connection with flowcells in Technicon colorimeters, (Froelich and Pilson, 1978), was estimated as the difference between the absorbance of the rinsing seawater and that of deionized water without aspirating reagents. The pen of the chart recorder was adjusted to zero with the baseline control potentiometer while deionized water was aspirated via the sample tubing and the reagents tubings (Fig. 6). After that, ‘rinsing’ seawater was aspirated via the sample tubing. The shift of the signal on the recorder was interpreted as the salt effect. The salt effect was higher for nitrite than for nitrate; it was estimated to be 15 units (50 nmol dmw3) for nitrite (Fig. 6 ) and 9 units (27 nmol dm-3) for
TABLE 1
Precision using the nitrate manifold
Sample Peak height” Mean heightb Standard deviation
aHeight of peak (range expander setting 9.8) obtained from analysis of twelve replicate samples of surface seawater spiked with 100 nmol dmb3 NO,; units are divisions of the chart recorder. bCorrected for baseline drift. ‘With F=3.03 (see Fig. 1) .
250
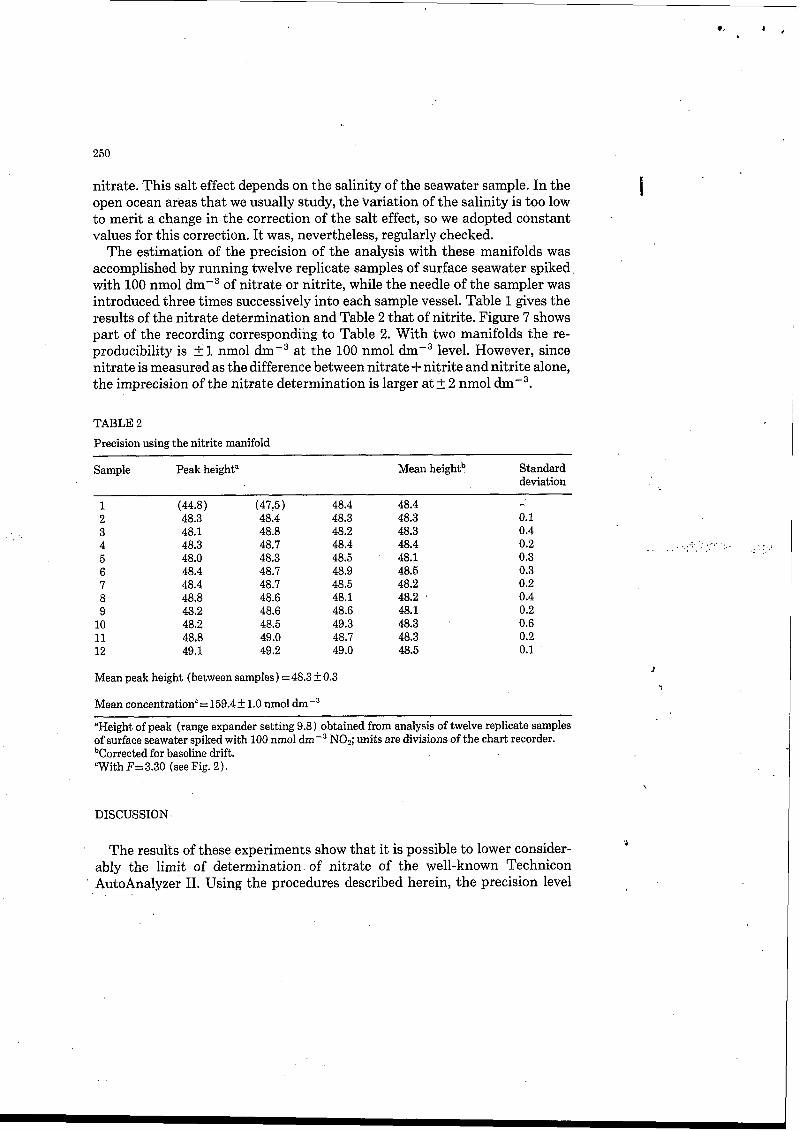
nitrate. This salt effect depends on the salinity of the seawater sample. In the open ocean areas that we usually study, the Variation of the salinity is too low to merit a change in the correction of the salt effect, so we adopted constant values for this correction. It was, nevertheless, regularly checked.
The estimation of the precision of the analysis with these manifolds was accomplished by running twelve replicate samples of surface seawater spiked with 100 nmol dmW3 of nitrate or nitrite, while the needle of the sampler was introduced three times successively into each sample vessel. Table 1 gives the results of the nitrate determination and Table 2 that of nitrite. Figure 7 shows part of the recording corresponding to Table 2. With two manifolds the re- producibility is 21 nmol dm-3 at the 100 nmol level. However, since nitrate is measured as the difference between nitrate + nitrite and nitrite alone, the imprecision of the nitrate determination is larger at? 2 nmol dmW3.
TABLE 2
Precision using the nitrite manifold ~~
Sample Peak height" Mean heightb Standard deviation I . .
"Height of peak (range expander setting 9.8) obtained from analysis of twelve replicate samples of surface seawater spiked with 100 nmol bCorrected for baseline drift. "With F= 3.30 (see Fig. 2).
NO,; units are divisions of the chart recorder.
DISCUSSION
The results of these experiments show that it is possible to lower consider- ably the limit of determination. of nitrate of the well-known Technicon
' AutoAnalyzer II. Using the procedures described herein, the precision level
. * . . . I .' .:. . .... . ., '. .,
_ . . * . .~ . . . . I . , . ~
J
251
obtained is comparable to that achieved with more sophisticated equipment. The background noise level and the baseline drift are acceptable in spite of the very large amplification of the output signal from the colorimeter. Continuous sampling of deionized water or ‘rinsing’ seawater causes an instability of the output signal of? 0.5 chart division, i.e. ? 2 nmol dm-3 (Figs. 5-7). The use of natural seawater as rinsing solution between samples removes the heteroge- neous mixing effects due to density differences between the samples and dis- tilled water. Using the high sensitivity manifold for nitrate determination a large dynamic range (three orders of magnitude; 5-5000 nmol dm-3) is pos- sible and, moreover, it isvery easy to extend the range to higher concentrations (up to 35 pmol dm-3) by simply disconnecting certain pumping tubes. An- other advantage of our method lies in its allowing a high analytical rate (40
The main difficulty in improving the precision of this method of analysis of nitrate and nitrite in seawater is not increasing the sensitivity or decreasing the determination limit of the method, but rather it is a problem of water con- tamination at the time of transfer: sampling with Niskin sampler, subsampling with glass bottle and filling the polystyrene sample cup on the rotating plate of the Technicon sampler. Therefore, we decided not to use the small sample cups but to insert the needle of the sampler directly into the subsampling ves- sel. Although the automated analysis only requires a small volume of water (a few ml) we chose to subsample 100 cm3 of seawater into glass bottles, since the risks of contamination decrease as the volume of the vessel increases. The glass bottles were filled with dilute HCl solution between the samplings, then rinsed with deionized water immediately before each use. Thus the reproducibility of the measurements was improved to a value of? 1 nmol dm-3.
It would, however, not be enough to display a high resolution between the very low concentrations of nitrate and nitrite. It is also necessary to know the accuracy of the determinations. This is probably the most difficult feature to evaluate. Accurate measurement of the nitrate or nitrite concentrations de- pends firstly upon the quality of the distilled or deionized water chosen to adjust the zero level of concentration. There is a major advantage in employing water of the highest purity, as is usually recommended for every analytical technique. Two other factors can be of importance for the accuracy: the pres- ence of particles and the influence of the salt effect. If the interference of the
‘rinsing’ seawater, the salt effect is an inherent defect in colorimeter measure- ments with the Technicon AutoAnalyzer II. Froelich and Pilson (1978) showed that the systematic absorbance error with a Technicon colorimeter, due to the refraction processes on the inlet and outlet walls of the cuvette, is proportional to the salinity of a seawater sample. Fortunately, the salinity of OUI! seawater samples did not vary very much (34.5 < S < 36.5) and the influence of the salt effect can be considered constant. Nevertheless, attention should be paid to
samples h-l). - 1
.. . I
3
I
- - particles can be removed by filtering the seawater samples as we did for the _- - -
252
the determination of this error which is not negligible (27 nmol dm-3 for ni- trate and 50 nmol dm-3 for nitrite). The only solution to suppress the refrac- tion processes would be to use a special cuvette with flat and parallel walls.
REFERENCES
Bendschneider, K. and Robinson, R.J., 1952. A new spectrophotometric method for the deter-
Froelich, P.N. and Pilson, M.E.Q., 1978. Systematic absorbance errors with Technicon Autoan-
Garside, G., 1982. A chemiluminescent technique for the determination of nanomolar concentra-
Garside,G. 1985. The vertical distribution of nitrad in open ocean surface water. Deep-sea Res.,
Hansen, H. P. and Grasshoff, K., 1983. Procedures for the automated determination of seawater constituents. In: K. Grasshoff, M. Ehrhardt and K. Kremling (Editors), Methods of Seawater Analysis. 2nd Edn., pp. 362-379.
Strickland, J.D.H. and Parsons, T.R., 1972. A Practical Handbook of Seawater Analysis. Bull. Fish. Res. Board. Can., No. 167.2ndEdn., pp. 127-130.
Wood. E.D., Armstrong, F.A.J. and Richards, F.A., 1967. Determination of nitrate in seawater by cadmium copper reduction to nitrite. J. Mar. Biol. Assoc. UK, 47: 23-31.
mination of nitrite in seawater. J. Mar. Res., 11: 87-96.
alyzer II colorimeters. Water Res., 12: 599-603.
tions of nitrate and nitrite in seawater. Mar. Chem., 11: 159-167.