48
No. 117 JULY 2014 “ ... A higher saving rate will generate more investment per unit of output...”

No. 117 JULY 2014
“ ... A higher saving rate will generate more investment per unit of output...”

Designed & Printed by: www.masterprintingpressplc.com/+251 11 629 88 00

u›=ƒÄåÁ ¨<eØ uY^ Là ÁK< ¾v”¡“ SÉ” }sTƒBANK AND INSURANCE INSTITUTIONS OPERATING IN ETHIOPIA
T°ŸL© v”¡ ¾›=ƒÄåÁ wN?^© v”¡ eM¡ lØር 7 ó¡eCenter Bank National Bank of Ethiopia Telephone 11-5-517430 Fax 011-5-514588
No Name of Banks 7
1¾›=ƒÄåÁ ”ÓÉ v”¡Commercial Bank of Ethiopia 011 551 12 71 011 551 45 22
2 የኢትዮጵያ ልማት ባንክDevelpment Bank of Ethiopia
011 551 31 20 011 551 16 06
3¢”eƒ^¡i”“ u=´’e v”¡Construction & Business Bank S.C 011 551 81 71 011 551 51 03
4 ›ªi ›=”}`“i“M v”¡ ›.TAwash International Bank S.C 011 557 00 65 011 662 77 65
5 Çi” v”¡ ›.TDashen Bank S.C 011 465 41 27 011 465 30 37
6 ›u=c=’>Á v”¡Bank of Abyssina S.C 011 553 06 63 011 551 04 09
7 ¨ÒÑ” v”¡ ›.TWegagen Bank S.C 011 552 35 26 011 552 35 20
8 Qw[ƒ v”¡ ›.TUnited Bank S.C 011 465 52 84 011 465 52 43
9 ”w ›=”}`“i“M v”¡ ›.TNib Intenational S.C 011 550 33 04 011 550 43 49
10 ¾*aT>Á Qw[ƒ e^ v”¡ ›.TCooperative Bank of Oromia S.C 011 550 60 25 011 515 04 89
11 ›”vd ›=”}`“i“M v”¡ ›.TLion Iinternational Bank S.C 011 662 71 11 011 662 59 99
12 ²S” v”¡ ›.TZemen Bank S.C 011 554 00 57 -
13 *aT>Á ›=”}`“i“M v”¡ ›.TOromia International Bank S.C 011 557 20 01 011 156 15 85
14 w`H” ›=”}`“i“M v”¡ ›.TBerhan Intenational Bank S.C 011 663 01 25 -
15 u<“ ›=”}`“i“M v”¡ ›.TBunna International Bank S.C 011 158 08 31 011 515 83 14
16 ›và v”¡ ›.TAbay Bank S.C 011 515 89 23 011 552 88 52
17 ›Ç=e ›=”}`“i“M v”¡ ›.TAddis International Bank S.C 011 554 97 74 -
18. ደቡብ ግሎባል ባንክDebub Global Bank
011 850 12 07/8 -
19 እናት ባንክEnat Bank
011 515 74 75 -
የኢንሹራንስ ኩባንያዎች ስም ዝርዝርና አድራሻ Insurance Companies Name & Address
No Name of Institutions 7
1 የኢትዮጵያ መድን ድርጅትEthiopian Insurance Corporation
011 551 24 00 011 551 74 99
2 ብሔራዊ የኢትዮጵያ ኢንሹራንስ ኩባንያ አ.ማNational Insurance Company of Ethiopia S.C.
011 466 11 29 011 465 06 60
3 አዋሽ ኢንሹራንስ ኩባንያ አ.ማ.Awash Insurance Compay S.C.
011 557 02 09011 557 02 05 011 557 02 08
4 ሕብረት ኢንሹራንስ ኩባንያ አ.ማ.United Insurance Company S.C.
011 465 56 56 011 465 32 58011 467 19 34
5 አፍሪካ ኢንሹራንስ ኩባንያ አ.ማAfrica Insurance Company S.C.
011 663 77 16/19011 662 45 79 011 663 82 53
6 ናይል ኢንሹራንስ ኩባንያ አ.ማ.Nile Insurance Company S.C.
011 442 60 00011 442 57 54 011 442 60 08
7 ኒያላ ኢንሹራንስ አ.ማ.Nyala Insurance S.C.
011 662 66 67/69011 662 67 07 011 662 67 06
8 ግሎባል ኢንሹራንስ አ.ማ.Global Insurance Company S.C.
011 156 74 00011 156 04 83 011 156 62 00
9 ንብ ኢንሹራንስ ኩባንያ አ.ማ.Nib Insurance Company S.C.
011 553 51 29/32011 552 81 94/96 011 552 81 93
10 አንበሳ ኢንሹራንስ ኩባንያ አ.ማ.Lion Insurance Company S.C.
011 618 70 00011 663 29 36/47 011 663 29 40
11 ኢትዮ ላይፍ ኤንድ ጀነራል ኢንሹራንስ አ.ማ.Ethio Life and General Insurance S.C.
011 554 96 50/52 011 554 96 53
12 ኦሮሚያ ኢንሹራንስ ኩባንያ አ.ማ.Oromia Insurance Company S.C.
011 550 31 38011 554 51 31011 895 95 80
011 550 31 92
13 አባይ ኢንሹራንስ አ.ማ.Abay Insurance S.C.
011 553 53 00011 553 55 50 011 515 76 90
14 ብርሃን ኢንሹራንስ አ.ማ.Berhan Insurance S.C.
011 467 44 31011 467 44 23 -
15 ፀሐይ ኢንሹራንስ አ.ማTsehay Insurance S.C.
011 1-119827 -
16 ሉሲ ኢንሹራንስ አ.ማ.Lucy Insurance S.C.
0911-2146750910-501036 -
17 ቡና ኢንሹራንስ አ.ማ.Bunna Insurance S.C.
011 157 60 54011 111 96 35

1
BIRRITU No. 117
Birritu No.117
Birritu is a quartertymagazine published by
The National Bank of Ethiopia.It presents in-depth articles, researches
and news on banking, insurance µfinance.
Address:Birritu Editorial OfficeTel. +251 115 17 51 07 +251 115 53 00 40
P.O.Box 5550Addis Ababa,Ethiopia
Editorial Board Chairman:Gebreyesus Gunte
Members:Alemayehu Kebede
Solomon DestaTemesgen ZelekeFikru GezahegnAbel Solomon
Elias Salah
Editor-in-ChiefElias Salah
Secretarial & DistributionService:
Tsegereda Gebreyohannes
ብሪቱBIRRITU
2
ብሪቱ ቁ.117
ማውጫ (Table of Contents)ገጽ(Pages)
1. የአዘጋጆች ማስታወሻ (Note from Editors) .......................................................................... 3
2. ዜና እና መረጃ (News and Information) ........................................................................... 4
3. ጥናታዊ ጽሑፎች (Research Articles) ................................................................................. 6
3.1 Saving-Growth Nexus in Ethiopia ....................................................................... 6
3.2 Structural competition of Banking in Ethiopia ............................................... 18
4. አስተማሪና መረጃ ሰጪ ጽሑፎች (Educational & Informative Articles) ........................ 32
4.1 Enhancing Financial Inclusion through Implementation of
Sustainable Financial Education and consumer Protection Program ........... 32
4.2 ሥርዓተ ፆታ በኢትዮጵያ ብሔራዊ ባንክ .......................................................................... 39
5. ልዩ ልዩ (Miscellany section) ............................................................................................. 42
5.1 Brief Synopsis of Joseph E. Stiglitz ......................................................................42
5.2 Poem .............................................................................................................................. 44
OPPINIONS EXPRESSED IN ARTICLES DO NOT NECESSARILY REFLECT
THE POLICIES AND STANDS OF THE NATIONAL BANK OF ETHIOPIA
for resources, please visit the NBE’s official website: www.nbe.gov.et

3
BIRRITU No. 117
Editors’ Note Our esteemed readers, we are content to meet you again with 117 issue of Birritu. The Editorial team as usual attempted to sort out and come up with relevant and timely topics.
In the News column there are two news about recently issued new Directives by NBE and report by IMF on Ethiopian Economy. The two topics selected for the research are Saving-Growth Nexus in Ethiopia and Structural Competition of Banking.
The Educational and informative Articles section contains article about Financial literacy and Interview with Women affairs’ officer of NBE.
Finally, on the Miscellany Section we have presented the Brief Synopsis of Joseph E. Stiglitz and a poem for Entertainment.
Don’t forget the value of your feedbacks and comments that would contribute for enriching the coming issue of Birritu. So, keep forwarding your comments and suggestions.
Birritu Editorial OfficeTel. +251 115 17 51 07 +251 115 53 00 40P.O.Box 5550Addis Ababa,Ethiopia

4
ብሪቱ ቁ.117
NBE Issues Two New Directives
The National Bank of Ethiopia (NBE) recently issued two Directives; Reinsurance Company Establishment and Fixation of Daily Foreign Exchange Cash Notes and Transaction Rate.
As stated in the preamble of Reinsurance Company Establishment Directives No.SRB/1/2014,the establishment of national reinsurance companies promotes financial resource mobilization and reduces costs related to cross border reinsurance transactions; enhance underwriting
capacity and solvency of direct insures by providing technical support and cover against accumulated and catastrophic losses; simplifies treaty negotiations, settlement of claims and payment of ceded premium in domestic currency within the shortest possible time.
The Directive further states that the Company shall be established as a share company stipulated in the commercial code of Ethiopia and shall be run as non-life and life reinsurer. Moreover, it shall be wholly owned by Ethiopia nationals and/or organizations wholly owned by Ethiopian nationals, the Directive added.
The Directive also noted that the minimum paid up capital required to obtain license for a reinsurance company shall be birr 500 million (five hundred million Birr), which shall be fully paid up in cash and deposited in blocked bank account (s) in the name of the reinsures under formation.
The Directive gives due attention to knowledge, experience and age matters concerning Board of Directors, Chief Executive Officers and Senior Executive Officers. Furthermore, integrity, financial soundness, assessment of fitness and propriety tests is also given a paramount importance.
It was learnt that the Directive entered in to force as of the 1st day of May 2014.
In similar development, the Bank issued (Directive No. FXD /44/2014) on fixation of the daily foreign exchange notes and transaction rate.
As indicated in the preamble, there is a need to amend NBE Directives issued with regards to fixation of daily foreign exchange buying and selling rates to create a clear computation among banks.
The Directives issued were Pursuant to Article 27(2) of the National Bank of Ethiopia Establishment (as amended) proclamation No, 591/2008.
The amended Directive entered into force as of February 26, 2014.
News

5
BIRRITU No. 117
‹‹ The Ethiopian Economy Continues to Experience Robust Growth and Single-Digit Inflation ›› IMF
An International Monetary Fund (IMF) mission led by S. Kal Wajid visited Addis Ababa June 11-25 to conduct discussions for the 2014 Article IV Consultation with Ethiopia.
At the conclusion of the mission, Mr. Wajid issued the following statement:“The Ethiopian economy continues to experience robust growth and single-digit inflation. The mission projects real GDP growth in the 8-8.5 percent range for 2013/14 and 2014/15. The expansion in economic activity has contributed to poverty reduction and progress toward achieving the Millennium Development Goals. Deterioration in the trade balance this year was partly offset by higher net inflows from services and transfers. Strong external loan and higher foreign direct investment, however, allowed for a modest increase in gross international reserves. Sizeable investment spending of public enterprises continues to absorb a large share of domestic financing and constrain credit available to the private sector.
“Going forward, the mission recommends continued cautious monetary policy stance that keeps money growth consistent with preserving the gains on inflation and achieving robust economic growth. The stable inflation conditions are ripe for developing market-based instruments of indirect monetary control. In this respect, there is a need to gradually raise nominal interest rates to activate the Treasury bill market for more flexible liquidity management. There is scope for improving the market functioning and price setting mechanism for the exchange rate. This may entail greater exchange rate flexibility not only to help to clear the foreign exchange market but also to promote the competiveness of the traded goods sector. The mission supports the National Bank of Ethiopia’s objective of gradually raising foreign exchange reserves to 3 months of imports.
“The mission stresses the importance of obtaining comprehensive financial information of major public enterprises for establishing an overall fiscal anchor. The consolidated fiscal position is required to assess the fiscal policy impact on macroeconomic developments and debt sustainability. The continued large borrowing of the public sector with large share from domestic banking system is crowding out the private sector. In this respect, to further support private sector development and employment creation, there is a need to reduce public sector borrowing by either prioritizing investment projects or attracting more external financing at appropriate terms.
“Ethiopia’s public sector led development strategy has delivered robust growth and rising living standards. To sustain these achievements, adapting policies to provide greater scope for the private sector will be important. In terms of the next Growth and Transformation Plan, consideration should be given to mitigating constraints to private sector development and improving export competiveness. Concerted efforts are needed for improving efficiency of trade logistics, increasing access to financial services, ensuring a competitive exchange rate, and providing a predictable regulatory environment for businesses. Harnessing the transformation power of private enterprises will be increasingly important as Ethiopia transition from agricultural to industrial based economic growth.
“The IMF Executive Board is expected to complete the 2014 Article IV consultation in September 2014.”
The mission met with Prime Minister Hailemariam Desalegn, Governor of the National Bank of Ethiopia Teklewold Atnafu, State Minister of Finance and Economic Development Abraham Tekeste, Economic Advisor to the Prime Minister Newai Gebre-ab, other senior officials, as well representatives of the private sector, the international community, and civil society.

6
ብሪቱ ቁ.117
Saving–Growth Nexus in EthiopiaAbstractThe study investigates causal relationship between savings and growth in Ethiopia by using annual data from 1975 to 2013. The co-integration and the granger causality techniques are used to analyze the causal relationship between savings and economic growth in Ethiopia. The co-integration test indicates saving and economy growth are co-integrated. In addition, the granger causality test indicates that unidirectional causality runs from economic growth to savings in the long run. Similar results also found in the short run.
Generally economic growth precedes saving. Thus, we reject the hypothesis that saving precedes economic growth, and accept the hypothesis that it is economic growth that leads to higher saving both in the short run and long run in Ethiopia. Finally the study recommends that growth should be enhanced to scale up saving. Although the paper found growth leads to saving, it doesn’t necessarily mean that saving doesn’t contribute anything to growth. In fact, growth theory suggests that saving plays crucial role in promoting economic growth. Therefore, the ongoing effort by the government to enhance saving should also be encouraged as one of the means that leads to the road to growth and development.
I. INTRODUCTIONThe test of the casual relationship between saving and economic growth is very important because it provides useful information on which economic variables that the government and policy makers need to control in order to attain the
Ibrahim Fereja
Asssistance Reserch Officer Domestic Economic Analysis and Publication Directorate
desired level of the targeted variable ( sajid and sarfraz,2008). The relationship between savings and economic growth is not only an important but also a controversial issue for both academicians and policy makers. Many internationally reputed economists have analyzed this phenomenon as cause and effect association. A group of economists favors capital fundamentalists’ point of view that savings cause growth but others are in favor of Keynesian theory that savings depend up on the level of output. It is obvious that the causal relationship between savings and economic growth has been examined by various researchers for various countries but the issue of the direction of causation between savings and economic growth remained unresolved.
Conversely, little attempt has been made to investigate the causal relationship between savings and economic growth in Ethiopia. Thus the major question that this study needs to answer is whether or not the view that savings promotes economic growth or growth promotes saving is valid for Ethiopia. The objective of the paper is to investigate causal relationship between different measure of savings and economic growth in Ethiopia. The paper expects to have a positive relationship between savings and economic growth. This positive relationship can be explained by one of
Research Articles
7
BIRRITU No. 117
the following hypotheses. First, growth in savings can stimulate economic growth through investment. Second, economic growth stimulates savings. The importance of investigation of the casual relationship in Ethiopia lies in the fact that it can be useful in isolating those variables which policy makers need to control in order to obtain the desired values of target variables such as economic growth.
This study is organized into five sections. The first being introduction, the literature is reviewed in the second section. The third section is about methodology. Empirical result is presented in the fourth section, and the fifth section conclusion and recommendation is delivered based on the findings obtained.
II. LITERATURE REVIEWOne of the most complex and empirically unsettled subjects in economics is the explanation of the process of economic growth. Scholars like Solow (1956) emphasized the importance of saving in economic growth. Following Solow, authors such as McKinnon (1973) and Shaw (1973) supported the view that saving plays a crucial role in economic development. This is true because rising saving increases the level of investment, thereby accelerating economic growth (Sinha and Sinha, 1998).The Solow-Swan (1956) model presents the case in which a rise in the saving rate affects the stock of capital and the level of per-capita income, but does not affect the rate of economic growth.
An increase in the saving rate increases per capita output and per capita capital stock in steady- state. A higher savings rate will generate more investment per unit of
output than it did before- which in turn will lead to an expansion of capital per worker. The process, however, comes to a halt since for a given growth rate of labor, an increasing proportion of investment will be devoted to maintaining this higher capital-labor ratio. The saving rate thus influences the level of per capita capital stock and thus per capita output towards which the economy gravitates in equilibrium, rather than the rate at which either magnitude changes. In sum, the Solow-Swan model says a change in the saving rate changes the economy’s balanced growth path and hence per capita output in steady state, but it does not affect the growth rate of output per worker on the balanced growth path. Only an exogenous technological change will result in a further increase in output per worker in steady state.
Contrary to Solow, Modigliani (1970) suggested that higher growth raises the life-time wealth of young (working) savers relative to retired (non-working) dissavers, thus raising the total savings of the economy. The increase in national savings in turn leads to higher investment and expansion of output. The life-cycle hypothesis model developed by Japelli & Pagano (1994) supports the notion of the direction of association running from growth to saving. The life-cycle saving model has income-earning households saving to finance consumption when they become old non-earning households. The theory assumes individuals live for three periods and this provides an incentive for intergenerational borrowing. Individuals borrow to finance current consumption when they are young and repay the loan and save for retirement in their middle age. They consume the assets accumulated in

8
ብሪቱ ቁ.117the second period of their life when they grow old. Thus, the volume of their savings depends on how much they earn during the middle age.
Empirically, the relationship between savings and economic growth is studied using correlation and dynamic models. However, many recent studies focused on the dynamic relationship of savings and economic growth using the concept of Granger causality. Lean and Song (2009) have examined the short-run and long-run relationship between savings and economic growth in China using Granger causality test via time series annual data. They found bi-directional causality between gross domestic savings and economic growth in the short-run. In the long-run, a unidirectional causality exists running from the gross domestic savings to economic growth. Bassam (2010) has examined the long – run relationship between real gross domestic product and real gross domestic saving for Morocco (1965-2007) and Tunisia (1961-2007). His results reveal that in Morocco, a long-run relationship
exists between the variables, while no evidence of long-run relationship exists in Tunisia. Aylit (2003) have also studied the relationship between private savings and economic growth in South Africa using the Granger causality method. He found that the private saving rate has a direct as well as an indirect effect on growth. The indirect effect is through the private investment rate. G.M.Sajid and M.Sarfraz (2008), the results of the vector error correction model suggest a long run bi-directional relationship between different measures of savings and level of output. However there is unidirectional long run causality from public savings to both measures of output, gross national product and gross domestic product and from private savings to gross national product only. Dawit (2005) has investigated the causal relationship between the real economic growth and the growth rate of real gross domestic savings in Ethiopia for the period 1960-2003 using annual time series data and Granger causality method. He found real gross domestic savings causes higher growth rate of real gross domestic product in Ethiopia.
III. METHODOLOGY
3.1. Model specification and estimation
The Granger Causality method regresses variable X on its own lagged values (Xt-i) and the lagged values of another variable Y (Yt-i). Thus, serial correlation in the pair of variables is eliminated, and all that remains is the correlation between them. If the coefficients of the lagged values of Y are significant, then Y Granger causes X. Similarly, to substantiate the reverse possibility, one regresses Y on its own
lagged values and lagged values of X. X Granger causes Y if the coefficients of the lagged values of X are significant. .
Co-integration procedure requires that a time series in the system to be non-stationary in their level. Similarly, it is imperative that all time series in the co-integrating equation have the same order of integration. To ascertain the long run

9
BIRRITU No. 117
relationship between savings and economic growth, we use vector autoregressive model which was developed by Johansen (1988) and further extended by Johansen and Jusiluis (1990).
Let Xt and Yt denote the natural logarithm of savings and output respectively. Then the nth order vector autoregressive can be written in matrix form in equation 1:
+
++
+
=
−
−
−
−
t
t
nt
ntnn
nn
t
t
t
t
YX
aaaa
YX
aaaa
CC
yX
2
1
2221
1211
1
1
221
211
121
111
2
1 ...εε
……………. (1)
Where, C1, C2 are constants t represents time aiii measures elasticity tε Error term, Testing for co-integration in the equation can be performed according to the Johansen (1988) approach. Johansen procedure of co-integration provides two statistics. These include the maximum eigenvalue and the trace of the stochastic matrix, where the testing is done sequentially so that the null of rank 0 is tested against the alternative of
rank 1.
Given the above equation let us test the direction of causation between savings and growth, we can rewrite (1) in a more explicit form, where the assumption of co-integration has been added:
[ ]
+
+
∆∆
++
∆∆
=
∆∆
−
−
−−
−−−−
−−
−
−
t
t
t
t
nt
ntnn
nn
t
t
t
t
YX
YX
YX
YX
2
1
1
121
2
1
1
1
221
211
121
111
1
1
221
211
121
111
...εε
ββαα
θθθθ
θθθθ
The null hypotheses of non-causality of x on y can be expressed as restrictions on the
parameter in the following way:
0,0... 21
21211 ==== − αθθ n
According to Masih and Masih1996, The two parts of the test have been labeled as the tests of ‘short-run’ and ‘long-run’ Granger causality in the literature. Long run should not be interpreted in a temporal sense here; deviation from equilibrium is of course
partially corrected between each period. If there is causality, then the short term deviations from the long-run equilibrium implied by the co-integrating relationship will feed back by the changes in order to re-establish the long-term equilibrium.
The study employed descriptive and econometric analysis by using Eviews software to test the causal relationship between savings and economic growth in Ethiopia. The descriptive approach
is analyzed using summary statistics and correlation matrices whereas the econometrics approach is analyzed using unit root, diagnostic, co-integration and causality test.
10
ብሪቱ ቁ.117
3.2. The dataDifferent measures of savings and growth are used. Economic growth is measured in terms of an increase in the size of nation’s economy. Abroad measure of an economy’s size is its output. The most widely used measure of economic output is the Gross domestic product. (GDP): defined as the market value of the goods and services produced by the country and the data is used from National Bank of Ethiopia data statistics. For saving, National savings (NS):-which is the sum of public and private
savings. Private savings (PTS):- consists of savings made by the household and business organization. Public savings (PS):- is the savings made by the government sector which is based on the budgetary condition of the government. Domestic savings (DS):- is obtained by subtracting net factor income from national savings. Regarding the source of data, the annual data on all measures of savings are taken from annual economic data statistics of the National Bank of Ethiopia.
IV. ANALYSIS OF EMPIRICAL RESULTS
4.1. Descriptive analysis
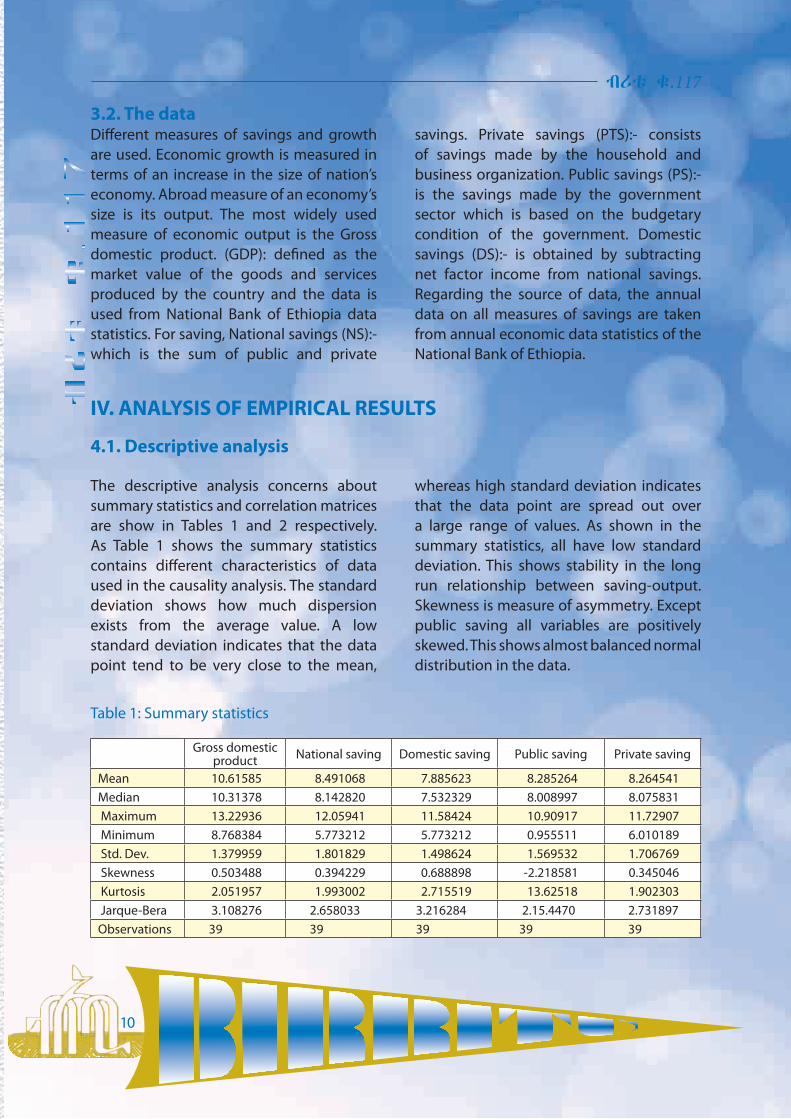
The descriptive analysis concerns about summary statistics and correlation matrices are show in Tables 1 and 2 respectively. As Table 1 shows the summary statistics contains different characteristics of data used in the causality analysis. The standard deviation shows how much dispersion exists from the average value. A low standard deviation indicates that the data point tend to be very close to the mean,
whereas high standard deviation indicates that the data point are spread out over a large range of values. As shown in the summary statistics, all have low standard deviation. This shows stability in the long run relationship between saving-output. Skewness is measure of asymmetry. Except public saving all variables are positively skewed. This shows almost balanced normal distribution in the data.
Table 1: Summary statistics
Gross domestic product National saving Domestic saving Public saving Private saving
Mean 10.61585 8.491068 7.885623 8.285264 8.264541Median 10.31378 8.142820 7.532329 8.008997 8.075831 Maximum 13.22936 12.05941 11.58424 10.90917 11.72907 Minimum 8.768384 5.773212 5.773212 0.955511 6.010189 Std. Dev. 1.379959 1.801829 1.498624 1.569532 1.706769 Skewness 0.503488 0.394229 0.688898 -2.218581 0.345046 Kurtosis 2.051957 1.993002 2.715519 13.62518 1.902303 Jarque-Bera 3.108276 2.658033 3.216284 2.15.4470 2.731897Observations 39 39 39 39 39

11
BIRRITU No. 117
An association between two variables is such that when one changes in magnitude the other also changes. A correlation may be positive or negative. If positive, as one variable increases so does the other. If negative, as one variable increases the other decreases. Correlation does not
suggest a cause-effect relationship but only the degree of parallelism or concomitance. Table 2 shows the correlation matrices of the data. It shows that there is high correlation between saving and economic growth in Ethiopia.
Table 2: Correlation matricesGross domestic product(GDP)
National saving (NS)
Domestic saving (DS)
Public saving( PS)
Private saving (PTS)
GDP 1.000000 0.989958 0.958615 0.517174 0.985064NS 0.989958 1.000000 0.977024 0.504893 0.989622DS 0.958615 0.977024 1.000000 0.510181 0.962995PS 0.517174 0.504893 0.510181 1.000000 0.446048PTS 0.985064 0.989622 0.962995 0.446048 1.000000
4.2. Econometric analysis 4.2.1. Unit root test
The investigation of stationarity (or non-stationarity) of a time series is related to the test for unit root. Existence of unit root in a series denotes non stationarity. The null hypothesis of non stationarity of savings and output is tested against the alternative hypothesis of stationarity. In order to test stationarity of the variables in the data set, we employed Augmented Dickey Fuller test. The results of this test are reported in the Tables 3&4.
Table 3 shows that in case of levels of the series, the null hypothesis of non-stationarity accepted for any of the series. Therefore, except public saving without trend and with trend all series are non-stationary at levels. Application of the same test at first differences to determine the order of integration; the critical values are less (in absolute terms) than the calculated values of the test statistics for all series. This shows that all the series are integrated of order one, i.e. I (1), and become stationary after differencing once.
Table 3: Unit root test results at level
variablesAugmented dickey
fuller statistics without trends
Critical value at 5%
Augmented dickey fuller statistics
with trends
Critical value at 5%
LDS 0.566120 -2.941145 -2.113520 -3.533083
LNS 0.829384 -2.941145 -2.763976 -3.533083
LPS -3.703737 -2.941145 -4.412254 -3.533083
LPTS 2.071003 -2.943427 -2.935638 -3.536601
LRGDP 1.784208 -2.941145 -1.551228 -3.536601
12
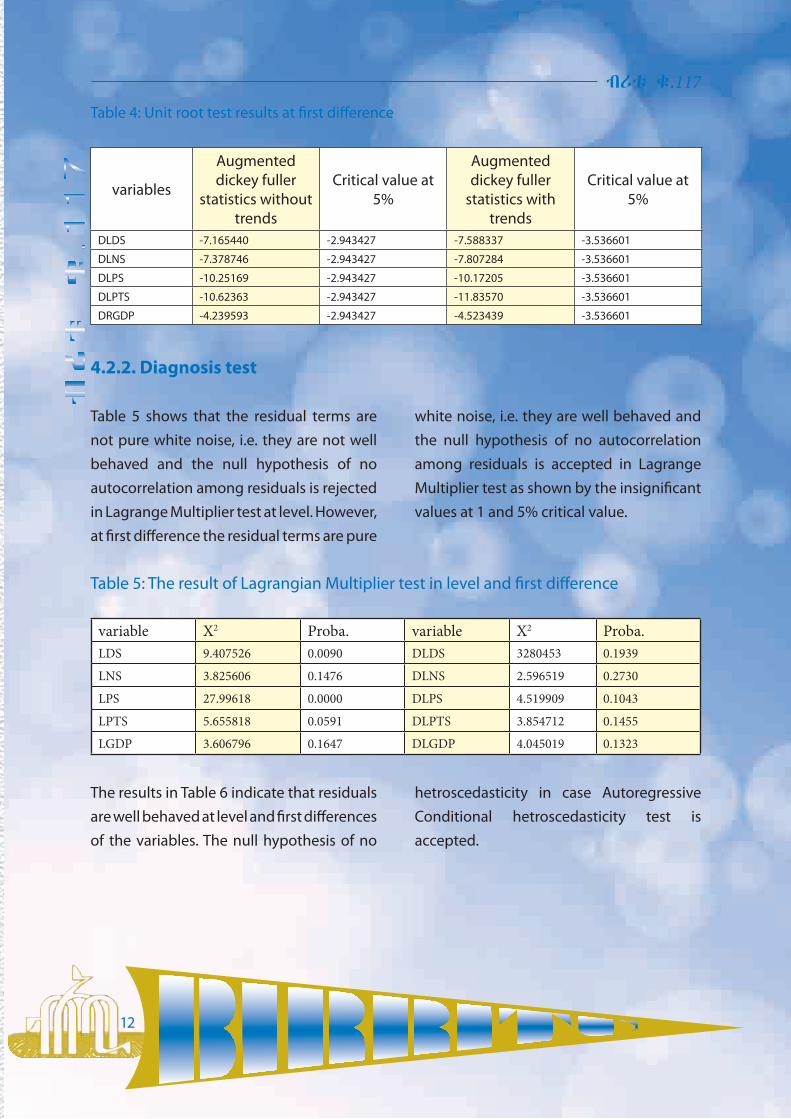
ብሪቱ ቁ.117Table 4: Unit root test results at first difference
variables
Augmented dickey fuller
statistics without trends
Critical value at 5%
Augmented dickey fuller
statistics with trends
Critical value at 5%
DLDS -7.165440 -2.943427 -7.588337 -3.536601
DLNS -7.378746 -2.943427 -7.807284 -3.536601
DLPS -10.25169 -2.943427 -10.17205 -3.536601
DLPTS -10.62363 -2.943427 -11.83570 -3.536601
DRGDP -4.239593 -2.943427 -4.523439 -3.536601
4.2.2. Diagnosis test
Table 5 shows that the residual terms are not pure white noise, i.e. they are not well behaved and the null hypothesis of no autocorrelation among residuals is rejected in Lagrange Multiplier test at level. However, at first difference the residual terms are pure
white noise, i.e. they are well behaved and the null hypothesis of no autocorrelation among residuals is accepted in Lagrange Multiplier test as shown by the insignificant values at 1 and 5% critical value.
Table 5: The result of Lagrangian Multiplier test in level and first difference
variable X2 Proba. variable X2 Proba.LDS 9.407526 0.0090 DLDS 3280453 0.1939
LNS 3.825606 0.1476 DLNS 2.596519 0.2730
LPS 27.99618 0.0000 DLPS 4.519909 0.1043
LPTS 5.655818 0.0591 DLPTS 3.854712 0.1455
LGDP 3.606796 0.1647 DLGDP 4.045019 0.1323
The results in Table 6 indicate that residuals are well behaved at level and first differences of the variables. The null hypothesis of no
hetroscedasticity in case Autoregressive Conditional hetroscedasticity test is accepted.
13
BIRRITU No. 117
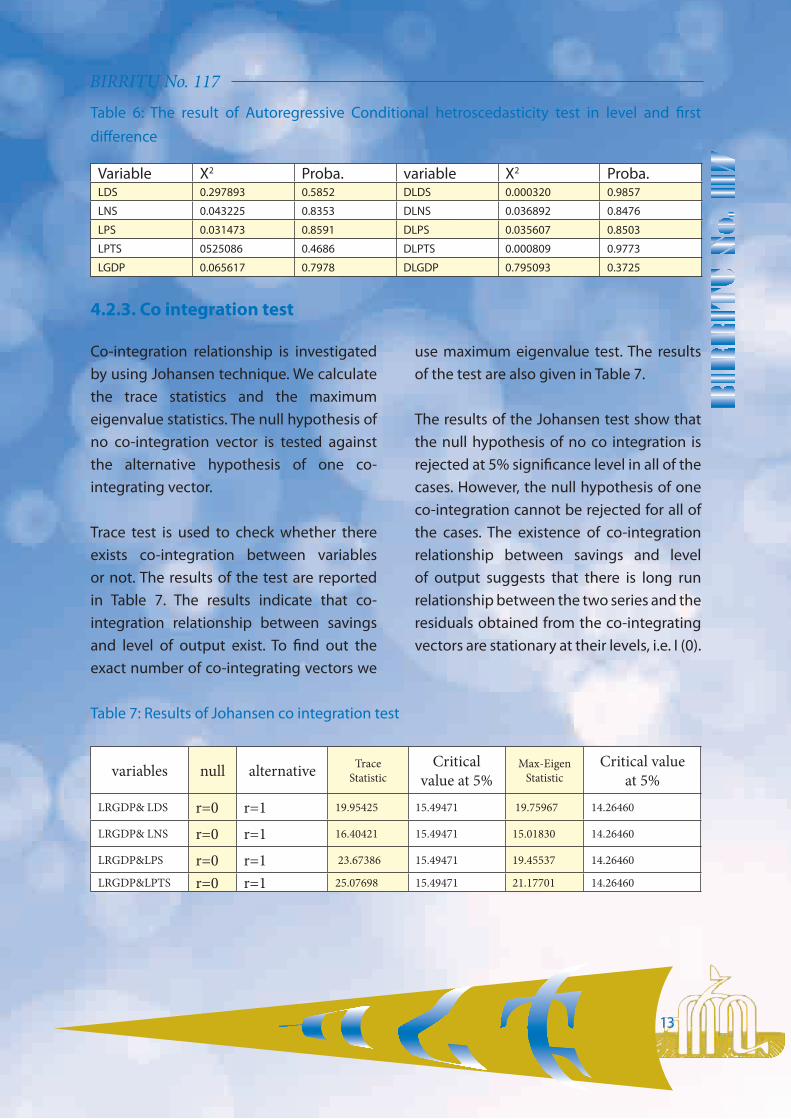
Table 6: The result of Autoregressive Conditional hetroscedasticity test in level and first difference
Variable X2 Proba. variable X2 Proba.LDS 0.297893 0.5852 DLDS 0.000320 0.9857
LNS 0.043225 0.8353 DLNS 0.036892 0.8476
LPS 0.031473 0.8591 DLPS 0.035607 0.8503
LPTS 0525086 0.4686 DLPTS 0.000809 0.9773
LGDP 0.065617 0.7978 DLGDP 0.795093 0.3725
4.2.3. Co integration test
Co-integration relationship is investigated by using Johansen technique. We calculate the trace statistics and the maximum eigenvalue statistics. The null hypothesis of no co-integration vector is tested against the alternative hypothesis of one co-integrating vector.
Trace test is used to check whether there exists co-integration between variables or not. The results of the test are reported in Table 7. The results indicate that co-integration relationship between savings and level of output exist. To find out the exact number of co-integrating vectors we
use maximum eigenvalue test. The results of the test are also given in Table 7.
The results of the Johansen test show that the null hypothesis of no co integration is rejected at 5% significance level in all of the cases. However, the null hypothesis of one co-integration cannot be rejected for all of the cases. The existence of co-integration relationship between savings and level of output suggests that there is long run relationship between the two series and the residuals obtained from the co-integrating vectors are stationary at their levels, i.e. I (0).
Table 7: Results of Johansen co integration test
variables null alternative Trace Statistic
Critical value at 5%
Max-Eigen Statistic
Critical value at 5%
LRGDP& LDS r=0 r=1 19.95425 15.49471 19.75967 14.26460
LRGDP& LNS r=0 r=1 16.40421 15.49471 15.01830 14.26460
LRGDP&LPS r=0 r=1 23.67386 15.49471 19.45537 14.26460
LRGDP&LPTS r=0 r=1 25.07698 15.49471 21.17701 14.26460

14
ብሪቱ ቁ.117
4.2.4. Causality test
Vector error correction model is estimated to examine the causal relationship between savings and economic growth in Ethiopia. The long run causality is checked by using the t-ratios of the error correction terms. They are basically the coefficient of speed of adjustment which shows how strongly the deviation from equilibrium feed back into the system. The short run causality is determined by the t-values of the coefficients of the lagged terms of independent variables. This procedure is particularly attractive over the standard vector autoregressive because it permits
temporary causality to emerge from (1) the lagged coefficients of the explanatory differenced variable and (2) the coefficient of the error correction term. In addition the vector error correction model allows causality to emerge even if the coefficients of lagged differences of the explanatory variables are not significant.
The results of long run Granger causality are reported in Table 8. There is unidirectional long run causality from gross domestic product as a measure of economic growth to all measures of savings.
Table 8: Long run causality result
REGRESSIONS ‘t’ value DLGDP DLDS 3.61112
DLDS DLGDP 0.43795
DLGDP DLNS 4.64609
DLNS DLGDP -0.11009
DLGDP DLPS 4.57944
DLPS DLGDP 1.35424
DLGDP DLPTS 4.38340
DLPTS DLGDP -0.36409
The short run causality between the variables is checked by the t-values of the coefficient of lagged terms of independent variables in vector error correction model. The results of short run causality are reported
in Table 9. Akaike information criterion and Schwartz Bayesian information criterion are used to choose optimum lag length of the variables included in the vector error correction model.

15
BIRRITU No. 117
Table 9: Short run causality result
REGRESSIONS lags ‘t’ value DLGDP DLDS 1 2 -2.06139(1)
DLDS DLGDP 1 2 -0.14020(2)
DLGDP DLNS 1 3 -2.12580(1)
DLNS DLGDP 1 3 -0.69860(2)
DLGDP DLPS 1 3 3.375429(3)
DLPS DLGDP 1 3 -0.85979(2)
DLGDP DLPTS 1 2 -2.12976(2)
DLPTS DLGDP 1 2 -0.42292(2)
V. CONCLUSION AND RECOMMENDATION
5.1. Conclusion
The paper analyzed the causal relationship between different measures of savings and economic growth measured by gross domestic product in Ethiopia. The co-integration and granger causality tests are used to explore the direction of causality for the period 1975-2013. The results of augmented dickey fuller test show that all measures of savings and output are integrated of order one. It means that these variables are stationary at their first differences. Once it is found that all the variables used in the analysis are integrated
of the same order, we applied Johansen’s co integration test to check whether the variables have long run relationship. The results of the co-integration test show that there is long run equilibrium relationship between saving and economic growth. The results of the granger causality tests suggest both in the long run and short run unidirectional causality runs only from gross domestic product to savings. So, overall long run and short run results favor Keynesian point of view, i.e. savings depends upon level income.
16
ብሪቱ ቁ.117
5.2. Recommendation
The results of the paper are unidirectional for both long run and short run causality. Both in the long run and short run unidirectional causality runs only from gross domestic product to savings. So, the paper leads to recommend that aggressive growth enhancing policy should be directed towards increasing individual income so as to create surplus that in turn increases saving. That is, growth should be enhanced to scale up saving. Although
the paper found growth leads to saving, it doesn’t necessarily mean that saving doesn’t contribute anything to growth. In fact, growth theory suggests that saving plays crucial role in promoting economic growth. Therefore, the ongoing effort by the government to enhance saving should also be encouraged as one of the means that leads to the road to growth and development.
VI. References
Aylit, T. (2003). “The Relationship between Savings and Growth in South Africa: An Empirical study.” University of Witwatersrand
Bassam, AbuAl-Foul (2010) “The Causal Relation between Savings and Economic Growth: Some Evidence from MENA Countries,” Being a Paper Presented at the 30th MEEA Meeting in Atlanta, January
Dawit, S. (2005). “Causal Relationship between Economic Growth and Gross Domestic Savings: Case of Ethiopia,” Department of Economics, Addis Ababa University.
Jappelli, T. and M. Pagano (1994).”The Determinants of Saving: Lessons from Italy,” Paper presented at the Inter-America Development Bank Conference, on Determinants of Domestic Savings in Latin America, Bogota, Colombia.
Johansen, S. (1988), “Statistical Analysis of Co-integrating Vectors,” Journal ofEconomic Dynamics and Control, 12: pp. 231-54.

17
BIRRITU No. 117
Johansen, S. and K. Jusilius (1990), Maximum likelihood estimations and inference on co-integration with application to the demand for money.Oxford Bulletin of Economics and Statistics, Volume 52, pp. 169-209.
Lean, H.H. and Song, Yingzhe (2009). “The Domestic Savings and Economic Growth Relationship in China.” Journal of Chinese Economic and Foreign Trade Studies, Vol 2, Issue 1, pp 5-17.
Masih, R. and A. M. M. Masih (1996), Macroeconomic activity dynamics and Granger causality: New evidence from small developing economy based on VECM analysis. Economic Modeling, Volume 13, pp. 407-420.
McKinnon, R. I. (1973), Money and Capital in Economic Development, Brookings
Modigliani, F. (1970), “The life cycle hypothesis of savings and inter country difference in the saving ratio. In: Eltis, W.A., M. F. Scott, J. N. Wolfe, (eds.), Induction to Trade and Growth: Essay in Honor of Sir Roy Harrod. Clarendon Press, London.
Sajid, G. M. and M. Sarfraz (2008) “Savings and Economic Growth in Pakistan: An Issue of Causality,” Pakistan Economic and Social Review Vol. 46, No. 1, pp. 17-36.
Shaw, E. S. (1973) Financial Deepening in Economic Development, Oxford UniversityPress.
Sinha, D. and T. Sinha (1998) “Cart Before the Horse? The Saving–Growth Nexus inMexico,” Economics Letters 61, pp. 43–47.
Solow, R.M. and T.W. Swan (1956). “Economic Growth and Capital Accumulation’, Economic Record, 32, pp. 334–61.
Solow, R. M. (1956) “A Contribution to the Theory of Economic Growth,” QuarterlyJournal of Economics, 70(1), pp. 65-94.Solow, R.M. and T.W. Swan (1956). “Economic Growth and Capital Accumulation’, Economic Record, 32, pp. 334–61.

18
ብሪቱ ቁ.117
Back ground Banking occupies one of the most important positions in the modern economic world. It is necessary for trade and industry. Hence it is one of the great agencies of commerce. Although banking in one form or another has been in existence from very early times, modern banking is of recent origin. It is one of the results of the Industrial Revolution and the child of economic necessity. Its presence is very helpful to the economic activity and industrial progress of a country.
In Ethiopia the birth of modern banking traces back to the imperial era, Bank of Abyssinia being the first modern bank in Ethiopia. The industry has passed through different political and economic situations which have played a great role in giving different features and shaping the industry.
Shortly summarizing the history of modern banking in different era; during the imperial era different banks were allowed to function in the country i.e. both domestic and foreign banks, but after the socialist regime took over the power in 1974 it nationalized all private banks and restricted the entry of any
banks by polices (Alemayhu Geda, 2007). Only three government owned banks; the National Bank of Ethiopia, the Commercial Bank of Ethiopia and Agricultural and Industrial Development Bank were running in the banking sector.
A new era began after 1991, when EPRDF came in to power and allowed private ownership through Licensing and Supervision of Banking Business Proclamation No. 84/1994. Immediately after the enactment of the proclamation private banks began to thrive highly.
Currently in Ethiopia, in addition to the Central Bank, there are 3 state owned and 16 private banks (which include the commercial banks and specialized banks). Financial sector policy of Ethiopia does restrict investment in the sector only for domestic investors. It is believed that domestic banks are very young to cope up the competition that would have come from the highly experienced and sophisticated foreign banks.
Gashaw DessalegnAssistance Research Officer
Domestic Economic Analysis & Publication Directorate
Zemzem AhmedAssistance Research Officer
Economic Modeling & Statistical Analysis Directorate
Structure Competition of Banking Industry in Ethiopia

19
BIRRITU No. 117
Statement of the Problem The market conditions in the banking industry deserve particular attention for many reasons (Bikker and Haaf, 2001). The soundness and stability of the financial sector may be influenced by the degree of competition and concentration. From a theoretical point of view, sound competition in the banking market is of great economic importance because it lowers prices and improves quality, thereby contribute to the prosperity of consumers and companies alike. Moreover, the strong links between market structure, particularly competition, and efficiency involves that the higher the degree of competition in the banking sector, the higher its efficiency in terms of allocating funds and in general operating as an inter-mediary between lenders and borrowers (De Nicolò and Loukoianova, 2007).
Competition may have also an impact on the effectiveness of monetary policy. It
improves the monetary transmission of policy rates to bank market rates. Some authors like Kashyap and Stein (1997) and Cecchetti (1999) argue that the concentration of the banking and health are essential to the analysis of the effectiveness of monetary policy.
The importance of competition is well noticed in Ethiopian financial sector policy. This sector is one of sectors which caught the attention of government in the country’s five years Growth and Transformation Plan (GTP).Therefore, this study is timely when we consider the importance of the contribution of financial sector to the general economy and the government’s concern on the sector.
Therefore, the objective of the study is to investigate the nature of the Ethiopian banking structure and competition.
Literature review Theoretical literature review
In assessing competition, there are two famous approaches known as structural and non-structural approaches. The structural method has its roots in the theory of industrial organization that measures competitiveness following the Structure-Conduct-Performance (SCP) paradigm and the alternative efficiency hypothesis (EH).
The SCP paradigm, having its origin in the
work of Bain (1951), uses concentration as a proxy for market structure; it investigates whether high levels of market concentration lead to collusive behavior and other noncompetitive practices among larger firms. According to the SCP hypothesis, all banks respond similarly to an increase in market concentration by strengthening their collusive behavior (Franklin and Gale .D, 2004).

20
ብሪቱ ቁ.117On the other hand, the EH, which stems from Demsetz (1973) and Peltzman (1977) as cited in Hamza (2010) postulates that, the most efficient firms increase in size and therefore, in market share at the cost of less efficient banks because of their ability to generate higher profits, leading to higher market concentration. However, various researches suggest that, the number of banks and the concentration index are not sufficient to assess the degree of competition. Some researchers noted the fact that a higher level of efficiency for banks can increase profits is not necessarily related to market concentration. The one-way causality — from market structure to market performance — implies a positive link between market structure and profitability which may be not a correct signal of the SCP hypothesis.
As noted by Kalle Ahi (2012) numerous papers exist which have investigated the trade-off between competition and concentration in line with SCP and EH and have generally found that there is no evidence that banking sector concentration is negatively related with the level of competition.
The recognition of these shortcomings in the structural stream gave birth for other three non-structural models of competitive behavior. The model by Iwata (1974), Bresnahan (1982) and Lau(1982), allow for
the estimation of the degree of competition using aggregate industry data and the methodology of Panzar and Rosse (1987) which employs bank-level data.
The approach of Panzar and Rosse (1987), hereafter referred to as the “H-statistic”. The H-statistic is calculated from reduced form revenue equations and measures the sum of elasticities of total revenue with respect to input prices. Panzar and Rosse (1987) show that, this statistic reveals information about the market or industry in which firms operate. The H statistic is unity if the market structure is characterized as perfect competition. Under this condition, any increase in input prices will increase both marginal and average costs without changing the equilibrium output of any individual bank. This is true since those institutions that cannot cover the increase in input prices through increased revenue will be forced to exit the market. The exit of some banks increasing the demand for the remaining ones and a simultaneous increase of output prices.
As a result, industry revenues raise equivalent to the rise in costs. The H statistic is also equal to one for a natural monopoly operating in a perfectly contestable market and a sales-maximizing bank subject to break-even constraints.

21
BIRRITU No. 117
Empirical literatureSeveral empirical studies have used the method of Panzar and Rosse to assess the degree of competition in banking industry. Most of results reveal that, the degree of competition in many countries lies under
monopolistic competition, even if there are some countries whose market is under monopoly and perfectly competitive.
Table 1. Summary of principal studies adopting the Panzar-Rosse model.
Authors Countries Years Results
Hamza (2010) Tunisia 1999-2008 MC
Gajurel & Pradhan (2012) Nepal 2001-2009 MC
STAVÁREK, D., ŘEPKOVÁ(2011) Czech 2001-2009 MC
Adam Mugume Uganda 1995-2005 MC
Luis Gutiérrez de Rozas(2007) Spanish 1986-2005 MC
Kalle Ahi (2012)Central and Eastern European (CEE) Loan Markets
1993-2010 competition in CEE countries has decreased
Jiang et al. (2004) Hong Kong 1992-2002 PC
Bikker et al. (2006) 101 countries 1987-2004 M: for 28% of countriesPC: for 38%
Al-Mouharrami et al. (2006) Arab countries GCC 1993-2002PC: Kuwait, Saudi Arabia and the union of the emirates MC: Bahrain and Qatar , M: Oman
PC: Perfect Competition, MC: Monopolistic Competition, M: monopoly
III Methodology and Data
3.1. Data The study uses comprehensive panel dataset of Ethiopian banks ranging from 2001 to 2012. The data collected from the balance sheets and income statements
reported by banks. It incorporates all banks in the financial sector according to the suitability of the available data to the different model of our analysis.
22
ብሪቱ ቁ.117
3.2. MethodologyTo analyze the competitive structure of Ethiopian banking sector we applied both structural and non structural methods. There are two frequently used indices of market concentration. The first is the k –bank concentration ratio which takes the market shares of the k largest banks in the market. This index is based on the idea that the behavior of a market is dominated by a small number of large banks. This study uses one bank (Commercial Bank of Ethiopia) and five big banks (Commercial Bank of Ethiopia, Construction & Business Bank, Awash International Bank S.C, Dashen Bank S.C, Bank of Abyssinia S.C) concentration ratio.
The second measure is the Hirschman-Herfindahl index (HHI), the sum of squared market shares of all banks operating in the market. HHI captures the number of firms in the industry which is not considered in “k-bank” concentration ratio. Generally, increasing HHI indicates a decrease in market competition and increase in the market power of larger firms. The HHI is computed as,
where, MS is the market share of the bank. As mentioned in US Merger Guidelines1, a HHI index below 0.01 indicates a highly competitive market, the HHI index below 0.1 indicates an un concentrated market and HHI index between 0.1 to 0.18 indicates moderate concentration; and a HHI index
above 0.18 indicates high concentration. In this study three HHI indices are developed based on three variables – total deposits, total loans and total assets.
3.3. Panzar-Rosse Model
Applying the Panzar and Rosse technique to evaluate banks’ market conduct requires various assumptions about banks’ production activity. The first assumption involves that the extension of the Panzar and Rosse methodology to the banking industry requires assuming that banks are treated as single product firms, producing intermediation services by using labour, physical capital, and financial capital as inputs. The second assumption that one assumes that, higher input prices are not associated with higher quality services that generate higher revenues because such a correlation may bias the computed H statistic (Molyneux et al., 1996). Moreover, other assumptions can be added: (a) banks are profit maximization firms; (b) the performance of these banks needs to be influenced by the actions of other market participants; (c) cost structure is homogenous; and (d) the price elasticity of demand is greater than unity (Hamza, 2010).
Several specifications of the Panzar-Rosse model have been used in empirical literature. One of the crucial differences among studies is the definition of the dependent variable applied in the

23
BIRRITU No. 117
estimation of H statistic. Chan et al. (2007), Pawlowska (2005), Deltuvaitė (2007), Lee and Nagano (2008) use interest income (revenues). Alternatively, Hempell (2002), Bikker et al. (2009) apply a total income or net income (de Rozas, 2007). Some authors analyze the competition in banking using a combination of more than one equation. For example, Chun and Kim (2004) or Fu
(2009) have total revenues and interest revenues as dependent variables.We modeled both total revenue and interest revenue as dependent variable. The model includes explanatory variables that reflect the bank’s behavior and risk profile very well that may affect revenues.The reduced form revenue equation that we use is:
= (1)
The dependent variable, in Equation 1, RI, is the ratio of Interest Income to Total Assets. Regarding the factor input prices, PF stands for cost of fund, PL denotes price of personnel expenses and PK is the price of physical capital expenditure. We cannot observe the three input prices directly and thus use proxies instead. Interest expenses to total funds is a proxy for the average funding rate, the ratio of annual personnel expenses to total assets is an approximation of the price of personnel expenses, and the ratio of general operating expenses to total assets serves as a proxy for the price of capital expenditure. The other covariates serve as correction variables. The ratio of customer loans to total assets (BR) represents credit
risk. SCALE equals the ratio of total assets of individual bank to total assets of banks surveyed. The ratio of capital to total assets (CAPAST) is used to account for the leverage reflecting differences in the risk appetite across banks. Finally, ε is dummy variables. We take natural logarithms of all variables. We estimated model (1) using GLS estimation with fixed bank-specific effects. The H-statistic then equals b + c + d. We will test whether H = 1 and whether H = 0 using F-test. In what follows, we refer to H1 as the H-statistic based on model (1). For robustness, it is necessary to estimate the following alternative reduced revenue equations:
= (2)
Where, RT is the ratio of total revenue to total assets. This dependent variable now includes non-interest revenues. The H statistic equals b + c + d. We will test again
whether H = 1 and whether H = 0 (F-tests). In what follows we refer to H2 as the H-statistic based on model (2).

24
ብሪቱ ቁ.117
Equilibrium test IThe PR-model is only valid if the market is in equilibrium. The test for long-run
equilibrium will be performed with the following equations:
= (3)
= (4)
Following Claessans and Laeven (2004) and Casu and Giradone (2006) the measure of ROA and ROE is calculated as ln(ROA) and ln ROE. We define the equilibrium E-statistic as b + c + d. We test whether E = 0, again using an F-test. If rejected, the market is assumed not to be in equilibrium. We refer to E1 as the E-statistic based on model (3) and to E2 as the E- statistic based on model (4).Empirical Analysis and Results
The descriptive statistics of variables has been summarized and some interesting reservations exist in Ethiopian banking industry. There is significant difference between mean and median statistics which is the result of high degree of domination of large banks specifically the Commercial Bank of Ethiopia during the years of sample
period, the result of concentration ratio also confirms this. Bank Concentration Ratio
Ethiopia’s banking system is highly concentrated. Concentrated banking systems are not necessarily uncompetitive actually —for example, in open systems, the threat of entry can restrain incumbents from overcharging (Claessens and Laeven 2004; Demirgüç-Kunt, Laeven, and Levine 2004). But concentration does often go hand in hand with market power, especially when contestability is weak. Indeed, economic theory provides conflicting predictions about the relationship between the concentration and the competitiveness of the banking industry and banking system fragility.
25
BIRRITU No. 117
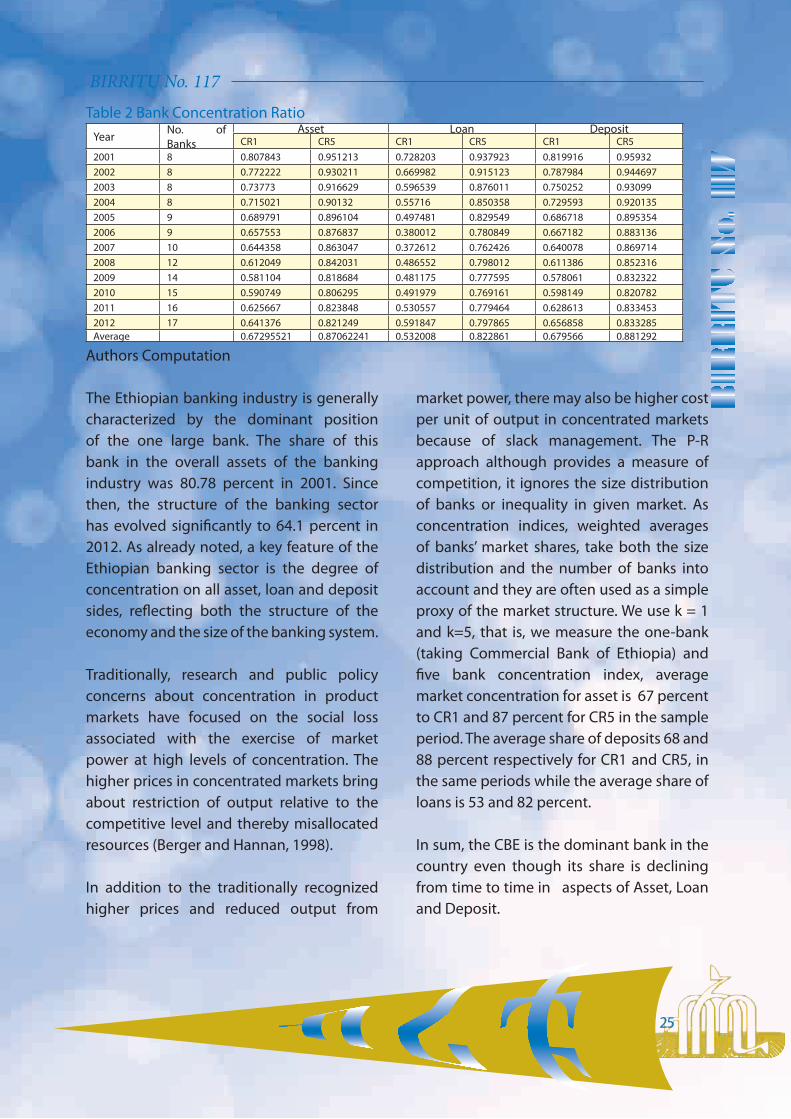
Table 2 Bank Concentration Ratio Year No. of
BanksAsset Loan Deposit
CR1 CR5 CR1 CR5 CR1 CR52001 8 0.807843 0.951213 0.728203 0.937923 0.819916 0.959322002 8 0.772222 0.930211 0.669982 0.915123 0.787984 0.9446972003 8 0.73773 0.916629 0.596539 0.876011 0.750252 0.930992004 8 0.715021 0.90132 0.55716 0.850358 0.729593 0.9201352005 9 0.689791 0.896104 0.497481 0.829549 0.686718 0.8953542006 9 0.657553 0.876837 0.380012 0.780849 0.667182 0.8831362007 10 0.644358 0.863047 0.372612 0.762426 0.640078 0.8697142008 12 0.612049 0.842031 0.486552 0.798012 0.611386 0.8523162009 14 0.581104 0.818684 0.481175 0.777595 0.578061 0.8323222010 15 0.590749 0.806295 0.491979 0.769161 0.598149 0.8207822011 16 0.625667 0.823848 0.530557 0.779464 0.628613 0.8334532012 17 0.641376 0.821249 0.591847 0.797865 0.656858 0.833285Average 0.67295521 0.87062241 0.532008 0.822861 0.679566 0.881292
Authors Computation
The Ethiopian banking industry is generally characterized by the dominant position of the one large bank. The share of this bank in the overall assets of the banking industry was 80.78 percent in 2001. Since then, the structure of the banking sector has evolved significantly to 64.1 percent in 2012. As already noted, a key feature of the Ethiopian banking sector is the degree of concentration on all asset, loan and deposit sides, reflecting both the structure of the economy and the size of the banking system.
Traditionally, research and public policy concerns about concentration in product markets have focused on the social loss associated with the exercise of market power at high levels of concentration. The higher prices in concentrated markets bring about restriction of output relative to the competitive level and thereby misallocated resources (Berger and Hannan, 1998).
In addition to the traditionally recognized higher prices and reduced output from
market power, there may also be higher cost per unit of output in concentrated markets because of slack management. The P-R approach although provides a measure of competition, it ignores the size distribution of banks or inequality in given market. As concentration indices, weighted averages of banks’ market shares, take both the size distribution and the number of banks into account and they are often used as a simple proxy of the market structure. We use k = 1 and k=5, that is, we measure the one-bank (taking Commercial Bank of Ethiopia) and five bank concentration index, average market concentration for asset is 67 percent to CR1 and 87 percent for CR5 in the sample period. The average share of deposits 68 and 88 percent respectively for CR1 and CR5, in the same periods while the average share of loans is 53 and 82 percent.
In sum, the CBE is the dominant bank in the country even though its share is declining from time to time in aspects of Asset, Loan and Deposit.
26
ብሪቱ ቁ.117
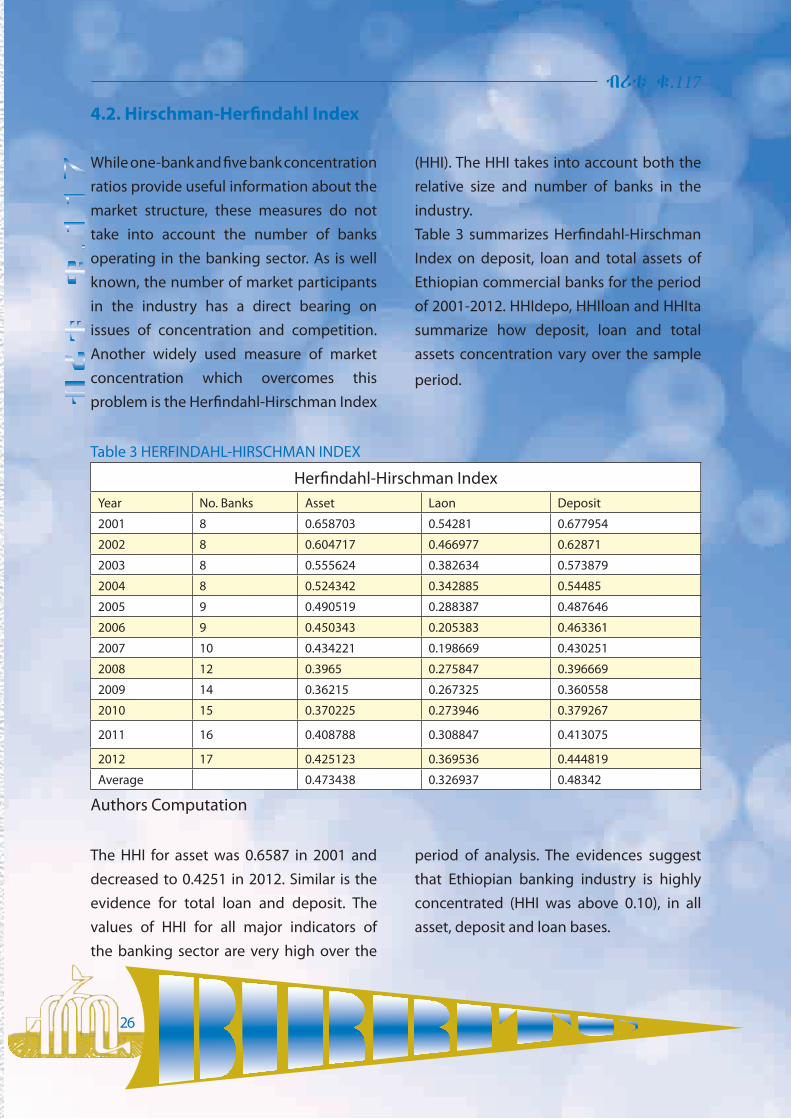
4.2. Hirschman-Herfindahl Index
While one-bank and five bank concentration ratios provide useful information about the market structure, these measures do not take into account the number of banks operating in the banking sector. As is well known, the number of market participants in the industry has a direct bearing on issues of concentration and competition. Another widely used measure of market concentration which overcomes this problem is the Herfindahl-Hirschman Index
(HHI). The HHI takes into account both the relative size and number of banks in the industry.Table 3 summarizes Herfindahl-Hirschman Index on deposit, loan and total assets of Ethiopian commercial banks for the period of 2001-2012. HHIdepo, HHIloan and HHIta summarize how deposit, loan and total assets concentration vary over the sample
period.
Table 3 HERFINDAHL-HIRSCHMAN INDEX
Herfindahl-Hirschman IndexYear No. Banks Asset Laon Deposit
2001 8 0.658703 0.54281 0.677954
2002 8 0.604717 0.466977 0.62871
2003 8 0.555624 0.382634 0.573879
2004 8 0.524342 0.342885 0.54485
2005 9 0.490519 0.288387 0.487646
2006 9 0.450343 0.205383 0.463361
2007 10 0.434221 0.198669 0.430251
2008 12 0.3965 0.275847 0.396669
2009 14 0.36215 0.267325 0.360558
2010 15 0.370225 0.273946 0.379267
2011 16 0.408788 0.308847 0.413075
2012 17 0.425123 0.369536 0.444819
Average 0.473438 0.326937 0.48342
Authors Computation
The HHI for asset was 0.6587 in 2001 and decreased to 0.4251 in 2012. Similar is the evidence for total loan and deposit. The values of HHI for all major indicators of the banking sector are very high over the
period of analysis. The evidences suggest that Ethiopian banking industry is highly concentrated (HHI was above 0.10), in all asset, deposit and loan bases.
27
BIRRITU No. 117
4.3. Panzar-Rosse (PR) Model Regression Result
In order to be valid for the test results of PR model, the banking industry should be in the long run equilibrium during the period of test. An equilibrium test exploits the fact that in competitive capital markets, risk-adjusted rates of return will be equalized across banks. In such a case, the return rates will not be correlated with input prices. The equilibrium in the banking industry is examined by estimating the equations with ROA and ROE as dependent variables.
The Wald test in all cases does not reject the null hypothesis E=0, leading us to conclude that Ethiopian banking industry was in the long-run equilibrium over the period 2001 to 2012 and for the sub period 2008 to 2012.
Next, we proceed with estimation of Eq. (1) and Eq. (2) and calculation of the H statistic. Regarding competitive condition tests, based on the market concentration measures CR shown in Table 1, it is expected that the H statistic for testing the competitive positions in the Ethiopian banking sector will vary between zero and unity. This would imply that banks in Ethiopia operated under conditions of monopolistic competition during the sample period.
The panel can be estimated by fixed effects estimator or random effects estimator depending on the nature of the individual
effects, iη. We used the Hausman test to determine the appropriate estimation method and hence report the results based on the appropriate estimation technique.
As the houseman t test result shows in Annex II we cannot reject the hypothesis that the coefficients are the same. What does this mean? We have a pleasant choice: we can assure that our model is well specified—that we have parameterized it correctly which tell us that GLS estimation is more appropriate for our regression.
Overall, as it is seen in Table 4, the estimated H-statistic is positive and significant in all cases, regardless of the dependent variable we use (interest income or total income), discarding the hypothesis of monopoly or oligopoly in the short term. At the same time, it is clearly less than unity, rejecting the assumption of perfect competition. Therefore, our data indicate the existence of a certain degree of monopolistic competition in the Ethiopian banking sector for the full sample period.

28
ብሪቱ ቁ.117Table 4 Competitive environment test (GLS Estimation)
Interest Revenue-asset ratio Total Revenue-Asset ratio2001-2012 2008-2012 2001-2012
Constant 1.420139*** (4.8) -0.3106194 (0.74) 1.475924***(4.91) Lnpf 0.3632278 *** (5.95) 0.4855484**(3.29) 0.0869046 (1.4)Lnpl 0.1777566***(3.44) 0.0225151(0.1) 0.3269451***(6.23)Lnpk 0.1166399*** (3.06) -0.060157(-0.56) 0.200309*** (5.17) Lnscale 0.1852668*** (5.54) 0.1082831(1.52) 0.1731309***(5.09)Lncapast 0.2476917***(5.79) -0.1063185 (-0.63) 0.726904***(3.98)Lnbr 0.6189883*** (9.13) 0.7154753***(4.1) 0.0586368 (0.85)Dummy -0.0399708 (-0.39) -0.3026642** (-2.9)R-squared 0.7965 0.8682 0.7531Chi2(7) 344.52 Chi2(6)=367.03 268.37Prob>chi2 0.0000 0.0000 0.0000
H0 : H=0Chi2(1)=97.67 Reject
Chi2(1)=4.38 Rejectchi2( 1) = 82.55Reject
H0 : H=1Chi2(1)= 26.47 Reject
Chi2(1)= 6.65 Reject
Chi2(1)= 32.58 Reject
H-statistic 0.657624 0.447907 0.614159
Authors Computation We estimated the model for the entire period, 2001-2012 and for one sub-period, 2008-2012 to investigate the effect of newly entering banks to the industry. Table 4 reports our econometric results. The Wald test in this table rejects the hypothesis for the market structure of monopoly or perfect competition at 1% significance level; this allows us to conclude that total bank interest revenues appear to be earned in conditions of monopolistic competition. The H-statistic of 0.66 would suggest that the banking industry in Ethiopia operates in monopolistic competitive environment during the full sample period (2001-2012).
The model seems to be relatively precisely estimated with a number of statistically significant variables. The positive value of H statistic indicates that the industry is characterized by monopolistic competition
hence recognizing the existence of product differentiation and the fact that banks tend to differ with respect to product quality and advertising, although their core business is fairly homogeneous.
The unit cost of funds, labour and capital all have positive sign and are statistically significant at 1 percent level. The results indicate that, the price of funds provides the highest contribution to the explanation of interest revenues and therefore to the H-statistics, followed by the price of labour. The unit price of labour is significant in all specifications and with similar positive coefficients. This result appears to suggest that personnel costs could be an important driver of overhead costs. The bank size measured by the asset (ratio of individual bank asset to total asset of banks in the sample) is positively related to revenues,

29
BIRRITU No. 117
hinting at the beneficial effects of size. Other things being equal, the larger the bank, the higher the revenue it generates. This demonstrates strong economies of scale, some argue that, it does not only indicate the profitability structure of the banking sector is skewed towards the larger banks, but also implies that there could be scope for greater consolidation in the sector in the future.
For robustness, we estimate an alternative reduced revenue equation where we include the ratio of total revenue to total assets as the dependent variable, where we replace the dependent variable, interest revenue, with the ratio of total revenue to total assets. The value of H-statistic for the entire period is positive, 0.61, although slightly lower than earlier, confirming the existence of monopolistic free-entry equilibrium. Broadly, the results are similar with the earlier results.
In sum, the results reject the monopoly and perfect competition hypothesis and lend credence to the proposition that Ethiopian banks earn their revenues as if they are operating under monopolistic competition. These results seem to be compatible with the contestable markets theory, if it is assumed that the incumbent set their prices close to the competitive level because of potential competition.
Comparing these results with those obtained elsewhere in Africa using similar methodology, we find that the H statistic obtained on Ethiopia is much comparable to 0.56 for Ghana, 0.58 for Kenya, 0.67 for Nigeria and 0.85 for South Africa as cited in Mugume (2006).
The H statistic for the period 2008-2012 is 0.44 when we take interest income as a dependent variable, while it is almost one for total revenue as a dependent variable which indicates perfect competition in the sense that higher value of H indicates stronger competition than lower values. Thus, overall we can conclude that the Ethiopian banking market is monopolistic-competitive in general. Conclusion and Recommendation
This paper examined the evolution of market structure and revenue behavior of Ethiopian banking industry over 12 years period (from 2001 to 2012). Concentration ratios, including Herfindahl-Hirschman Indices, show decreasing market concentration in Ethiopia banking industry and decreasing market share of largest banks over the sample period, even if still the concentration is high. The evidences suggest that the banking industry is highly concentrated but it is decreasing though slightly.
Furthermore, revenue behavior of banking industry is studied by using Panzar-Rosse

30
ብሪቱ ቁ.117model for both interest based market and total revenue based market. The results from PR model estimate indicate monopolistic competition in Ethiopian banking industry. The rejection of monopoly market competition and perfect competition confirms it. The test results indicate that the market is equilibrium in the long run. The value of H-statistic in total revenue based market is lower than that for interest income based market suggesting that there is lower competition among banks in non-interest based or fee based market. The banks managers can develop their strategies accordingly.
In addition, the result shows the larger banks are better able to generate more revenue. The results are robust to different model specifications and different estimation techniques. The effort of the government on the promotion of competition has helped change the banking market structure from monopoly to monopolistic competition. Indeed, before 1990s, the Ethiopian banking system was dominated by a few government banks that had monopoly power in the market but after the 1991 reform, we observe a change in the structure of the banking market, where competition among banks has started playing a fundamental role.
The PR result supports that the non structural argument that concentration is not a proxy for market structure, there is
no empirical evidence that banking sector concentration is negatively related with the level of competition. The overall result of our estimation reveals that Ethiopia’s banking sector is under monopolistic competition as is the case in many developing countries. From this, we can conclude that, despite the fact that there is high concentration in the industry the existing operational market policy of the sector allows competition.
Though there have been significant improvements in the industry and massive improvement in the infrastructural development of the country (which the banks consider in branch expansion), still it is challenging for the banks to expand their market share through physical presence. What is rather more efficient is reaching the majority of the population through innovation, which will enable banks more competitive by cutting/minimizing their costs.
Thus, even if the market is under monopolistic competition and highly concentrated, the competition theory tells us that, it is possible to lead the industry towards more competition through innovations in the financial industry. Therefore, the policy makers should continue working on the implementation of innovations such as mobile banking, internet banking, agent banking and many others through awareness creation and proper regulation.
31
BIRRITU No. 117
BibliographyAhi, K. (2012). Evaluation of the Level of Competition in Central and Eastern European (CEE) Loan Markets. EESTI ETTEVOTLSUKORGKOOL MAINOR .Alemayehu Geda (1999b) The Structure And Performance Of Ethiopia’s Financial Sector In The Pre And Post Reform PeriodBikker JA, H. K. (2001). Measures of competition and concentration: a review of the literature. De Nederlandsche Bank, Amesterdam .Bos, J. A. ( 2005). TRENDS IN COMPETITION AND PROFITABILITY IN THE BANKING INDUSTRY: A BASIC FRAMEWORK. SUERF – The European Money and Finance Forum , ISBN 3-902109-27-0.Budzinski, O. (2009). Modern Industrial Economics and Competition Policy: Open Problems and Possible Limits. IME WORKING PAPER 93/09 .Carletti E, H. (200). Competition and stability: what’s special about banking? Working Paper, p. 146.D. Stavárek, I. Ř. (2010). ESTIMATION OF THE COMPETITIVE CONDITIONS IN THE CZECH BANKING SECTOR. ACTA UNIVERSITATIS AGRICULTURAE ET SILVICULTURAE MENDELIANAE BRUNENSIS , 299-306 Volume LIX .Development, M. o. (2010). Growth andTransformation Plane.Dick, A. A. (2002 ). Market Structure and Quality:An Application to the Banking Industry. PhD dissertation. .Hamza, R. A. (2011). Validation Panzar-Rosse Model in determining the structural characteristics of Tunisian banking industry. Journal of Economics and International Finance Vol. 3(5) , 259-26.Juan S. Lopez and Stefano Di Colli. (2009). Competition and market power within the Italian banking system.Mazzeo, A. M. (2004). MARKET STRUCTURE AND COMPETITION AMONG RETAIL DEPOSITORY INSTITUTIONS.Molyneux P, T. J.-W. (1996). Competition and market contestability in Japanese commercial banking . J. Econ.Bus. , 48: 33-45.Mugume, A. (2006). Market Structure and Performance in Uganda’s Banking Industry.N.ROSS, J. C. (1987). TESTING FOR “MONOPOLY” EQUILIBRIUM* . THE JOURNAL OF INDUSTRIAL ECONOMICS Volume XXXV .Pradhan, D. P. (2012). Concentration and Competition in Nepalese Banking. Journal of Business, Economics and Finance , vol 1.Rozas, L. G. (2007). TESTING FOR COMPETITION IN THE SPANISH BANKING INDUSTRY: THE PANZAR-ROSSE APPROACH REVISITED. Documentos de Trabajo. N.º 0726.Strahan, N. C. ( 2004). FINANCE AS A BARRIER TO ENTRY: BANK COMPETITION AND INDUSTRY STRUCTURE IN LOCAL U.S. MARKETS. NBER , NBER Working Paper No. 10832.
32
ብሪቱ ቁ.117
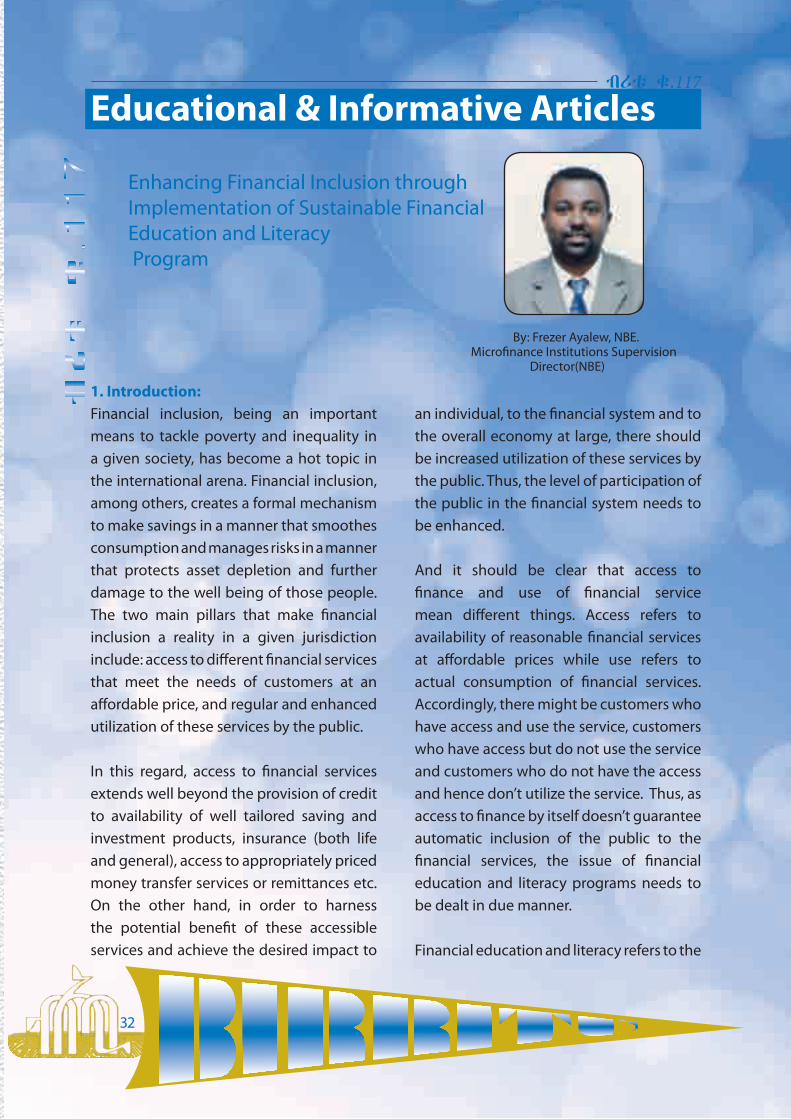
Enhancing Financial Inclusion through Implementation of Sustainable Financial Education and Literacy Program
By: Frezer Ayalew, NBE. Microfinance Institutions Supervision Director(NBE)
1. Introduction:Financial inclusion, being an important means to tackle poverty and inequality in a given society, has become a hot topic in the international arena. Financial inclusion, among others, creates a formal mechanism to make savings in a manner that smoothes consumption and manages risks in a manner that protects asset depletion and further damage to the well being of those people. The two main pillars that make financial inclusion a reality in a given jurisdiction include: access to different financial services that meet the needs of customers at an affordable price, and regular and enhanced utilization of these services by the public.
In this regard, access to financial services extends well beyond the provision of credit to availability of well tailored saving and investment products, insurance (both life and general), access to appropriately priced money transfer services or remittances etc. On the other hand, in order to harness the potential benefit of these accessible services and achieve the desired impact to
an individual, to the financial system and to the overall economy at large, there should be increased utilization of these services by the public. Thus, the level of participation of the public in the financial system needs to be enhanced.
And it should be clear that access to finance and use of financial service mean different things. Access refers to availability of reasonable financial services at affordable prices while use refers to actual consumption of financial services. Accordingly, there might be customers who have access and use the service, customers who have access but do not use the service and customers who do not have the access and hence don’t utilize the service. Thus, as access to finance by itself doesn’t guarantee automatic inclusion of the public to the financial services, the issue of financial education and literacy programs needs to be dealt in due manner.
Financial education and literacy refers to the
Educational & Informative Articles

33
BIRRITU No. 117
knowledge of basic financial and economic concepts and ability to use that knowledge to manage financial resources effectively for a better economic life. In this regard, to increase the level of utilization of financial services, consumers must understand how to use different financial services. On the other hand, some people might argue that instead of focusing on financial education issues, policy makers should focus more on policy topics that increase access to finance. However, it should be understood that though focusing on access to finance is very important, appropriate and due focus should be made to the issue of financial education and literacy program as they ensure effective utilization of existing financial services and infrastructures. For instance, one of the reasons for not having bank accounts among most people who are living in urban setting (where access is not a problem) is lack of awareness towards the benefit of same. To this end, implementing a coordinated and holistic financial education and literacy programs in a given country deserves utmost attention and commitment of policy makers and relevant stakeholders.
This article tries to highlight and explore the various measures that need to be taken to implement broad based, coordinated and sustainable financial education and literacy program that fosters financial inclusion in Ethiopia.
2. Background:
According to Central Statistics Agency (CSA), Ethiopia has got a total population of over 81.8 million in the year 2011 of which approximately 17% live in urban areas.1 In addition, Ethiopia has over 80 languages with 200 dialects2. The main objective of the Ethiopian Government is to achieve broad based, accelerated and sustained economic growth and eradicate poverty in the country. The government has set a vision of being a middle income country by 2025. The current development plan under implementation (i.e. Growth and Transformation Plan [GTP], which runs from 2010/11 to 2014/15) envisages an accessible, efficient and competitive financial system across the country.
The formal financial system in Ethiopia constitutes commercial banks, development finance institution, microfinance institutions and insurance companies. More recently, capital goods finance business or finance lease has been included to the country’s financial system and to this end new lease companies are joining the market accordingly. As of March 31, 2014, there were 16 private and 2 state owned commercial banks, 1 state owned development bank, 1 state owned and 16 private insurance companies and 31 microfinance institutions (of which 10 are majority-owned by regional governments)3. In addition, a large number of financial 1 Central Statistics Agency (CSA) , Federal Democratic Republic of Ethiopia2 Ethiopian Tour , 20123 National Bank of Ethiopia (NBE), unpublished report 2014.

34
ብሪቱ ቁ.117cooperatives are found in different parts of the country, providing financial services to their members. Despite the increasing number of financial institutions and also branch offices, Ethiopia, similar to other developing countries, remains as one of the least banked nations in the world. For instance, during the start of GTP implementation period, it was estimated that only 20% of households have bank accounts, though significant improvements have been made in this regard since then. For instance, Ethiopia has taken major steps to improve access to finance in recent years. This is demonstrated by the increasing level of branch expansion (whereby one bank branch serves 41,626 people as of March, 2014) and the strong presence of microfinance institutions in urban and rural areas of the country. In addition, Ethiopia has been engaged in undertaking various financial inclusion initiatives that have the potential to improve access to finance for its citizens. Some of these interventions include:
• modernization of the national payments and settlement system;
• establishment and implementation of modern and state of the art credit reference bureau (a bureau that in-house bank and microfinance borrowers data under one database);
• implementation of Rural Financial Intermediation Program,
• implementation of Micro and Small Enterprises Development Strategy (in which MSE financing is part and parcel);
• introduction of mobile and agent banking
regulatory framework;• introduction of regulatory framework for
interest free banking;• development of regulatory and
supervisory framework for micro insurance.
• introduction of capital goods finance/lease companies to the financial system etc
Thus, implementation of these initiatives will definitely have positive impact on improving the level of access to finance in the country. However, these initiatives will be more effective in achieving the ultimate goal of financial inclusion if they integrate with financial education and literacy program at national level. So far, little work has been done on the issue of financial literacy in a manner that is coordinated and broad based. In addition, the few financial education and literacy initiatives (mostly donor driven ones) have proven to be unsustainable and limited in scope. Moreover, these uncoordinated initiatives, despite some signs of success, have resulted in duplication of effort and are not always aligned with the national financial sector strategy.
3. The Need for Financial Education and Literacy:
The level of financial knowledge and skills among the majority of people, particularly those living in the developing world is very low. Thus, these people (including their businesses) who are with low level of financial literacy participate less in the formal financial system and are unable to

35
BIRRITU No. 117
make wise financial decision, adversely affecting their economic well-being and the growth potential of their respective jurisdictions. Thus, if these people are subjected to some form of financial education and literacy interventions, based on possession of basic knowledge and skill, it is likely that they will participate in the financial system and be financially included. To this end, researches conducted in this area suggest that there exists a positive correlation between financial education programs and level of participation of the public in the financial system.
The different stakeholders in Ethiopia, i.e. policy makers, regulators, financial service providers etc., need to recognize that addressing the issue of financial literacy is critical in the quest to achieve financial inclusion, which in turn has a strong bearing on financial stability and economic development. According to a research4 conducted in this area, countries that are having high poverty and unemployment ratio are poorly financially included as against countries with high financial inclusion level and low poverty and unemployment rates. Meanwhile, even if there is some form of financial service access in their premises, most people do not know where or how to access financial services including the benefit it brings to them, calling for some form of financial education intervention. Thus, it is essential for the public to know, understand and develop the ability to evaluate and assess financial products and services and transact in the financial market accordingly.
4 Financial Inclusion: Gateway or Poverty and Unemployment, Zakir Husain College, University of Delhi
4. The Need for National Financial Education Strategy: Policy makers found in both developing and developed countries, have been increasingly aware of the importance of financial education strategy. Tailored National Strategy can provide the pre-requisite for efficient financial education efforts at national level and promote a smoother and more sustainable cooperation between interested parties and stakeholders. In addition, a strategy avoids duplication of resources and more importantly allow the development of articulated and tailored roadmaps with measureable and realistic objectives based on dedicated national assessments and innovative practices.
This need for a harmonized and coordinated intervention in financial education and literacy is more crucial and apparent in diverse and populous nations such as Ethiopia. In addition, the fact that it involves many stakeholders i.e. regulators, government institutions (such as Ministry of Education), financial institutions, civil society, and others makes the need to have a national strategy very plain.
The experience of other countries suggests that adopting a unified and coordinated national strategy enables partners to leverage respective strengths thereby exploiting comparative advantages and reducing the risk of duplication and unintended gaps. According to an OECD survey5 (2012), the majorities of countries
5 A survey conducted on national authorities from OECD and non-OECD countries, OECD, 2012.
36
ብሪቱ ቁ.117surveyed (36 developed countries6) have already launched National strategy or are in the process of launching such strategies.
In addition, countries such as Indonesia can be considered as good role model for implementation of national financial education and literacy programs. To this end, Indonesia has endorsed legal framework on financial education, has included important stakeholders by establishing special taskforce on financial education and has achieved important milestone in improving the financial literacy level of its population and the level of financial inclusion in the country with a composite financial inclusion index of 40 % (World Bank 2011)
The main challenge in successfully implementing a national financial education strategy is to appoint a lead organization. A lead organization needs to provide a focus, momentum and an effective coordination and ensure that the agreed strategy is implemented and is also kept under review. Accordingly, the National Bank of Ethiopia, which is the regulatory body of the financial system and the one responsible for ensuring financial inclusion is in the best position to assume this role (at least in the initial years). In addition, the fact that the central bank is a public sector organization that is independent from the financial service industry provides it more credibility and unique insight in financial inclusion and consumer protection issues.
6 OECD Working Papers on Finance, Insurance and Private Pensions No. 16, OECD Publishing.
5. Conclusion and Recommendations: So far, the country has been undergoing different financial inclusion initiatives aimed at addressing supply driven constraints. Thus, in order for both the existing financial services and the new initiatives be effectively utilized and meet their ultimate objective, committing resources and enhancing the financial literacy of the public in a coordinated and holistic manner is very fundamental. To this end, the following possible recommendations that could be considered and implemented based on prevailing circumstances are forwarded:
5.1 Develop National Strategy for Financial Education and Literacy: This strategy which may be prepared in line with the direction of National Financial Inclusion Strategy, among other things, shall unequivocally acknowledge the importance of financial education and consumer protection to the country; define financial education and its scope, identify different stakeholders to be involved in the process (including identification of a lead organization); establish a road map to achieve specific and predetermined objectives and put direction on source and management of financial resources.
5.2 Establish Council /Working Group: Establishing this council/ working group in line with the provision of the national strategy and as supported by the necessary legal mandate is necessary. This council/working group shall be responsible for guiding, coordinating, implementing, monitoring and reviewing the financial education and literacy program at national level. The council shall be drawn from relevant public and private institutions7 7 Proposed member institutions include National Bank of Ethiopia, Ministry of Finance, Ministry of Education, Ministry of Women, Children and
37
BIRRITU No. 117
as represented by members who have the ability to influence policies and decisions as supported by technical people (in their respective institutions/sector) and have the capacity to mobilize resources including financial resource.
5.3 Develop National Financial Education Implementation Framework: This framework shall consider the national strategies and objectives and shall cover relevant topics found in the financial service ecosystem including credit, saving, insurance, payment system, use and handling of currency, leasing, budgeting and cash management, financial policy and regulation etc. In addition, this framework shall be developed with the view of undertaking a sustainable, coordinated and
prioritized financial education program in the country through application of effective dissemination strategies.
5.4 Develop Regulations for Implementation of the National Strategy: Depending on the actual content and provisions to be specified in the national financial education strategy and implementation framework, there might be issues that call for existence of legal frameworks/directives that would enforce certain course of actions be done by each stakeholder e.g. contributing funds for implementation of the strategy in a sustainable manner. To this end, appropriate regulatory framework that would enforce implementation of the strategy shall be in place.
Youth Affairs, Federal Micro and Small Enterprises Development Agency, Ministry of Government Communication Affairs, Federal Cooperative Agency, Ministry of Information and Communication
Technology, Ethiopian Bankers Association, Association of Insurers, Insurance Brokers Association, Association of Ethiopian Micro Finance Institutions and other Development partners.
38
ብሪቱ ቁ.117
Bibliography:
• Growth and Transformation Plan 2010/11-2014/15, Federal Democratic Republic of Ethiopia, Ministry of Finance and Economic Development, November, 2010.• Central Statistics Agency - www.csa.gov.et Ethiopian Tour, www.ethiopiantour.com
Financial Inclusion: Gateway or Poverty and Unemployment, Dr. Masroor Ahmad Beg Zakir Husain College, University of Delhi
Grifoni, A. and F. Messy (2012), “Current Status of National Strategies for Financial Education: A Comparative Analysis and relevant Practices’. OECD Working Papers on Finance, Insurance and Private Pensions No. 16, OECD Publishing.
Guideline For National Strategy on Financial Education (AFI Consumer Empowerment and Market Conduct Working Group, draft revised, 2012)
Sustaining Small and Medium Enterprises through Financial Service Utilization: Does Financial Literacy Matter
Various proclamations, regulations and directives and reports of the National Bank.

39
BIRRITU No. 117
“ለሥርዓተ-ጾታ ትኩረት
ከመስጠት አኳያ
በባንኩ ውስጥ አበረታች
ነገሮች አሉ”
ወይዘሮ ሕይወት ባህሩ በኢትዮጵያ ብሔራዊ ባንክ የሴቶች ጉዳይ ኦፊሰር
ሥርዓተ-ጾታ /Gender/ በማህበረሰብ ውስጥ በወንዶችና ሴቶች መካከል ያሉ ሚናዎችንና ማህበራዊ ግንኙነቶችን የሚያመለክት አስተሳሰብ ነው፡፡ በሌላ አገላለጽ ሥርዓተ-ጾታ ሴቶችና ወንዶች የሚኖራቸውን ሚና፣ ባህርይና አመለካከት የሚማሩበት ሲሆን፣ ጾታ ግን ሴቶችና ወንዶች በተፈጥሮ የሚያገኙት ተፈጥሮአዊ መገለጫቸው ነው፡፡ ይህም ተፈጥሮአዊውን ጾታ መቀየር የማይቻል፣ የምንማረውን ሥርዓተ ጾታን ግን መቀየር የሚቻል መሆኑን ያሳያል፡፡ ለምሳሌ በባህላችን የኩሽና ሥራ የሴቶች ሚና ነው፡፡ ነገር ግን ወንዶችም ቢሳተፉበት የሚያግዳቸው ነገር የለም፡፡ በግልባጩ ወንዶች ብቻ የተሰማሩበትን ዘርፍ ሴቶችም ሊሳተፉበት ይችላሉ፡፡ ስለዚህ ለሴቶች የተሰጠ የሥርዓተ ጾታዊ ሚና ወንዶችም ሊያከናውኑት ይችላሉ፡፡ በሌላ በኩል ግን ጡት ማጥባት የሴቶች ተፈጥሮአዊ ሚና (ጾታዊ ሚና) በዚህ ጉዳይ ላይ ጥያቄ ማንሳትም ተገቢ አይደለም፣ ይህንን ሚና መቀየር አይቻልምም ይላሉ - ወይዘሮ ሕይወት ባሕሩ፡፡
ወይዘሮ ሕይወት ባህሩ በኢትጵያ ብሄራዊ ባንክ የሴቶች ጉዳይ ኦፊሠር በመሆን እያገለገሉ ይገኛሉ፡፡ ወይዘሮ ሕይወት በተቋሙ ከተቀጠሩበት ጊዜ አንስቶ ከሥርአተ ጾታ ጉዳይ ጋር ተያይዞ በባንኩ ስለተከናወኑ ተግባራት ከብሪቱ መጽሔት ጋር ያደረጉት አጭር ቃለምልልስ እንደሚከተለው አቅርበነዋል፡፡
ብሪቱ፡- በተቋሙ እስካሁን በሥርዓተ ጾታ ዙሪያ የተከናወኑና በተጨባጭ የተገኙ ውጤቶች ካሉ ቢገልጹልን?
ወይዘሮ ሕይወት፡- ከሥርዓተ ጾታ ጋር ተያይዞ በተቋሙ የተለያዩ ተግባራት ተከናውነዋል፡፡ በተለይም በሥርዓተ ጾታ ዙሪያ ግንዛቤን ለመቀየር ሥልጠና መስጠት አንዱና ዋነኛው ተግባር እንደመሆኑ መጠን ለባንኩ ሠራተኞች በተለያዩ ርዕሶች ላይ ሥልጠና ለመስጠት ተችሏል፡፡ ለምሳሌ ያህል እ.ኤ.አ በ2011 86 በመቶ ለሚሆኑ የባንኩ ሀላፊዎችና ሠራተኞች የሥርዓተ ጾታ የግንዛቤ ማስጨበጫ ስልጠና ተሰጥቷል፡፡
እንዲሁም በሰው ሀይል አስተዳደር በቅጥርና በዕድገት ሥራ ውስጥ ለሥርዓተ ጾታ ምላሽ ለመሥጠት ይቻል ዘንድ ስልጠና ተሰጥቷል፡፡ ከዚህ በተጨማሪም በሥርዓተ ጾታና በኤች.አይ.ቪ/ኤድስ ዙሪያ ጽሑፎች ተዘጋጅተው በበራሪ ወረቀቶችና በመጽሔቶች ላይ ወጥተው እንዲሠራጩ ተደርጓል፡፡ ይህም የባንኩን ሀላፊዎችና ሠራተኞች ግንዛቤ አዳብሯል የሚል አስተያየት አለኝ፡፡
ከዚህ አኳያ የመጡ ተጨባጭ ለውጦችን ስንመለከት በተቋሙ ለጊዜያዊ ሴት ሠራተኞች የወሊድ ፈቃድ ከሙሉ ደሞዝ ጋር እንዲሰጥ፣ በጊዜያዊ ሠራተኞች አስተዳደር መምሪያ ውስጥ እንዲካተት የተደረገበት ሁኔታ አለ፡፡

40
ብሪቱ ቁ.117
በኮሚቴ ተግባራት ላይ በሚኖሩ ተሳትፎዎች ረገድ የጾታ ስብጥር እንዲኖር ከፍተኛ ትኩረት ተሠጥቶታል። ቀደም ሲል ማለትም እ.ኤ.አ በ2011 በተደረገው ጥናት በባንኩ የተለያዩ ኮሚቴዎች ውስጥ በአባልነት ይሠሩ የነበሩት ሁለት ሴቶች ብቻ ናቸው፡፡ በ2013 በሁሉም ኮሚቴዎች ውስጥ አንድ የሴት ተወካይ እንዲኖር ተደርጎ ቁጥራቸውም ወደ ሰባት ከፍ ብሏል።
ከዚህ በተጨማሪም ልዩ ድጋፍን /Affirmative Action/ ተግባራዊ ከማድረግ አኳያ ለሁሉም ሴት ተወዳዳሪዎች የሦስት ነጥብ ልዩ ድጋፍ እንዲደረግላቸው በማድረግ ሴት ተወዳዳሪዎችን ለማበረታታት ጥረት ተደርጓል። ለአብነት በአንድ ወቅት 162 ሴቶችና 237 ወንዶች ለሥራ ዕድገት በወጡ ቦታዎች አመልክተው 43 ነጥብ 2 በመቶ ሴት ተወዳዳሪዎች እና 54 ነጥብ 8 በመቶ ወንድ ተወዳዳሪዎች ውድድሩን አልፈው የሥራ እድሉን አግኝተዋል፡፡
ብሪቱ፡- በተቋሙ የብሔራዊ የሴቶች ጉዳይ ፖሊሲ ምን ያህል ተግባራዊ እየተደረገ ነው? በተለይም ልዩ ድጋፍን ተግባራዊ ከማድረግ አኳያ?
ወይዘሮ ሕይወት፡- ለሥርዓተ-ጾታ ትኩረት ከመስጠት አኳያ በባንኩ ውስጥ አበረታች ነገሮች አሉ፡፡ ወደፊት መሠራት የሚገባቸውም አሉ፡፡ በዚህም መሠረት የብሔራዊ ሴቶች ጉዳይ ፖሊሲ ላይ በሚኒስቴር መስሪያ ቤቶችና መንግስታዊ ድርጅቶች የሴቶች ጉዳይ መምሪያዎችን በተመለከተ በክፍል 3 ሐ. ላይ ከተደነገገው አኳያ እያከናወንናቸው ያሉ እና ወደፊትም የምንከናውናቸው ስራዎች አሉ፡፡
በፖሊሲው አንቀጾች ውስጥ የሴቶችን እንቅስቃሴ እለት በእለት በመከታተል የፖሊሲ ሀሳቦችን ለበላይ አካል ያቀርባል፡፡ በመስሪያ ቤቶች ውስጥ በሚካሄዱ ሥልጠናዎች፣ እድገቶችና ዝውውሮች፣ የሴቶች ሙሉ ተሳትፎ የታከለባቸው መሆናቸውን ይከታተላል፣ ለተግባራዊነቱም አስፈላጊውን እገዛ ያደርጋል፡፡ ማንኛውም በመንግሥት የሚወጡ ፖሊሲዎች፣ ፕሮግራሞችና የልማት እቅዶች ከየመሥሪያ ቤቶቻቸው ሀላፊነት አኳያ የሴቶችን ጥቅም የሚያስጠብቁ መሆናቸውንና ልዩ ትኩረት የተሰጠበት መሆኑን ይመረምራል በተግባር መዋሉንም ይከታተላል የሚሉ ተካተዋል፡፡
ከዚህ አኳያ እየተከናወኑ ያሉ ስራዎች አሉ ለአብነት በተመረጡ ዳይሬክቶሬቶች የሥርአተ ጾታ ኦዲት ይካሄዳል፡፡ በዚህ ላይም ውይይቶች ይካሄዳሉ፡፡ ነገር ግን ሥርአተ ጾታ ለተቋሙ አዲስ እንደመሆኑ መጠን የሚቀርቡት አስተያየቶችና ሀሳቦች በሙሉ በፍጥነት ተቀባይነት ያገኛሉ ማለት አይደለም፡፡ ነገር ግን በሂደት ከግንዛቤውም ማደግ አኳያ የተሻለ ሥራ ይሰራል የሚል እምነት አለኝ፡፡ከልዩ ድጋፍ ጋር በተያያዘ ከላይ እንደተገለጸው፣ በሥራ እድገት መመሪያው ላይ ሴቶች ባገኙት ነጥብ ላይ የሚደመር 3 ነጥብ አለ፡፡ በዚህም መሠረት ለሥራ እድገት የሚወዳደሩ ሴት ሰራተኞች በሙሉ ይህንን ነጥብ ያገኛሉ፤ እያገኙም ነው፡፡ በቅጥር ደረጃም መመሪያው ላይ ይካተታል ብለን እንጠብቃለን፡፡ ነገር ግን መመሪያው ስላልጸደቀ እርግጠኛ ሆኖ መናገር አይቻልም፡፡
ብሪቱ፡- ሴቶች በተቋሙ ማግኘት ያለባቸውን መብት እንዲያስከብሩና በሴቶች ዙሪያ ያለውን የተዛባ አመለካከት ለመቀየር ተደረገ ጥረት ካለ?
ወይዘሮ ሕይወት፡- “Assertiveness and leadership” እና “Family, work and life balance” በሚሉ ርዕሶች ላይ ስልጠናዎች ተዘጋጅተው በድምሩ ወደ 80 የሚጠጉ ሴት ሠራተኞች ተሳታፊ ሆነዋል፡፡ ስልጠናዎቹ ጠቃሚ እንደነበሩ ከስልጠናው በኋላ ከተሰበሰቡት ምላሾች ለመረዳት ተችሏል፡፡ ከዚህ በተጨማሪም በተለያዩ ርእሶች ላይ ጽሁፎችን በማዘጋጀት የሠራተኛውን ግንዛቤ ለማዳበር ጥረት ተደርጓል፡፡ ለምሳሌ ያህል በዚህ ዓመት “ራስን ማብቃት” /Self Development/ እና “ኢትዮጵያዊቷን የሴት ሰብዓዊ መብት ተሟጋችን ስንዘክር” በሚሉ ርእሶች ጽሁፎች ተዘጋጅተው ተሠራጭተዋል።ከላይ እንደተገለጸው መሠረታዊ የሥርዓተ ጾታ ጽንሰ ሀሳብን በተመለከተ አብዛኛው ሠራተኛ የተሳተፈበት ሥልጠና እ.ኤ.አ በ2011 ተሠጥቷል፡፡

41
BIRRITU No. 117
ብሪቱ፡- በተቋሙ በአመራር ደረጃ ሴቶች በቂ ውክልና አግኝተዋል ማለት ይቻላል? የተቋሙ አመራርስ ሴቶችን ወደ አመራር ደረጃ ለማምጣት የሚያደርገው ጥረት ምን ይመስላል?
ወይዘሮ ሕይወት፡- በጾታ የተለየ የሰራተኛ መረጃ እንደሚያሳየው ሴቶች በተቋሙ በአመራር ደረጃ በቂ ውክልና አላቸው ለማለት ያስቸግራል፡፡ በአመራርነት ብቻም ሳይሆን በሙያ ነክ ሥራዎችም በቂ ውክልና የላቸውም፡፡ ስለዚህ አንዱ መሰራት ያለበት ጉዳይ በአመራርና በሙያ ነክ ስራዎች ላይ ጾታዊ ስብጥሩን ለማመጣጠን የአሰራር ስርዓት መዘርጋትና ሁኔታዎችን ማመቻቸት ያስፈልጋል፡፡ በእርግጥ ይህ ጉዳይ በኢትዮጵያ ብሔራዊ ባንክ ብቻ ሳይሆን በሌሎች ሀገራት ማእከላዊ ባንኮች እና በሃገራችንም በተለያዩ የመንግስት ተቋማት ውስጥ የሚስተዋል የሥርአተ ጾታ ክፍተት ነው፡፡ የሌሎች ሀገሮች ልምድን ብንመለከት የሴቶችን የአመራርነት ውክልና ለማሳደግ ግብ አስቀምጠው የተለያዩ እርምጃዎችን እየወሰዱ ይገኛሉ፡፡
ለምሳሌ ያህል የናይጄሪያ ማእከላዊ ባንክ እ.ኤ.አ ከ2012 እስከ 2014 ያስቀመጡት ግብ 40 በመቶ ከፍተኛ አመራር ቦታዎችንና 30 በመቶ የቦርድ ቦታዎችን በሴቶች እንዲያዙ ማድረግ ነው፡፡ እንዲሁም የአውሮፓ ማእከላዊ ባንኮች እ.ኤ.አ በ2019 መጨረሻ 35 በመቶ የመካከለኛ የአመራር ቦታዎችና 28 በመቶ ከፍተኛ የአመራር ቦታዎች በሴቶች መያዝ እንዳለባቸው ግብ አስቀምጠዋል። ይህ ማለት ይህንን ግብ ለማሳካት የሚወስዷቸው የተለያዩ እርምጃዎች እና ስልቶች እንዳሉ በግልጽ የሚያመላክት ነገር እንዳለ መረዳት ይቻላል፡፡ በዚህ ረገድ ለአመራርነት እናበቃለን ብሎ በግብ ደረጃ ባንኩ ባያስቀምጥም በእድገትና ትራንስፎረሜሽን እቅድ ላይ የተቀመጠው ማለትም 30 በመቶ በከፍተኛ አመራርነት እንዲሁም 50 በመቶ በመካከለኛ አመራርነት የሚለው ባንኩንም የሚመለከት በመሆኑ በቀጣይ ይስተካከላል የሚል እምነት አለኝ፡፡
ብሪቱ፡- በቀጣይ የተቋሙን ሴቶች በማህበራዊና ኢኮኖሚያዊ አገልግሎቶች ይበልጥ ተጠቃሚ ከማድረግ አኳያ የሥርዓተ ጾታ ክፍል ምን ለመሥራት አስቧል? ከአመራሩስ ምን ይጠበቃል?
ወይዘሮ ሕይወት፡- በቀጣይ የሚሠሩት ሥራዎች በተለይም ግንዛቤን የማጎልበት፣ በተመረጡ ዳይሬክቶሬቶች የሥርአተ ጾታ ኦዲት ማከናወን፣ ከዳይሬክቶሬቶቹ ጋር ሥርአተ ጾታን አካተው በሚሰሩባቸው ሁኔታዎች ላይ መግባባት፣ ጥናቶችን ማከናወንና ግኝቶችንና የውሳኔ ሀሳቦችን ለበላይ አካላት ማስተላለፍ፣ የሥርአተ ጾታ ማካተቻ መመሪያ ማዘጋጀትና የመሳሰሉት ናቸው፡፡ ከበላይ አካላት የሚጠበቀው ቁርጠኝነትና ትኩረት መስጠት ነው፡፡ እስካሁን ያለው ሁኔታ አበረታች ሁኔታ ተጠናክሮ ሊቀጥል ይገባል፡፡
ብሪቱ፡- የባንኩን ሴት ሰራተኞች ተጠቃሚነትና ተሳታፊነት ደረጃን አውቆ ጠንካራና ደካማ ጎኖችን በመለየት የወደፊት አቅጣጫን ለማመላከት የሥርዓተ-ጾታ ኦዲት ማካሄድ አስፈላጊ ነው፡፡ በዚህም መሰረት የተቋሙ የሥረዓተ-ጾታ ክፍል በቅርቡ ያደረገውን የሥርዓተ-ጾታ ኦዲት እንደሚከተለው መመልከት ይቻላል፡፡
ወይዘሮ ሕይወት፡-እ.ኤ.አ በ2011 የተሰራው የመነሻ ጥናት እንደሚያሳየው ከአጠቃላይ ሰራተኞች ውስጥ 30.9 በመቶ ሴቶች ናቸው፡፡ ይህ በመቶኛ በ2013 ላይ በሁለት በመቶ ያህል ጨምሮ ታይቷል፡፡ በአመራር ደረጃ ያለውን ተሳትፎ ስንመለከትም በዳይሬክተርነት ደረጃ ላይ አንዲት ሴት ብቻ ይገኙ ነበር፡፡ በአሁኑ ወቅት አንዲት ሴት ሀላፊ ተጨምረው በዳይሬክተርነት ደረጃ የሚገኙ የሴቶች ቁጥር ወደ ሁለት ከፍ ብሏል፡፡ ከዚያ መለስ ባለ የሀላፊነት ደረጃ ቦታ ማለትም በአስተባባሪነት ደረጃ ሴቶች 19 በመቶ ያህሉን ድርሻ ይይዛሉ፡፡
የደረጃ እድገትን በሚመለከት በመስሪያ ቤቱ በአበረታችነት የሚጠቀሱ ተግባራት እየተከናወኑ መሆናቸውን መመልከት እንችላለን፡፡ ለአብነት ያህል በቅርቡ ለደረጃ እድገት ከተወዳደሩት መካከል 43.2 በመቶ ያህሉ ሴቶች የውድድሩ አሸናፊ ሆነው ደረጃውን አግኝተዋል፡፡ የደረጃ እድገቱ ሲታይ ሁሉም ሴት ተወዳዳሪዎች የሦስት ነጥብ ልዩ ድጋፍ ተደርጎላቸዋል፡፡ በሥራ እድገት መመሪያውም ላይ የልዩ የድጋፍ እርምጃ ተካትቷል፡፡
የውጭ ሀገር ስልጠናዎች፣ ሴሚናሮችንና ሌሎች እድሎችን በተመለከተ ከነበሩት እድሎች 26 በመቶ ሴቶች ተጠቃሚ መሆን የቻሉ ሲሆን ይህም ቀድሞ ከነበረው በ6 በመቶ እድገት አሳይቷል፡፡ በተለይ ሙያ ነክ በሆኑ የስራ መደቦች ላይ ቀደም ሲል የነበረው የሴቶች ተሳትፎ በጣም አነስተኛ ከመሆኑ አኳያ በአሁኑ ወቅት የተሻለ ለውጥ እንዳለ ያመለክታል፡፡

42
ብሪቱ ቁ.117
A Brief Synopsis of Joseph E. StiglitzThe Noble Memorial Prize in Economics Science is awarded annually by the Royal Swedish Academy of Sciences to researchers in the field of economics. The first award was given in 1969 to Ragnar Frisch and Jan Tinbergen. Each recipient receives a medal, a diploma and a monetary award. The money award has varied throughout the years. The award is presented in Stockholm, Sweden at an annual ceremony on December 10, the anniversary of Nobel’s death.
As of late 2013, 45 Nobel Memorial Prizes in Economic Sciences have been given to 74 individuals. And Joseph E. Stiglitz is one the winners of The Noble Memorial Prize.
Joseph E. Stiglitz was born in Gary, Indiana in 1943. A graduate of Amherst College, he received his PHD from MIT in 1967, became a full professor at Yale in 1970, and in 1979 was awarded the John Bates Clark Award, given biennially by the American Economic Association to the economist under 40 who has made the most significant contribution to the field. He has taught at Princeton, Stanford, MIT and was the Drummond Professor and a fellow of All Souls College, Oxford.
He is now University Professor at Columbia University in New York, where he is also the founder and Co-President of the university’s Initiative for Policy Dialogue, and a member and former chair of its Committee on Global Thought. In 2001, he was awarded the Nobel Prize in economics for his analyses of markets with asymmetric information, and he was a lead author of the 1995 Report of the Intergovernmental Panel on Climate Change, which shared the 2007 Nobel Peace Prize.
In the last fifteen years, he has written a series of highly popular books that have had an enormous influence in shaping global debates. His book Globalization and Its Discontents (2002) has been translated into 35 languages, besides at least two pirated editions, and in the non-pirated editions have sold more than one million copies worldwide.
In that book he laid bare the way globalization had been managed, especially by the international financial institutions. This powerful, unsettling book gives a rare glimpse behind the closed doors of global financial institutions. He saw the International Monetary Fund and other major institutions put the interests of Wall Street and the financial community ahead of the poorer nations. Those seeking to understand why globalization has engendered the hostility of protesters in Seattle and Genoa will find the reasons here. While this book includes no simple formula on how to make globalization work, Stiglitz provides a reform agenda that will provoke debate for years to come. Rarely do we get such an insider’s analysis of the major institutions of globalization as in this penetrating book. In two later sequels, he presented alternatives: Fair Trade for All (2005, with Andrew Charlton) and Making Globalization Work (2006). In Fair Trade For All, Stiglitz and Charlton address one of the key issues facing world leaders today--how can the poorer countries of the world be helped to help themselves through freer, fairer trade? To answer this question, the authors put forward a radical and realistic new model for managing trading relationships between the richest and the poorest countries. Their approach is designed to open up markets in the interests of all nations and not just the most powerful economies, to ensure that trade promotes development, and to minimize the costs
Miscellany Section
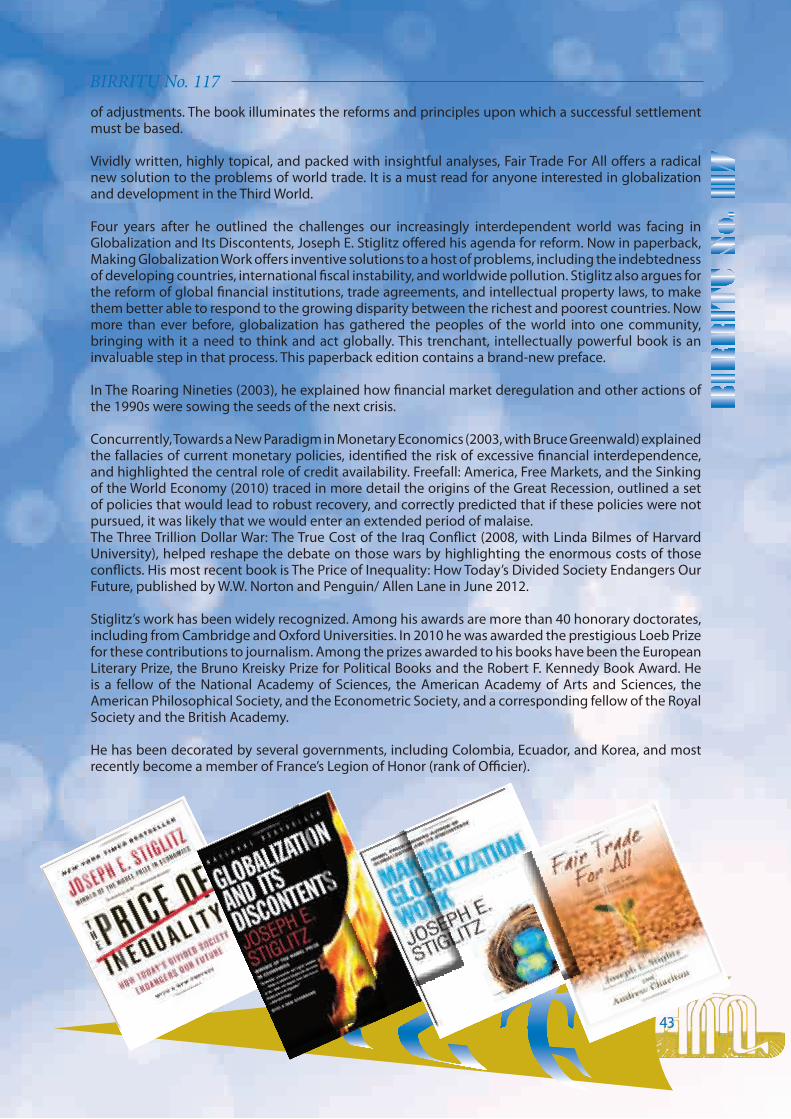
43
BIRRITU No. 117of adjustments. The book illuminates the reforms and principles upon which a successful settlement must be based.
Vividly written, highly topical, and packed with insightful analyses, Fair Trade For All offers a radical new solution to the problems of world trade. It is a must read for anyone interested in globalization and development in the Third World.
Four years after he outlined the challenges our increasingly interdependent world was facing in Globalization and Its Discontents, Joseph E. Stiglitz offered his agenda for reform. Now in paperback, Making Globalization Work offers inventive solutions to a host of problems, including the indebtedness of developing countries, international fiscal instability, and worldwide pollution. Stiglitz also argues for the reform of global financial institutions, trade agreements, and intellectual property laws, to make them better able to respond to the growing disparity between the richest and poorest countries. Now more than ever before, globalization has gathered the peoples of the world into one community, bringing with it a need to think and act globally. This trenchant, intellectually powerful book is an invaluable step in that process. This paperback edition contains a brand-new preface.
In The Roaring Nineties (2003), he explained how financial market deregulation and other actions of the 1990s were sowing the seeds of the next crisis.
Concurrently, Towards a New Paradigm in Monetary Economics (2003, with Bruce Greenwald) explained the fallacies of current monetary policies, identified the risk of excessive financial interdependence, and highlighted the central role of credit availability. Freefall: America, Free Markets, and the Sinking of the World Economy (2010) traced in more detail the origins of the Great Recession, outlined a set of policies that would lead to robust recovery, and correctly predicted that if these policies were not pursued, it was likely that we would enter an extended period of malaise. The Three Trillion Dollar War: The True Cost of the Iraq Conflict (2008, with Linda Bilmes of Harvard University), helped reshape the debate on those wars by highlighting the enormous costs of those conflicts. His most recent book is The Price of Inequality: How Today’s Divided Society Endangers Our Future, published by W.W. Norton and Penguin/ Allen Lane in June 2012.
Stiglitz’s work has been widely recognized. Among his awards are more than 40 honorary doctorates, including from Cambridge and Oxford Universities. In 2010 he was awarded the prestigious Loeb Prize for these contributions to journalism. Among the prizes awarded to his books have been the European Literary Prize, the Bruno Kreisky Prize for Political Books and the Robert F. Kennedy Book Award. He is a fellow of the National Academy of Sciences, the American Academy of Arts and Sciences, the American Philosophical Society, and the Econometric Society, and a corresponding fellow of the Royal Society and the British Academy.
He has been decorated by several governments, including Colombia, Ecuador, and Korea, and most recently become a member of France’s Legion of Honor (rank of Officier).

44
ብሪቱ ቁ.117
Capital Goods Finance CompaniesNo Name of Company Address Phone Fax1 Waliya Capital Goods Finance Business S.Co Bahirdar 058-2206780 -2 Oromia Capital Goods Finance Business S.Co Addis Ababa 0115-571159 251-01155711523 Addis Capital Goods Finance Business S.Co Addis Ababa 0111-567026 251-01115731244 Debub Capital Goods Finance Business S.Co Hawasa 0462208091 251-04622020525 Kaza Capital Goods Finance Business S.Co Mekelle 0344409306 251-0344406099
Capital Goods Finance Business Licensing and Supervision Team
የሁለት ዘመን ሰዎች
ሲያቀብጠኝ እርስዎን ዐይቼ
ያአካል ድክመትዎንየመንፈስ ድቀቶን
ከልብ ተረድቼ ምናልባት ምናልባት
እርስዎ የኔ አባትዋናው ችግርዎከመሰሎችዎ
ካ’ረጋውያን ጋራመዋል ማደርዎመሆኑን ገምቼ
የመንፈስን ንቃት የአካልን ብቃት
ዳግም እንዲቀስሙበዕድሜ ከማንስዎ ከኔጋ ይክረሙ
ብዬ ጋብዠኹዎት እርስዎም እሺ አሉአዳርዎን አደርኹ አዋዋሌን ዋሉወግዎን ተካፈልኹ ወጌን ተካፈሉ
የሚበሉትን በላኹ እምበላውን በሉይህን ባ’ረግ ግናእርስዎ የ ’ኔ አባት
ልክ እንደገመትኹትመች ወጣት ሆኑና
ይልቅ አጋቡብኝ የርስዎን እርጅና፡፡
ምንጭ፡ስብስብ ግጥሞችበዕውቀቱ ስዩም

Micro Finance Institutions No. Name of Institutions Telephone No. FaxNo.
1 Amhara Credit and Saving Institution S. Co. 058-2201652, 0918340256 251-058 – 2201733
2 DedebitCredit and Saving Institution S.C. 034-4409306, 0914702214 251-034 – 4406099
3 Oromia Credit and Saving Institution S.Co. 0115571158/18/33/ 0911771023 (GM) 251- 011- 1571152
4 Omo Micro Finance Institution S. Co. 046-2202053, 0462207384 251-046 – 220-20-52
5 Gasha Micro Financing S. Co. 0118952389/90/91, 0911240437 -
6 Vision Fund Microfinance Institution S. Co. 6463569, 0911211823 (GM) 251-011 – 6293346
7 SidamaMicro Finance Institution S.Co.046-2200850, 0462206151, 0916836687 (GM)
251-046 – 2204704
8 Africa Village Financial Services S. Co. 6532052, 01132047320911296401 (GM)
9 BuusaaGonofaa Micro Financing S. Co. 0114162621, 01141622100911223679 (GM) 251-011 –4162501
10 Poverty Eradication & Community Empowerment Micro Financing Institution S. Co. 6521541/42, 0911219506 (GM) 251-011 - 4654088
11 Addis Credit and Saving Institution S. Co.1572720, 111512/13 0911406174 (GM)
251-011 – 1573124
12 Meklit Micro Finance Institution S. Co.0113484152, 01134821830911318625 (GM)
251-011 – 5504941
13 ESHET Micro Finance Institution S.Co. 3206451/52, 0911677434 GM) 251-011 – 3206452
14 Wasasa Micro Finance Institution S.Co. 0911-67-38-22/0113384133 -
15 Benishangul-Gumuz Micro Financing S.Co. 057-7750666, 057-7752042 251-057 – 7751734251-057 - 7750060
16 ShashemeneEddirsYelimat Agar Micro Financing Institution S.Co.
0461105952/3831/56630913252247 (GM) 251-046 – 1101534
17 Metemamen Micro Financing Institution S. Co. 6615398/6635801/0913460432(GM) 251-011 – 6186140
18 Dire Micro Finance Institution S. Co. 0251129702/1127072/1119246/470911353890 (GM)
251-025 –1120246
19 AggarMicro Finance S.Co. 6183382/3104, 0911689457 (GM) 251-011 - 6183383
20 Letta Micro Finance Institution S. Co.6636947, 0911169263(Finance GM)
-
21 Harbu Micro Financing Institution S. Co. 0116185510, 0911512633 (GM) 251-011 - 6630294
22 Digaf Micro Credit Provider S. Co. 0112787390/2782252/0910-27-52-34 -
23 Harar Micro Microfinance Institution S. Co. 025-6663745, 025-6664078 251-025 - 6661628
24 Lefayeda Credit and Saving S.Co. 0116296976, 0118237179 -
25 Tesfa Micro Finance Institution S. Co. 0115526205 251-011 - 5512763
26 Gambella Micro Financing S. Co. 047-5511271, 0917823153251-047 – 5510892 51-02-77
27 Dynamic Micro Finance S. Co. (Approved 23/03/09)
011554915855403900915766908(GM) -
28 Somali Micro finance Institution S.Co.0257752122257-756976/770915768505 (GM)
02577520990257752916
29 Specialized Financial and Promotional Institution S. Co. 0116622780, 0911625576 251-011 - 6614804
30 Lideta Micro Finance Institution S.C. 0914788554, 0344450064/32 -
31 Nisir Micro Finance Institution S.Co. 0116638094, 0911686947 -


