1.0 Executive Summary ............................................................................................ 1 Introduction ............................................................................................................ 1 Sustainability ........................................................................................................... 1 Report Objective ..................................................................................................... 2 Flexible Packaging Benefits ..................................................................................... 2 Sustainability Challenges ........................................................................................ 3 Collaborations and Recovery Technologies ............................................................ 3 Quantifying Environmental Impacts – About Life Cycle Assessments ................... 4 Life Cycle Assessment Case Studies ........................................................................ 4 Future for Flexible Packaging .................................................................................. 5
Acronyms ................................................................................................................ 7 2.0 Global Packaging Trends and Insights ................................................................... 9
Packaging: A Global Economy ................................................................................. 9 Global Drivers and Trends ..................................................................................... 10 Packaging Value Chain Web Connections............................................................. 14 Consumer Trends and Insights.............................................................................. 14 Top Consumer Trends ........................................................................................... 15 Consumer Trends Application Example ................................................................ 15 Consumer Drivers and Implications ...................................................................... 16 Retail Drivers and Implications ............................................................................. 17 Sustainability Drivers and Implications ................................................................. 17 Science and Technology Drivers and Implications ................................................ 18 Looking Forward ................................................................................................... 19 Acronyms .............................................................................................................. 20
8.0 Life Cycle Assessment and Flexible Packaging ................................................... 113 Introduction ........................................................................................................ 113 About Life Cycle Assessment (LCA) ..................................................................... 113 LCA Application and Case Studies ....................................................................... 117 About the Environmental Indicator/Metrics ...................................................... 120 Summary ............................................................................................................. 122 Acronyms ............................................................................................................ 127
9.0 Life Cycle Assessment and Case Studies .......................................................... 129 Coffee .................................................................................................................. 129 Motor Oil ............................................................................................................. 136 Baby Food ........................................................................................................... 142 Laundry Detergent Pods ..................................................................................... 148 Cat Litter .............................................................................................................. 153 Beverages: Single Serve Juice Flavored Beverages ............................................. 159 Acronyms ............................................................................................................ 167
10.0 The Future for Flexible Packaging and Sustainability ...................................... 169 Introduction ........................................................................................................ 169 Path Forward ....................................................................................................... 173 Acronyms ............................................................................................................ 174
Appendix: Life Cycle Assessment and Case Study Data Input ................................... 177
III
List of Tables Table 1-A. Single Serve Juice Packaging Comparison Summary ........................................... 5 Table 2-A. Euromonitor Mega-Trends ................................................................................ 13 Table 2-B. Top Consumer Trends ....................................................................................... 15 Table 3-A. Flexible Packaging Consumer Benefit Examples ............................................... 21 Table 3-B. U.S. Flexible Packaging Industry Segments ....................................................... 24 Table 3-C. U.S. Flexible Packaging End-Use Segments ....................................................... 25 Table 3-D. Flexible Packaging Categories ........................................................................... 27 Table 3-E. Flexible Packaging Sustainability Benefits ......................................................... 29 Table 4-A. Comparison between CE and SMM................................................................... 41 Table 4-B. Future CE and SMM Flexible Packaging Opportunities ..................................... 47 Table 5-A. U.S. EPA Data on Generated MSW vs. End of Life Options (in millions of tons) ....................................................................................................... 58 Table 5-B. Waste to Energy and Fossil Fuel Power Plant - Comparison of Air Emissions ...................................................................................................... 69 Table 6-A. Bio-material Terminology .................................................................................. 83 Table 8-A. EcoImpact-COMPASS® Required Inputs and Assumptions ............................. 118 Table 8-B. Overview of Case Study Package Formats ...................................................... 119 Table 8-C. Coffee Packaging Comparison Summary ......................................................... 124 Table 8-D. Motor Oil Packaging Comparison Summary ................................................... 124 Table 8-E. Baby Food Packaging Comparison Summary .................................................. 125 Table 8-F. Laundry Detergent Pod Packaging Comparison Summary .............................. 125 Table 8-G. Cat Litter Packaging Comparison Summary .................................................... 126 Table 8-H. Single Serve Juice Packaging Comparison Summary ...................................... 126 Table 9-A. Coffee Packaging Evaluation Comparison ....................................................... 129 Table 9-B. Coffee Packaging Format – Recycled and Landfilled Comparison .................. 132 Table 9-C. Coffee Packaging Comparison Summary ......................................................... 134 Table 9-D. Motor Oil Packaging Evaluation Comparison ................................................. 136 Table 9-E. Motor Oil Packaging – Recycled and Landfilled Comparison .......................... 139 Table 9-F. Motor Oil Packaging Comparison Summary .................................................... 140 Table 9-G. Baby Food Packaging Evaluation Comparison ................................................ 142 Table 9-H. Baby Food Packaging – Recycled and Landfilled Comparison ........................ 145 Table 9-I. Baby Food Packaging Comparison Summary ................................................... 147 Table 9-J. Laundry Detergent Pods Evaluation Comparison ............................................ 148 Table 9-K. Laundry Detergent Pod Packaging – Recycled and Landfilled Comparison .... 151 Table 9-L. Laundry Detergent Pod Packaging Comparison Summary .............................. 152 Table 9-M. Cat Litter Evaluation Comparison .................................................................. 153 Table 9-N. Cat Litter Packaging – Recycled and Landfilled Comparison .......................... 156 Table 9-O. Cat Litter Packaging Comparison Summary .................................................... 158 Table 9-P. Single Serve Juice Evaluation Comparison ...................................................... 159 Table 9-Q. Single Serve Juice Packaging – Recycled and Landfilled Comparison ............. 163 Table 9-R. Single Serve Juice Packaging Comparison Summary ....................................... 165 Table 10-A. Future Opportunities and Needs for Flexible Packaging .............................. 170
IV
List of Figures Figure 2-1. Total Global Packaging Market by Value (2008 – 2026 USD) ........................... 9 Figure 2-2. Global Packaging Overview by Type (2017) (share by units of packaging) .... 10 Figure 2-3. Drivers to Packaging Implications ................................................................... 11 Figure 2-4. Global GDP: 2000-2030 .................................................................................. 12 Figure 2-5. Euromonitor Mega-Trends ............................................................................. 13 Figure 2-6. Value Chain/ Web ........................................................................................... 14 Figure 2-7. Consumer Drivers & Packaging Implications .................................................. 16 Figure 2-8. Sustainable Packaging Journey ....................................................................... 17 Figure 2-9. Sustainability Drivers & Packaging Implications ............................................. 18 Figure 2-10. Science & Technology Driver & Packaging Implications ............................... 19 Figure 3-1. Triple Bottom Line .......................................................................................... 23 Figure 3-2. Total U.S. Packaging Market Segment % Breakdown by Segment ................ 25 Figure 3-3. Global Flexible Packaging Sales by Region, 2016 ........................................... 26 Figure 3-4. Multi-layer Flexible Packaging Example (from Dow) ...................................... 28 Figure 3-5. Importance of Sustainability in Packaging Decisions ..................................... 29 Figure 3-6. Example of Store Drop-off designation as part of the How2Recycle program ...................................................................................................... 31 Figure 3-7. Packaging Optimization Curve, The Consumer Goods Forum ....................... 32 Figure 3-8. Shelf Life Extension Through Flexible Packaging ............................................ 33 Figure 3-9. Example of GHG Emissions output from EcoImpact-COMPASS® tool ........... 34 Figure 4-1. Circular Economy Framework ......................................................................... 40 Figure 4-2. Walmart Sustainable Packaging Priorities ...................................................... 44 Figure 4-3. Example of Product Shelf Life – Comparing Modified Atmosphere Packaging (MAP) vs. Non-MAP ......................................................................................... 45 Figure 4-4. Example of Shelf Life Extension of Food Through Packaging as part of Love Food, Hate Waste Campaign (UK) .................................................................................... 46 Figure 4-5. Example of How2Recycle label with Store Drop-off for recyclable plastic films ................................................................................................ 47 Figure 4-6. Ambitions of the New Plastics Economy (Ellen MacArthur Foundation) ....... 49 Figure 5-1. U.S. EPS Waste Management Hierarchy ........................................................ 55 Figure 5-2. U.S. MSW Generation Rates, 1960 to 2014 .................................................... 56 Figure 5-3. U.S. Municipal Recycling Rates, 1960 to 2014................................................ 57 Figure 5-4. Management of MSW in the U.S., 2014 ......................................................... 57 Figure 5-5. Total MSW Generation by Material, 2014...................................................... 58 Figure 5-6. MSW and Recovery Rates (2013 or latest) ..................................................... 59 Figure 5-7. Bales of plastic bottles. (Flickr CC Lisa Yarost) ................................................ 60 Figure 5-8. Typical MRF Process ....................................................................................... 61 Figure 5-9. Example of plastic wrap drop-off bin ............................................................. 64 Figure 5-10. Example of How2Recycle label for plastic film ............................................. 65
Figure 5-11. Example of bag made from collected flexible packaging ............................. 65 Figure 5-12. Hefty EnergyBag ........................................................................................... 66 Figure 5-13. Food waste and composting bin .................................................................. 66 Figure 5-14. Compostable bag example ........................................................................... 67
V
Figure 5-15. Typical Waste to Energy Facility ................................................................... 68 Figure 5-16. Pyrolysis Conversion Products ...................................................................... 70 Figure 5-17. Gasification Conversion Products ................................................................. 71 Figure 5-18. Enerkem gasification process ....................................................................... 72 Figure 5-19. The New Plastics Economy, Ellen MacArthur Foundation ........................... 75 Figure 5-20. Multi-layer, all PE pouch recyclable in store drop-off program ................... 76 Figure 6-1. PLA biobased and biodegradable bag used for food waste collection .......... 85 Figure 6-2. Bag utilizing biobased and non-biodegradable material example ................. 86 Figure 6-3. Example of a bottle containing biobased content and recyclable ................. 86 Figure 6-4. Global Production Capacities of Bioplastics (in 1,000 tons) ........................... 87 Figure 6-5. PlantBottle® from Coca-Cola is partially biobased, and fully recyclable ........ 89 Figure 6-6. NaturALL Bottle Alliance, led by Nestle and Danone looking to increase use of biobased content in water bottles ............................................................................... 91 Figure 6-7. Biopolymer Progression Stages ...................................................................... 93 Figure 7-1. Sustainability Drivers Leading to Regulations ................................................ 97 Figure 7-2. Sustainability Legislative & Regulatory Drivers .............................................. 98 Figure 7-3. Current and Future Legislative/ Regulatory Focus Areas ............................... 99 Figure 7-4. Example of reclosable and reusable flexible packaging for e-commerce .... 100 Figure 7-5. Example of an industrial compostable flexible bag ...................................... 102 Figure 7-6. Hefty EnergyBag is bright orange for easy identification in curbside recycling programs.......................................................................................................... 103 Figure 7-7. Photo of recycled plastic bales. (Creative Common) ................................... 106 Figure 8-1. PTIS Product Formula ................................................................................... 113 Figure 8-2. LCA Overview ................................................................................................ 114 Figure 8-3. Cradle to Factory Gate Boundary and Flexible Package System Example ... 115 Figure 8-4. Cradle to Grave Boundary and Flexible Package System Example .............. 115 Figure 8-5. Example of output from EcoImpact- COMPASS® for Coffee ........................ 117 Figure 9-1. Coffee Packaging Comparison – Fossil Fuel Consumption ........................... 130 Figure 9-2. Coffee Packaging Comparison – GHG Emissions .......................................... 131 Figure 9-3. Coffee Packaging Comparison – Water Consumption ................................. 132 Figure 9-4. Motor Oil Package Comparison – Fossil Fuel Consumption ......................... 137 Figure 9-5. Motor Oil Package Comparison – GHG Emissions ........................................ 137 Figure 9-6. Motor Oil Package Comparison – Water Consumption ............................... 138 Figure 9-7. Baby Food Package Comparison – Fossil Fuel Consumption ....................... 143 Figure 9-8. Baby Food Package Comparison – GHG Emissions ...................................... 144 Figure 9-9. Baby Food Package Comparison – Water Consumption .............................. 144 Figure 9-10. Laundry Detergent Pods – Fossil Fuel Consumption .................................. 149 Figure 9-11. Laundry Detergent Pods – GHG Emissions ................................................. 149 Figure 9-12. Laundry Detergent Pods – Water Consumption ........................................ 150 Figure 9-13. Cat Litter – Fossil Fuel Consumption .......................................................... 154 Figure 9-14. Cat Litter – GHG Emissions ......................................................................... 154 Figure 9-15. Cat Litter – Water Consumption................................................................. 155 Figure 9-16. Single Serve Juice Packaging – Fossil Fuel Consumption ........................... 161 Figure 9-17. Single Serve Juice Packaging – GHG Emissions… ........................................ 161 Figure 9-18. Single Serve Juice Packaging – Water Consumption .................................. 162
VI
Figure 10-1. Retailer/Brand Owner and Consumer Sustainability Benefits of Flexible Packaging ........................................................................................................... 169 Figure 10-2. Triple Bottom Line ...................................................................................... 173
VII
List of Acronyms
APR Association of Plastic Recyclers ASTM ASTM International – standards organization B Billion BON Biaxially Oriented Nylon BPI Biodegradable Products Institute BTU British Thermal Unit CE Circular Economy CEFLEX Circular Economy for Flexible Packaging DEMETO DE-polymerization by MicrowavE TechnolOgy EMF Ellen MacArthur Foundation EPA U.S. Environmental Protection Agency EPR Extended Producer Responsibility EPS Expanded Polystyrene EU European Union EVOH Ethylene Vinyl Alcohol FFRG American Chemistry Council Flexible Film Recycling Group FIACE Mapping Flexible Packaging in a Circular Economy FDA U.S. Food and Drug Administration FPA Flexible Packaging Association GHG Greenhouse Gas GHGP Green House Gas Protocol HDPE High Density Polyethylene (labeled as #2 plastic) HPD Holistic Packaging Design HPP High Pressure Processing IoT Internet of Things IPCC Intergovernmental Panel on Climate Change ISO International Organization for Standardization LCA Life Cycle Assessment LCI Life Cycle Inventory LCIA Life Cycle Impact Assessment LDPE Low Density Polyethylene (labeled as #4 plastic) LLDPE Linear Low-Density Polyethylene MAP Modified Atmosphere Packaging MFC Micro-fibrillated cellulose MRF Material Recovery Facility MJ Megajoule MRFF Materials Recovery for the Future MSW Municipal Solid Waste NAPCOR National Association for PET Container Resources
VIII
NFC Near-Field Communication NGO Non-Governmental Organization NIR Near Infrared OECD Organization for Economic Co-operation and Development PCR Post-Consumer Recycled PE Polyethylene PEF Polyethylene Furanoate PET Polyethylene Terephthalate (labeled as #1 plastic) PHA Polyhydroxyalkanoate PIQET Packaging Impact Quick Evaluation Tool PLA Polylactic Acid PP Polypropylene (labeled as #5 plastic) PPP Purchasing Power Parity PRF Plastic Recovery Facility PRO Producer Responsible Organization PS Polystyrene RDF Refuse Derived Fuel REFLEX Recycling for FLEXible Packaging RFID Radio-Frequency Identification S&T Science & Technology SMM Sustainable Materials Management SPC Sustainable Packaging Coalition T Trillion TSCA Toxic Substances Control Act (U.S.) UN United Nations WRAP Wrap Recycling Action Program WRAP (UK) Waste Resources Action Programme WTE Waste to Energy
1
Chapter 1
Executive Summary
Introduction The global packaging market is expected to top over $US 1 trillion early in the 2020s. This is driven by the growth of emerging market consumers looking for the convenience and safety of packaged goods, as well consumer expectations in developed markets for portability, safety, product freshness, and convenience. Additionally, there has been a trend toward conversion from other package formats to flexible packaging1 in many product categories, due to its lightweight nature, shelf life extension, easy open/reclose along with other features enabled through flexible packaging. The convergence of more people and more packaging, also means that sustainability and end-of-life considerations are gaining in importance for consumer product companies and package developers. A Holistic View of the Role of Flexible Packaging in a Sustainable World strives to provide a comprehensive view on flexible packaging and its environmental impacts. The report is focused on the U.S. perspective, though global data and context are utilized to provide a broader picture. The report looks at the current state for flexible packaging, while also providing foresight into potential future implications. Sustainability The efficient and responsible use of resources has become a critical consideration for companies throughout the packaging value chain. Sustainable development was first defined by the United Nations Brundtland Report in 1987 “as meeting the needs of the present without compromising the ability of future generations to meet their own need.” Sustainability further includes consideration of economic, environmental, and social components. Since Walmart introduced their “Packaging Scorecard” in 2006, packaging providers, brand owners, and others throughout the packaging value chain have been striving to take a more sustainable approach to their business. The packaging industry as a whole, has been working to reduce its environmental impact through initiatives such as lightweighting, using life cycle assessment (LCA) tools to quantify impacts, exploring novel materials, and extending the shelf life of products to reduce overall product and food waste. Flexible packaging is recognized as utilizing resources very efficiently to
1 Flexible packaging is defined as a package whose shape is not rigid and can be easily changed, when filled and during use. It includes packaging utilizing paper, plastic, film, foil, metallized or coated papers and any combination of these materials.
2
provide product protection, safety, and brand recognition, among many other attributes. Report Objective The Flexible Packaging Association (FPA) commissioned this report with the goal to:
• Provide a holistic view on the sustainability benefits that flexible packaging offers • Provide foresight into future sustainability implications for flexible packaging • Develop six LCA case studies comparing flexible packaging to other formats
across a range of products This report focuses on the segment of the industry that adds significant value to the flexible materials, usually by performing multiple processes such as printing, laminating multiple layers, and adding coatings, all of which aid in performance of the material, improve the consumer/user experience, and/or extend the shelf life of the product. Flexible Packaging Benefits Flexible packaging results in a number of sustainability benefits throughout the entire life cycle of the package, when compared to other package formats. These include:
• Material/resource efficiency • Lightweight/source reduction • Transportation benefits due to inbound format and lightweight nature • Shelf life extension • Reduced materials to landfill • High product-to-package ratio • Beneficial life cycle metrics (carbon impact, fossil fuel used, water consumption)
Additionally, new frameworks related to the evolution of sustainability are continually being developed, and can have business, legal/regulatory, and societal impacts. Two examples are the frameworks for Circular Economy (CE) and Sustainable Materials Management (SMM). CE focuses on keeping materials in circulation for reuse/recycling. SMM refers to the use and reuse of materials in the most productive and sustainable way across their entire life cycle (U.S. EPA). CE focuses on recycling and keeping materials in circulation, while SMM focuses on conserving resources and minimizing carbon impacts. Both have a role in driving sustainability through selection of materials and formats, with the ultimate long-term goal of optimizing both recyclability and carbon impact.
3
Sustainability Challenges Despite a number of sustainability benefits, there remain challenges for flexible packaging. The main challenges are in material collection and recycling. There is currently a lack of recycling options for multi-material laminated films, such as snack bags and foil pouches (e.g., drink and baby food pouches), which are difficult to separate into their various material substrates. The characteristics of strength, product protection, and barrier requirements enabled through the use of multiple thin layers of film and other substrates, which makes flexible packaging so efficient in the use of resources, also makes recycling and separating multi-material structures more challenging than other package formats. A linked, but separate challenge is around the role of plastic packaging in marine debris. The issue is most pronounced in Asia, where many countries do not have appropriate municipal solid waste (MSW) and recovery systems. The Ellen MacArthur Foundation reported that over 80% of global marine debris comes from Asia. This highlights a need for appropriate MSW and recycling systems in emerging markets. In developed economies, behavioral change through consumer education is essential to minimize marine debris from these countries. Recent proposals for new legislation and regulations focused on MSW and driving recycling will also impact flexible packaging. Many of the new regulations coming out of Europe focus on Circular Economy principles, recycling, food waste, and marine debris. The U.S. may very well follow suit. Collaborations and Recovery Technologies New initiatives to improve the sustainability profile of flexible packaging will need to continue to be addressed. These include technologies to drive recycling and collection and sortation of flexible materials, investigate new materials including compostable or bio-based structures, enhance processing technologies that extend shelf life and freshness (i.e., vacuum packing, modified atmosphere packaging (MAP), high pressure processing (HPP)), and increase consumer participation. One example is through the grocery bag store drop off programs such as Wrap Recycling Action Program (WRAP), which allows collection of polyethylene (PE) wraps that can be recycled with plastic grocery store bags. This combined with the How2Recycle label, which alerts consumers about flexible packaging formats where they can be recycled, can help drive collection of some flexible packaging by using an existing recovery infrastructure. Additional consumer education and investment in new recovery technologies, including in emerging markets, are needed to drive appropriate disposal behavior and prevent litter and marine debris.
4
Further industry collaborations to identify technologies to make collection and sortation of flexible packaging waste more economically effective are ongoing, as is research into chemical recycling, which degrades the mixed plastics into monomers or basic chemicals to turn into new products. Other programs such as waste-to-energy (WTE), which use the combustible energy from difficult to recycle plastics are widely used in Europe and Asia and may provide additional recovery benefits. Quantifying Environmental Impacts - About Life Cycle Assessment (LCA) Because of the many challenges in quantifying sustainability impacts, a number of companies are using LCA to help understand and quantify the environmental impacts in the design phase, before a package is brought to market. An LCA is a method for characterizing impacts associated with the sourcing, manufacturing, distributing, using and disposing of a product or product system. The goal of LCA tools is to understand the environmental impacts of packaging selection in the design phase, so packaging designers and brands can make more appropriate selections based on company and brand sustainability goals and package performance variables and attributes. Life Cycle Assessment Case Studies For the report, six different LCA case studies were developed using the EcoImpact-COMPASS® LCA software, which allows for quick life cycle comparisons between different package formats. This is also known as a streamlined LCA since the data is based on industry averages rather than a specific company’s process. Streamlined LCAs are much more cost effective and time efficient than full blown LCAs. Only the primary packages were evaluated for this report. Additionally, the product-to-package ratio as well as the amount of packaging that is landfilled for 1000 kg of each product was determined. The amount of packaging landfilled was based on the recycling rates for each material, while assuming none of the flexible packages were recycled. The results from the case studies shows that flexible packaging has more preferable environmental attributes for carbon impact, fossil fuel usage, water usage, product-to-package ratio, as well as material to landfill, when compared to other package formats. This is due to the efficient use of resources enabled by flexible packaging. This further supports the close alignment of flexible packaging and SMM.
In all of the tables, the percentages shown are using the flexible package as the baseline in the case study. Percentages in red mean those values are less preferable than the flexible package, while percentages shown in blue mean those values are preferable to the flexible package.
The following example shows the case study for single serve juice beverages. For additional detail of the individual studies see Chapter 9 which includes the detailed analysis for each study.
5
Single Serve Juice Beverage Case Study Table 1-A. Single Serve Juice Packaging Comparison Summary
Format Fossil Fuel Consumption (MJ-Equiv)
GHG Emissions (kg-CO2 equiv)
Water Consumption (l)
Product-to-Package ratio
Pkg Landfilled (g) / 1000 kg juice
Drink Flexible Pouch
88,736 4,652 12,108 97:3 27,734
Composite Carton
95,250 (+7%)
5,967 (+28%)
71,685 (+492%)
96:4 42,126 (+52%)
PET Bottle 140,231 (+58%)
7,319 (+57%)
28,738 (+137%)
96:4 34,290 (+24%)
Aluminum Can 275,766 (+211%)
27,105 (+483%)
91,812 (+658%)
95:5 25,388 (-8%)
Glass Bottle 326,690 (+268%)
25,612 (+451%)
209,809 (+1633%)
65:35 364,169 (+1213%)
Notes:
• A normalized product weight (common value divisible by all package formats) of 1,188,000 fl. oz. of product was used for Fossil Fuel, GHG and Water Consumption calculations.
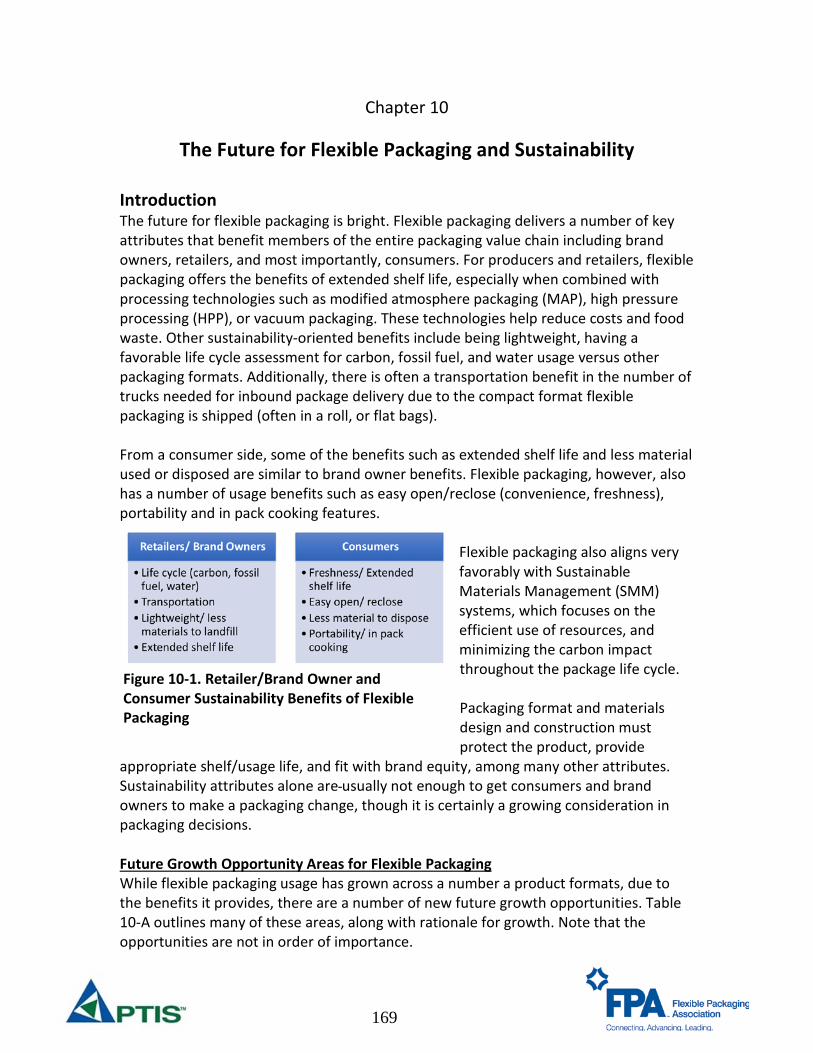
Future for Flexible Packaging The future for flexible packaging is bright. Flexible packaging offers a number of sustainability advantages across the entire packaging value chain including transportation benefits, high product-to-package ratio, and life cycle analytics demonstrating reduced carbon, greenhouse gas emissions, and water use, versus other packaging formats. It also delivers a number of key attributes that benefit members of the entire packaging value chain including brand owners, retailers, and most importantly, consumers. Flexible packaging also aligns very favorably with EPA-supported SMM systems, which focus on the efficient use of resources, and minimizing the carbon impact throughout the package life cycle.
The combination of packaging format, materials design, and construction must protect the product, provide appropriate shelf/usage life, and fit with brand equity, among many other attributes. Sustainability attributes alone are usually not enough to get consumers and brand owners to make a packaging change, though it is certainly a growing consideration in packaging decisions.
The industry does have some challenges to address, most notably the recovery and ultimate recycling of multi-layer flexible packaging. The multi-material layers that enable flexible packaging to be so resource efficient and provide key attributes benefitting the value chain, also make mechanical recycling difficult.
6
Companies will also need to embrace triple bottom line thinking; considering not only economic and environmental elements, but social implications as well. Many of the hot button issues around marine debris, litter, and recyclability have strong social components to them, which will continue to be a more important consideration in the future. Consumers are seeking transparency in products and packaging and are increasingly using their voice to drive change.
The path forward for flexible packaging and further expanding its sustainability credentials will require industry collaboration. Collaboration will help bring forward next generation technologies in biobased materials, consumer education, mono-material recyclable structures, and especially recycling infrastructure.
The flexible packaging community will also need to embrace the moonshots, further out technologies such as marine degradable materials, universal markers on packaging to aid in recycling, and chemical recycling. All are disruptive and have the ability to greatly impact flexible packaging, merging both SMM and CE principles.
Sustainability is a journey. As soon as one goal is achieved, another opportunity will present itself. The flexible packaging industry needs to embrace that journey, as Lao-Tzu once said, “A journey of a thousand miles begins with a single step.”
7
Acronyms – Chapter 1
CE Circular Economy EPA U.S. Environmental Protection Agency EPR Extended Producer Responsibility FPA Flexible Packaging Association HPP High Pressure Processing LCA Life Cycle Assessment MAP Modified Atmosphere Packaging MRFF Materials Recovery for the Future MSW Municipal Solid Waste PE Polyethylene SMM Sustainable Materials Management WRAP Wrap Recycling Action Program WTE Waste to Energy
8
THIS PAGE INTENTIONALLY LEFT BLANK
9
Chapter 2
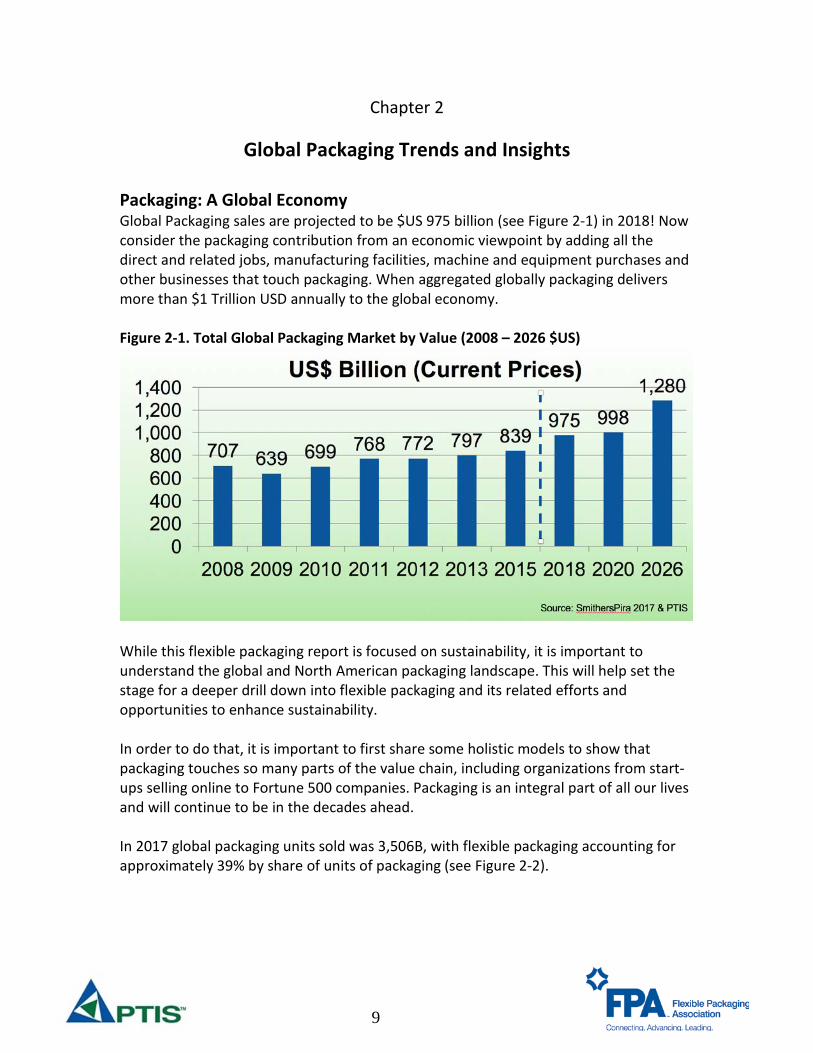
Global Packaging Trends and Insights Packaging: A Global Economy Global Packaging sales are projected to be $US 975 billion (see Figure 2-1) in 2018! Now consider the packaging contribution from an economic viewpoint by adding all the direct and related jobs, manufacturing facilities, machine and equipment purchases and other businesses that touch packaging. When aggregated globally packaging delivers more than $1 Trillion USD annually to the global economy. Figure 2-1. Total Global Packaging Market by Value (2008 – 2026 $US)
While this flexible packaging report is focused on sustainability, it is important to understand the global and North American packaging landscape. This will help set the stage for a deeper drill down into flexible packaging and its related efforts and opportunities to enhance sustainability. In order to do that, it is important to first share some holistic models to show that packaging touches so many parts of the value chain, including organizations from start-ups selling online to Fortune 500 companies. Packaging is an integral part of all our lives and will continue to be in the decades ahead. In 2017 global packaging units sold was 3,506B, with flexible packaging accounting for approximately 39% by share of units of packaging (see Figure 2-2).
10
Figure 2-2. Global Packaging Overview by Type (2017) (share by units of packaging)
Source: Euromonitor, Global Packaging Trends Global Drivers and Trends There are various ways to define and describe drivers and trends. Drivers are underlying forces driving long term attitudinal change, whereas trends identify the general direction in which something is changing. As futurists would say, “you can’t predict the future,” however, based on foresights, insights and related driver and trend knowledge you can project the future for packaging. The following provides a look at drivers and trends that will impact packaging over the next decade. The general flow is societal drivers lead to mega-trends that impact broader society. Consumer trends follow the mega-trends and ultimately lead to specific packaging implications (See Figure 2-3).
Flexible Pkg39%
Rigid Plastics28%
Metal11%
Glass9%
Paper based containers
7%
Liquid cartons6%
11
Figure 2-3. Drivers to Packaging Implications
Kaleido Insights (2017) identified three drivers that will have significant impact in the years ahead (2030). The drivers will also have significant impact across the packaging sector globally.
• Technology developments enabling people to evolve to super humans • Nimble and fluid organizations poised to survive and thrive • Enlightened eco-systems prevail – utilizing convergence of the digital and
physical world
Simply stated mobile devices, data sharing, and technology convergence along with more value chain collaboration and transparency will disrupt and change organizations and the way we will work in the future. The growth of certified intelligence and robotics will play a key role. We are already starting to see signs of the future. Consider the impact of Amazon and how it has changed retail in the span of a decade. Autonomous vehicles will be commonplace in the next 10-15 years. More than 40 smart cities globally are adopting open data policies, which could lead to improved packaging collection and composting efforts as a result of data sharing. All of this has important bearing on how we think about packaging going forward. Global growth will continue, especially in emerging and developing markets (Figure 2-4) and we need to start getting ready for the future.
Drivers Mega-Trends
Consumer Trends
Packaging Implications
12
Figure 2-4. Global GDP: 2000-2030
Source: Euromonitor International from national statistics/IMF/OECD/Eurostat PTIS and Leading Futurists identified eight Key Drivers in their 2026 Future of Packaging Program, including:
o Emerging Markets o Retail Impacts o Holistic Design Thinking o Sustainability o Consumer/Social Media/Personal Technology o Science and Technology o Laws and Regulations o Anticipatory Issues and Disruptors
Based on the definition for drivers (forces that drive long term change and shifts in consumer attitudes and behavior), they are independent of packaging, but it is important to recognize that packaging is integral to many of the top drivers identified above.
13
In the Chart below (Figure 2-5), Euromonitor identified 20 mega-trends (2017) that will shape the world through 2030. Figure 2-5. Euromonitor Mega-Trends
Of these top 20, they identified eight mega-trends that stand out. These mega-trends are more easily understood and have reference to the Kaleido and PTIS drivers previously identified. Table 2-A. Euromonitor Mega-Trends
Mega-Trend Description Experience more • Bring happiness and well being
• Differentiation Shifting market frontiers • Global population growth will reach 8.5
billion by 2030, There will be significant emerging and developing world growth, while developed economies population will remain stagnant or decrease. Figure 2-4 Global GDP: 2000-2030).
Healthy living • More holistic, clean label, natural Shopping reinvented • Experience and solutions based Middle class retreat • Value based, cost is important
14
Ethical living • Well-being, environment, societal Premiumization • Spending more on what matters Connected consumers • Internet is the global equalizer
Packaging Value Chain Web Connections Packaging will become more central to our thinking as a key enabler to drivers and trends. As the population in emerging/developing markets grow (significantly) over the next decade (Figure 2-4), so will packaging. As a result, industry will need to consider packaging very early and often in the development process. The packaging value chain has changed dramatically over the past 15 years and moved from a linear supply and demand chain to a circular “cradle to cradle” value chain in the early 2000s. The value chain has again morphed to a value chain web (Figure 2-6), as a result of the growing importance and value of packaging. Figure 2-6. Value Chain/Web
Source: PTIS Consumer Trends and Insights Consumers (and customers) no longer buy products and packages, they buy experiences and solutions. These are important components or considerations in the packaging value chain. After all, if consumers don’t purchase products we would not need packaging! The following consumer trends all play strongly with packaging. About 2/3 of all packaging is for food and beverages and about 90% of flexible packaging is for this
15
sector currently. With continued population growth in emerging and developing markets and flexible packaging growth outpacing other packaging material growth – flexibles will become more visible and more transparent – that suggests both benefit opportunities and potential implications. Top Consumer Trends PTIS has been tracking top consumer trends for years, along with packaging implications. Table 2-B below lists these top trends, which have been relatively stable over the past decade, along with examples of packaging implications: Table 2-B. Top Consumer Trends
Consumer Trend Packaging Implications Taste/Performance The packaging needs to support these attributes.
Without taste or product performance (including packaging, there is no second purchase)
Convenience All about ease of use Nutrition ‘Clean label’ and portion control growth continues Value Provides desired benefits at right cost Variety Need to offer selection and clarity of offering. Ex. soda
beverages at multiple sizes and price points Fun Packaging can add to the positive experience Trading Up Ability of packaging to signify high value branding Affordability Cost is still important, and packaging must protect the
product Environment Sustainability is key message for packaging and must be
considered early in the design process Safety Protects the brand and gives consumer confidence in
product Quality Delivers on the brand promise Resourceful Since the 2009 recession consumers looking at value and
trade up or trade down depending on the cost/benefit These trends are enabled by packaging in many ways and are truly value driven where value = benefits/price vs. competition. Packaging plays a wide support role where the package need only provide protection, containment and communication yielding “good enough value.” Packaging can also be a delighter and provide many more benefits as depicted in the following example. Consumer Trends Application Example Daisy® Sour Cream in a pouch provides a good general example of innovation and benefits that flexible packaging affords to packaging in one package. The Daisy sour
16
cream pouch aligns with many of the consumer trends identified earlier. Additionally, numerous benefits of this pouch are identified below:
Brand: Extends the category, holistic packaging design, maintains and builds on the Daisy brand essence and equity, offers a new package format for expansion and category growth. Consumer: Convenience, easy to use, easy to store, no mess, no added utensils required, enhanced usage occasions.
Quality: No drip and no mess, tamper evident features, enhanced shelf life, no drip due to package orientation, enhanced shelf life and reduced contamination due to no need for utensils. Technical: Patented package and closure, in-house form/fill/seal processing, no drip squeeze closure. Sustainability: Light weight, food waste minimization, no additional utensils needed to be cleaned.
Consumer Drivers and Implications Figure 2-7 shows some of the key consumer drivers and their packaging implications. With the implications, come many opportunities. Figure 2-7. Consumer Drivers & Packaging Implications
Source: PTIS As millennials become the most prominent buying power group, the importance of collaboration, cause marketing, and sustainability and environmental concerns will grow and afford many new packaging opportunities. For example, as consumers become more time stressed companies are providing more convenient solutions that are easier to use and create less mess.
17
Retail Drivers and Implications While there are many significant changes and challenges ahead for retail, the two most prominent ones are the growth of both e-commerce and private brands. These two alone provide an array of issues and opportunities. Private brands are continuing to grow with premium segments using enhanced packaging over branded products. Significant growth will continue in the e-commerce channel creating the need for new packaging opportunities at traditional retail to regain share. E-commerce is still in its infancy and is expected to grow from $US 2.29T (2017) to $US 4.8T by 2021 (eMarketer 2017). Packaging will offer numerous solutions to various parts of the value chain from delivering easier to use products that are well protected through distribution to better distribution that optimizes weight and package/product dimensions for cost and efficiency. Sustainability Drivers and Implications This report is focused on flexible packaging and sustainability so only a few comments will be made here. Many would agree that today’s business focus on sustainable packaging in the U.S. grew out of the Walmart Packaging Scorecard back in 2005. Much of the early focus was on package component elimination, new format growth (mostly for light weighting) and greenhouse gas/carbon footprint reduction. Sustainability has moved from these low hanging fruit initiatives towards bigger system challenges, which are depicted in Figures 2-8 and 2-9 and will be discussed in more detail throughout this report. Figure 2-8. Sustainable Packaging Journey
Source: PTIS Suffice it to say, for many reasons noted previously and throughout this report there will be a significant increase in attention toward more sustainable packaging over the next decade in the U.S. Figure 2-8 describes the journey from Low Hanging Fruit to today where we are considering “Bigger Systems” that will take packaging to a new and more sustainable level. In this journey, many best practices will come from Europe, Asia, and by leading corporations and non-profit organizations. Science and Technology Drivers and Implications Much of the science and technology that is applied to packaging had its roots developed from more fundamental science and technology materials research. As can be seen in Figure 2-10, physics, chemistry, material science, nanoscience, electro chemistry, green chemistry, and more have all contributed to the growth of new packaging materials, components, containers, equipment and systems.
Source: PTIS The future of the Internet of Things (IoT) - artificial intelligence and robotics will aid in taking packaging science and technology to the next level. The movement to industry 4.0, which is the connected machines/robots that communicate with each other to optimize operational efficiency and predict issues before they occur, will play a significant role in enhancing efficiency and effectiveness of packaging and packaging systems for the future. New science will deliver new package functionality. For example, by looking at nature (Lotus leaf) and understanding its tendency to repel water, new surface coatings have been developed for packaging that allow 100% product removal (sauces and glue for example) and deliver reduced product waste. Looking Forward The marriage and collaboration of drivers, macro/mega-trends and insights along with significant population and packaging growth will necessitate the need for enhanced focus on packaging and the environment for the global packaging economy. As flexible packaging grows, the FPA and its stakeholders look to continue to make packaging sustainability a key priority.
20
Acronyms – Chapter 2
B Billion IoT Internet of Things PPP Purchasing Power Parity S&T Science & Technology T Trillion $US United States Dollars ($)
References and Sources: Bertrand Connolly, Kate. “Daisy adds flexible packaging to its sour cream lineup,” Packaging Digest. Oct. 9, 2015, http://www.packagingdigest.com/flexible-packaging/Daisy-adds-flexible-packaging-to-its-sour-cream-line-up1510 Boumphrey, Sarah and Brehmer, Zandi. “Mega-Trend Analysis and its Impact on Innovation.” Euromonitor International. November 2, 2017. Dussimon, Karine. “Global Flexible Packaging: Winning Strategies in the Future Retail Marketplace.” Euromonitor International. September 2017. eMarketer. “Worldwide e Commerce Estimate Report 2016-2021.” www.eMarketer.com. Groopman, Jessica, Lieb, Rebecca, Owyang, Jeremiah and Szymanski. “Three Macrotrends Impacting the Journey to 2030.” Kaleido Insights. October 4, 2017 Richmond, Michael, Bukowski, Todd and Mahaffie, John. “The Future of Packaging: 2016-2026.” PTIS and Leading Futurists. January - October 2016.
21
Chapter 3
Flexible Packaging – Benefits and Sustainability Overview
Introduction In the previous section, a number of consumer trends that impact packaging was described, including Taste/Performance, Convenience, Value, and Variety. The real value of flexible packaging comes from the benefits it provides around these trends. For example, product taste along with extended shelf life can be enhanced through processing technologies such as high pressure processing (HPP), which often utilizes flexible packaging due to its ability to withstand high levels of pressure. Another example of taste/performance includes meat packed in modified atmosphere packaging (MAP) (see photo the right), where the shelf life for the meat can be extended from two days, up to 21 days, without the use of preservatives. Table 3-A provides just a few examples of consumer benefits enabled through the use of flexible packaging: Table 3-A. Flexible Packaging Consumer Benefit Examples
Consumer Benefit
Technology/Flexible Packaging Example Example
Portability Lightweight, easy to pack, on-the-go consumption, can withstand pressure in a bag and not burst.
Cooking/ micro-wavable
Ability to cook inside the pouch, without the need for other utensils or cooking pots & bowls.
22
It is important to remember that while sustainability is an important attribute to consider when selecting an appropriate package, it cannot be considered alone and must be thought of more holistically through the product and package life cycle. Holistic Packaging Design (HPD) includes developing the many attributes and benefits previously described, while also building and incorporating sustainable packaging elements early in the process. The majority of the carbon footprint of a package is locked in at the package selection point. The following will discuss sustainability at a very high level, and then delve into more specific attributes for flexible packaging.
Reclose/ Easy Open
Many flexible packages today use easy open or reclose features such as with shredded cheese, to keep unused food fresh without the need to use another container between uses.
Less material to landfill
Flexible packaging is much less bulky when disposed, and being lightweight leads to less trash, and material to landfill.
Freshness Vacuum packed, Modified Atmosphere Packaging, High
Pressure Packaging (ex. fresh avocado), extends shelf life without the use of preservatives.
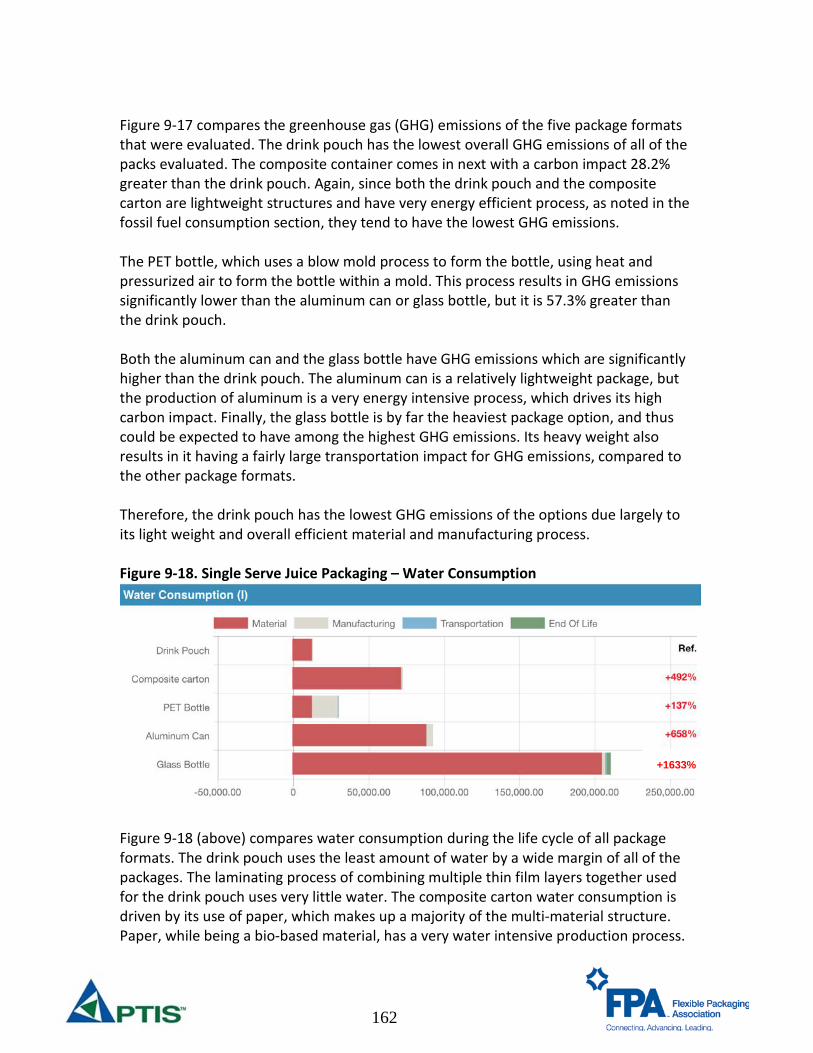
E-commerce protection and returns/ size optimized e-commerce packaging
Flexible packaging can be used to cover and protect products shipped via e-commerce, without the need for an overbox for some product categories. Additionally, some product categories, like clothing and shoes, may have return rates up to 50%. Easy open and reclosable flexible packaging options enable fast, easy, safe returns for consumers and retailers without new packaging.
23
Sustainability – An Introduction The most widely used definition around sustainability and sustainable development was set in 1987 by the Brundtland Commission of the United Nations (UN). It said: “Sustainable development meets the needs of the present without compromising the ability of future generations to meet their own needs”
(UN 1987 World Commission on Environment and Development) This means that business, governments, and societies of today have a responsibility to use resources as efficiently as possible to ensure that future generations will have access to resources as well. A second important component of sustainability is the concept of “The Triple Bottom Line.” Companies need not only consider the financial or economic bottom line, but also the impacts of their business on the environment or planet, as well as on society or
people. In order for companies to continue to thrive and provide jobs, they need to earn an economic profit. Without a profit, companies will not stay in business and employees will lose their jobs. The environmental component of sustainability is what many people consider when thinking of sustainability. This includes the impacts to water, air, and land when bringing a product to market, and ultimately its end of use.
Finally, the social aspect considers impacts of a company
or product on society. Companies provide benefits to society through employment, philanthropy, and education, among many others. Thus, any company that truly wants to be sustainable must consider the Societal, Environment, as well as Economic (or People, Planet, Profit) elements of their business.
People(Social)
Planet(Environment)
Profit(Economic)
Figure 3-1. Triple Bottom Line
Sustainability
24
Additionally, new frameworks related to sustainability are always being developed, and can have business, legal/regulatory, and societal impacts. Two examples of these are the frameworks for Circular Economy (CE) and Sustainable Materials Management (SMM). A Circular Economy focuses on keeping materials in circulation for reuse/recycling. SMM refers to the use and reuse of materials in the most productive and sustainable way across their entire life cycle. SMM focuses on conserving resources and reducing waste to minimize the environmental impacts of the materials. Both of these frameworks will be covered extensively in Chapter 4.
Current Situation What is Flexible Packaging and What is the Market? This report focuses on flexible packaging and its impacts on sustainability, particularly from a U.S. perspective, though global data and context are utilized to provide a broader picture. Flexible packaging is defined as a package whose shape is not rigid and can be easily changed, when filled and during use. It includes packaging utilizing paper, plastic, film, foil, metallized or coated papers, and any combination of these materials.
One of the key functions of a package is to contain and protect the product by creating an effective barrier between the product and the environment to prevent the product from becoming waste. As such, it is an integrated part of the product and used to preserve product freshness, extend its shelf life by protecting it from potentially damaging environmental factors such as light, oxygen and moisture, which could affect the quality and the taste of food.
Table 3-B. U.S. Flexible Packaging Industry Segments
This report will focus on the segment of the industry that adds significant value to the flexible materials, usually by performing multiple processes such as printing, laminating multiple layers, and adding coatings, all of which aid in performance of the material and/or extend the shelf life of the product. This segment of the flexible packaging industry is estimated to be about $US 23.5 billion for 2016 (see Table 3-B), and does not include retail shopping bags, consumer storage bags, or trash bags. Globally, flexible packaging is estimated to be about an $US 86 billion industry, with North America
Other Poly Bags and Wraps $1.5 Total Flexible Packaging $30.2
Source: State of the U.S. Flexible Packaging Industry – Industry Report 2017, FPA
25
making up about 27% of the global market for flexible packaging (the U.S. is approximately 25% of the global flexible packaging market). Table 3-C. U.S. Flexible Packaging End-Use Segments
The food market makes up nearly half of U.S. flexible packaging sales, with a number of other segments such as beverages, pharmaceutical, personal care, and pet food all with over one and a half billion dollars annually. Figure 3-2. Total U.S. Packaging Market Segment % Breakdown by Segment
Source: U.S. Census Bureau and FPA State of the U.S. Flexible Packaging Industry – Industry Report 2017, FPA
Corrugated , 22%
Flexibles, 19%
Others, 16%
Misc Rigid Plastic & Bottles, 16%
Paperboard, 13%
Metal Cans, 11%Glass , 3%
U.S. Flexible End-Use Segments Sales ($US Billion) Food $14.9 Beverages $2.7 Medical & Pharmaceutical $2.7 Consumer Products $2.4 Personal Care $1.8 Industrial Applications $1.8 Pet Food $1.5 Other Non-Food $1.5 Tobacco $0.9 Total Flexible Packaging $30.2
Source: FPA State of the Industry and Industry-Wide Converter Surveys
26
Flexible packaging represents approximately 19% of the total $164 billion U.S. packaging industry (by sales dollars), making it the second largest packaging segment behind corrugated paper, and just ahead of rigid plastic bottles and other miscellaneous packaging formats. Based on both consumer, cost, and environmental benefits, flexible packaging’s share of the U.S. packaging market has grown from 17% in 2000, to 19% today. Figure 3-3 shows that Asia Pacific is the largest market for flexible packaging, accounting for 41% of industry sales. North America is the second largest market for flexible packaging at about 27% of industry sales. As can be seen, flexible packaging is a packaging format that is widely used across the globe.
Figure 3-3. Global Flexible Packaging Sales by Region, 2016
Source: PCI Films Consulting, Flexible Packaging Europe – Presentation at FPA Annual Meeting, 2017
Types of Flexible Packaging: Flexible packaging can also be grouped into four broad categories, each with their own use case and benefits. These are described in Table 3-D.
Asia Pacific, 41%
North America, 27%
Europe, 21%
C & S. America, 6%
Africa/ Middle East, 5%
27
Table 3-D. Flexible Packaging Categories Category Description Example Photo Multi-material laminates and films
Multiple thin layers added to each other to meet complex product packaging requirements with highly engineered materials. Goal is to provide the optimal protection for the product, extending shelf life and reducing product waste.
Chip bags, soup pouches, baby food pouches
Polyethylene (PE) retail bags and films
Single layer PE films. Usually used to hold items in place, that do not require good barrier protection.
Grocery bags, flexible overwraps (paper towel, napkins, water bottles, etc.)
Predominantly polyethylene laminates
Multiple layers of PE to provide strength and some barrier protection.
Cereal liners, some detergent pod pouches
Non-polyethylene single-material films and bags
Examples include paper, foil, and other materials.
Tortilla chip bags, some yogurt cup lidding
Source: FPA State of the U.S. Flexible Packaging Industry – Industry Report 2017 Multi-material flexible packaging consists of a number of thin layers that usually use an adhesive to combine the structure. Using these thin layers, each with specific strength, printing, operations, moisture, and oxygen barriers, allow much less material to be used than through use of any single material, which would likely not meet the performance needs of the product packaging.
28
Figure 3-4. Multi-layer Flexible Packaging Example (from Dow) Figure 3-4 shows an example of a multi-layer flexible package. The example shown utilizes seven layers, though the same principle of using any number of layers from 2 on up (some structures may use eleven layers) based on the product packaging needs. In this example, the first layer is a sealant layer which allows the package to be heated, melting the inside layer of the package, creating a strong bond to form the package. Layers 2 and 6 are for toughness or processing, giving the package the form to run through packaging equipment, as well as prevent any abrasion or puncture for some products such as nuts or coffee beans. Layers 3 and 5 are adhesive layers that go around the barrier layer (4), which has the oxygen and moisture barrier necessary to protect the product inside and extend shelf life. The outer layer (7) includes the graphics and coating necessary to protect the package from developing scuffing or holes during transportation. By combining all of these thin layers, flexible packaging is able to provide superior product protection, with a minimal amount of resources used. Flexible Packaging – Sustainability Benefits: The packaging industry, as a whole, has been working to reduce its environmental impact through initiatives such as lightweighting, use of life cycle assessment tools to quantify impacts (i.e., fossil fuel, greenhouse gases, water consumption, etc.), exploring novel materials such as biobased polymers, and extending the shelf life of products to reduce overall product and food waste to enhance the sustainability profile for flexible packaging solutions.
29
Figure 3-5. Importance of Sustainability in Packaging Decisions A 2017 study from the Sustainable Packaging Coalition and Packaging Digest showed that most industry survey respondents feel that sustainability has never been more important in packaging (see Figure 3-5). This shows that members of the packaging community continue to believe sustainability is an increasingly important consideration in the packaging development process. Flexible packaging results in a number of sustainability benefits throughout the entire life cycle of the package. Many of these benefits are highlighted in Table 3-5: Table 3-E. Flexible Packaging Sustainability Benefits
Flexible packaging usually weighs much less than other materials, providing source reduction (top component for U.S. EPA Waste Hierarchy)
Transportation Lightweight, shipped on a roll, can be large benefit vs. rigid materials
Flexible materials are usually shipped either flat, or on a roll (like paper towel). This allows a large number of packages to be shipped on a truck, reducing the number of trucks needed for inbound materials vs. rigid packaging
Transportation/ Consumer usage
Product protection/ Breakage reduction
Flexible packaging offers product protection, keeping products together to reduce spoilage. Additionally, the ability of flexibles to resist denting/breakage without spilling contents makes them attractive for e-commerce shipping
Consumer Usage Extended shelf life
Value added flexible packaging for food often contains a barrier layer
30
that extends the shelf life of food, reducing the amount of food waste.
End of Life Reduced materials to landfill
As flexibles are very light vs. other package formats, even with no recycling of multi-material films, they still have less material sent to landfill vs. other formats. Additionally, structures made from all PE such as overwraps and grocery bags can be recycled at front of store recycling drop off locations.
End of Life Waste-to-Energy potential
Where facilities are available, flexible packaging can be used as an energy source in waste-to-energy facilities and has a high BTU value.
Overall Life cycle approach (Lower fossil fuel, greenhouse gas (GHG) and water use)
The use of life cycle assessment tools has shown that flexible packaging usually results in less fossil fuel usage, greenhouse gas emissions, and water use than other formats due to its very light weight (source reduction).
Overall Product-to-package ratio
A measure of material efficiency is how much of a product sold to the consumer consists of product and how much packaging by weight. Flexible packaging almost always has a higher product-to-package ratio than other packaging formats.
All of the benefits listed above will be addressed in much more detail in other parts of this report. Flexible packaging producers have also been making progress in reducing “net scrap” or the amount of material sent to landfill from operations after recycling, reuse, and reprocessing. According to the Flexible Packaging Association’s State of the Industry Survey in 2017, converter supplied data on the “net scrap” generated at their facilities is about 3.5% of materials used. Where ever possible, flexible packaging (and all packaging converters) look to recycle any material scrap back into their process and use for new packaging. The goal is to drive toward zero manufacturing waste.
Flexible Packaging – Sustainability Challenges The largest challenge with flexible packaging today is the lack of recycling options for multi-material films, such as potato chip bags and metalized or foil pouches (such as
31
drink pouches and baby food pouches), which are difficult to separate into their various material substrates. The characteristics of strength, barrier, and limited use of resources applied through the use of multiple thin layers of film make recycling and separating multi-material structures more challenging than other package formats, which can often be comprised of a single layer of material, such as PET used for water bottles. Additionally, since flexible pouches are so light, it takes a large number of them to be collected in bulk quantities necessary to drive economic benefits for recyclers. From an economic standpoint, it is much easier and more profitable for recyclers to collect and bale heavier materials that are more easily sorted than flexible packaging. Investment dollars for recovery infrastructure improvement typically flow to where the greatest economic benefit can be derived, such as better collection and sorting of heavier materials such as steel, aluminum, and paper, as well as PET and HDPE plastics. Like all packaging, if not properly disposed of by consumers, flexible packaging can end up as litter or marine debris, where it is very difficult to collect. This is an example of how consumer education about proper disposal of packaging waste is needed in order to drive consumer behavior. Finally, raw material suppliers and flexible packaging converters are developing packaging structures that are multi-layer, but made entirely of polyethylene (PE), which allows them to be recycled as part of the How2Recycle grocery store bag drop-off program. The program allows consumers to place other all-PE flexible wraps such as dry overwraps for napkins and paper towels as well as bread bags in grocery store bag bins (usually in front of a store) for recycling. Chapter 4 of this report will review additional new programs and technology investments that are driving toward improved collection and recovery of flexible packaging. Future Situation The general trend by brands and packaging developers has been toward increased use of flexible packaging. As mentioned earlier, the overall share of packaging sales in the U.S. has increased from 17% in 2000, to 19% in 2016, and continues to increase. This is driven largely by both the environmental and economic sustainability benefits of flexible packaging, including alignment with consumer trends. Some of the key consumer trends important to flexible packaging are: • Portability/convenience – reclose features, zipper, microwavability, ease of
opening, portion control. • Safety – product protection through hermetic seals, lack of breakage.
Figure 3-6. Example of Store Drop-off designation as part of the How2Recycle program
32
• Value – multiple sizes and price points; used on a wide range of products from low cost to high end products.
Future Drivers/Direction for Flexible Packaging Flexible packaging has a number of positive sustainability attributes that point to continued widespread use. The components below will highlight specific areas anticipated to result in future impacts for flexible packaging. Optimal use of packaging resources Flexible packaging allows for an optimal use of packaging resources. The chart to the right was developed as part of the Consumer Goods Forum Global Protocol on Packaging Sustainability 2.0 project. It shows the optimal package design utilizing the minimal amount of material that is needed to protect the product from damage, while also having the smallest amount of environmental impact across both the package and product together. Flexible packaging helps meet this criteria for many products, via benefits identified in Table 3-E. Thus, it is anticipated to continue to grow in use. e-Commerce Growth As more commerce and sales go through e-commerce channels, companies are looking at ways to reduce the amount of air and packaging shipped. Flexible packaging offers the ability to effectively wrap, protect, and conceal products, while minimizing air space around the product, resulting in lower shipping costs.
Figure 3-7. Packaging Optimization Curve, The Consumer Goods Forum
33
Food Waste Reduction Approximately one-third of all food produced is disposed of before it is consumed, resulting in 1.3 billion tons of food thrown out annually. Food waste is also a major contributor to global greenhouse gases and is a large contributor of methane gas at landfills. Packaging, in general, and flexible packaging in particular can help reduce food waste through methods such as portion control (to prevent overuse and waste) and extending food shelf life. Previous studies, highlighted in Figure 3-8, have shown flexible packaging increasing the shelf life of a number of products. When considered using a life cycle approach, there is great benefit to using packaging to reducing overall food waste and carbon impact. Figure 3-8. Shelf Life Extension Through Flexible Packaging
Additionally, there will be opportunities for compostable flexible packaging which can be used within foodservice areas, where packaging with food contamination can be composted with food waste. Carbon Impact The focus on carbon dioxide emissions reduction is a major component of the Paris Climate Accord. Businesses are frequently looking at ways to reduce carbon emissions either to limit carbon taxes, reduce overall business costs, and achieve corporate sustainability objectives. Walmart is an example of a company trying to limit carbon impact through their Project Gigaton initiative, calling for a reduction of one gigaton of carbon dioxide in their supply chain by 2030. As shown in many life cycle analyses,
34
flexible packaging, typically results in lower carbon impact than other packaging formats. Life Cycle Analysis Tools As the focus on carbon emissions increases, the need for better quantification of carbon impact through quick life cycle analysis tools such as EcoImpact-COMPASS® or the Packaging Impact Quick Evaluation Tool (PIQET) will grow. These tools allow quick comparisons on fossil fuel usage, greenhouse gas emissions, and water use among other sustainability measures for different packaging formats. While these tools do not select a “best” package, they can be used show the benefits of flexible packaging, when considering a range of environmental parameters. All of the future drivers/directions point to increased use of flexible packaging over the next decade. However, the flexible packaging industry will need to address many of the following future needs and challenges in an effort to maintain positive momentum. Future Expectations Some of the key challenge and opportunity areas that will be expected by the flexible packaging industry in the future include:
• Increased demand for recycling technologies. • Increased demand for recyclable flexible packaging design. • Selection of materials with the lowest environmental impact – by carbon
footprint, material to landfill, recyclability, etc. • Optimal use of materials for product protection. • New solutions in emerging sectors such as e-commerce which reduce air and
packaging material used. • Support for increased collection of flexible materials. • More compostable structures, largely for foodservice. • Reduction in food waste through packaging. Tools and metrics that will help
measure the positive impact of packaging. • Increased development of biobased/renewable feedstocks. • Use of recycled content (not necessarily for food applications). • Short to midterm collection technologies to reduce packaging to landfill (and
litter/marine debris) such as waste-to-energy.
Figure 3-9. Example of GHG Emissions output from EcoImpact-COMPASS® tool
35
Conclusion/Forward View Flexible packaging offers a number of sustainability advantages across the entire packaging value chain including transportation benefits, high product-to-package ratio, and life cycle analytics demonstrating reduced carbon, greenhouse gas emissions, and water use, versus other packaging formats. The lightweight nature of flexible packaging results in the optimal amount of packaging being used with the least amount of resources necessary to protect the product. At the end of life, flexible packaging typically results in the least amount of material to landfill, while also offering up the ability for single layer PE films to be recycled or multi-layer structures used in a waste-to-energy facility. Flexible packaging use is growing and is positively positioned to continue hitting on key consumer trends, as well as future hot button topics such as e-commerce, food waste reduction, and carbon reduction opportunities. Challenges remain for flexible packaging in material collection and recycling. Industry initiatives are regularly being added and enhanced to improve recycling, test new material and processing technologies, and increase consumer collection through the grocery bag store drop off programs and application of the How2Recycle icon to packaging graphics. Additional consumer education and investment in new recovery technologies, including in emerging markets are needed to drive appropriate disposal behavior and prevent liter and marine debris. In conclusion, flexible packaging offers optimized product protection with the minimal amount of materials used, along with a number of other sustainability benefits when considered holistically.
36
Acronyms – Chapter 3
CE Circular Economy GHG Greenhouse Gas HPD Holistic Packaging Design MAP Modified Atmosphere Packaging PE Polyethylene PET Polyethylene Terephthalate (labeled as #1 plastic) PIQET Packaging Impact Quick Evaluation Tool SMM Sustainable Materials Management UN United Nations USD United States Dollars ($)
37
References and Sources: “About MultiMaterial Packaging.” Multi-Material Flexible Packaging Recovery, multi-materialflexiblerecovery.squarespace.com/about/. “Flexible Packaging Market - Forecasts from 2017 to 2022.” Research and Markets - Market Research Reports - Welcome, Jan. 2017, www.researchandmarkets.com/research/m9rwhf/flexible. Framing Sustainable Development, The Brundtland Report – 20 Years On. United Nations, Apr. 2007, www.un.org/esa/sustdev/csd/csd15/media/backgrounder_brundtland.pdf. Global Protocol on Packaging Sustainability 2.0. Consumer Goods Forum, 2011, www.theconsumergoodsforum.com/wp-content/uploads/2017/11/CGF-Global-Protocol-on-Packaging.pdf. Keane, Alison. “Flexible Packaging: State of the Industry Report.” AIMCAL R2R Conference USA 2017, 17 Oct. 2017. Kingsbury, Tony. “Packaging's role in Walmart's Project Gigaton.” GreenBiz, GreenBiz Group Inc., 16 Oct. 2017, www.greenbiz.com/article/packagings-role-walmarts-project-gigaton. Pierce, Lisa McTigue. “8 sustainable packaging hits of 2017.” 8 sustainable packaging hits of 2017 | Packaging Digest, Packaging Digest, 21 Dec. 2017, www.packagingdigest.com/sustainable-packaging/8-sustainable-packaging-hits-of-2017-2017-12-21/page/0/3. Smith, Roff. “How Reducing Food Waste Could Ease Climate Change.” National Geographic, National Geographic Society, 23 May 2016, news.nationalgeographic.com/news/2015/01/150122-food-waste-climate-change-hunger/. “Triple bottom line.” The Economist, The Economist Newspaper, 17 Nov. 2009, www.economist.com/node/14301663. Tullo, Alexander H. “The cost of plastic packaging.” CEN RSS, 16 Oct. 2016, cen.acs.org/articles/94/i41/cost-plastic-packaging.html. Walmart Launches Project Gigaton to Reduce Emissions in Company's Supply Chain. Walmart, 19 Apr. 2017, news.walmart.com/2017/04/19/walmart-launches-project-gigaton-to-reduce-emissions-in-companys-supply-chain.
Circular Economy & Sustainable Materials Management Introduction/Background: As industries, including packaging, look to become more efficient in their use of resources and limit waste, a few frameworks are starting to take hold that will provide a backbone for a company’s sustainable packaging vision, going forward. The frameworks are Circular Economy (CE) and Sustainable Materials Management (SMM). While the terms Circular Economy and Sustainable Materials Management are meant to be applied across a variety of industries, they certainly apply and are often considered in the context of packaging. Both look to limit waste, but the principles behind them are quite different and often confused. In this chapter, we will look to explain the definitions of both, their similarities, differences, and how flexible packaging can play a key role in both areas. What is Circular Economy (CE)? According to the UK Group WRAP (Waste Resources Action Programme), the Circular Economy is defined as: “A circular economy is an alternative to a traditional linear economy (make, use dispose) in which we keep resources in use for as long as possible, extract the maximum value from them whilst in use, then recover and regenerate products and materials at the end of each service life.” - Waste Resources Action Programme (WRAP, UK)
In principle then, CE really focuses on recycling. For packaging, this will generally mean recycling or composting – recycling focuses on the technical materials side, while composting focuses on the biological materials side. Figure 4-1 shows a depiction of CE principles, from both a biological (left side of diagram) and technical materials (right side of diagram) perspective. Additional business models enabled through the CE framework include re-using, repairing, refurbishing, and recycling existing materials and products. Think of CE as a regenerative process. Both the European Union and China have developed policy frameworks focused on the adoption of CE principles.
40
Figure 4-1. Circular Economy Framework
Source Kaplan Business School Australia
What is Sustainable Materials Management (SMM)? The other widely cited framework is SMM. According to the United States Environmental Protection Agency (U.S. EPA):
SMM is the “use and reuse of materials in the most productive and sustainable way across the entire lifecycles by minimizing the amount of materials involved and minimizing associated environmental impacts.” – U.S. EPA
Related specifically to packaging, the U.S. EPA also says that “encouraging the shift in packaging construction towards more lightweight or efficient materials helps companies save money while decreasing the amount of waste generated when the packaging is discarded.” This system also focuses on lowest carbon impact.
41
The U.S. EPA has also embraced SMM as their primary model focused on sustainable development. Comparison between Circular Economy and Sustainable Materials Management While the goals of both CE and SMM are to ultimately utilize resources more effectively, they go about it in a very different way. Table 4-A below, adapted from Ameripen’s report “Maximizing the Benefits of Circular Economy and Sustainable Materials Management Models for Product-Packaging Systems,” highlights some of those differences. (For a full view of the table, please refer to the Ameripen report referenced in the appendix) Table 4-A. Comparison between CE and SMM
Circular Economy Sustainable Materials Management
Waste Definition Direct material use – preservation of materials used in production
All externalities associated with material use – preservation of natural capital
Key Metrics Focus on material use and reuse:
- Reuse - Recycled content - Duration of use
Focuses on cumulative impact of material consumption. Some metrics include:
- GHG emissions - Soil & water quality - Toxicity
Design Focus Recover, reuse, refurbishment, products as a service
Source reduction, design for recovery, integrated systems
Forward Vision Production & consumption cycles Evaluate & design within a system Aspirational/Future state
Extraction, production, consumption cycles Evaluate & design across the lifecycle Current state
According to a presentation by Adam Gendell, Senior Director of the Sustainable Packaging Coalition, a more simplistic way to think of the differences between the two systems are:
Current Situation Circular Economy Currently, both Circular Economy and Sustainable Materials Management frameworks are being used and recommended for policy by different groups, encompassing private/ public companies, non-governmental organizations (NGOs), as well as public policy makers.
Circular Economy principles and policies are being touted by the European Commission in the European Union (EU), as well as in China under their Circular Economy Promotion Law for regulatory guidance. The basic framework behind both of these policies is to focus on collection of packaging for recycling. The European Commission statement claims, “Although waste management in the EU has improved considerably in recent decades, over a quarter of municipal waste is still landfilled and less than half is recycled or composted, with wide variations between Member States….As part of a shift towards a circular economy, the European Commission made four legislative proposals introducing new waste-management targets regarding reuse, recycling and landfilling, strengthening provisions on waste prevention and extended producer responsibility, and streamlining definitions, reporting obligations and calculation methods for targets.” An agreement is calling for 65% of all packaging to be collected for reuse or recycling by 2035 for all member states. The current target rate is 50%. As a whole entity, Europe had a current overall recycling rate for packaging of 65% in 2014, with not all member states meeting the goal.
An additional driver for CE programs will focus on concern about marine debris and impacts on the ocean. While there have been some proposals to address the issue locally in a few U.S. states, the bulk of marine debris comes from emerging countries that do not yet have a fully developed recovery infrastructure to handle waste, much less a recycling system. According to a study by the Ocean Conservancy, over 60% of all marine debris in the oceans comes from five Asian countries - China, Indonesia, the Philippines, Thailand, and Vietnam. This has been driven by sales of products that meet the consumer’s desire for conveniences and goods sold in the developed world. However, the recovery infrastructure in these countries has not kept pace. It is apparent that marine debris and strategies to reduce its impact will continue to be a focus in the upcoming decade.
43
Sustainable Materials Management (SMM) Meanwhile, the U.S. Environmental Protection Agency, as well some states such as Oregon and Maryland, are focusing on a SMM framework for their waste reduction goals. The U.S. EPA Advancing Sustainable Materials Management Report, published in June 2015 says:
“We are transitioning from focusing on waste management to focusing on Sustainable Materials Management. SMM refers to the use and reuse of materials in the most productive and sustainable way across their entire life cycle. SMM conserves resources, reduces waste, slows climate change, and minimizes the environmental impacts of the materials we use.”
- The U.S. EPA Advancing Sustainable Materials Management Report, June 2015
The U.S. EPA is making a large push for SMM principles in packaging and has identified packaging as one of five key industries where they are promoting the use of SMM through education and outreach programs in order to drive more sustainable options.
Circular Economy & Sustainable Materials Management – Working Together While the CE and SMM frameworks may be viewed as different and distinct programs, they can indeed and often do work in concert together. There are instances where companies may use both principles as part of their sustainable packaging toolkit. An example of a company utilizing both CE and SMM principles is Walmart with their Sustainable Packaging Priorities, published in October 2016 as part of their Sustainable Packaging Guidebook. In the Guidebook (available here – see Figure 4-2) Walmart identified a number of initiatives such as “maximizing recycled content” and “design for recyclability” which align closely with CE principles, while other goals such as “reduce materials” and “enhance material health” are very much SMM principles.
Additionally, Walmart has also announced a broad reach goal to remove 1 gigaton (1 billion tons) of carbon dioxide from their supply chain by 2030, called Project Gigaton. This bold goal will have a number of SMM type principles that will likely dramatically impact packaging. Some potential examples include:
• Transportation benefits – inbound and outbound packaging benefits • Carbon impact of a particular package format • Food waste reduction through packaging
Flexible packaging has an opportunity to play a major role in each the above implications for Project Gigaton. For instance, regarding inbound transportation benefits, flexible packaging typically arrives in a round roll or flat format versus rigid packaging, which are fully formed and shipped empty. Flexible packaging generally enjoys an inbound shipping advantage of 15-25:1 versus rigid packaging. This means that it often requires 15 trucks to ship the same number of inbound rigid packages to be filled as can be achieved through a single truck carrying flexible packaging. Additional benefits of flexible packaging often include a carbon impact reduction (see Chapter 8 - Lifecycle Assessment - Flexible Packaging Case Studies, for a number of examples) and the ability of packaging to reduce food waste (and greenhouse gases) through enhanced shelf life and other packaging technologies.
45
Flexible Packaging and Food Waste One of the major contributors to greenhouse gas emissions is emission of landfill methane resulting from rotting food waste. Global food waste, if it were a country, would be the third largest contributor to greenhouses gases, behind only China and the U.S. Studies from the United Nations have cited that about one-third of all food produced for human consumption is wasted, in both developed and developing counties. Many governments, including the U.S. through the EPA, have set goals to reduce food waste over the next decade. The EPA, for instance, has established a goal to reduce food waste by 50% (from a 2015 baseline) by 2030 through voluntary programs.
One way the EPA is looking to drive food waste reduction is through education and outreach. As part of this program, the EPA held a webinar in 2015, providing examples of how packaging can play an important role in reducing food waste by extending the shelf life, providing convenience features, and using technologies such as modified atmosphere packaging (MAP), active packaging (oxygen scavengers which reduce oxygen in food headspace), and freshness indicators to limit food waste impacts. An example of shelf life extension through the use of MAP is shown below in Figure 4-3.
Figure 4-3. Example of Product Shelf Life – Comparing Modified Atmosphere Packaging (MAP) vs. Non-MAP
Source: EPA.gov – “Reducing Wasted Food: How Packaging Can Help”
Other government agencies, such as the Waste Resources Action Programme (WRAP) in the UK have commissioned studies looking at how consumer perceptions of food waste and packaging may be misaligned, in that consumers only see the packaging waste at the end of product use, but do not consider the impact of cultivation, water, land, and transportation energy that is required to bring food products to their plate.
46
The Sustainable Packaging Coalition says, “The rule of thumb for a packaged food product is that packaging comprises around 10% of the overall carbon footprint” for many products. Consumers tend to believe that packaging has a much larger impact on a products overall carbon impact than the product, whereas in most cases packaging tends to have a much smaller impact. As a result of the WRAP study Consumer Attitudes Toward Food Waste and Food Packaging the group started a new initiative called Fresher for Longer, which shows the important relationship that packaging can play to help reduce food waste. Some examples WRAP cited in their consumer communication campaign included not storing bread in the fridge, where it goes stale six times faster, and that by storing apples in the fridge in their original packaging, they can stay fresher for up to two weeks longer (see Figure 4-4). Figure 4-4. Example of Shelf Life Extension of Food Through Packaging as part of Love Food, Hate Waste Campaign (UK)
The reason that food waste is brought up in the CE and SMM part of this report is to highlight the impact of food waste as well as how packaging can play a positive role when the entire food system is taken into account. Packaging, and certainly flexible packaging, can have a dramatic impact on overall waste and subsequent carbon impact when overall food waste is considered. When packaging and food waste are composted, they are part of CE. When packaging helps to extend shelf life and reduce overall food waste they are enabling SMM. As food waste becomes a large policy focus, it will be important to consider the contributions and benefits resulting from appropriate packaging technologies.
How much longer does packaging make food last?
Stored in original packaging
Stored naked
% of people think fruit and veg goes off quicker in its packaging
% know that storing food in its original pkg will keep it fresher for longer
47
Forward View Terms such as recyclable, lightweighting, and sustainability have entered the packaging lexicon in the past decade; CE and SMM principles will certainly follow in the upcoming decade. They will be part of the process that packaging developers use in their selection of new package materials and formats. Additionally, both frameworks are likely to be used to drive additional legislative or regulatory policy.
In its current state, flexible packaging aligns very well with SMM framework and its focus on carbon reduction of a system. However, with technology breakthroughs and focus on new waste management techniques (see Chapter 5, End of Use/Waste Management) there are a number of opportunities where flexible packaging may better align with the recycling focus found in the CE framework.
Table 4-B below highlights some examples where changes in flexible packaging may further allow flexible packaging to be optimized across both frameworks.
Table 4-B. Future CE and SMM Flexible Packaging Opportunities
Circular Economy Sustainable Materials Management Inclusion of Post-Consumer Recycled Content
Inclusion of Post-Consumer Recycled Content
Wider use of How2Recycle label program
Tools for carbon impact - packaging + food (driven by food waste)
Recyclable structures Carbon impact measurement packaging– (driven by programs carbon reduction programs such as Walmart Gigaton)
New flexible packaging recycling (mechanical, chemical) technologies
Flexible packaging recovery through energy from waste or Energy Bag® type programs (see chapter 5)
Packaging specific - Lightweighting/carbon impact reduction
From a CE perspective, the primary opportunity for flexible packaging is to enhance and drive recovery for multi-material flexible packaging. This will largely be achieved as new technologies for economic flexible packaging recovery are developed. Also, new structures that are more readily recyclable through programs, such as the Store Drop off, and communicated via the How2Recycle labeling program, will support CE efforts. Many of these technologies, as well as industry collaborative efforts such as A Circular Economy for Flexible Packaging (CEFLEX) and the Multi-Material Flexible Packaging Recovery Program (which is covered in Chapter 5 – End of Use/Waste Management for Flexible Packaging) are focused on driving more multi-layer flexible packaging collection and recovery.
Figure 4-5. Example of How2Recycle label with Store Drop-off for recyclable plastic films
48
The inclusion of post-consumer recycled (PCR) content incorporated into the film structure is an example of an initiative that hits on both CE as well as SMM principles. Using PCR content allows the reuse of material that has already been recovered and turned into a new package and supports CE principles. From an SMM standpoint, utilizing PCR often results in a lower overall carbon impact due to fewer fossil fuel/ natural gas resources used, which results in lower overall emissions. Although inclusion of PCR into films today is not widely incorporated, it is available in limited cases (i.e., Klockner Pentaplast SmartCycle® PET film) and may become more widely available in the future.
Flexible packaging is currently a positive contributor to SMM. Future enhancements will look for ways to more easily measure carbon impact of packaging through simple life cycle assessment tools such as the EcoImpact-COMPASS® software program, as well as tools that can help measure impacts of packaging in reducing food waste and the associated carbon impact. Walmart’s Project Gigaton goal will also lead to more focus on ways to reduce and measure the carbon impact of packaging – further highlighting the need for new, fast, inexpensive, and reliable tools for quantifying both packaging and food waste reduction.
The Ellen MacArthur Foundation, a group that engages with business, government and academia to foster acceleration toward a CE (with the help of the packaging industry), has placed a particular focus on the concern of marine debris and has also developed an aspirational framework called the New Plastics Economy. This framework has three main goals, which are depicted in Figure 4-6.
49
Figure 4-6. Ambitions of the New Plastics Economy (Ellen MacArthur Foundation)
The three goals of the New Plastics Economy, as envisioned by the Ellen MacArthur Foundation are:
1. Create an affective after-use market plastics economy. Essentially looking to drive more inclusion of recycled content.
2. Drastically reduce the leakage of plastics into natural systems & other negative externalities. This focuses on developing systems and policies to encourage recycling and drive the collection of materials, particularly in the developing world where collection systems may not yet exist, to be property disposed of in order to avoid litter and marine debris.
3. Decouple plastics from fossil feedstocks. This goal would be achieved through new, renewably sourced feedstocks.
50
A number of packaging companies and brand owners are engaged as part of the New Plastics Economy program, helping to identify opportunities to drive the roadmap and vision of this aspirational program.
Future flexible packaging initiatives will embed both CE and SMM principles into both packaging development and business practices. While the CE (and the New Plastics Economy) tends to be more aspiration, over the next decade there will be more of a fusion where packaging, including flexible packaging, utilizes both CE and SMM principles. Participants in the packaging value chain will be collaborating to use more CE and SMM best practices in their long-term sustainability goals and driving new technologies that further reduce environmental impacts and waste.
51
Acronyms – Chapter 4
CE Circular Economy CEFLEX Circular Economy for Flexible Packaging EPA U.S. Environmental Protection Agency EU European Union GHG Greenhouse Gas MAP Modified Atmosphere Packaging MRFF Materials Recovery for the Future SMM Sustainable Materials Management WRAP (UK) Waste Resources Action Programme
52
References and Sources: “5 countries dump more plastic into the oceans than the rest of the world combined.” Public Radio International, 13 Jan. 2016, www.pri.org/stories/2016-01-13/5-countries-dump-more-plastic-oceans-rest-world-combined
Advancing Sustainable Materials Management: Facts and figures 2013. (2015, June). Retrieved December 6, 2017, from https://www.epa.gov/sites/production/files/2015-09/documents/2013_advncng_smm_rpt.pdf
China Circular Economy Promotion Law. (n.d.). Retrieved December 06, 2017, from http://ppp.worldbank.org/public-private-partnership/library/china-circular-economy-promotion-law
Cotterman, Ron. Reducing Wasted Food: How Packaging Can Help. Epa.gov, 19 Mar. 2015, www.epa.gov/sites/production/files/2015-09/documents/cotterman.pdf
Editor, T. T. (2016, August 30). Bioplastics-where exactly are we? Retrieved December 05, 2017, from https://www.packworld.com/article/sustainability/bioplastics/bioplastics-where-exactly-are-we
“EU Reaches Agreement on Circular Economy Package, While Wales Reveals a Plan of Its Own,” http://www.sustainablebrands.com/news_and_views/next_economy/sustainable_brands/eu_reaches_agreement_circular_economy_package_while_w
Fisher, K., & Zhang, H. (2016, September 19). Maximizing the Benefits of Circular Economy Sustainable Materials Management Models for Product-Packaging Systems. Retrieved December 5, 2017, from http://www.ameripen.org/wp-content/uploads/2017/07/Maximizing-the-Benefits-of-CE-SMM-Models-AMERIPEN.pdf
Flexible vs. Rigid Packaging Flair Flexible Packaging. (n.d.). Retrieved December 07, 2017, from http://www.flairpackaging.com/pages/home/resources/packaging_101/Flexible%20vs.%20Rigid%20Packaging/1
“Food Loss and Food Waste.” Food and Agriculture Organization of the United Nations, www.fao.org/food-loss-and-food-waste/en/.
“Food packaging perception and reality.” Food packaging perception and reality | WRAP UK, 3 Mar. 2013, www.wrap.org.uk/content/food-packaging-perception-and-reality.
Gendell, Adam. “The carbon footprint's triumphant return.” Packaging Digest, Packaging Digest, 24 July 2017, www.packagingdigest.com/sustainable-packaging/the-carbon-footprints-triumphant-return-2017-07-24.
Kingsbury, T. (2017, October 16). Packaging's role in Walmart's Project Gigaton. Retrieved December 07, 2017, from https://www.greenbiz.com/article/packagings-role-walmarts-project-gigaton
Smith, Roff. “How Reducing Food Waste Could Ease Climate Change.” National Geographic, National Geographic Society, 23 May 2016, news.nationalgeographic.com/news/2015/01/150122-food-waste-climate-change-hunger/.
“Stemming the Tide: land-Based strategies for a plastic-Free ocean.” Ocean Conservancy, McKinsey Center for Business and Environment, Sept. 2015, oceanconservancy.org/wp-content/uploads/2017/04/full-report-stemming-the.pdf
Sustainable Materials Management. (2017, November 20). Retrieved December 05, 2017, from https://www.epa.gov/smm
The Circular Economy - And Three Companies Doing It Right. (2016, November 04). Retrieved December 05, 2017, from https://www.kbs.edu.au/news-and-events/blog/the-circular-economy-and-three-companies-doing-it-right/
The New Plastics Economy. (n.d.). Retrieved December 7, 2017, from https://www.ellenmacarthurfoundation.org/programmes/systemic-initiatives/new-plastics-economy
Walmart Sustainable Packaging Playbook. (n.d.). Retrieved December 6, 2017, from https://www.resource-recycling.com/images/e-newsletterimages/Walmart_Sustainable_Packaging_Playbook.pdf
WRAP and the circular economy. (2013, January 23). Retrieved December 05, 2017, from http://www.wrap.org.uk/about-us/about/wrap-and-circular-economy
Waste Management and Recovery for Flexible Packaging Introduction/Background: The collection of packaging at its end-of-use phase is critical to ensure that it does not become litter or marine debris and that the highest value possible of the material results from its collection and disposal. Packaging is an extremely visible part of any consumer purchase decision and increasingly consumers are basing that decision on both the sustainability of the product and the full life cycle of the package. Maximizing value recovery and minimizing environmental impact at the point of package disposal requires a conscious choice by the consumer. In many cases, this can be through recycling, enabling a more Circular Economy (CE) model. At other times, packaging may end up as part of the municipal solid waste (MSW) stream and be taken to a landfill. Other methods can capture the embedded energy in packaging and are used to create fuel or another energy source. All of these result in a better outcome than when MSW systems are not in place, leading to widespread liter and marine debris. Figure 5-1. U.S. EPS Waste Management Hierarchy
As part of its overall waste management strategy, the U.S. Environmental Protection Agency (U.S. EPA) has developed a Waste Management Hierarchy (Figure 5-1), which shows source reduction and reuse of materials as the most preferred waste management tool, followed by recycling and composting, then energy recovery before ultimately treatment and disposal or landfilling as the least preferred MSW method. The EPA Waste Management Hierarchy aligns with the EPA
Sustainable Materials Management (SMM) program, which prioritizes minimizing the use of packaging resources for product protection, and was discussed in-depth in Chapter 4, Circular Economy and Sustainable Materials Management. Lack of a waste management system, which is not shown in Figure 5-1, results in litter and marine debris and has a number of other externalities, or social concerns and issues. Proper and fully developed waste management systems, therefore, play an extremely important role in society. It is critical that package developers and stakeholders consider
56
package sustainability holistically, examining greenhouse gas impact, package weight, recyclability, fit within regional MSW systems, system costs, and communication to consumers, among many other brand equity considerations. This section will explore a number of municipal solid waste and recovery statistics and how the U.S. systems have evolved over time, as well as a number of current and future recycling technologies for flexible packaging.
Current Situation Municipal Solid Waste (MSW) in the U.S. The U.S. EPA has been tracking MSW generation in the U.S. since 1960. The trends show that MSW per capita peaked around 4.74 lbs./person/day in 2000 and has been slowly coming down since to 4.44 lbs./person/day in 2014, the latest published data.
Figure 5-2. U.S. MSW Generation Rates, 1960 to 2014
Source: U.S. EPA Advancing Sustainable Materials Management 2014 Fact Sheet
At the same time, recycling and composting rates in the U.S. have been climbing, reaching 34.6% in 2014 (Figure 5-3).
57
Figure 5-3. U.S. Municipal Recycling Rates, 1960 to 2014
Source: U.S. EPA Advancing Sustainable Materials Management 2014 Fact Sheet
Figure 5-4. Management of MSW in the U.S., 2014 According to the U.S. EPA, there were 258 million tons of MSW generated in 2014, with just over half of that amount (52.6%) being landfilled, 34.6% being recycled or composted, and 12.8% being managed from combustion with energy recovery.
As far as what makes up MSW in the U.S. (Figure 5-5), paper makes up the largest portion with over a quarter of MSW. Interestingly, paper also makes up nearly half of the total amount of material recycled or composted in the U.S. as well. Yard waste makes up the second largest group of materials in
MSW, with plastics as a whole, coming in third at about 12.9%. Previous work by the FPA has estimated flexible packaging to make up 1.5-2.4% of the total MSW.
Landfilled, 52.6%Recycling/
Composting, 34.6%
Combustion with Energy Recovery,
12.8%
58
Figure 5-5. Total MSW Generation by Material, 2014
When looking at Table 5-A, it is apparent that recycling and composting have become much more prevalent end of life options in the U.S. Since 2000, the amount of MSW generated has increased by 6%, but the amount of material that is recycled has increased by 25% and the amount composted has increased by 39%. This has been driven by an increase in the availability of recycling for more consumers, as well as the general move toward single stream recycling,
where all recyclable materials are placed together into a single bin.
Table 5-A. U.S. EPA Data on Generated MSW vs. End of Life Options (in millions of tons)
Source: U.S. EPA Advancing Sustainable Materials Management 2014 Fact Sheet
Comparing MSW and Recovery Around the World: It is not always easy to compare MSW and recycling rates between countries, as data and collection methods are not consistent. A recent report from the Organization for Economic Co-operation and Development (OECD) does compare recovery rates across a number of countries. Most of the countries in the following graph are developed countries, but it does show how different the MSW system can be even in countries that share a border.
Paper, 26.6%
Glass, 4.4%
Metals, 9.0%
Plastic, 12.9%Rubber,
leather, textiles,
9.5%
Wood, 6.2%
Yard trimmings,
13.3%
Food, 14.9%
Other, 3.2%
59
Figure 5-6. MSW and Recovery Rates (2013 or latest)
The recovery rates go from those countries having almost no material going to landfill such as Germany and Japan, to the other extreme such as Mexico, Chile and New Zealand, which have almost no recycling system in place. The U.S. tends to fall in the middle on the chart.
Germany has a very robust recycling program, bringing back 65% of all MSW. The remaining 35% of materials are combusted, with most of that including energy recovery in a waste to energy (WTE) facility. Japan, while also boasting very little material going to landfill, takes a different approach with energy recovery making up over 70% of their method for handling MSW, and only 20% being through material recycling. Many countries in Europe use a combination of strong material recycling programs, often coupling an Extended Producer Responsibility (EPR) program with WTE systems. An EPR system is a policy approach under which producers (brands, retailers) are given a significant responsibility – financial and/or physical – for the treatment of disposal of post-consumer products. The goal of an EPR program is to drive higher collection of materials, reduce packaging sent to landfill, and provide a funding mechanism to shift all, or part of the cost of waste and recycling collection from municipalities and onto the users of packaging.
This combination of robust recycling collection plus WTE reduces landfill use and often captures the highest economic value packaging materials such as steel, paper, aluminum and rigid plastic for recycling, while also using the combustible energy within other materials such as flexible packaging or plastics contaminated with food waste as an energy source.
While the chart in Figure 5-6 does not capture MSW collection for many emerging economies in southeast Asia, the lack of true MSW systems, including proper collection and landfilling, leads to very high levels of litter and marine debris. According a study by the Ocean Conservancy, 60% of global marine debris originates from five countries in
60
Asia (China, Indonesia, Philippines, Thailand, and Vietnam). The Ellen MacArthur Foundation (EMF) New Plastics Economy Report cited that 82% of all plastic global marine debris came from Asia. This is largely due to these countries lacking appropriate solid waste and recovery systems, coupled with a growing consumer appetite for the convenience of packaged goods. The same EMF report cited that the U.S. and Europe combined, have about 2% of plastic leakage into the oceans. While no marine debris is acceptable, the focus of the problem should be in Asia, in order to help develop the solid waste and recovery systems that are lacking.
Recycling The following section will look at the recycling process as well as some key recycling technologies that are used. As noted earlier, the U.S. EPA Waste Hierarchy (Figure 5-1) has recycling/composting listed second on their list of preferable waste management strategies, after source reduction.
The Recycling Process Recycling is often considered one of the most sustainable activities that links consumers to environmental action. Modern curbside recycling increased dramatically in the 1990s. Today, the U.S. EPA estimates that about 70 percent of Americans have access to recycling.
The U.S. has moved to largely single stream recycling, meaning that consumers put all of their recyclable materials into a single bin that is picked up by their local recycler. Some communities still use dual stream, where a particular material such as paper or glass is placed in a separate bin for collection, but this is becoming less prevalent as consumers like the ease of placing all materials into a single bin. While single stream recycling does result is more quantity of recyclables collected, it also results in less quality of materials collected, which ultimately impacts overall recycling rates. Consumers tend to be less selective about what goes into their single steam bin, which can lead to higher levels of contamination, as does commingled materials in general.
When a consumer places their recyclables curbside, it sets in motion of series of actions at a Material Recovery Facility (MRF) to segregate the materials into as clean a bale as possible. Clean segregated materials, and even sub-segregated (ex. paper versus office paper, mixed paper, and newspaper), generate higher revenues and simplify the process of converting recycled material into new products.
Figure 5-7. Bales of plastic bottles. (Flickr CC Lisa Yarost)
61
At a high level, materials are collected via trucks and transferred to the MRF, sorted by material type (plastic, paper, aluminum, etc.), before being baled for shipment.
Within the MRF itself, however, a number of steps to sort and segregate the material are performed. There are a number of technologies and a range of automation within MRFs, so not all of the steps listed below will apply for each facility. Figure 5-8 lays out a process used at a typical MRF. Other facilities may include additional steps for collecting and sorting additional materials. (Photos and description courtesy of Rumpke Waste and Recycling)
Figure 5-8. Typical MRF Process
1. Tipping floor and drum feeder - When trucks reach the facility, recyclables are unloaded onto the tipping floor and into the drum feeder, which loosens the compacted recyclables to facilitate the sorting process.
2. Pre- Sort & Corrugated Screen - Mixed material travels by conveyor to a pre-sort station, where employees remove unacceptable items. Corrugated is separated using a series of spinning discs. 3. Disc Screens (material separation) - With corrugated sorted, recyclables pass over rows of spinning discs. Paper products are carried overtop the screen, while bottles and cans drop through gaps in the discs on a conveyor below. 4. Optical Scanners (plastic bottle, paper, cartons) - scanners use infrared light to detect and sort plastic bottles, paper, and cartons. The reflection of each material triggers an air burst, which shoots the item from the conveyor into a separate bunker.
Tipping Floor/ Drum Feeder
Pre-Sort & Corrugated
ScreenDisc
ScreensOptical Scanner
Magnets/ Eddy
Currents
Fraction Separator Baling
62
5. Flat Fraction Separator (small paper) - Industrial-strength fans spin in reverse overtop the conveyor to suction small pieces of paper from the heavier materials passing beneath.
6. Magnets & Eddy Currents (steel & aluminum) - A high-power magnet attracts and separates steel cans. Non-ferrous aluminum cans are sorted with an electromagnet, which induces an eddy current to repel them from the conveyor.
7. Baler (all materials) - Once sorted by type, one material at a time is pushed from a storage bunker into the baler. Cubes of compacted recyclables emerge from the other side. Bales are shipped to end markets to make new products.
Over the past 20 years, the material composition sent to a MRF has changed, with newspaper collection going down dramatically, while the number of plastics bottles and corrugated boxes have gone up significantly. A challenge at the MRFs, however, is that even though the number of plastic bottles being collected and sorted has gone up, it now takes more bottles to make up a bale or ton of material. This is due to lightweighting technologies in plastics in which have evolved enabling lighter, yet stronger structures, which are more in line with sustainable material management and efficient use of resources. Sale of collected materials is often based on weight, so the result is that MRFs currently need to process additional recyclables to capture the same revenue as in the past.
Flexible Packaging Recycling Technologies and Programs The lightweight nature of flexible packaging, which results in reduced resources, favorable life cycle assessment, and less carbon footprint impacts, also makes collection more difficult. Once the materials are collected and baled at the MRF, they are sold to another company to convert the recovery material into a useful product. For most plastics, this means washing, and making plastic bales and plastic components smaller by shredding, so they can be reused in new plastic production processes such as injection or blow molding.
63
The following section will outline a number of current and future recycling technologies and programs to help improve overall recycling rates of flexible packaging. Many of the programs listed are already commercialized, but at a smaller scale, while others are in the development stage.
Mechanical Recycling Mechanical recycling refers to operations that aim to recover plastics waste via mechanical processes (grinding, washing, separating, drying, re-granulating and compounding), thus producing recyclates that can be converted into new plastics products, often substituting for virgin plastics (Plastics Recyclers EU). Mechanical recycling results in small resin pellets that can be used in other production processes, either with the pellets being used alone or mixed with virgin materials, depending on the product needs. Thermoplastic resins, such as those widely used in packaging (PET, HDPE, LDPE, PP) and that can be re-ground, re-melted, and re-processed can be recovered in a mechanical recycling process.
Mechanical recycling, however, generally requires a homogenous material stream, thus plastics must be sorted before they can be mechanically recycled. Mechanical recycling is widely used to regrind plastic water bottles (PET), laundry bottle and milk jugs (HDPE), as well as some flexibles materials such as plastic grocery bags (PE). Mechanical recycling of flexible packaging is generally limited today to collected and segregated all polyethylene (PE) structures, including grocery bags and overwrap for items such as paper towels and water bottle multi-packs, and dry-cleaning bags, among others. Multi-material flexible films, such as those used for salty snacks, soups, and dairy products, contain different layers of materials which are not currently compatible with mechanical recycling because of the difficulty in separating the layers. Plastics that are mechanically recycled can be re-incorporated into new packaging, such as is done with PET bottles, or turned into another product, such as plastic lumber, which is often the case with recycled PE bags. Chemical Recycling Chemical recycling differs from mechanical recycling in that it aims to chemically degrade the collected plastic waste into its monomers or other basic chemicals. The monomers can then be used again for making new polymers. Chemical recycling could enable the recovery of mixed plastics, reducing the need for the complex separation process needed today for mechanical recycling. It could also allow certain plastics, such as thermoset plastics, which cannot be recycled today via mechanical recycling to also be collected and recycled. Megan L. Robertson, associate professor of chemical and biomolecular engineering at the University of Houston, and Jeannette M. Garcia, a polymer chemist at the IBM Almaden Research Center, recently wrote in an article published in Science magazine,
64
"Recent research points the way toward chemical recycling methods with lower energy requirements, compatibilization of mixed plastic wastes to avoid the need for sorting, and expanding recycling technologies to traditionally non-recyclable polymers," when speaking about chemical recycling. Additionally, a new European project called DEMETO was formed in late 2017. It focuses on chemical recycling for PET bottles using microwaves. This is based on DE-polymerization by provider MicrowavE TechnolOgy (DEMETO), as part of the EU Horizon 2020 collaborative research program. To date, chemical recycling has not been widely used in the plastics and packaging industry due to economics and other processing challenges. There does appear to be a number of research projects with large companies, such as IBM, targeting chemical recycling in an effort to expand the amount and types of plastics, including flexible materials, that could be recycled. This is certainly an area of research to watch over the upcoming decade as it offers great promise, if can be it can be proven at lower overall cost.
Store Drop-Off Program – Wrap Recycling Action Program (WRAP)
One of the more visible and productive recycling programs for flexible packaging is the Wrap Recycling Action Program (WRAP) which piggybacks onto the plastic bag drop-off that many groceries stores already have in place for internal “back of the store” deliveries and processes. Many retailers already collect pallet stretch wrap and other materials such as corrugated for recycling in their warehouse and store storage areas, common referred to as “back of store.” The program, which is sponsored by the American Chemistry Council, educates and allows consumers to recycle any flexible packaging that is made completely from polyethylene. This may include, but is not limited to items, such as newspaper bags, produce bags, bread bags, dry cleaning bag, overwraps for napkins/paper towel/ bath tissue, or air pillows used in e-commerce.
Figure 5-9. Example of plastic wrap drop-off bin
65
The WRAP program also benefits from the How2Recycle program, which is administered by the Sustainable Packaging Coalition (SPC). The How2Recycle program contains a label graphic, which instructs consumers on which packaging components can be recycled. The program includes instructing consumers of flexible package components that may be dropped off at stores with their plastic grocery bags for recycling. The How2Recycle label graphic is becoming more popular with a number of national brands as well as private label goods from Walmart and Target.
According to 2015 National Post-Consumer Plastic Bag and Film Recycling Report, at least 1.2 billion pounds of plastic bags and wrap were recovered for recycling. The total amount of wrap collected for recycling is nearly double the 652 million pounds collected a decade earlier. About 44% of the collected film was used in the production of plastic lumber, while another 43% went into production of other plastic films displacing virgin feedstocks.
The combination of communities administering WRAP and the new How2Recycle label scheme are two ways that consumer education can lead to increased recycling of flexible packaging.
TerraCycle
TerraCycle is a company that collects many types of materials, including flexible packaging, for recycling; it uses the collected materials to create new products. The company often partners with specific brands to sponsor the collection and shipment of recycled materials. An example would be a program where TerraCycle collects drink pouches and turns those pouches into messenger bags or school lunch boxes, all made from reclaimed material. In other instances, the company may shred the
material and remelt and pelletize the resin to form new rigid material options for non-food contact applications.
Figure 5-10. Example of How2Recycle label for plastic film
Figure 5-11. Example of bag made from collected flexible packaging
66
Hefty® EnergyBag™ Program The Hefty® EnergyBag™ program collects difficult to recycle materials including flexible packaging and materials contaminated with food waste. Consumers use an easily identifiable orange bag into which they place materials. The bag is then placed in the single stream recycling bin or next to the bin for collection and pulled off the sortation line at the MRF. The orange bags are then collected and taken to a waste-to-energy facility such as a cement kiln to serve as a fuel source or pyrolysis plant to eventually be used to produce alternative chemical feedstocks to produce new plastics. The program does not look to collect plastic packaging that is already mechanically recycled but provides another collection avenue for materials not currently recycled. Flexible packaging items that can be collected as part of the program include flexible drink pouches, candy bar wrappers, plastic pet food bags, and shredded cheese bags. Other plastic packaging that is not usually recycled but collected as part of the program may include plastic meat packaging, straws/stirrers, and plastic service ware (plates and cups).
The program started in Omaha in 2016 and has expanded to other U.S. cities.
Composting Composting is another form of recycling, often thought of with organic waste such as grass clippings, leaves, or food waste. However, certain types of packaging are compostable as well (many of these are covered more in depth in Chapter 6 – Biobased and New Feedstocks). To be certified as compostable, the packaging must go through a third party testing process to ensure that it meets the ASTM D6400 test standard which requires that 60% of the organic carbon be converted to carbon dioxide within 180 days.
Figure 5-12. Hefty EnergyBag
Figure 5-13. Food waste and composting bin
67
Composting opportunities for packaging, including flexible packaging, include when the packaging is contaminated with food, allowing for composting of both food and packaging together, rather than landfilled. This is the case in some cities such as Seattle that have legislated that all foodservice packaging must be recyclable or compostable and have a composting infrastructure in place. Another application is in closed venues
such as sports stadiums or concert venues where consumers are educated about the proper bin to place their left-over packaging with food waste. An example is in the photo to the left, where the Kansas City Chiefs are trying to reduce waste at Arrowhead Stadium and worked with foodservice provider Aramark and raw material supplier BASF to develop a compostable structure for peanuts. Any leftover peanuts as well as the bag can be placed in the compost bin where they will turn into biomass.
The ability to recycle both packaging and food waste through composting will enable foodservice establishments and grocery stores to more easily and quickly recycle expired food. The U.S. EPA, for example has set a voluntary goal of reducing food waste by 50
percent by the year 2030, while the European Commission has also set a target of 50 percent reduction by 2030, through regulations. As stated in Chapter 6, not only is food waste an issue as many people and communities are food insecure, food waste is also the number one contributor to greenhouse gas emissions from landfills.
However, some challenges exist, including a lack of composting infrastructure across the U.S., and many compost facilities not wanting packaging, even if it has passed the appropriate compostability test standards. This is due to the time it can take compostable packaging to break down to biomass. Many times, this can take longer than food, resulting in a slower process at composters. Still, the trends and improving composting infrastructure point to composting playing a larger role in recycling of both food and foodservice packaging in the future.
Energy Recovery Options While recycling and composting are generally preferred MSW management options according to the EPA waste hierarchy, energy recovery options form the next layer of opportunity to recovery value from materials, as opposed to placing in a landfill. The next section will provide a high-level view of four of the most prevalent and promising energy recovery options – Waste to Energy, Pyrolysis, Gasification, and Engineered Fuel Bales.
Figure 5-14. Compostable bag example
68
Waste to Energy (WTE) WTE is a term applied to the MSW management option where the waste is taken directly to specially designed power plants that combust the MSW as fuel to create steam, and the steam is used to create electricity, displacing virgin energy sources. Some of the key benefits of WTE are the ability to capture a high percentage of the energy embedded in materials such as plastics, and also can significantly reduce the amount of material that is sent to landfill by about 87%.
As shown earlier in this section, WTE makes up about 13% of the management of the U.S. MSW stream. In other countries such as Japan, Norway, Sweden and Denmark, WTE makes up a much larger percentage of their MSW management programs. Japan manages about 75% of their MSW through WTE, while in many European countries that figure can approach 50%.
Figure 5-15. Typical Waste to Energy Facility
1. Waste Bunker 2. Furnace 3. Energy recovery in steam boiler 4. Flue gas treatment 5. Stack 6. Electrical generation/turbine 7. Heating
Source: International Solid Waste Association – Circular Economy Energy & Fuels
According the U.S. EPA, there are 86 WTE facilities operating in the U.S., though that number is down from about 180 in the 1970s. Japan, for instance, has 1,100 WTE plants in operation. In the past, WTE facilities built after World War II did not include tight air emission controls and often incinerated waste without the benefit of energy collection. This resulted in public concern about the use of WTE facilities, though their widespread use in Europe and Japan has shown they can be operated safely within air quality emission limits. Table 5-B shows the emissions between different sources for power plants. Past research from the U.S. EPA has shown that WTE facilities can operate well within air emissions standards and can have emissions much lower than coal facilities.
69
Table 5-B. Waste-to-Energy and Fossil Fuel Power Plant – Comparison of Air Emissions
Some newer facilities are merging the use of both a recycling MRF and WTE capabilities into a single location, capturing the high value recyclables from a single stream MRF, and using materials that cannot be mechanically recycled effectively as part of WTE. An example of this is a facility in Levenseat, Scotland, that “will produce a minimum of 100,000 metric tons annually of high-quality RDF (Refuse Derived Fuel) as feedstock for the Levenseat WTE plant while also maximizing the recovery of high-value recyclables.” The company installing the equipment, Machinex, claims the facility “will use the latest technologies, including four shredders, one Machinex trommel, one waste screen, three air separators, two Machinex ballistic separators, three Machinex MACH Hyspec optical sorting units, one fluidized bed dryer and two Machinex single-ram balers” in an effort to capture the most material possible for recycling. Through the combination of MRF and WTE, the facility believes it will be able to divert 98% of waste from landfill. One of the major challenges with WTE facilities is their overall cost for development and construction, especially when compared to the relatively low landfill costs in the U.S. Regardless, they have become a mainstream and viable option in much of the developed world, and will remain an option to divert flexible packaging, along with other materials from landfill. Pyrolysis Pyrolysis is another energy recovery option for waste packaging. Pyrolysis is a high-temperature process (300-600°C) that is optimized to produce pyrolysis oils, bio-char, and synthesis gas from dry biomass. Pyrolysis consists of heating the feed material in a vessel in the absence of oxygen. Decomposition reactions take place, and a mixture of hydrogen and carbon monoxide are the predominant gas products. Products from the process include pyrolysis oil, water, methane, and CO2. The resultant gas is called variously biogas, producer gas, or syngas (synthetic natural gas). The composition of the resultant fuels is determined by a combination of the initial mixture of feedstock constituents, temperature, and time within the reactor.
70
Figure 5-16. Pyrolysis Conversion Products
Source: Heermann et. Al, 2001
Pyrolysis allows for the ability to process mixed waste, including flexible packaging, meaning the inputs do not need to be sorted before being used in the process. The output gas of pyrolysis has an energy value of between 22-30 MJ/m3. Natural gas, for instance has an energy value of about 38 MJ/m3. Additionally, the liquid products of the pyrolysis can be used as a feedstock for other petrochemical processes or as a chemical substitute for the production of petrochemicals, depending on quality of the liquid product of pyrolysis, or as a fuel. Flexible packaging waste, which is largely made of PE and PP, is considered a favorable input for the pyrolysis process.
Pyrolysis allows for the products to be used to create electricity, when linked to an engine or turbine, or can be used to create transportation fuels or even back to a chemical feedstock, where the output can be used again to create new products.
One of the challenges with pyrolysis, and most WTE systems, is that the input of the feedstock (waste) can vary daily based on the MSW stream. This is unlike most fossil fuel-based plants that use coal or natural gas as feedstocks, which are relatively stable.
Companies such as Agilyx have already commercialized pyrolysis facilities in the U.S., and others are in the construction phase. In general, pyrolysis is considered a promising MSW reduction technology because it can operate on relatively smaller scales with less capital than WTE facilities and has a number of potential outputs.
71
Gasification Gasification is another process MSW technology option. It works by converting carbon-based feedstock materials (including flexible packaging) into a gas by creating a chemical reaction. The high temperature (900- 1400°C) reaction combines the feedstocks with small amounts of air or oxygen, breaking them down into their simple molecules, primarily a mixture of carbon monoxide and hydrogen, while removing pollutants and impurities. What’s left is a clean “synthesis gas” (syngas) that can be converted into electricity and other valuable products. The syngas produced by gasification can be turned into higher value commercial products such as transportation fuels, chemicals, and fertilizers, or used as substitute natural gas. (Hunderup, 2016)
Figure 5-17. Gasification Conversion Products
Source: Heermann et. Al, 2001
Gasification is considered more energy efficient than pyrolysis overall since it does not require an additional energy source. The facilities can also operate with a mixed feedstock, other than some shredding of paper and plastics. The gasification process, however, tends to require larger scale facilities and may be more costly than pyrolysis facilities. Enerkem, based out of Canada, is one of the leading gasification providers in North America. They have a facility in Edmonton, Alberta with a goal to help that region divert over 90% of material from landfill.
72
Figure 5-18. Enerkem gasification process
Source: Enerkem.com
Gasification, while not as common as other MSW reduction technologies could be a technology to keep an eye on for future development.
Engineered Solid Fuels Engineered Solid Fuels are another method of managing MSW. This technology takes in MSW, removes the recyclables, metals, and heavy organics leaving largely non-recycled paper and plastics. They are then shredded, mixed, dried, pelletized and shipped to a customer to use as a fuel in industrial boilers and kilns replacing other solid fuels such as coal, wood, and petroleum coke. (Hunderup, 2016)
An example of a company involved in Engineered Solid Fuels is SpecFuel. The company claims SpecFuel is made up of 99% paper and plastic and helps reduce waste going into landfills by up to 65%. It also claims to have lower sulfur emissions than coal.
In general, Engineered Solid Fuels are in early development stage, and it remains to be seen how viable an economic and environmental option they become in upcoming years.
Energy Recovery Technology Summary The use of energy recovery technologies for managing MSW will continue to evolve as governments look for ways to avoid material going to landfill and optimize the value of materials during recovery. These technologies, particularly WTE, are widely accepted and used in Europe and Japan today based on their ability to recover embedded energy value and reduce material sent to landfill. Mechanical recycling has not yet been proven to be an economically effective technology in the recovery of multi-material flexible packaging. It may continue to be a challenge because of the difficulty in separating the different layers on multi-material flexible packaging which are necessary to create effective and efficient barriers to protect the products inside. Until chemical recycling becomes more developed, energy recovery technologies may provide a good option for
73
recovering value in these materials, and significantly reducing their placement in landfill, or as litter and marine debris, along with other materials that may be difficult to recycle or have contamination such as food waste.
Collaboration There are a number of collaborative efforts that are taking place throughout the global packaging community that are meant to drive enhanced recovery and recycling technologies for flexible packaging, and packaging as whole. The following collaborative groups are not meant as an all-encompassing list but intended to highlight some of the leading organizations and their efforts.
A Circular Economy for Flexible Packaging (CEFLEX) CEFLEX is the collaborative project of a European consortium of companies representing the entire value chain of flexible packaging, including global raw material suppliers, packaging converters, and brand owners. The program has a number of goals to drive enhanced recovery of flexible packaging including:
• Development of Design Guidelines for both flexible packaging and the “End of Cycle” infrastructure to collect, sort, and recycle flexibles
• The identification and development of sustainable end markets for the secondary materials recycled from flexible packaging
Additionally, by 2025, the program is looking to the development of a collection, sorting, and reprocessing infrastructure for post-consumer flexible packaging across Europe.
The CEFLEX group continues the work of two other collaborations – Project REFLEX (REcycling of FLEXible Packaging) and Project FIACE (Mapping Flexible Packaging in a Circular Economy). Project REFLEX was a U.K. funded program to demonstrate and evaluate the sorting and recycling of flexible packaging using existing and established technologies such as Near Infrared (NIR) to identify PP, PE or mixed polyolefin streams as well as multi-material structures.
Project FIACE’s goal was a to capture the facts supporting the value added by flexible packaging in a European Circular Economy, and to identify the challenges and the opportunities to increase this added value by closing the loop through pack and system
74
design, thereby increasing the quantities and quality of flexible packaging that are mechanically recycled.
As mentioned, both Projects REFLEX and FIACE have been rolled into CEFLEX, which will now advance the development of guidelines and technologies necessary to advance flexible packaging recovery. While the program is focused on the European market, many of the participants are global, and any recommendations and insights will also have relevance for the U.S. market.
Materials Recovery for the Future (MRFF) The Material Recovery for the Future (MRFF) project is a North American based collaborative, again including critical players within the flexible packaging value chain, including industry associations such as the Flexible Packaging Association (FPA). The ultimate goal of the group is to find solutions for improved recovery of flexible packaging, which is not widely recycled in the current recycling system.
As part of the first phase of the project, the goal was to examine whether flexible packaging that is predominantly plastic could be processed in the single stream recycling system along with the paper stream. The program included baseline testing, equipment testing, and a series of recovery facility trials to test existing sortation technologies commonly used in MRFs, such as screens and optical scanners. The results of the initial trial showed that that “existing optical sorter and MRF equipment technology can be used to sort flexible plastic packaging at promising levels of efficiency. With some targeted adjustments of the equipment, identification and sorting of the seeded flexible plastic packaging improved dramatically.”
The MRFF project also looked at end market opportunities for collected mixed flexible film bale and the feasibility of taking it to a Plastic Recovery Facility (PRF) or conversion to energy for a WTE facility. A PRF further processes plastics from a MRF into higher value bales that are more cleanly separate from the mixed plastic bale. These processes include separating by resin type, increasing bale purity, washing and sizing to flakes and producing densified resin forms such as pellets.
Future research for MRFF will focus on further refinements to sorting technology, economic feasibility, assessing end-use markets for the material, and developing a recovery facility demonstration project.
75
American Chemistry Council Flexible Film Recycling Group (FFRG) The American Chemistry Council has a sub-group called the Flexible Film Recycling Group (FFRG); its goal is to significantly increase the collection and recycling of all flexible films and to educate the public about the importance of recycling. The group tends to focus on the polyethylene (PE) film value chain and, may not necessarily include a focus on multi-material films.
The group has also implemented the WRAP, which, as stated earlier in this section, is where consumers bring PE films such as grocery bags, bread bags, and overwraps for paper towels back to stores as part of the store drop-off program. These PE bags are then combined with other PE film collected at the back of stores and sent to a reprocessing center to be recycled. The group has also developed the consumer and community facing website of www.plasticfilmrecycling.org to provide information to consumers and community leaders on how to advance flexible PE film recycling in their community. The site lists over 18,000 drop-off locations in the U.S. that accept PE films. Ellen MacArthur Foundation (EMF) – New Plastics Economy The Ellen MacArthur Foundation (EMF), which works with business and governments on developing a framework for economies that are restorative and regenerative, has a sub-group called the New Plastics Economy. This group focuses on applying the principles of the CE and brings together key stakeholders to rethink and redesign the future of plastics, starting with packaging. Figure 5-19. The New Plastics Economy, Ellen MacArthur Foundation
The group is focused on five main “building blocks” to drive new thinking in an effort to capture more plastics for recovery and inclusion in a CE model. These include efforts to design recycling systems to be economically attractive to collect more plastic packaging, reuse packaging models, and boosting material innovation for recyclable and compostable flexible film structures.
The group is also looking at developing a Global Plastics Protocol in an effort to develop a cross-value chain perspective on the top opportunities for design shifts and allow the prioritization of changes that would most enhance recycling economics and material health.
In another interesting model, the EMF is funding an Innovation Prize to drive development of new material technologies that could help make more flexible packaging recyclable. Innovation winners in early 2018 include a group from the University of Pittsburgh to alter the nano-structure of polyethylene in ways that allows it to mimic the properties of the various layers of laminate packaging, while not changing the chemistry of the material, which remains PE. In this way, the all PE structure could be recycled or placed in a bag drop-off system for collection. With a combination of brand owners, NGOs, governments, packaging converters and a focus on future innovation, EMF is setting a vision on how plastics and packaging can play a stronger role in the circular economy.
Forward View Effective management of MSW is an important social component that is often taken for granted in developed countries. It is also apparent, that in the U.S., the amount of material going to landfill is considerably higher than that of some countries in Europe and Asia. This in large part is due to more collection of recyclable materials, sometimes driven by EPR laws, as well as more widespread use of energy recovery technologies such as WTE.
Packaging providers are responding with programs such as the How2Recycle label as well as the WRAP recycling program, which educate consumers on which materials can be recycled and where to place them for recycling. These type of programs, along with increased consumer communication, will be crucial for driving increased collection of flexible materials. Additionally, there are some examples of multi-layered structures recently in the market which are made from an all polyethylene structure that can included in the bag drop-off program for recycling. These structures may not be an appropriate replacement for all multi-material flexible packaging, but showcase innovation and desire to get more flexible packaging collected at store drop-off locations.
Figure 5-20. Multi-layer, all PE pouch recyclable in store drop-off program
77
In the upcoming decade, less developed countries will need to drive investment in MSW systems as their consumers increasingly enjoy the benefits of consumer packaged goods. Already five countries in southeast Asia account for over 60% of global marine debris, largely driven by the lack of MSW infrastructure. Concern with marine debris and the impact on the ocean ecosystem will become more prevalent as politicians as well as concerned communities and companies in both developed and developing countries look to improve MSW collection and ultimately drive improved recycling infrastructure.
Additionally, as technology improves recovery options for all materials, including multi-material flexible packaging, recycling of these materials will climb, either though mechanical or chemical recycling, composting, or in other energy recovery systems such as pyrolysis or WTE.
Mixed material bales will continue to be a challenge, whether paper or plastics, as they have lower economic value than completely segregated material. This leads to a lower incentive for MRFs and recyclers to focus on multi-material flexible packaging which are very lightweight and do not take up much volume. Until flexible packaging is collected in bulk quantities, whether through innovative curbside programs meant to keep flexible bundled together, or through other drop-off programs, there will be challenges in developing the necessary funding and infrastructure for mechanical or chemical recycling. Without sufficient recovered quantities of materials, investment in flexible packaging recycling technologies could be limited. However, until recycling infrastructure is in place, investment in collection of flexible materials will be a challenge as well – a chicken and egg situation.
Regardless, flexible packaging will continue to play a critical role in both CE and SMM models. Collaborative industry work efforts to bring new recovery technologies to fruition and enable the highest value of recovery of multi-layer structures will be ever more important.
78
Acronyms – Chapter 5
ASTM ASTM International – standards organization CE Circular Economy CEFLEX Circular Economy for Flexible Packaging DEMETO DE-polymerization by MicrowavE TechnolOgy EMF Ellen MacArthur Foundation EPA U.S. Environmental Protection Agency EPR Extended Producer Responsibility FFRG American Chemistry Council Flexible Film Recycling Group FIACE Mapping Flexible Packaging in a Circular Economy FPA Flexible Packaging Association HDPE High Density Polyethylene (labeled as #2 plastic) LDPE Low Density Polyethylene (labeled as #4 plastic) MRF Material Recovery Facility MRFF Materials Recovery for the Future MSW Municipal Solid Waste NGO Non-Governmental Organization NIR Near Infrared OECD Organization for Economic Co-operation and Development PE Polyethylene PET Polyethylene Terephthalate (labeled as #1 plastic) PP Polypropylene (labeled as #5 plastic) PRF Plastic Recovery Facility RDF Refuse Derived Fuel REFLEX REcycling for FLEXible Packaging SMM Sustainable Materials Management SPC Sustainable Packaging Coalition WRAP Wrap Recycling Action Program WTE Waste to Energy
79
References and Sources: Hefty Energy Bag, 2017, www.dow.com/en-us/science-and-sustainability/sustainable-brands-detroit-2017/hefty-energy-bag. 2015 National Post-Consumer Plastic Bag & Film Recycling Report. Moore Recycling Associates, Mar. 2017, plastics.americanchemistry.com/2015-National-Post-Consumer-Plastic-Bag-and-Film-Recycling-Report.pdf. Advancing Sustainable Materials Management: 2014 Tables and Figures - Assessing Trends in Material Generation, Recycling, Composting, Combustion with Energy Recovery and Landfilling in the United States. U.S. EPA, Dec. 2016, www.epa.gov/sites/production/files/2016-11/documents/2014_smm_tablesfigures_508.pdf. “Amager Bakke: Copenhagen's Power Plant And Ski Slope.” Progrss, 20 Nov. 2017, progrss.com/design/20171120/amager-bakke-copenhagen-power-plant/. Arsova, Ljupka, and Nickolas Themelis. The Economics of Collecting and Processing Flexible Packaging Waste (FPW) to a Feedstock for Pyrolysis Plants. Columbia University Earth Engineering Center, May 2013, www.flexpack.org/assets/1/6/Economics_of_Collecting_and_Processing_FPW.pdf. “Chemical Recycling.” Chemical Recycling | Plastics Recyclers Europe, 24 Apr. 2017, www.plasticsrecyclers.eu/chemical-recycling. Eddy, Melissa. “Germany Gleefully Leads List of World's Top Recyclers.” The New York Times, The New York Times, 28 Nov. 2016, www.nytimes.com/2016/11/28/world/what-in-the-world/germany-gleefully-leads-list-of-worlds-top-recyclers.html. “Energy Recovery from the Combustion of Municipal Solid Waste (MSW).” EPA, Environmental Protection Agency, 14 Apr. 2017, www.epa.gov/smm/energy-recovery-combustion-municipal-solid-waste-msw. “Environment at a Glance 2015 | OECD READ edition.” OECD iLibrary, 2015, www.keepeek.com/Digital-Asset-Management/oecd/environment/environment-at-a-glance-2015_9789264235199-en#page52. “EU actions against food waste - Food Safety - European Commission.” Food Safety, 2017, ec.europa.eu/food/safety/food_waste/eu_actions_en. Funk, Kip, et al. Waste Not, Want Not: Analyzing the Economic and Environmental Viability of Waste-to-Energy (WTE) Technology for Site-Specific Optimization of
80
Renewable Energy Options. Joint Institute for Strategic Energy Analysis, Feb. 2013, energyrecoverycouncil.org/wp-content/uploads/2016/05/1302-JISEA-WTE.pdf. Garcia, Jeannette. “How Advances in Plastic Manufacturing and Recycling Can Help Save the Environment.” IBM Blog Research, IBM Corporation, 3 July 2017, www.ibm.com/blogs/research/2017/06/advances-recycling-save-environment/. Hardcastle, Jessica Lyons. “Hefty Energy Bag Programs Helps Companies Reach Zero Waste Goals.” Environmental Leader, 27 Feb. 2017, www.environmentalleader.com/2017/02/hefty-energy-bag-programs-helps-companies-reach-zero-waste-goals/. Hunderup, Peter. “Flexible Packaging Resource Recovery Update: A Flexible Packaging Association Report.” FPA, 2016. “Innovation Prize - New Plastics Economy.” New Plastics Economy, Jan. 2018, newplasticseconomy.org/innovation-prize. Johnson, Anne, Marty Seaman, and Aaron Burman. “End of Life Overview and Recovery Options.” Resource Recycling Systems, 2013. “Kansas City Chiefs roll out compostable peanut bags at Arrowhead Stadium.” Waste Today, 15 Nov. 2017, www.wastetodaymagazine.com/article/kansas-city-chiefs-roll-out-compostable-peanut-bags-at-arrowhead-stadium/. “Launch of the new European Project on Chemical Recycling DEMETO.” Launch of the new European Project on Chemical Recycling DEMETO | Petcore Europe, 2017, www.petcore-europe.org/news/launch-new-european-project-chemical-recycling-demeto. “Levenseat Fuel Preparation Plant Projects 98% Landfill Diversion.” Waste360, 2 Feb. 2018, www.waste360.com/mrfs/levenseat-fuel-preparation-plant-projects-98-landfill-diversion?NL=WST-03&Issue=WST-03_20180202_WST-03_334&sfvc4enews=42&cl=article_4_2&utm_rid=CPEQW000008654171&utm_campaign=12280&utm_medium=email&elq2=0d01d99662364fbf9f624e1e234794f7. McKinlay, Richard, and Liz Morrish. REFLEX Project - A summary report on the results and findings from the REFLEX Project. Axion Consulting, Nov. 2016, ceflex.eu/public_downloads/REFLEX-Summary-report-Final-report-November2016.pdf. “Mechanical Recycling.” Mechanical Recycling | Plastics Recyclers Europe, 24 Apr. 2017, www.plasticsrecyclers.eu/mechanical-recycling.
81
“Modular, scalable and high-Performance depolymerization by microwave technology.” Modular, scalable and high-Performance depolymerization by microwave technology | SPIRE, 30 Oct. 2017, www.spire2030.eu/demeto. Mohan, Anne Marie. “Can we solve the flexible film recovery puzzle?” Packaging World, 17 Jan. 2016, www.packworld.com/article/sustainability/recycling/can-we-solve-flexible-film-recovery-puzzle. Nonclercq, Aurelie. Mapping Flexible Packaging in a Circular Economy [F.I.A.C.E]. Delft University of Technology, 14 Oct. 2016, ceflex.eu/public_downloads/FIACE-Final-report-version-24-4-2017-non-confidential-version-Final.pdf. “Plastic Film Recycling Resources.” Plastic Film Recycling, American Chemistry Council, 2018, www.plasticfilmrecycling.org/resources/. “Plastics-Flexible Film Recycling Group.” Flexible Film Recycling Group (FFRG), Jan. 2018, plastics.americanchemistry.com/Flexible-Film-Recycling-Group.aspx. “Recycle Plastic Film Wraps and Bags.” Plastic Film Recycling, 2018, www.plasticfilmrecycling.org/. Sandford, Kerry, et al. Materials Recovery for the Future: Flexible Packaging Sortation at Materials Recovery Facilities. Research Report. MRFF/Resource Recycling Solutions, 21 Sept. 2016, www.materialsrecoveryforthefuture.com/wp-content/uploads/2016/09/Flexible-Packaging-Sortation-at-Materials-Recovery-Facilities-RRS-Research-Report.pdf. Szaky, Tom. “The 'pouch-Ization' of the world.” Packaging Digest, Packaging Digest, 23 Sept. 2016, www.packagingdigest.com/flexible-packaging/the-pouch-ization-of-the-world-2016-09-23. “The Dow Chemical Company Hefty Energy Bag Program.” Environmental Leader, 2017, www.environmentalleader.com/projects_of_year/dow-chemical-company/. “The New Plastics Economy: Catalysing action.” New Plastics Economy, Ellen MacArthur Foundation, 2017, newplasticseconomy.org/publications/report-2017. “United States Food Loss and Waste 2030 Champions.” EPA, Environmental Protection Agency, 17 Jan. 2018, www.epa.gov/sustainable-management-food/united-states-food-loss-and-waste-2030-champions. University of Houston. “Scientific advances can make it easier to recycle plastics.” EurekAlert!, AAAS, 17 Nov. 2017, www.eurekalert.org/pub_releases/2017-11/uoh-sac111717.php.
82
“Waste-to-Energy (Municipal Solid Waste).” Waste-to-Energy (Municipal Solid Waste) - Energy Explained, Your Guide To Understanding Energy - Energy Information Administration, U.S. Energy Information Administration, www.eia.gov/energyexplained/?page=biomass_waste_to_energy. Winn, Patrick. “5 countries dump more plastic into the oceans than the rest of the world combined.” Public Radio International, 13 Jan. 2016, www.pri.org/stories/2016-01-13/5-countries-dump-more-plastic-oceans-rest-world-combined.
83
Chapter 6
Biobased and New Material Feedstock Introduction/Background: New biodegradable, compostable, or biobased packaging material technologies have garnered much of the attention in flexible packaging discussions as consumers and municipalities deal with enhancing end of life alternatives. The general premise supposes these materials are either biodegradable (capable of decaying through the action of living organisms) or are made from non-fossil fuel based feedstocks. While there can definitely be benefits offered through use of these new materials, there continues to be confusion and misinformation as well. Discussions on many levels are challenged by the four key terms and definitions used, which at times are incorrectly interchanged (see Table 6-A). Key terminology as well as the ASTM test methods that are used to substantiate a “green” marketing claims are shown in Table 6-A below. ASTM administers a number of international recognized test standards to ensure methodology and results are comparable. It is also recommended that any company looking to make environmental claims reference the U.S. Federal Trade Commission (FTC) Environmental Claims: Summary of the Green Guides, which provide an overview of environmental claims and when appropriate terminology and claims can be used. Table 6-A. Bio-material Terminology
Term Description Test Method
Certification/Claims example
Biobased Organic material(s) in which the carbon comes from contemporary (non-fossil) biological sources (biomass). Claims focus on percentage of an overall structure made from biobased sources. Does NOT mean product is biodegradable.
ASTM D6866
Biodegradable Biodegradability measures the capacity of microorganisms present in the disposal environment (composting, soil, anaerobic digesters, marine, and even landfill) to utilize the carbon product. FTC Green Guides
ASTM D6400 D6868 D7081 D5338, D5511, D5526
84
say < 1 year. Generic claims of “biodegradable” cannot be made unless substantiated by scientific data demonstrating 90%+ biodegradation within one year.
Bioplastics Bioplastics constitute a broad range of materials and products that are bio-based, biodegradable/ compostable, or both.
N/A
Compostable Capable of being broken down via an aerobic biological process. Materials that are compostable are also biodegradable, but biodegradable materials may or may not be compostable (depending on time defined, disintegration, regulated metal content, and ability to pass phyto & eco toxicity requirements).
ASTM D6400 D6868
Additional Background: A Biobased Plastic is one that comes from a feedstock such as wood, corn, soybeans, sugar, potatoes, or grasses with the agricultural crops generally harvested at least annually, and wood over the course of a few years. Some examples of biobased plastics include Polylactic Acid (PLA) from NatureWorks® or I’m Green™ polyethylene (PE) from Braskem. A Biodegradable Plastic is a plastic that undergoes biodegradation (a process in which the degradation results from the action of naturally-occurring micro-organisms such as bacteria, fungi, and algae) as per accepted industry standards. While the generic term biodegradable does not have a specific time attached to how quickly the process must occur, the FTC Green Guides call for degradation within one year. Composting is the biological recycling of carbon, with materials capable of being broken down via a biological process (aerobic). Materials that are compostable are also biodegradable, but biodegradable materials may or may not be compostable (additional criteria needs to be met – such as percentage biodegraded within a time frame of 180 days). Compostable materials can be certified by outside agencies such as
85
the Biodegradable Products Institute (BPI) using ASTM test standards ASTM D6400 or D6868.
Therefore, it is generally recommended that packaging claims should be focused on being compostable, rather than biodegradable, as these test standards focus on a certain percentage of a material that must compost within 180 days. A biodegradability claim is not considered as strong since it does not need to biodegrade as quickly or at the same rate as the compostability standard. The FTC Green Guides state “items destined for landfills, incinerators, or recycling facilities will not degrade within a year, so unqualified biodegradable claims for them shouldn’t be made” on degradable materials.
Leading to further confusion, there can be combinations where a biobased material may or may not be biodegradable. (Note: In many instances in this section we will use the term biodegradable materials because, while a biobased material such as PLA will be biodegradable for certain applications, it is only considered compostable if has gone through the certification process of ASTM D6400, D6868 or a comparable international certification process). Some examples include:
• Biobased material and biodegradable:
Example: Polylactic Acid (PLA) o Biobased – because feedstock is corn or
potato starch, a renewable raw material. o Biodegradable – because material will
start biodegradation process when recovered in a compost facility.
o End of Life – recycling of a biobased and biodegradable material may be achieved via composting. (If not certified, however, package should not be placed in composting, and will end up in landfill).
Figure 6-1. PLA biobased and biodegradable bag used for food waste collection
86
• Biobased material but NOT biodegradable:
Example: I’m Green PE™ from Braskem o Biobased – because feedstock
is sugarcane, a renewable raw material.
o NOT Biodegradable – because material will not break down in a compost environment. These types of materials are meant to replace (a portion or all) the traditionally fossil fuel-based feedstock with a renewable feedstock.
o End of Life – some biobased materials and non-biodegradable materials can be recycled within standard recycling streams. An example are instances where a portion of some HDPE bottles may contain I’m Green™ PE, and therefore recycled with other rigid bottles since the properties are identical to traditional HDPE bottles. Other biobased and non-biodegradable materials may not be able to be recycled in standard systems. These materials must be disposed of with municipal solid waste. They have still, however, replaced (a portion or all) of the traditionally fossil fuel based feedstock with a renewable feedstock.
• NON biobased but biodegradable:
Example: BASF Ecoflex® o NOT Biobased – because feedstock from traditional plastic sources. o Biodegradable – certified for compostability (ASTM D6400). o End of Life – these structures can be composted if certified. Examples of
some uses include agricultural films which are left in fields.
Figure 6-2. Bag utilizing biobased and non-biodegradable material example
Figure 6-3. Example of a bottle containing biobased content and recyclable
87
The Biobased and Biodegradable Feedstock Opportunity The market and production capacity for biobased and biodegradable feedstock continues to grow, at an expected growth rate of 20% from 2 million tons in 2017 to about 2.5 million tons by 2022. (see Figure 6-4) These materials, however, remain a niche in the broader plastic production market which had a global production of 322 million tons in 2015 (Plastics Europe), with bioplastics share at about 1% of global plastics production today. About 40% of plastics, including bioplastics, are used in packaging production. Figure 6-4. Global Production Capacities of Bioplastics (in 1,000 tons)
Source: European Bioplastics Despite their small role today in the global packaging market, biobased and biodegradable materials offer an area of opportunity. They appeal to consumers and to brands looking to be at the forefront of packaging material technology. They enable alignment to company sustainability objectives and appeal to those who wish to make a “green” marketing claim. However, there remain challenges within this market. When package developers consider which material and format to package a particular product, there are a number of elements that need to be considered. Some of these include:
• Material/supplier availability • Shelf impact • Distribution channel (club store, drug store, e-commerce, etc.) • Carbon impact across lifecycle
Challenges for biobased feedstock options: Probably the most important attribute, or at least the starting point that must be met with any package, is product protection and package performance. If a package does not protect the product inside, it is not successfully completing the most fundamental part of its job and all of the resources that went into making that product are wasted. Key challenges for biobased and biodegradable packaging:
• Performance - for some new biodegradable materials, the performance requirements for barrier (water and gases), tensile strength, or brittleness can be a challenge for a number of applications.
• Cost – as these materials are new, and have smaller scale production facilities, they often have considerably higher costs than traditional materials they are meant to replace.
• Lack of composting infrastructure – in the U.S., the industrial composting infrastructure is relatively new. Though growing, (as of 2017, there were 148 communities collecting food waste, up from just 79 in 2014) many consumers do not have easy access to composting today. This limits the end of life options for biodegradable/compostable packaging materials.
• Lack of home composting certification – in the U.S., the certification standards of ASTM D6400 and D6868 are for industrial composting, which requires biodegradation at a higher temperature (140° Fahrenheit) than can typically be achieved in home compost. Though there is some discussion from industry to generate a new standard, there is not currently a certification standard for home composting. A home composting certification (AS 5810) is available in Australia.
• Lack of composter desire for compostable packaging – while the ASTM D6400 standard requires 60% biodegradation within 180 days for packaging, many composters typically rotate their aerated windrows made of food and yard waste much more quickly, and do not want the extra time that packaging may take to biodegrade. Thus, even if a package is certified compostable, many compost facilities do not want the package to end up at their facility.
• Consumer engagement/confusion – many consumers are unfamiliar with composting, and even if a package is listed as compostable, they may not understand the end of life options (or have access) for a particular package.
Drivers for biobased feedstock options: Despite the challenges listed above for biobased or biodegradable materials, there are a number of drivers that are enabling opportunities for these materials. Some of these include:
89
• Food waste goals – The U.S. Environmental Protection Agency (EPA) has set a goal of reducing food waste by 30% by 2030. One opportunity to help is through more composting of food, including through the use of compostable packaging which can be composted with the food in foodservice institutions, grocery retailers, and at home
• Legislation – States such as California and Massachusetts already have laws requiring separation of food waste at foodservice institutions that generate a cited level of food waste. Additionally, Circular Economy focused legislation may also lead to greater desire for biobased and biodegradable materials.
• Brand & consumer desire – Brands looking to offer unique sustainability solutions are driving demand for compostable or biobased materials. Some large brands, such as Coca-Cola, have goals to produce much of their plastic bottles using biobased, and fully recyclable materials, and are already implementing these technologies. (see Figure 6-5)
• New Plastics Economy – Led by the Ellen MacArthur Foundation, the New Plastic Economy collaborative, is a group with a vision to drive further packaging recovery infrastructure and fund “Moonshots” to help develop new, innovative materials that are not fossil fuel based.
• Litter/Marine debris – Concerns over the effects of litter and marine debris are leading some industry and influencers such as NGOs to push for biodegradable or marine degradable materials which could be viewed as a way to combat these issues. One must careful in making claims about marine degradable materials, as there are not currently any standards from ASTM or ISO, though there is work taking place to define marine degradability standards. Most bioplastics today, are not designed to break down in marine environments where the temperatures are much lower than in compost piles.
Current Situation Traditional polymer feedstocks One point to keep in mind is that the plastics industry in the U.S. has undergone a transformation in the past decade with the surge in natural gas production from shale. The plastic industry in the U.S. has switched over to the use of natural gas as the main feedstock for plastics production. This has resulted in over three-quarters of U.S. plastic production (as of 2015) using natural gas as the main feedstock, unlike production in Asia and Europe, which largely rely on oil-based feedstocks. U.S. based plastics therefore also tend to have a lower carbon footprint. A multi-laminate sample structure run in the EcoImpact-COMPASS® tool showed a 9% greenhouse gas reduction using
Figure 6-5. PlantBottle® from Coca-Cola is partially biobased, and fully recyclable
90
natural gas versus the European dataset using oil-based feedstocks in the plastic pellet production phase, and over 13% when compared to the Chinese energy dataset. (Plastic pellets resemble small beads and are the material that is heated and formed in the production of plastic films or containers.) Bio-based and biodegradable material options The following section will highlight some of the key bioplastic materials currently used, or in development for the packaging market. This is not meant to be an exhaustive list as there are a number of developments taking place that will undoubtedly yield new breakthroughs. Additionally, mergers, collaborations, and research mean that names, brands, and key players change from time to time. Because of this, this report focuses on the general material category and not a specific brand, where possible. (Note: a more comprehensive list of material categories is available on the FPA Member website section “New and Existing Materials for Flexible Packaging: Environmental Claims”) Examples of some of these bioplastic materials include: Biobased and Biodegradable
• Polylactic Acid (PLA) – Polylactic Acid, or PLA as it is more commonly called, was one of the first bio-based and biodegradable materials to be commercialized in packaging. The feedstock for PLA films today are generally starch based food crops such as corn, sugar beet or cassava.
o Current applications: foodservice packaging, such as clear cups, hot cup lids, and cutlery; food and beverage packaging, including deli, bakery, and produce containers, meat trays, tamper bands, and form/fill/seal yogurt cups. Applications also include non-food packaging. Note: not all of these applications have packages been certified as compostable since a particular application and structure may not meet the ASTM D6400 standard of 180 days for biodegradation.
o Future: There are good opportunities for continued use in foodservice packaging, particularly as composting comes online and since PLA can be certified industrial compostable. Also, new additives and functional benefits will enable increased barrier properties, heat resistance and strength, and drive expansion into other markets.
• Cellulose – Cellulose was perhaps the original biobased material and has been used in packaging for over 90 years. The main feedstock in the production of cellulose is wood pulp.
o Current applications: A layer in some bar wraps (generally compostable films), and coffee bags. Often combined with other materials such as a PLA film.
o Future: Use of micro-fibrillated cellulose (MFC) enabling higher barrier properties and feedstock from crops vs. trees, offering potential for higher performance at lower cost.
91
• Starch based bioplastics – Starch biobased plastics use corn, wheat or potato as their main feedstocks. These materials are used for both rigid and film applications.
o Current applications: compostable coffee pods, compostable food waste bags, and foodservice packaging and cutlery.
o Future applications: continued foodservice applications, particularly mixed with food waste
• Polyhydroxyalkanoate (PHA) - Produced using plant sugar, which can be obtained from sugarcane, corn sugar, and sugar beet, as well as vegetable oils as the feedstock. It is also biodegradable, and generally considered to have a good moisture barrier, leading to interest in food packaging.
o Current applications: PHA is limited to very small-scale applications in packaging, largely due to its higher price versus traditional fossil fuel-based polymers as well as relative brittle nature.
o Future applications: If costs for PHAs can be reduced and flexibility (lack of brittleness) improved, PHAs may have a strong future in food packaging due to their enhanced barrier properties. Potential for use in marine degradable structures.
Biobased not Biodegradable • Bio-Polyethylene (PE) and Bio-PET – these biobased materials have the identical
technical properties to their petrochemical counterparts, so they can be “dropped-in” and replace traditional materials. This also means they have the ability to be recycled, when used in a structure or format that is recyclable, such as a plastic bottle, where a recycling infrastructure exists.
o Current applications: These materials are being used today in applications such as water bottles, soda bottles, laundry detergent bottles, and as a layer in some flexible films. In some of these applications the entire bottle (bio-PE) may be made from a biobased component, and in others, only a portion of the material is biobased today (ex. PlantBottle™).
o Future applications: Wider adoption, particularly as new breakthroughs allow an entire PET bottle to be made from biobased materials, and as scale increases, driving better economics. The NaturALL Bottle Alliance looks to use technology development to
Figure 6-6. NaturALL Bottle Alliance, led by Nestle and Danone looking to increase use of biobased content in water bottles
92
increase the amount of biobased content used in PET bottles in the upcoming years, leading eventually to a recyclable and mostly renewable PET bottle. (see Figure 6-6)
• Polyethylene furanoate (PEF) – is currently in the development stage today, and it has a number of very good properties that make it of great interest in packaging. It is 100% renewably sourced from plant based sugars, has an oxygen barrier six times better than PET, a carbon dioxide barrier three times better, and a moisture barrier two times better.
o Future applications: Soda and water bottles are the current focus, but applications for flexible films with a good gas and odor barrier will follow. PEF has better barrier properties than incumbent traditional materials, which may allow for greater growth.
Not Biobased and Biodegradable o Compostable polybutylene (PB1) esters – an example is BASF EcoFlex®, a
material which uses traditional plastic materials, but is compostable. Used for polybutylene succinate and derivatives that are covered under biodegradable/compostable polyesters. This is the feedstock that enables biosourcing of these materials.
o Current applications: Agricultural films, breathable films for food. o Future applications: Great opportunity for biobased sourcing alliances to
bio-produce succinic acid and 1, 4 butane diol to provide plant-based sourcing in the future.
Forward View Despite strong growth projections of about 20% over the next 5 years, bioplastics are expected to remain somewhat of a niche in the market in the larger scale of plastics. By 2022, they are still expected to comprise less than 2% of the overall plastics market. There remains confusion about the difference between biobased plastics and biodegradable plastics. There is also a need within and outside industry to better communicate the value and best usage opportunities for bioplastics. This may include educating consumers about biobased and compostable materials, where they can be accepted or used, and appropriate end of life options such as composting, recycling or municipal solid waste. Ultimately, there may be benefit in developing a home compostability standard as well. Additionally, there are a number of drivers such as legislation for circular economy impacts, food waste, and marine debris reduction. These, along with brand and consumer desire for sustainable options, are all leading to intense interest in their application. This will continue to drive bioplastics research and development investment as packaging raw material suppliers, converters, brand owners and retailers all look to have technical options ahead of any legislative or consumer demand.
93
The progression of stages in biopolymers is shown in Figure 6-7: Figure 6-7. Biopolymer progression stages
In many cases, there is a carbon impact/lifecycle assessment benefit from the use of biobased materials, which can reduce the carbon impact versus traditional feedstock. Over time, it is expected that biopolymers will continue to evolve and progress in performance and cost, leading to greater application opportunities. Based on the key drivers outlined, as well as investment and research devoted to bioplastics, it is apparent that they are here to stay and have a very good sustainability story but are not without challenges. They remain an important consideration in packaging in the right application looking to balance performance, price and sustainability attributes.
replacements for traditional polymers (ex. Green PE)
•Improved performance through additives/ coatings (ex. PLA with coatings)
Stage 3•Biobased sources•Agricultural waste or
non food (ex. switchgrass), drought resistant plants, algae as feedstocks
•Better performance/ barrier than incumbents
•ex. PEF, PHA •Increased use as
production volumes increase and costs go down
94
Acronyms – Chapter 6 ASTM ASTM International – standards organization BPI Biodegradable Products Institute HDPE High Density Polyethylene (labeled as #2 plastic) ISO International Organization for Standardization LDPE Low Density Polyethylene (labeled as #4 plastic) MFC Micro-fibrillated cellulose NGO Non-Governmental Organization PE Polyethylene PEF Polyethylene Furanoate PET Polyethylene Terephthalate (labeled as #1 plastic) PHA Polyhydroxyalkanoate PLA Polylactic Acid
95
References and Sources:
New and Existing Materials for Flexible Packaging: Environmental Claims, Flexible Packaging Association, Nov. 2012, www.flexpack.org/assets/1/6/New_and_Existing_Materials_for_Flexible_PackagingTOC.pdf
“Bioplastics Market Data.” European Bioplastics e.V., 2017, www.european-bioplastics.org/market/
Confused by the Terms Biodegradable and Biobased. Biodegradable Products Institute, 20 Jan. 2015, bpiworld.org/Resources/Documents/Confused%20by%20the%20terms%20Biodegradable%20Jan%2015.pdf
“Is Microfibrillated Cellulose the Future of Barrier Packaging?” MINI PAK'R, 6 Feb. 2017, minipakr.com/2016/08/20/is-microfibrillated-cellulose-the-future-of-barrier-packaging/
Khosravi-Darani, K., and D.Z. Bucci. Application of Poly(Hydroxyalkanoate) In Food Packaging: Improvements by Nanotechnology. Chemical and Biochemical Engineering Quarterly, 2 June 2015, www.google.com/url?sa=t&rct=j&q=&esrc=s&source=web&cd=11&cad=rja&uact=8&ved=0ahUKEwjO0t6ooOnXAhWLy4MKHV8lDPEQFghcMAo&url=https%3A%2F%2Fhrcak.srce.hr%2Ffile%2F209410&usg=AOvVaw1YX-S1lfozfktpwXuLPUrH.
Laird, Karen. “Biodegradable plastics were never designed to be a solution to marine litter.” European Bioplastics e.V., 27 June 2016, www.european-bioplastics.org/biodegradable-plastics-were-never-designed-to-be-a-solution-to-marine-litter/.
Michell, Nick. “New alliance to develop 100 percent bio-Based bottles.” The Source, 26 Apr. 2017, www.thesourcemagazine.org/new-alliance-develop-100-percent-bio-based-bottles/
Mohan, Anne Marie. “A bounty of options for biopolymers.” Packaging World, 22 Oct. 2017, www.packworld.com/article/bounty-options-biopolymers?utm_source=Packaging_Insights&utm_medium=newsletter&utm_campaign=PW_PI_2017-11-07-Veritiv actual&spMailingID=18425180&spUserID=MzcxMDc2Nzc5MjgxS0&spJobID=1140453780&spReportId=MTE0MDQ1Mzc4MAS2
“PLA and PHAs pushing global bioplastics forward.” Plastics in Packaging, 29 Nov. 2017, plasticsinpackaging.com/online/bioplastics-global-market-set-to-flourish/
Plastics – the Facts. An analysis of European plastics production, demand, and waste value. Plastics Europe, www.plasticseurope.org/documents/document/20161014113313-plastics_the_facts_2016_final_version.pdf
Position of European Bioplastics: Home Composting of Compostable Bioplastics. European Bioplastics, July 2016, docs.european-bioplastics.org/2016/publications/pp/EUBP_PP_Home_Composting.pdf
Reinshagan, Paul. “Why PEF is Better than PET.” Bio Based Press, 1 July 2012, www.biobasedpress.eu/2012/07/why-pet-is-better-than-pet/.
Streeter, Virginia, and Brenda Platt. “Residential Food Waste Collection Access In The U.S.” BioCycle, 11 Dec. 2017, www.biocycle.net/2017/12/06/residential-food-waste-collection-access-u-s/.
Tan, Trina. “Bioplastics-Where exactly are we?” Packaging World, 30 Aug. 2016, www.packworld.com/article/sustainability/bioplastics/bioplastics-where-exactly-are-we
“The New Plastics Economy: Catalysing action.” New Plastics Economy, 2017, newplasticseconomy.org/publications/report-2017
“The Rising Competitive Advantage of U.S. Plastics.” American Chemistry Council, May 2015, https://plastics.americanchemistry.com/Education-Resources/Publications/The-Rising-Competitive-Advantage-of-US-Plastics.pdf
“United States 2030 Food Loss and Waste Reduction Goal.” EPA, Environmental Protection Agency, 2 Feb. 2017, www.epa.gov/sustainable-management-food/united-states-2030-food-loss-and-waste-reduction-goal
Wolford, Erin. “Biopolymers in packaging—some hurdles, but strong signs of growth.” Greener Package, 5 Oct. 2015, www.greenerpackage.com/bioplastics/biopolymers_packaging—some_hurdles_strong_signs_growth
Legislation, Regulations and Flexible Packaging Impacts
Introduction New legislation and regulations can dramatically impact the bottom-line for businesses while also providing “guiderails” for business to operate. Additionally, a view of prospective legislation and regulations can also help businesses better prepare for the future by considering different scenarios and the general regulatory trends, and identify not only challenges, but opportunities as well. The goal of this chapter will be to provide an overview of the different types of legislation and regulations that are currently ongoing in the U.S., as well as provide a cursory view of major legislation in other parts of the globe, which could serve as a precursor to U.S. legislation. The goal is not meant to serve as an all-encompassing view of all current laws and regulations, as those are constantly evolving, but a look at drivers, major pieces of legislation, and their potential impacts toward flexible packaging both now and into the future. Sustainability Drivers: Legislation and regulations continue to evolve at the local, state, and national level, as well as regional laws that can span multiple countries, in the case of the European Union (EU). One way to look at laws and regulations is to consider the key sustainability drivers that are compelling the change in laws or regulations. Additionally, by looking at legislative action in other regions of the globe, we can infer direction where future governance may occur in the U.S. Figure 7-1. Sustainability Drivers Leading to Regulations
98
According to the University of Arizona, a driver is described as “when similar trends are clustered, they become driving forces. When you see a number of trends of different characteristics all pointing in the same general direction, then you have more confidence that change (or continuation of the trends) can be defined by the driving forces. These clusters are often defined as technical, social, political, (environmental) or economic.” Thus, the major sustainability drivers, highlighted in the chart below, capture those key drivers that are leading to current, and likely future packaging legislation and regulation: Figure 7-2: Sustainability Legislative & Regulatory Drivers
1. Carbon – impact to the environment based on carbon and other greenhouse gases. Carbon is often considered a factor in climate change.
2. Safety/health – reduce potential health or safety impacts to people and the environment.
3. Risk management – limit business and government risk from future impacts by identifying risk areas ahead of time and trying to proactively address.
4. Social/transparency – a general movement toward more openness by governments and business, and at times driven by consumer action to have increased overall social well-being for citizens.
5. Financial – as governments look for ways to reduce their overall spend for recovery and municipal solid waste, they are exploring opportunities to pass the cost on to other parts of the market, including converters, and packaging users (brands), and ultimately consumers. Many of the financially driven laws or regulations also incorporate a funding mechanism to either drive material collection or to incentivize consumers to act in a particular manner and reduce material to landfill.
Additionally, legislation and regulations vary widely in geographic scope. Many of the “bag bans,” for instance, are local in nature, affecting a particular community. Other types of legislation are targeted at a much larger geographic scope, such as a particular country, as is the case with many Extended Producer Responsibility (EPR) laws, while
Sustainability Legislative & Regulatory Drivers:
• Carbon
• Safety/health
• Risk management
• Social/transparency
• Financial
99
others such as the Circular Economy (CE) are meant to cover an entire region, including all members of the European Union. Legislative/Regulatory Focus Areas The following section will look at both current and future legislation and regulatory areas that are impacting packaging. This section will not get into specific pieces of legislation but will look at topical areas and their potential impact to flexible packaging. Figure 7-3 below, summarizes some of the primary legislative and regulatory areas expected to impact flexible packaging in both the U.S. and around the globe over the next decade. Figure 7-3. Current and Future Legislative/Regulatory Focus Areas
A brief description of each of these major regulator/legislative focus areas follows: Circular Economy (CE) According to the UK Group WRAP (Waste Resources Action Programme), “a circular economy is an alternative to a traditional linear economy (make, use, dispose) in which we keep resources in use for as long as possible, extract the maximum value from them whilst in use, then recover and regenerate products and materials at the end of each service life.” China and the European Union already have regulatory frameworks developed around CE, driven largely to increase the level of recycling of packaging materials. Europe recently set target goals for a 75% recovery rate for all packaging and 55% recovery rate of plastics by 2030 that each member country must hit to comply with the regulations.
100
See chapter 4 of this report which goes into additional detail about the Circular Economy. Flexible packaging implications: Since much of a circular economy framework is about increasing the amount of material that is collected for recovery, the biggest implication will be increased pressure on industry to have flexible structures that can be recovered and recycled. In some markets, including much of Europe, where waste-to-energy is considered a recovery method, this may be the most likely form of recovery for flexible packaging in the short to mid-term, until new technologies that allow for chemical recycling or other forms of flexible recycling are developed. The European Commission did note however, that “Waste-to-energy processes can play a role in the transition to a circular economy provided that the EU waste hierarchy is used as a guiding principle and that choices made do not prevent higher levels of prevention, reuse and recycling.” Expansion of programs similar to the Hefty® EnergyBag program, which collects difficult to recycle materials, including multi-material laminate flexible packaging for use in a waste-to-energy facility, may also offer an alternative. Longer term implications will be increased pressure to develop flexible structures that can be recovered and recycled and concurrently improve recovery systems and associated technologies. E-commerce E-commerce continues as a major retail growth segment in both the U.S. and globally. A Nielsen study expects grocery e-commerce to grow at over 12% through 2020 in the U.S. There are growing concerns about additional transportation packaging that results from shipping items that are not designed for protection in a traditional parcel shipping system. This can result in excessive air in transport packaging or use of additional filler materials to protect the products being shipped. Flexible Packaging Implications: Flexible packaging has an opportunity to reduce the amount of material used in shipping e-commerce, optimize shipping space on trucks, as well as design packaging that allows for easy returns. In some categories, such as clothing, up to 40% of all products ordered via e-commerce can be returned. Additionally, if packages can be developed using polyethylene (PE) based structures, they could be potentially recycled with grocery bags as part of the How2Recycle bag drop off program.
Figure 7-4. Example of reclosable and reusable flexible packaging for e-commerce
101
Extended Producer Responsibility (EPR) According to the Organization for the Economic Co-operations and Development (OECD), Extended Producer Responsibility (EPR) “is a policy approach under which producers (brands, retailers) are given a significant responsibility – financial and/or physical – for the treatment of disposal of post-consumer products.” The goal of an EPR program is to drive higher collection of materials, reduce packaging sent to landfill, and provide a funding mechanism to shift all, or part of the cost of waste and recycling collection from municipalities and onto the users of packaging. This usually means the brand owners, including retailers, which may have their own private brands, and ultimately the consumer ends up paying the fee. In the packaging world, this usually means a fee that is applied to all packaging at point of sale to the consumer. The program fee is collected by the retailer and used by a third-party entity called a Producer Responsibility Organization (PRO), which brand owners and retailers pay to administer the program, including collection of packaging as well as setting the fee structure for each type of material. Fee structures are set based on weight of material, as well as material value (for recycling). More easily recycled materials have a lower fee than more difficult to recycle materials, however, market value of each material is also a factor. Aluminum, for instance, may have a much lower fee per pound than other materials because of the high market value for recycled aluminum. EPR legislation has been implemented in much of Europe, Canada, South Korea, and Japan, with many other countries also in the early phases of developing EPR frameworks. Some U.S. states have explored the development of packaging specific EPR programs for their state, though as of early 2018, none have yet been passed into law. Flexible packaging implications: EPR fees are usually assessed by a Producer Responsibility Organization (PRO) based on the market value of the material, which is determined by the difficulty in recycling the material, market value along with the weight of the material. Flexible packaging, therefore, can be assessed a higher fee per pound than a paper structure for instance, which is more readily recycled, but because of the lightweight nature of flexible packaging, the amount assessed overall to the flexible package could still be less than other formats. In general, the fees are then built into the sales price of the product sold to the consumer, with the retailer collecting the fee, and passing onto the PRO or government organization to administer waste and recovery collection of all materials. While the likelihood of EPR for packaging being implemented in the U.S. is difficult to assess, it is a regulatory area that needs to be considered and actively monitored, especially at the state level where action on this issue has historically started.
102
Green Chemistry/Toxicity/Migration Green Chemistry/Toxicity/Migration is a fairly broad area, and is largely influenced by the safety/health, risk management, and social/transparency drivers to ensure overall public safety. Green Chemistry is about providing assurances that current materials do not have unintended consequences as well as finding safer alternative chemicals that may have fewer areas of concern. Migration is the focus on certain chemicals leaching from a material, and into the product. This is a topic area that can be complicated due to public perception and scientific findings not always in alignment. In 2016, the U.S. updated the Toxic Substances Control Act (TSCA) which provides EPA with authority to require reporting, record-keeping and testing requirements, and restrictions relating to chemical substances and/or mixtures. Europe has a similar system called Registration, Evaluation, Authorisation and Restriction of Chemicals (REACH). Flexible Packaging Implications: In general, the biggest implication for flexible packaging is understanding the coatings and additives used in different structures, proving current materials and additives are safe, identifying any potential areas of concern, and then development of alternatives, where necessary. An example of a chemical that has not impacted flexible packaging, per se, but has impacted other forms of packaging is Bisphenol-A (BPA), which is used as a coating. BPA is an example where public pressure has led companies to make a change, though the U.S. Food and Drug Administration announced in early 2018 that “based on FDA’s ongoing safety review of scientific evidence, the available information continues to support the safety of BPA for the currently approved uses in food containers and packaging.” Food Waste & Compostable Packaging Decomposing food waste is a large contributor to greenhouse gases around the globe and has garnered much attention is the past few years as countries look to decrease their amount of food waste sent to landfill. The U.S. EPA, for example, has a voluntary goal to reduce food waste by 50% by 2030. Other countries, such as France, have banned grocery stores from dumping food that is edible or could be used for animal feed. As the composting infrastructure continues to evolve and grow, there may be additional legislation, regulation, or guidance to increase the reduction of food waste.
Figure 7-5. Example of an industrial compostable flexible bag
103
Flexible Packaging Implications: Flexible packaging plays a key role in reducing food waste. As food waste concerns continue to evolve, there will be opportunities for packaging that is certified as compostable, whether for foodservice institutions or grocery stores. Flexible packaging that can meet the compostability criteria (ASTM D6400), may play a larger role in these markets. One issue is that in some instances, compost facilities will not accept materials even if they are certified compostable since food waste often breaks down to compost within 60-90 days, much quicker than the 180 days for a package that meets the ASTM standard. Increased Recovery Goals/Waste Reduction Many individual U.S. cities and states, as well as European countries (through the EU) have goals to increase the amount of material that is collected and not sent to landfill. This includes both packaging, as well as food waste. California, for instance, has a goal that 75% of all solid waste be source reduced, recycled or composted by 2020. In the EU, The European Commission has adopted the Circular Economy Package that calls for 75% recycling of all packaging waste by 2030. Flexible Packaging Implications: While flexible packaging is very lightweight and offers great source reduction, the challenge today remains how to economically recover materials and effectively and efficiently use mechanical or chemical recycling technologies. As U.S. states and other countries drive toward higher recovery goals, it will require additional focus on new flexible packaging recycling technologies. This will include development of collection systems for flexible packaging in order to drive increased recovery goals. These recovery systems may include drop off locations, or through new technologies at MRFs, allowing flexible packaging to be identified and separated. Alternatives may include programs such as the Hefty® EnergyBag program, or waste-to-energy facilities, which are used extensively in Europe, Japan, and South Korea. To learn about recycling technologies, please see chapter 5. Increased Recycled Content With China’s National Sword program forcing other countries to find additional outlets for their recycled materials, a logical growth area will be to add additional post-consumer recycled content into packaging. This is already done in some materials such as corrugated, paperboard, and steel and aluminum cans, as well as some rigid plastic
Figure 7-6. Hefty Energy Bag is bright orange for easy identification in curbside recycling programs
104
packaging. Increasing packaging recycling content aligns well with both CE and Sustainable Materials Management (SMM) principles. Flexible Packaging Implications: Legislation of incorporating PCR content into rigid packaging already occurs in rigid plastics in California. While there are some examples of flexible packaging using recycled content, it is minimal at this time. With the potential push for more recycled content, however, there may be additional opportunities for multi-material flexible laminates to use recycled content, perhaps sandwiched between an inner and outer layer. One issue with using more recycled content in flexible packaging is the health concerns with food, health and beauty, pharmaceutical, and medical device packaging, where sterility is of upmost importance. Food packaging comprises the largest segment of the flexible packaging industry. There may be a further push to get recycled content into flexible overwraps on non-direct food contact applications such as paper towel, napkin, and bulk containment (i.e., water bottle multi-packs). Marine Debris Marine debris has been a relatively new focus area for legislation and regulations with increasing concern for how packaging (and other waste) makes its way into waterways. According a study by the Ocean Conservancy, 60% of global marine debris originates from five countries in Asia (China, Indonesia, Philippines, Thailand, and Vietnam). This is largely due to these countries lacking appropriate solid waste and recovery systems, coupled with a growing consumer appetite for the convenience of packaged goods. Much of the legislative focus, however, at this point, is in western countries and some U.S. states. At this time, the goal of proposed legislation is to drive greater consumer awareness, as well as potential taxes to fund beach or waterway clean-up and recovery, which may positively impact the environment locally, but will not impact marine debris in any significant way globally. The Ellen MacArthur Foundation’s New Plastics Economy report highlighted that just two percent of “ocean leakage” of plastics came from the U.S. and Europe combined, while 82% came from Asia. This shows that initiatives to significantly reduce marine debris needs to be focused on these countries, with limited or non-existent MSW recovery systems. Flexible Packaging Implications: Marine debris will be an area for flexible packaging producers to watch, as taxes to fund collection and environment clean up could be targeted at non-compostable and non-marine degradable materials. The taxes would be used to fund beach and marine environment cleanups. Potential development of marine degradable materials in the long term (such as PHA, which has been certified by Vinçotte International in Europe as marine degradable) hold long term opportunities for flexible packaging.
105
Material Bans/Fees Material bans/fees thus far have generally focused on plastic grocery bags or certain materials such as Expanded Polystyrene (EPS) in local municipalities. Consumer visibility of these materials is high, and when not properly disposed of can lead to litter; get stuck in trees and other infrastructure; and in waterways. Other cities have charged a fee per bag, to drive the use of reusable bags and reduction in plastic bag use. Municipalities such as Seattle have also required that all foodservice packaging be recyclable or compostable. Flexible Packaging Implications: The ban on grocery bags in certain regions has been the primary impact to flexible packaging thus far. It does show, however, that there are longer term concerns about the end of life for flexible packaging (like all packaging materials) and the desire for enhance recovery systems. And where they do not exist or do not exist in sufficient capacities, product bans will occur. Pay-As-You-Throw (PAYT) Pay-As-You-Throw (PAYT) is a municipal waste service where a variable fee is charged to consumers for municipal waste collection based on the amount of trash they generate. This is different than most MSW/trash services where fees are a part of property taxes and are a fixed fee, regardless of how much trash is generated by a household. The consumer incentive for PAYT is to have a lower service fee through increased use of recycling and less overall trash. This is similar to other municipal services such as water, gas, and electricity where consumers are charged based on how much they use, rather than a fixed fee. More communities have been exploring the use of PAYT to encourage residents to recycle more and reduce the amount of material picked up as trash. PAYT models are often implemented by requiring consumers to buy special trash bags or tags (a certain color for instance) that must be used in order to ensure the fee has been paid. Flexible packaging implications: Since multi-material flexible packaging takes up little space (volume) and is very lightweight, a PAYT model would have little direct impact on the use of flexible packaging. PAYT could, however, discourage use of heavier or rigid non-recyclable package formats which would result in the trash bags being filled more quickly. Printed Electronics As our homes and lives become more entwined with the Internet of Things (IoT), packaging that is linked to the internet will become more common place as well. Printed electronics use inks or tags on products and packages to enable RFID, NFC or other technologies to allow traceability, security features, or consumer interactions through their phone or other enabled appliances. Note that printed electronics can be used to replace traditional electronics as well, so their use is not limited to just packaging.
106
Potentially the tags could even tell consumers if a package is recyclable in their area or help equipment at recycling facilities sort the material. However, there is potential for some of these tags, which use metal ink flakes for printing, to render some packages more difficult to recycle, or to potentially have the inks leech out, if landfilled. Flexible Packaging Implications: Printed electronics are in their infancy and known implications are likely fairly minor for flexible packaging at this time. The use of printed electronics has started on high end product liquors and pharmaceutical products and will make their way onto higher volume food and beverage items in the near future. As usage increases, flexible packaging converters will need to be aware of any potential recycling impacts from printed electronics. Recyclable Material Exports/National Sword (China) China’s National Sword is a program to severely limit the importation of recovered paper and plastic that does not meet a strict quality standard for residue or other material in the bales of recovered material. This was done to improve quality of recycled material sent into China and reduce toxic residue that was also found in recovered materials. Through 2017, China was a major importer of recovered paper and plastic. A 2014 report by the International Solid Waste Association stated that China received 56% of the global plastic waste, including 87% of all of Europe’s plastic waste exports. China absorbed about 30% of all of North American recyclables (plastics, paper, steel, etc.) in 2016. The severe restrictions on recovered material imports by China will force other countries to better develop post-consumer recycled material markets internally, rather than relying on shipments China. In the short term, countries may look to send their post-consumer recycled materials to other countries with less developed regulations. Flexible Packaging Implications: Since most flexible packaging is not currently collected for recycling and does not currently use large amounts of post-consumer recycled content, the impact of the National Sword program will be relatively limited for flexibles. One concern, however, may be if flexible packaging does get into a recycling facility, it may be viewed as contamination for other baled materials. Until more
Figure 7-7. Photo of recycled plastic bales. (Creative Common)
107
recycled content is used in domestic production of other plastics, including packaging, material collected for recycling may not actually be recycled. In the longer term, China’s decision to not accept imported recyclable material will drive opportunities to find outlets domestically for recycled materials. Additionally, it will drive better overall technology development around sortation to increase bale quality. This could also drive additional companies to obtain letters of non-objection from the U.S. FDA for use in direct food contact applications. Sustainable Materials Management The focus on SMM is one of guidance and not yet a regulatory or legislative directive. According to the U.S. EPA, “SMM refers to the use and reuse of materials in the most productive and sustainable way across their entire life cycle. SMM conserves resources, reduces waste, slows climate change, and minimizes the environmental impacts of the materials we use.” Chapter 4 of the report goes into the SMM framework in more detail. The U.S. EPA, along with some states, are using this framework to guide long term decisions on waste management versus traditional approaches which often focused on landfill use as the most simple and cost-effective method for handling MSW but is outdated and did not take into account issues such as climate change impacts, or food waste. Flexible Packaging Implications: As the EPA Waste Hierarchy lists source reduction at the top of its list for ways to reduce solid waste impacts, flexible packaging aligns very well with SMM principles. While the focus on SMM is overall waste reduction, long term, it also focuses on design for recovery. The need for improved recovery systems that keep flexible packaging out of landfills will be needed. The development of flexible structures that can be recycled as part of the plastic bag drop off program (WRAP) or future flexible material recovery programs will further align with both SMM and CE principles. Waste-to-Energy (WTE) Waste-to-energy (WTE) is a term applied to the municipal solid waste (MSW) management option where the waste is taken directly to specially designed power plants that combust the MSW as fuel to create steam, and the steam is used to create electricity. WTE reduces trash volume by 90 percent, converting it to ash.
Some plastic materials such as multi-material laminates are difficult to economically recycle. Thus, WTE is widely used in Europe and Japan as a tool for waste management and energy generation for these materials. Examples of WTE technology include pyrolysis and the Hefty® EnergyBag programs. (The topic of Waste to Energy is more widely discussed in Chapter 4 of this report). WTE enables the capture of BTU’s within a structure to be collected for energy production rather than being lost in a landfill. This is not to be confused with incineration which took place in the 1960s, where MSW was burned, but energy was not captured.
108
As states look to reduce landfilling, WTE offers an option for getting value out of materials. According to its website, the U.S. EPA “continues to develop regulations that encourage energy recovery from…...materials that might otherwise be disposed of as solid waste.” Flexible Packaging Implications: Waste-to-Energy may offer a short to medium term option for flexible packaging recovery, until new recycling technologies are developed. It is already widely used in Europe and Japan, and programs that aggregate hard to recycle materials offer examples of how flexible packaging can be collected as part of curbside programs. Additional infrastructure will be required in the U.S. before it came become a significant part of the MSW solution. Summary/Forward View It is apparent that legislation and regulations will continue to have an impact on packaging over the next decade. The legislative landscape in Europe and in individual U.S. states, for instance, is likely to be a leader in setting precedent that will impact packaging, and could influence policy actions in North America over time. Overall sustainability drivers such as risk management and social/transparency will be the thrust behind much of the legislation, as well as a desire to pass (all of part of) the cost of material recovery away from municipalities and onto the packaging value chain, and ultimately consumers. While all of the identified area could have an influence on flexible packaging, Increased Recovery Goals could have the most direct short-term impacts, while CE, Extended Producer Responsibility (EPR), and concerns about single use packaging and marine debris may have longer term impacts. It is also important that flexible packaging producers monitor not only regulations and legislation, but also actively scan for and consider any emerging issues or disruptors that could come up. The drivers of risk management and transparency are not going away and will become increasingly important to be built into business practices.
109
Acronyms – Chapter 7
CE Circular Economy EPA U.S. Environmental Protection Agency EPR Extended Producer Responsibility EPS Expanded Polystyrene EU European Union FDA U.S. Food and Drug Administration IoT Internet of Things MSW Municipal Solid Waste NFC Near-Field Communication OECD Organization for Economic Co-operation and Development PCR Post-Consumer Recycled PE Polyethylene PHA Polyhydroxyalkanoate PRO Producer Responsible Organization RFID Radio-Frequency Identification SMM Sustainable Materials Management TSCA Toxic Substances Control Act (U.S.) WRAP Wrap Recycling Action Program WRAP (UK) Waste Resources Action Programme WTE Waste to Energy
110
References and Sources:
Atkinson, James Edward. “Fate of Conductive Ink Pigments During Recycling and Landfill Deposition of Paper-Based Printed Electronics.” Western Michigan University, June 2017, scholarworks.wmich.edu/cgi/viewcontent.cgi?article=4128&context=dissertations.
Caldwell, Rodger. “Paradigm Shifts. Driving Forces and Trends.” University of Arizona, cals.arizona.edu/futures/era/eramain.html.
California Department of Resources Recycling and Recovery (CalRecycles). “Packaging Materials Management.” California Department of Resources Recycling and Recovery (CalRecycles), 12 Oct. 2017, www.calrecycle.ca.gov/reducewaste/Packaging/.
“Categories Display.” Understanding REACH - ECHA, European Chemicals Agency, echa.europa.eu/regulations/reach/understanding-reach.
Center for Food Safety and Applied Nutrition. “Public Health Focus - Bisphenol A (BPA): Use in Food Contact Application.” U S Food and Drug Administration Home Page, Center for Food Safety and Applied Nutrition, 6 Feb. 2018, www.fda.gov/newsevents/publichealthfocus/ucm064437.htm.
“E-Commerce is Fueling U.S. Retail Growth and Omni-Shopper Opportunities.” What People Watch, Listen To and Buy, 27 Apr. 2017, www.nielsen.com/us/en/insights/news/2017/e-commerce-is-fueling-us-retail-growth-and-omni-shopper-opportunities.html.
“Energy Recovery from the Combustion of Municipal Solid Waste (MSW).” EPA, Environmental Protection Agency, 14 Apr. 2017, www.epa.gov/smm/energy-recovery-combustion-municipal-solid-waste-msw.
Evaluation of Extended Producer Responsibility for Consumer Packaging. Grocery Manufacturers Association, Sept. 2012, www.gmaonline.org/file-manager/Sustainability/GMA_SAIC_EPR_Report_091112.pdf.
“Food Service Packaging Requirements.” Food Package Requirements--Seattle Public Utilities, City of Seattle, www.seattle.gov/util/forbusinesses/solidwaste/foodyardbusinesses/commercial/foodpackagingrequirements/.
Food-Contact substances under the spotlight in the European Union and the United States. Keller and Heckman, 1 Aug. 2016, www.khlaw.com/9405.
111
Gore-Langton, Louis. “France's food waste ban: One year on.” Foodnavigator.com, 24 Mar. 2017, www.foodnavigator.com/Article/2017/03/24/France-s-food-waste-ban-One-year-on.
Hardcastle, Jessica Lyons. “Hefty Energy Bag Programs Helps Companies Reach Zero Waste Goals.” Environmental Leader, 27 Feb. 2017, www.environmentalleader.com/2017/02/hefty-energy-bag-programs-helps-companies-reach-zero-waste-goals/.
Kaskey, Jack, and Ann Koh. “China's Blow to Recycling Boosts U.S.'s $185 Billion Plastic Bet.” Bloomberg.com, Bloomberg, 5 Dec. 2017, www.bloomberg.com/news/articles/2017-12-06/china-s-blow-to-recycling-boosts-u-s-s-185-billion-plastic-bet.
Lingle, Rick. “Danimer Scientific's biodegradable resins attract Frito-Lay and other brands.” Plastics Today, 8 Mar. 2018, www.plasticstoday.com/packaging/danimer-scientific-s-biodegradable-resins-attract-frito-lay-and-other-brands/162755889358383.
Misko, George. “U.S. and EU Requirements for Recycled Food Contact Materials.” Food Safety Magazine. Oct 2013, https://www.foodsafetymagazine.com/magazine-archive1/octobernovember-2013/us-and-eu-requirements-for-recycled-food-contact-materials/
Morawski, Clarissa. “Dispatches from Europe: Big changes planned by the EU.” Resource Recycling News, Resource Recycling, 23 Jan. 2018, resource-recycling.com/recycling/2018/01/23/dispatches-europe-big-changes-planned-eu/.
“Study from Trucost Finds Plastics Reduce Environmental Costs by Nearly 4 Times Compared to Alternatives.” American Chemistry Council, 26 July 2016, plastics.americanchemistry.com/Study-from-Trucost-Finds-Plastics-Reduce-Environmental-Costs/.
“Summary of the Toxic Substances Control Act.” EPA, Environmental Protection Agency, 28 Nov. 2017, www.epa.gov/laws-regulations/summary-toxic-substances-control-act.
“United States 2030 Food Loss and Waste Reduction Goal.” EPA, Environmental Protection Agency, 11 Dec. 2017, www.epa.gov/sustainable-management-food/united-states-2030-food-loss-and-waste-reduction-goal.
Velis, Costas. Global Recycling Markets: Plastic Waste. A Story for One Player - China. International Solid Waste Association, Sept. 2014,
Walker, Peter. “UK considers tax on single-Use plastics to tackle ocean pollution.” The Guardian, Guardian News and Media, 17 Nov. 2017, www.theguardian.com/environment/2017/nov/18/uk-considers-tax-on-single-use-plastics-to-tackle-ocean-pollution.
Winn, Patrick. “5 countries dump more plastic into the oceans than the rest of the world combined.” Public Radio International, 13 Jan. 2016, www.pri.org/stories/2016-01-13/5-countries-dump-more-plastic-oceans-rest-world-combined.
113
Chapter 8
Life Cycle Assessments and Flexible Packaging
Introduction As companies have become more informed about sustainability, many have set specific goals to reduce their environmental impact. Corporate sustainability goals often include specific metrics tied to packaging. These may include weight reduction in total amount of packaging used, recyclable packaging use, reduction in factory waste sent to landfill, and carbon footprint among others. Making a selection of the “optimal” package requires a balance of a number of key attributes which are conveyed in Figure 8-1. These include product protection, packaging cost and material options, brand equity that is conveyed through the package design, the consumer experience enabled through features such as easy opening and reclose, sustainability attributes linked to the brand/company, and finally any service such as weblinks or 1-800 numbers for other product information. Figure 8-1. PTIS Product Formula
Consumers view products as an integrated experience and transfer experiences with the package to the product. As such, sustainability attributes are almost never considered on their own, but as part of the entire product experience for consumers. About Life Cycle Assessment (LCA) Because of the many challenges in quantifying sustainability impacts, a number of companies are using life cycle assessment (LCA) tools to help understand and quantify the environmental impacts in the design phase, before a package is brought to market. An LCA is a method for characterizing impacts associated with the sourcing, manufacturing, distributing, using, and disposing of a product or product system. The tool is used by product and package developers to calculate environmental impacts such as fossil fuel consumption, greenhouse gas emissions, and water consumption. Understanding these LCA indicators gives them an idea of the environmental footprint of products and packages. This allows developers to benchmark current designs and compare new design options. An LCA, however, can be a very time consuming and expensive process looking at impacts of material extraction, processing, transportation, and end of life for every product. More companies are using “streamlined” LCA tools, which use industry
114
provided data, validated by independent third parties, rather than data specific to an individual company's exact process. This allows for much faster and less costly assessments. It also allows for packaging developers to do more “what if” scenarios quickly to understand potential environmental impacts at the design stage and hone in on the preferred options more quickly. The development and use of an LCA requires the definition of the system, as well as obtaining the background information necessary to obtain the desired environmental impact metrics. The first step is to define the goal and scope of the system that will be evaluated (Figure 8-2). In the case of this study, the system is the process of extracting materials, converting, distribution, and end of life for a package. Figure 8-2. LCA Overview
The inventory analysis utilizes data of energy or water used within each stage (extraction, conversion, etc.) of the system. The impact assessment uses that input data to drill down to “what does it mean,” such as what are the emissions based on the fossil fuel used in production of that system. Finally, the LCA tool allows for interpretation and comparison of different materials, package formats, and packaging components based on a common functional unit, such as weight of product, or number of product uses.
Terminology Life Cycle Inventory (LCI) - component of an LCA that tabulates or prepares a numerical accounting of the emissions or energy and raw materials consumption of a system.
Life Cycle Impact Assessment (LCIA) - the “what does it mean” step. In LCIA, the inventory is analyzed for environmental impact. For example, manufacturing a product may consume a known volume of fossil fuel (this data is part of the inventory); in the LCIA phase, the greenhouse gas impact from combustion of that fuel is calculated Life Cycle Assessment (LCA) - A holistic assessment of the environmental emissions and resource and energy consumption of a system of processes or activities and the potential environmental impacts of those emissions or consumption. It is holistic because it includes activities from cradle (extraction of resources from the earth or biota) to grave (ultimate disposal of the expended resources back into the earth).
System – The set of process or activities necessary to perform a service or produce a product.
115
Life Cycle Boundaries Within the use of an LCA, one of the critical components to consider is what the boundary of the system will be. An example in packaging, is a system boundary of “Cradle to Factory Gate” or “Cradle to Grave.” Figure 8-3 shows an example of a “Cradle to Factory Gate” where the boundary goes from raw material manufacture up to the forming of a package, which could be laminating multiple layers of film to form a flexible pouch. Figure 8-3. Cradle to Factory Gate Boundary and Flexible Package System Example
In Figure 8-4, a Cradle to Grave approach expands the boundary to include the transportation and end of life impacts. Figure 8-4. Cradle to Grave Boundary and Flexible Package System Example
For the life cycle assessment used in this study, a Cradle to Grave boundary was used. Additionally, only the primary package was evaluated for the case studies. The life cycle assessments did not include any changes from pallet density based on primary package selection or impacts from secondary or tertiary packaging. The LCA summary for each of six case studies can be found immediately after this section, on page 133. The software tool utilized for the LCA example provided in this report was EcoImpact-COMPASS®. This tool was developed specifically to provide a streamlined LCA for the packaging industry. About EcoImpact-COMPASS® EcoImpact is a holistic package and product sustainable platform to calculate various sustainability indicators. The platform houses the Comparative Packaging Assessment (COMPASS®) developed by the Sustainable Packaging Coalition (SPC), which is part of
Raw Material Manufacturing
Package Manufact-
uring/ Conversion
Packaging Process
Raw Material Manufacturing
Package Manufact-
uring/ Conversion
Packaging Process
Transport-ation End of Life
Cradle to Plastic Pellets
Pellets to Flexible Film
Flexible Film to Pouch
Inbound/ Outbound
Recycle/ Landfill
Cradle to Plastic Pellets
Pellets to Flexible Film
Flexible Film to Pouch
116
GreenBlue, an environmental nonprofit dedicated to the sustainable use of materials in society. COMPASS® is a module that enables companies to model various packaging systems and calculate the environmental impact using a screening LCA method. EcoImpact was developed as a guidance tool that can inform material selection for packaging and/or product design. Essentially, it is a design-phase tool that provides comparative environmental profiles for packaging/product designs based on life cycle assessment metrics and additional attributes. The information provided through an LCA can help a company make data-driven decisions in evaluating alternative packaging options. The packaging systems are modeled using industry average data for common packaging materials, processes, and end of life scenarios. This provides a consistent approach to gauge the relative performance of one package design to another based on the packaging functional unit. COMPASS® also allows users to:
• Model primary, secondary, and tertiary packaging components + entire systems • Analyze detailed environmental impacts (consumption and emission metrics) • Identify hotspots or areas for improvement • Benchmark the environmental profile of a company’s existing packaging • Compare up to four different design alternatives • Incorporate environmental feedback into designs
More companies are incorporating the use of an LCA tool as part of the development process to drive decision making and alignment with overall corporate sustainability goals. Some tools such as EcoImpact-COMPASS® can be used to help measure the carbon impact or total packaging weight used annually, when linked with procurement and specification systems. This can help companies understand their total impact of packaging and compare metrics from year to year. The scope of the study used in this report focused on fossil fuel consumption, greenhouse gas emissions (carbon footprint), and water consumption utilizing a streamlined LCA tool, in this case EcoImpact-COMPASS®. Additional information about the tool and background on life cycle assessments are below.
Why EcoImpact-COMPASS® EcoImpact-COMPASS® was used for the life cycle assessment package comparison in this report as it is a widely accepted tool within the packaging community. The tool has been continuously revamped as new manufacturing and converting information is available. The EcoImpact-COMPASS® tool also uses data from ecoinvent, U.S. Life Cycle Inventory Database (part of the National Renewable Energy Laboratory), and other LCA databases which are widely used. EcoImpact-COMPASS® allows for a Cradle to Grave boundary as it can also incorporate in transportation and end of life (recycling or landfill) impacts.
117
EcoImpact-COMPASS® output includes metrics around a number of environmental impact categories, including:
• Fossil Fuel Consumption (MJ-equivalent) • Greenhouse Gas Emissions (Kg CO2-equivalent) • Water Consumption (Liters)
To generate comparable data, the EcoImpact-COMPASS® tool will calculate a common weight or volume of product between the different package formats, and develop a report based on all package formats using the same amount of product. This allows package formats that may not be exact in size to be compared, based on overall product weight or volume. For comparisons used in the study, products with as similar as possible weights or volumes were used to minimize the environmental impacts caused by size differences. The output from the tool allows for an easy comparison across the environmental impacts, incorporating data from material formation, package manufacturing, transportation, and end of life. (See Figure 8-5 below) Figure 8-5. Example of Output from EcoImpact-COMPASS® for Coffee
LCA Application and Case Studies The following section will provide an overview of how the product categories were selected, along with the approach, data, and output gathered. Approach: PTIS and FPA selected product/packages from six unique product categories, each with high sales volume and/or high sales growth. The approach helped develop the data requirements, establish data collection methods and analysis approaches, and facilitate understanding of the life cycle trends and drivers.
118
The FPA inquired about comparing different packages using environmental metrics, including:
Fossil fuel consumption Greenhouse gas emissions Water consumption Product/package ratio Material (by weight) to landfill
EcoImpact-COMPASS® requires the following information (Table 8-A) for inputs into the tool: Table 8-A. EcoImpact-COMPASS® Required Inputs and Assumptions
Input Example Assumptions Type of material PET, steel, aluminum
Converting process Composite, plastic container, bag
Weight By package material and component (for multi-layer flexible packaging, weight need by each layer)
Recycled content Steel can with XX% of recycled content
No recycled content was assumed for any primary packages, other than steel where a preset value of 37% is incorporated into EcoImpact-COMPASS® based on industry average
Transportation - inbound
Distance for incoming truck by material
500 miles
Transportation - outbound
Distance for finished good by truck by package
500 miles
To generate the necessary inputs for the streamlined LCA, PTIS gathered off the shelf package samples from stores, and weighed all of the primary packaging components. (Note: A primary package is the package/material that makes immediate contact with the product inside. For a case of water, the plastic bottle, cap, and label on the bottle would constitute the primary package. Any paperboard carrier or plastic wrap, would be considered secondary or tertiary packaging and was not included in the LCA). All of the multi-material flexible packages were weighed, but as the materials are adhered to each other, it is not possible to separate them. An outside packaging expert
119
was consulted to provide typical packaging structures used for each of the multi-material flexible structures, and weights based on material densities were calculated for inputs into the EcoImpact-COMPASS® tool. The EcoImpact-COMPASS® streamlined LCA tool was used to calculate the fossil fuel consumption, greenhouse gas emissions, and water consumption rates. The focus of this streamlined LCA was on a comparison of primary packages as shown in Table 8-B. The EcoImpact-COMPASS® tool was used to evaluate a wide range of product categories with a number of packaging configurations for the following product categories: Table 8-B. Overview of Case Study Package Formats
Case Study Formats Assessed General Product Information
Baby Food • Pouch with fitment • Thermoformed Tub • Glass jar
• High barrier • High volume product • New flexible format
Laundry Detergent Pods
• Stand-up Pouch with zipper • Rigid PET container
• New product format • High volume sales • High moisture
barrier Cat Litter • Stand-up bag
• Barrier carton • Rigid pail
• High moisture barrier
• High strength based on product weight
• High volume product Single Serve Juice Flavored Beverages
• Drink Pouch • Composite Carton • PET Bottle • Aluminum Can • Glass Bottle
• Wet product • High strength based
on product weight • Very high-volume
product • Many package
formats
120
All of the products selected for the case studies were in high volume or growing areas, where a variety of package formats are available for comparison. General LCA Assumptions/Exclusions Items not included in the streamlined LCA were:
• Minor packaging components – generally less than 5% by weight – which include adhesives, inks, and coatings impact.
o These components make up a very small percentage of most packages and are not available in streamlined LCA or part of the analysis within the EcoImpact-COMPASS® tool.
o Full LCAs have usually shown these components to have a minor impact in fossil fuel, greenhouse gas, and water consumption.
• Secondary/Tertiary packaging impacts – with the focus of this report on primary packages, secondary or tertiary components like overwraps, cartons, or shipping containers were not included.
• Pallet loads – again, with a focus on primary packages, without calculating size and weight of secondary/tertiary packaging, the pallet load pattern was not calculated or included.
About the Environmental Indicators/Metrics The following will discuss the background of the environmental indicators and metrics selected for this report to provide broader context as to why these metrics are important considerations for package format and material selection. For all percentage comparisons in EcoImpact-COMPASS®, the tool uses percent change. The formula is: ((Other pkg value – flexible pkg value)/ flexible pkg value)*100 = percent change. This formula for percent change was also used for any “packaging landfilled” comparisons in the tables. Fossil Fuel Consumption Fossil fuel consumption focuses on the energy consumption through the use of fossil fuels (i.e., natural gas) throughout the package life cycle, from raw material extraction, through conversion, and ultimately end-of-life impacts. It is a measure of the total quantity of fossil fuel consumed throughout the life cycle reported in mega joules equivalents. Since it requires different quantities of these fossil fuels to generate one unit MJ, this measure uses MJ-eq to aggregate them. It is also a measure of how efficiently energy or fossil fuels are used in the manufacture of materials. In this metric, lower fossil fuel consumption values are preferred. One point to keep in mind is that the plastics industry in the U.S. has undergone a transformation in the past decade with the surge in natural gas production from shale. The plastic industry in the U.S. has switched over to the use of natural gas as the main feedstock for plastics production from oil-based sources. This has resulted in over three-
121
quarters of U.S. plastic production (as of 2015) using natural gas as the main feedstock, unlike production in Asia and Europe, which largely continue to rely on oil-based feedstocks. EcoImpact-COMPASS® uses the latest information from the U.S. energy sector which takes this transition into account when calculating the fossil fuel consumption. Greenhouse Gas Emissions (GHG) Greenhouse gas emissions (GHG) or carbon footprint, is one of the more widely used environmental indicators in life cycle assessment work. In response to legislation in many countries and regions that place a cost on carbon output, many companies have set goals to reduce their overall carbon emissions. Packaging can have a role here, not only in the carbon impact of the manufacturing of the different materials, but also through the transportation impacts of the different materials based on the weight of the materials, and number of trucks need to transport both incoming materials, as well as outgoing materials to retail and consumers. Additionally, greenhouse gas emissions are an important factor in climate change. The U.S. EPA says “Carbon dioxide (CO2) is the primary greenhouse gas emitted through human activities. In 2015, CO2 accounted for about 82.2% of all U.S. greenhouse gas emissions from human activities.” The EPA goes on to say, “Human activities are altering the carbon cycle–both by adding more CO2 to the atmosphere and by influencing the ability of natural sinks, like forests, to remove CO2 from the atmosphere.” The EcoImpact-COMPASS® software measures the total quantity of greenhouse gases (GHG) emitted throughout the lifecycle reported in CO2 equivalents. This calculation follows the latest Green House Gas Protocol (GHGP) and is updated with latest substance flows and factors from Intergovernmental Panel on Climate Change (IPCC) 2013. This indicator also accounts for carbon sequestration and biogenic carbon. Again, lower emissions values are preferred, as they show more efficient use of resources and the resulting emissions. Water Consumption Water consumption is a topic that has grown in awareness as concerns about water quality and drought impacts increase. Concerns are generally in relation to production of different beverage or food products, which can have a high water consumption and not packaging. While packaging materials will often have a much smaller water consumption than the products themselves, there are some packaging materials, such as paper based materials, which are more water intense than others. Within the EcoImpact-COMPASS® tool, water consumption is a measure of the quantity of surface water and groundwater required throughout the life cycle reported in liters. Non-consumptive sources of water (e.g., water used for navigation) are not included. Lower water use values are preferred, as they show more efficient use of resources.
122
Product-to-Package Ratio (including by percentage) The Product-to-Package Ratio takes the declared product weight divided by the total package weight to develop a ratio showing material efficiency. Product-to-Package ratio = (declared product weight/ primary package weight) A higher product number (the first number) indicates more efficient use of materials as less packaging by weight is being used to protect the product. The Product-to-Package ratio (by percentage) is calculated by dividing the declared product weight, by the (total weight of declared product + primary packaging weight), resulting in a percentage of what proportion sold to the consumer is attributed to the product (by weight) and the percentage attributed to the package (by weight). Product-to-Package ratio (by percentage) for a product = declared product weight/ (declared product weight + primary package weight) Again, this is a measure of the efficiency of overall material usage. As before, a high first number for the product, and lower second number for the package is preferred as it shows the most efficient use of packaging resources necessary to contain and protect the product. Packaging Landfilled The packaging landfilled is a measure of how much packaging material typically ends up in a landfill, after current recycling values for each packaging component are considered. The recycling values for each material were determined based on published reports from the U.S. EPA Advancing Sustainable Materials Management Fact Sheet, the 2015 APR Post Consumer Bottle Recycling, and A Study of Packaging Efficiency as It Relates to Waste Prevention (January 2016) reports. For all of the materials, it was assumed that all materials collected for recycling were actually recycled. Additionally, it was assumed that none of the multi-material flexible packaging used in the case studies was recycled. The values in the case study charts, shown starting on page 133 were based on a comparison of the amount of packaging material ultimately disposed for 1000 kg of product, with lower values being preferred, as this means less material is going for landfill disposal. Summary The charts below show the summary results of six different case studies that were developed as part of this report (see Table 8-B, page 128). To enable comparisons between products with different weights, the EcoImpact-COMPASS® tool calculated a common weight or volume of product between the different package formats, and generated a report based on all package formats using the same amount of product.
123
Therefore, the fossil fuel consumption, greenhouse gas emissions and water consumption values should not be compared between the different studies as they all utilize a different functional unit (or common weight) value to enable comparisons within each of the product categories but can be used for comparison within each case study. Additionally, in all of the tables, the percentages shown are using the flexible package as the baseline in the case study. Percentages in red mean those values are less preferable than the flexible package, while percentages shown in blue mean those values are preferable to the flexible package.
The data below provides a summary for each of the case studies. For additional detail of the individual studies, visit the detailed analysis for each in the following section titled Life Cycle Assessment Case Studies.
Case Study Summary
Page: Full LCA Page:
Coffee Packaging 133 138 Motor Oil 133 145 Baby Food 134 151 Laundry Detergent 134 157 Cat Litter 135 162 Single Serve Juice 135 168
124
Coffee Packaging Case Study Table 8-C. Coffee Packaging Comparison Summary
Format Fossil Fuel Consumption
(MJ-Equiv)
GHG Emissions (kg-CO2 equiv)
Water Consumption
(l)
Product-to-Package ratio and
percent wt.
Pkg Landfilled (g)/1000 kg coffee
Stand-up flexible pouch
6,654 353 1011 24.8:1 96.1%:3.9%
40,294
Steel can
36,809 (+453%)
2763 (+683%)
17,238 (+1605%)
2.0:1 67.1%:32.9%
163,122 (+304%)
Plastic (HDPE) canister
41,130 (+518%)
1678 (+376%)
3,164 (+213%)
4.8:1 82.8%:17.2%
142,063 (+252%)
Notes:
• A normalized product weight (common value divisible by all package formats) of 1,927,800 grams of product was used for Fossil Fuel, GHG and Water Consumption calculations.
Motor Oil Case Study Table 8-D. Motor Oil Packaging Comparison Summary
Format Fossil Fuel Consumption
(MJ-Equiv)
GHG Emissions (kg-CO2 equiv)
Water Consumption
(l)
Product-to-Package ratio and
percent wt.
Pkg Landfilled (g)/1000 kg motor
oil Stand-up Pouch with Fitment
14.12 .5998 1.03 38.0:1 97.4%:2.6%
26,301
HDPE Bottle
38.58 (+173%)
1.52 (+153%)
6.33 (+513%)
14.8:1 93.7%:6.3%
45,501 (+73%)
Notes:
• A normalized product weight (common value divisible by all package formats) of 224 fl. oz. of product was used for Fossil Fuel, GHG and Water Consumption calculations.
125
Baby Food Case Study Table 8-E. Baby Food Packaging Comparison Summary
Format Fossil Fuel Consumption
(MJ-Equiv)
GHG Emissions (kg-CO2 equiv)
Water Consumption
(l)
Product-to-Package ratio and
percent wt.
Pkg Landfilled
(g)/1000 kg pods
Pouch with fitment
.7349 .03098 .0753 14.7:1 93.6%:6.4%
68,142
Thermo-formed Tub
.7832 (+6.57%)
.03305 (+6.68%)
.04587 (-37.6%)
11.2:1 91.8%:8.2%
89,381 (+31%)
Glass Jar 1.46 (+98.8%)
.1245 (+302%)
1.05 (+1294%)
1.3:1 55.9%:44.1%
513,699 (+654)
Notes:
• A normalized product weight (common value divisible by all package formats) of 4 oz. of product was used for Fossil Fuel, GHG and Water Consumption calculations.
Laundry Detergent Pod Case Study Table 8-F. Laundry Detergent Pod Packaging Comparison Summary
Format Fossil Fuel Consumption
(MJ-Equiv)
GHG Emissions (kg-CO2 equiv)
Water Consumption
(l)
Product-to-Package ratio and
percent wt.
Pkg Landfilled
(g)/1000 kg pods
Stand -up Pouch w zipper
76.73 3.10 5.00 47.2:1 97.9%:2.1%
21,209
Rigid PET Container
463.68 (+504%)
25.60 (+726%)
37.98 (+660%)
8.5:1 89.4%:10.6%
82,604 (+289%)
Notes:
• A normalized product weight (common value divisible by all package formats) of 1376 uses of product was used for Fossil Fuel, GHG and Water Consumption calculations.
126
Cat Litter Case Study Table 8-G. Cat Litter Packaging Comparison Summary
Format Fossil Fuel Consumption
(MJ-Equiv)
GHG Emissions (kg-CO2 equiv)
Water Consumption
(l)
Product-to-Package ratio and
percent wt.
Pkg Landfilled (g)/1000
kg cat litter
Stand-up bag
2,248 125.40 182 111.8:1 99.1%:0.9%
8,941
Barrier carton
3812 (+69.6%)
540.46 (+331%)
6,684 (+3573%)
12.3:1 92.5%:7.5%
82,015 (+817%)
Rigid pail
34,371 (+1429%)
1,373.85 (+996%)
2676 (+1370%)
8.0:1 88.9%:11.1%
111,610 (+1148%)
Notes:
• A normalized product weight (common value divisible by all package formats) of 2720 kg of product was used for Fossil Fuel, GHG and Water Consumption calculations.
Single Serve Juice Beverage Case Study Table 8-H. Single Serve Juice Packaging Comparison Summary
Format Fossil Fuel Consumption
(MJ-Equiv)
GHG Emissions (kg-CO2 equiv)
Water Consumption
(l)
Product-to-Package ratio and
percent wt.
Pkg Landfilled (g)/1000 kg juice
Drink Pouch
88,736 4,652 12,108 36.1:1 97.3%:2.7%
27,734
Composite carton
95,250 (+7.34%)
5,967 (+28.2%)
71,685 (+492%)
21.5:1 95.5%:4.5%
42,126 (+52%)
PET Bottle 140,231 (+58%)
7,319 (+57.3%)
28,738 (+137%)
22.5:1 95.8%:4.2%
33,442 (+20%)
Aluminum Can
275,766 (+211%)
27,105 (+483%)
91,812 (+658%)
17.7:1 94.6%:5.4%
25,388 (-8%)
Glass Bottle
326,690 (+268%)
25,612 (+451%)
209,809 (+1633%)
1.9:1 65.3%:34.7%
364,169 (+1213%)
Notes:
• A normalized product weight (common value divisible by all package formats) of 1,188,000 fl. oz. of product was used for Fossil Fuel, GHG and Water Consumption calculations.
127
Acronyms – Chapter 8
EPA U.S. Environmental Protection Agency GHG Greenhouse Gas GHGP Green House Gas Protocol LCA Life Cycle Assessment LCI Life Cycle Inventory LCIA Life Cycle Impact Assessment MJ Megajoule SPC Sustainable Packaging Coalition
128
References and Sources:
“2015 US plastic bottle recycling rate shows no growth.” Recycling Today, 2 Nov. 2016, www.recyclingtoday.com/article/2015-plastic-bottle-recycling-rate/.
A Study of Packaging Efficiency as It Relates to Waste Prevention. Use-Less-Stuff, Jan. 2016, use-less-stuff.com/wp-content/uploads/2017/10//2016-Packaging-Efficiency-Study-1.19.16.pdf.
Advancing Sustainable Materials Management: 2014 Tables and Figures - Assessing Trends in Material Generation, Recycling, Composting, Combustion with Energy Recovery and Landfilling in the United States. U.S. EPA, Dec. 2016, www.epa.gov/sites/production/files/2016-11/documents/2014_smm_tablesfigures_508.pdf.
“Life cycle assessment (LCA) is a scientific method for measuring the environmental footprint of materials, products and services over their entire lifetime.” Athena Sustainable Materials Institute, www.athenasmi.org/resources/about-lca/whats-the-difference/.
Report on Postconsumer PET Container Recycling Activity in 2016. Napcor.com, 31 Oct. 2017, napcor.com/wp-content/uploads/2017/10/NAPCOR-APR_2016RateReport_FINAL.pdf.
129
Chapter 9
Life Cycle Assessment and Case Studies Note: For the life cycle assessments used in this study, a cradle to grave boundary was used. Additionally, only the primary package was evaluated for the case studies. The life cycle assessments did not include any changes from pallet density based on primary package selection or impacts from secondary or tertiary packaging. These case studies describe representative systems which include plausible assumptions for other packages and therefore may be generalized when making comparisons to other package formats. Also note that multi-laminate or composite structures included in the case studies are representative package structures and may not be the specific structure used for a particular package. Care was used to ensure inputs were as accurate as possible by utilizing actual package weights, along with material density calculations to determine weight inputs for each material.
Coffee Ground coffee is a popular beverage and is packaged in a variety of package formats. For this Life Cycle Assessment (LCA) study, the following popular package formats were evaluated: Table 9-A. Coffee Packaging Evaluation Comparison
Package Type/Product Weight
Structure (package weight)
Photo
Stand-up flexible pouch – 340g (12.0 oz.)
Pouch - PET/Foil/PET/LDPE – 12.8g
Steel tin tie - 0.9g TOTAL = 13.7g
Steel can – 226.8g (8.0 oz.)
Steel Can and pull top – 102g
Lid – LDPE – 9g TOTAL = 111g
130
Plastic canister – 306g (10.8 oz.)
HDPE Canister - 52.7g
Lidstock – PET/Foil/LDPE – 1.0g
Lid – LDPE - 10.0g TOTAL = 63.7g
Packages as close as possible in size/volume were selected to make the lifecycle comparison. Not in all cases were packs of identical size/volume available for purchase. Many plastic HDPE canisters also contain a layer of EVAL™ Ethylene Vinyl Alcohol (EVOH) as an aroma barrier but does not impact the recyclability of the canister. Fossil Fuel Consumption, Greenhouse Gas Emissions and Water Consumption Comparison The charts below will highlight results of the fossil fuel usage, greenhouse gas (GHG) emissions, and water consumption for each of the package formats evaluated. These are some of the primary indicators that package developers consider when appraising the environmental impacts of a particular package. The EcoImpact-COMPASS® software “normalizes” the data based on the functional unit such as weight or number of uses to allow comparison between package formats which may not be the exact same size. Figure 9-1. Coffee Package Comparison – Fossil Fuel Consumption
The Fossil Fuel Consumption chart shows that the steel can and HDPE canister both have much larger fossil fuel impacts during the material and manufacturing phases. This is driven by the larger amount of energy required to produce the amount of resin for a rigid package such as a plastic canister or metal for a steel can. In the manufacturing phase of the HDPE canister, for example, the process is injection molding in which plastic pellets are melted, then injected into a mold to create a container; whereas the stand-up flexible bag is a laminating process where multiple layers of thin films are layered upon each other, usually through use of an adhesive. The laminating process is a much less energy intensive process than injection molding, which requires a lot of heat,
131
and thus fossil fuel (energy). Additionally, the amount of material (plastic resin) used in the manufacture of the rigid container is 63.7g vs. just 13.7g for the stand-up flexible pouch. Thus, a package such as the stand-up pouch that uses significantly less material than other formats, will usually also have a lower overall fossil fuel usage through material and energy use to form that package. Figure 9-2. Coffee Package Comparison – GHG Emissions
These results in show that the stand-up flexible pouch as the primary package for ground coffee, has a carbon impact (GHG emissions) that is significantly smaller than the steel can (+683%) or the HDPE Canister (+376%) options. This is largely driven by the impact of the material and manufacturing phases of the other package formats. The stand-up flexible pouch uses just 13.7g of material, while the HDPE canister uses over 4 times as much material (63.7g of material) and the steel can option uses over 8 times as much material (111g) and in both cases holding less product than the stand-up flexible pouch. So again, a package that is much lighter than other package formats, and uses a conversion process that uses less energy, will usually also result in having a lower overall GHG emissions. Additionally, the production of steel cans and the HDPE canister both require much more energy in the manufacturing stage, which contributes to their larger carbon impact in the manufacturing, or conversion stage.
132
Figure 9-3. Coffee Package Comparison – Water Consumption
Finally, Figure 9-3 shows a comparison of water consumption during the life cycle of the different package formats. The steel can has a significantly higher water usage (16 times) than the stand-up flexible pouch, particularly during the material development stage, as large amounts of water are used during the cooling process in the formation of steel. While the HDPE plastic canister uses much less water than the steel can, it still has a consumption value over twice that of the stand-up flexible pouch, due to the use of cooling water used during the injection molding process. End of Use Results While the flexible stand-up flexible pouch has the lowest fossil fuel use, GHG emissions and water use when looking at the primary package, the amount of material that is eventually discarded is also an important consideration for package developers when considering environmental impacts. The table below shows the results when current recycling rates are considered. Table 9-B. Coffee Packaging Format - Recycled and Landfilled Comparison
Format Component Pkg Wt. (g)
Product % Wt.
Package % Wt.
Pkg wt./
1000 kg coffee
Pkg Recycled/ 1000 kg coffee
Pkg Landfilled (g)/1000 kg coffee
Stand-up Flexible Pouch
Pouch/Tin Tie
13.7 96.1% 3.9% 40,294 0 40,294
Steel Can
Can/ Lidding/Lid
111 67.1% 32.9% 489,418 326,296 163,122
Plastic Canister
Canister/ Lidstock/
Lid
63.7 82.8% 17.2% 208,170 66,107 142,063
+1605%
133
To determine the package recycled and packaging discard rate, the following assumptions were made:
• Steel contained 37% recycled content (used as default in COMPASS® software) • Steel recycling rate 70.7% (EPA) • LDPE lids recycling rate at 21% (Packaging Efficiency Report) • HDPE Canister recycling rate at 34.4% (NAPCOR/APR Report) • Flexible packaging was assumed to have 0% recycling rate • All material collected for recycling was assumed to be actually recycled • Packaging landfilled is amount of packaging not recycled, goes to municipal solid waste
End of Use Summary According to the U.S. EPA Waste Hierarchy, the most preferred method for waste management is Source Reduction and Reuse (see Chapter 5). A major benefit of flexible packaging is the high product-to-package ratio which flexibles offer. As can be seen in the coffee example above, the stand-up flexible pouch format makes up only 3.9% of the total weight of the pack sold to the consumer, allowing for over 96% of the weight being attributed to the product itself. The steel can option yields 67% of product by weight, and the plastic canister sits in the middle at nearly 83% of the consumer pack being attributed to product weight. Another consideration, is how much of a package is ultimately discarded. The steel can is one of most highly recycled materials at nearly 71%. Only corrugated boxes, at 89.5% are higher for consumer packaging. However, even when assuming a 71% recycling rate, the steel can still results in about 4 times as much material as landfilled waste versus the stand-up flexible pouch. This also assumes that zero flexible packaging is recovered. For the steel can system to have the same amount of landfilled material as the stand-up flexible pouch, the rate of recycling for the steel can would need to increase to 93% and the LDPE lid would need to go from 21% to 75%! The HDPE canister is recycled at a much lower rate of 34% compared to the steel can and has a net rate of landfilled material about 3.5 times as great as the stand-up flexible pouch. For the HDPE canister to have the same net discards as the flexible package, the recycling rate for the HDPE canister would need to jump to 84% with a 70% recovery rate for the lid. The examples above showcase that while many flexible materials are not yet recovered and recycled in any significant amount, they still result in a substantial reduction in the amount of material sent to landfill versus other types of packaging. Summary/Implications When considering the different coffee format structures from a carbon impact, water consumption and material discarded position, the stand-up flexible pouch results in a more favorable environmental outcome than the other package formats by a wide
134
margin. This is largely driven by the reduced amount of material being used, as well as the favorable product-to-package ratio that the stand-up flexible pouch format provides. As with all package decisions, there are other package attributes such as product protection, brand message, ease of use, and other consumer features that must be considered, including the sustainability benefits of each package format, on which this report focuses for flexibles, and the total package design using a holistic approach. Table 9-C below summarizes much of the critical data and package comparison discussed for this coffee packaging case study. Table 9-C. Coffee Packaging Comparison Summary
Format Fossil Fuel Consumption
(MJ-Equiv)
GHG Emissions (kg-CO2 equiv)
Water Consumption
(l)
Product-to-Package ratio and
percent wt.
Pkg Landfilled
(g)/1000 kg coffee
Stand-up flexible pouch
6,654 353 1011 24.8:1 96.1%:3.9%
40,294
Steel can 36,809 (+453%)
2763 (+683%)
17,238 (+1605%)
2.0:1 67.1%:32.9%
163,122 (+304%)
Plastic (HDPE) canister
41,130 (+518%)
1678 (+376%)
3,164 (+213%)
4.8:1 82.8%:17.2%
142,063 (+252%)
Notes:
• A normalized product weight (common value divisible by all package formats) of 1,927,800 grams of product was used for Fossil Fuel, GHG and Water Consumption calculations.
• All percentages cited are for other formats compared to the stand-up flexible pouch. • A higher number for product-to-package ratio (first number) cited means a higher percentage of
weight is attributed to product, and less to packaging, resulting in more efficient use of packaging resources.
• Package landfilled values are based on the of amount of packaging sent to municipal solid waste after recycling, based on 1000 kg of coffee.
Sources:
• Recycling rates used in calculations based on EPA Advancing Sustainable Materials Management Fact Sheet, November 2016 (Accessed November 29, 2017)
• Additional recycling rate sources: o Other recycling rates determined from “A Study of Packaging Efficiency
as It Relates to Waste Prevention,” January 2016. Use Less Stuff Report - http://use-less-stuff.com/wp-content/uploads/2017/10//2016-Packaging-Efficiency-Study-1.19.16.pdf
135
o Paperboard recycling - https://www.epa.gov/sites/production/files/2016-11/documents/2014_smm_tablesfigures_508.pdf
o HDPE Bottle recycling –from NAPCOR/APR http://www.recyclingtoday.com/article/2015-plastic-bottle-recycling-rate/
136
Motor Oil Motor oil has traditionally been packaged in an HDPE bottles, and prior to that was often packaged in composite cans with steel ends. Recently, however, there have been some examples of motor oil being packaged in a flexible pouch with a fitment, which also can aid in pouring the oil. For this Life Cycle Assessment study, the following popular package formats were evaluated: Table 9-D. Motor Oil Packaging Evaluation Comparison
Package Type/Product Weight
Structure (package weight) Photo
Stand-up pouch w fitment- 28 fl. oz. (828.1 ml)
Stand-up pouch - 60 ga. BON/6 mil HDPE - 16.3g
Spout/Fitment - LDPE - 2.0g
Cap - LDPE - 0.9g TOTAL = 19.2g
HDPE bottle – 32 fl. oz. (946.4 ml)
Bottle - HDPE - 53.6g
Closure - PP – 2.8g TOTAL = 56.4g
Packages as close as possible in size/volume were selected to make the life cycle comparison. Not in all cases were packs of identical size/volume available for purchase. Fossil Fuel Consumption, Greenhouse Gas Emissions, and Water Consumption Comparison The charts on the following page will highlight results of the fossil fuel usage, greenhouse gas (GHG) emissions, and water consumption for each of the package formats evaluated. These are some of the primary common indicators that package developers consider when appraising the environmental impacts of a particular package. The EcoImpact-COMPASS® software “normalizes” the data based on the functional unit such as weight or number of uses to allow comparison between package formats which may not be the exact same size.
137
Figure 9-4. Motor Oil Package Comparison – Fossil Fuel Consumption
The Fossil Fuel Consumption chart above (Figure 9-4) shows that the HDPE bottle has a much larger use of fossil fuel sources (173%) vs. the stand-up pouch, driven largely by the additional weight of the package (bottle weighs about 3 times as much as the stand-up pouch) as well as the additional energy/fuel required in the injection molding process for the HDPE bottle. The stand-up bag process is a laminating process where multiple layers of thin films are layered upon each other, usually through use of an adhesive. The laminating process for the stand-up pouch is much less energy intensive process than injection molding, which requires considerable heat to melt the resin and force the melted plastic through a mold, and thus requires more energy in the process (fossil fuel consumption). Therefore, a lighter package with a manufacturing process that is less energy intensive, will almost always result in lower Fossil Fuel Consumption, as is the case with the stand-up pouch with fitment. Figure 9-5. Motor Oil Package Comparison – GHG Emissions
The GHG emissions chart also shows that the HDPE bottle has a greenhouse gas emission or carbon impact about 1.5 times that of the stand-up pouch with fitment. Since both package formats are using plastic in their make-up, the package manufacturing (conversion) process and amount of material plays a key role. Again, since the flexible stand-up pouch uses much less material than the HDPE bottle, it has a
138
much-reduced carbon impact. The larger end of life impact for the plastic bottle is driven by the fact that even though HDPE bottles are recycled at a rate of 34.4%, there is still a larger impact due to about twice as much material ending up as municipal solid waste (see Table 9-F. Motor Oil Packaging Evaluation Comparison). Figure 9-6. Motor Oil Package Comparison – Water Consumption
Finally, Figure 9-6 shows a comparison of water consumption during the life cycle of the two package formats. In this case, the larger water consumption (+513%) for the HDPE bottle is driven by the water that is needed to cool the molds in the injection molding manufacturing process. The water helps to cool the plastic bottle so it can be removed from the mold, speeding up the overall manufacturing process. The stand-up pouch format, which is formed by laminating multiple thin layers of film together, uses much less water in its manufacturing and conversion process. End of Use Results The results above show that the stand-up pouch with fitment package has a much lower usage of fossil fuel as well as carbon and water impact when considering the primary package. Package developers also consider the amount of material that is recycled or sent to landfill, to ensure that the package aligns with Circular Economy or Sustainable Materials Management goals. Table 9-E shows the results when current recycling rates are considered, as well the product-to-package ratio, which is a measure of the resource efficiency of the materials used. For this measure, a high product and a low package number are desired.
139
Table 9-E. Motor Oil Packaging - Recycled and Landfilled Comparison Format Component Pkg
Wt. (g)
Product % Wt.
Package % Wt.
Pkg wt. (g)/
1000 kg motor
oil
Pkg Recycled (g)/1000 kg motor
oil
Pkg Landfilled (g)/1000 kg motor
oil Stand -up Pouch with Fitment
Pouch/ Fitment
19.2 97.4% 2.6% 26,301 0 26,301
HDPE Bottle
Bottle/ Closure
56.4 93.7% 6.3% 67,602 22,100 45,501
To determine the package recycled and packaging discard rate, the following assumptions were made:
• HDPE bottle recycling rate at 34.4% (NAPCOR/APR Report) • Flexible packaging was assumed to have 0% recycling rate • Closures and fitments assumed to have 0% recycling rate • All material collected for recycling was assumed to be actually recycled • Package landfilled is amount of packaging not recycled, goes to municipal solid waste
End of Use Summary According to the U.S. EPA Waste Hierarchy, the most preferred method for waste management is Source Reduction and Reuse (see Chapter 5). A major benefit of flexible packaging is the high product-to-package ratio which flexible packaging tends to offer. Both the HDPE bottle and stand up pouch offer high amount of product vs. package weight (93.7% and 97.4% respectively), with the stand-up pouch coming out slightly ahead. When considering how much of a package ends up in municipal solid waste, however, the HDPE bottle would result in almost double the amount of material that ends up at a landfill. The HDPE bottle is recycled at a rate of 34.4%, one of the highest rates for plastic containers, but would need to be recycled at a rate of 64% to have the same amount of package discarded as the stand-up pouch (assuming no recycling of the stand-up pouch). The examples above highlight that while many multi-material flexible packages are not yet recovered and recycled in any significant amount, they still result in a substantial reduction in the amount of material sent to landfill versus other types of packaging. Summary/Implications The results show that when the traditional HDPE bottle and flexible stand-up pouch with fitment are used for motor oil, the flexible structure will generally have a favorable outcome from a fossil fuel usage, greenhouse gas (GHG) emissions, water consumption,
140
and material discarded position. This is largely driven by the flexible pouch using about one-third of the material used as the rigid bottle, which results in less energy used in manufacturing and transporting of the package materials and associated environmental impacts. As with all package decisions, there are other package attributes such as product protection, brand message, ease of use, and other consumer features that must be considered, including the sustainability benefits of each package format, on which this report focuses for flexibles, and the total package design using a holistic approach. When considered holistically, the stand-up pouch has a number of positive sustainability aspects across a wide range of environmental factors. Table 9-F below summarizes much of the critical data and package comparison discussed for this motor oil packaging case study. Table 9-F. Motor Oil Packaging Comparison Summary
Format Fossil Fuel Consumption
(MJ-Equiv)
GHG Emissions (kg-CO2 equiv)
Water Consumption
(l)
Product-to-Package ratio and
percent wt.
Pkg Landfilled
(g)/1000 kg motor oil
Stand-up Pouch with Fitment
14.12 .5998 1.03 38.0:1 97.4%:2.6%
26,301
HDPE Bottle 38.58 (+173%)
1.52 (+153%)
6.33 (+513%)
14.8:1 93.7%:6.3%
45,501 (+73%)
Notes:
• A normalized product weight (common value divisible by all package formats) of 224 fl. oz. of product was used for Fossil Fuel, GHG and Water Consumption calculations.
• All percentages cited are for other formats compared to the stand-up flexible pouch. • A higher number for product-to-package ratio (first number) cited means a higher percentage of
weight is attributed to product, and less to packaging, resulting in more efficient use of packaging resources.
• Package landfilled values are based on the of amount of packaging sent to municipal solid waste after recycling, based on 1000 kg of motor oil.
Sources: • Recycling rates used in calculations based on EPA Advancing Sustainable
Materials Management Fact Sheet, November 2016 (Accessed November 29, 2017)
• Additional recycling rate sources: o Other recycling rates determined from “A Study of Packaging Efficiency
as It Relates to Waste Prevention,” January 2016. Use Less Stuff Report - http://use-less-stuff.com/wp-content/uploads/2017/10//2016-Packaging-Efficiency-Study-1.19.16.pdf
141
o 2015 APR Post Consumer Bottle Recycling report - https://plastics.americanchemistry.com/2015-United-States-National-Postconsumer-Plastic-Bottle-Recycling-Report.pdf
o Paperboard recycling - https://www.epa.gov/sites/production/files/2016-11/documents/2014_smm_tablesfigures_508.pdf
Baby Food Baby Food has undergone a transformation over the past decade and is now available in a number of different packaging formats. In the past, the food was often packaged in a glass jar, due to the freshness and safety seal, as well as the installation of glass lines at most packing facilities. Over the past few years, however, newer formats including plastic thermoformed tubs and flexible pouches with fitments have made their way into the market. The reasons can include ease of use, less mess, safety from a more shatterproof package format, and ability for toddlers to use the pouch on their own, without the use of a utensil. For this Life Cycle Assessment study, the following popular package formats were evaluated: Table 9-G. Baby Food Packaging Evaluation Comparison
Spout/Fitment - PP - 1.6g Cap - PP - 2.5g TOTAL = 7.7g
Thermoform Tub – 4 oz. (113g)
Tub - PP/EVOH/PP - 6.7g
Lid - PET - 2.8g Lidstock - PET/Alum/LDPE -
0.6g TOTAL = 10.1g Glass Jar – 4 oz. (113g) Jar - Glass - 82.8g
Closure - Steel – 6.0g Label - Paper - 0.4g TOTAL = 89.2g
Packages as close as possible in size/volume were selected to make the lifecycle comparison. Not in all cases were packs of identical size/volume available for purchase.
143
Fossil Fuel Consumption, Greenhouse Gas Emissions, and Water Consumption Comparison The charts below will highlight results of the fossil fuel usage, greenhouse gas (GHG) emissions and water consumption for each of the package formats evaluated. These are some of the common indicators that package developers consider when appraising the environmental impacts of a particular package. The EcoImpact-COMPASS® software “normalizes” the data based on the functional unit such as weight or number of uses to allow comparison between package formats which may not be the exact same size. Figure 9-7. Baby Food Package Comparison – Fossil Fuel Consumption
The Fossil Fuel Consumption chart shows that the glass jar has a fossil fuel usage about double that of the pouch with fitment and thermoformed tub, which are very close to each other. Glass production takes significant energy to heat the materials to ultimately form the glass package, which is driving the fossil fuel usage, particularly in the material processing side. Thermoforming, which also requires energy to heat a plastic sheet and form the plastic tub (6.7g) but is much lighter than the glass jar (82.8g), and thus requires less overall fossil fuel/energy. The flexible pouch formation uses a laminating process where multiple layers of thin films are layered upon each other, usually through use of an adhesive. Thus, the combination of the laminating process, which is much less energy intensive than glass forming, and the lightweight nature of the pouch, drives its lower fossil fuel consumption.
The greenhouse gas emission results (Figure 9-8) of the 3 package types, again, show that the pouch with fitment and thermoformed tub come out very similarly. Again, the glass jar in particular stands out with a much higher GHG impact, of about three times that of the other two options. This is again driven by the amount of material required in the glass jar option, which is over ten times greater than the pouch, as well as the glass production process which requires more energy and thus has a much greater carbon impact. A package developer would not make a decision based on the GHG impact between the pouch with fitment and thermoformed tub formats, which are very close. The package format decision would be much more driven by consumer usage occasion. For instance, if the child would be eating the food on their own while in a car, the pouch with fitment makes sense. On other usage occasions with a parent feeding the child with a spoon, perhaps the thermoformed tub may be more appropriate. Figure 9-9. Baby Food Package Comparison – Water Consumption
+1294%%
145
Finally, Figure 9-9 shows a comparison of water consumption during the life cycle of the three package formats. In this case, the large water consumption (1294%) for the glass jar is driven by the water that is needed to cool the glass gob (piece of glass before it is formed into a jar) from the glass production process. The results also show that the thermoform tub uses less water overall than the pouch with fitment, likely due to additional water needed in the injection molding process to the fitment and cap. End of Use Results The charts above show that the pouch with fitment and the thermoform tub have very similar results around fossil fuel usage and greenhouse gas impacts, while the glass jar was significantly higher in all attributes versus the other package formats. In this section, we will explore the impacts of a material recycled or sent to landfill to ensure that the package aligns with Circular Economy or Sustainable Materials Management goals. Table 9-H (below) shows the results when current recycling rates are considered, as well the product-to-package ratio, which is a measure of the resource efficiency of the materials used. For this measure, a high product and a low package number are desired. Table 9-H. Baby Food Packaging - Recycled and Landfilled Comparison
Format Component Pkg Wt. (g)
Product % Wt.
Package % Wt.
Pkg wt. (g)/
1000 kg food
Pkg Recycled (g)/1000 kg food
Pkg Landfilled (g)/1000 kg food
Pouch with Fitment
Pouch 7.7 93.6% 6.4% 68,142 0 68,142
Thermo-formed Tub
Tub/ Lidstock/
Lid
10.1 91.8% 8.2% 89,381 0 89,381
Glass Jar
Glass Jar/ Steel
Closure
89.2 55.9% 44.1% 789,381 275,681 513,699
To determine the package recycled and packaging discard rate, the following assumptions were made:
• Glass jar recycling rate at 32.5% (EPA Advancing Sustainable Materials Fact Sheet, 2014) • Steel closure used - steel container recycling rate 70.7% (EPA) • Thermoformed tub assumed to be 0% due to EVOH barrier, which makes tub a composite
structure (#7 SPI system) • Flexible packaging was assumed to have 0% recycling rate • Plastic closures and fitments assumed to have 0% recycling rate • All material collected for recycling was assumed to be actually recycled • Package landfilled is amount of packaging not recycled, goes to municipal solid waste
146
End of Use Summary At the top of the U.S. EPA Waste Hierarchy is Source Reduction and Reuse (see Chapter 5), cited as methods for overall waste reduction. The comparison of product-to-package ratio is a good measure of source reduction. Both the thermoformed tub and the pouch with fitment offer a high amount of product versus package weight (91.8% and 93.6% respectively), with the stand-up pouch coming out slightly ahead. Meanwhile, for the glass jar, only 55.9% of the total weight is for the product, with the package making up 44.1% of the total weight on the retail shelf. Even when taking current recycling rates into account, the flexible pouch has the least amount of material that ends up in the municipal solid waste stream. While glass containers are recycled at over 30%, about 7.5 times more material than the pouch with fitment ends up in a landfill. The thermoformed tub results in about 30% more material to landfill than the pouch. Part of this is due to the barrier layer as part of the thermoform structure, which does not allow the thermoformed tub to be easily recycled, as well as the overall heavier weight of the thermoformed tub package (10.1g) than the pouch with fitment (7.7g). The examples above highlight that while many multi-material flexible packages are not yet recovered and recycled in any significant amount, they still result in a substantial reduction in the amount of material sent to landfill versus other types of packaging. Summary/Implications The results above show that both the flexible pouch with fitment and the thermoformed tub have fairly similar profile for fossil fuel usage and greenhouse gas impacts. Both package formats also result in a high product-to-package ratio of over 90+% by weight. However, the flexible pouch with fitment results in lower material to municipal solid waste. The glass jar has significantly larger sustainability impacts than the other options, even when taking the recyclability of glass into consideration, driven largely by the much heavier package and energy required to form glass. As in almost all package selection criteria, a wide range of package and product usage occasions need to be considered holistically. Based on the overall similarities across the sustainability attributes, the package design decision between a thermoformed tub and a flexible pouch with fitment will be driven based on consumer usage occasion. Consumers looking for children to feed themselves on the go, will likely opt for the pouch with fitment format. The typical closure and fitment (child resistant closure) also allows the package to be reclosed and reused later, if needed. Consumers looking to feed their toddler with a spoon, may decide the thermoformed tub better meets their usage needs. When considered holistically, the stand-up pouch has a number of positive sustainability aspects across a wide range of environmental factors. Table 9-I summarizes much of the critical data and package comparison discussed for this baby food packaging case study.
147
Table 9-I. Baby Food Packaging Comparison Summary
Format Fossil Fuel Consumption
(MJ-Equiv)
GHG Emissions (kg-CO2 equiv)
Water Consumption
(l)
Product-to-Package ratio and
percent wt.
Pkg Landfilled
(g)/1000 kg pods
Pouch with fitment
.7349 .03098 .0753 14.7:1 93.6%:6.4%
68,142
Thermo-formed Tub
.7832 (+6.57%)
.03305 (+6.68%)
.04587 (-37.6%)
11.2:1 91.8%:8.2%
89,381 (+31%)
Glass Jar 1.46 (+98.8%)
.1245 (+302%)
1.05 (+1294%)
1.3:1 55.9%:44.1%
513,699 (+654)
Notes:
• A normalized product weight (common value divisible by all package formats) of 4 oz. of product was used for Fossil Fuel, GHG and Water Consumption calculations.
• All percentages cited are for other formats compared to the stand-up flexible pouch. • A higher number for product-to-package ratio (first number) cited means a higher percentage of
weight is attributed to product, and less to packaging, resulting in more efficient use of packaging resources.
• Package landfilled values are based on the of amount of packaging sent to municipal solid waste after recycling, based on 1000 kg of baby food.
Sources:
• Recycling rates used in calculations based on EPA Advancing Sustainable Materials Management Fact Sheet, November 2016 (Accessed November 29, 2017)
• Additional recycling rate sources: o Other recycling rates determined from “A Study of Packaging Efficiency
as It Relates to Waste Prevention,” January 2016. Use Less Stuff Report - http://use-less-stuff.com/wp-content/uploads/2017/10//2016-Packaging-Efficiency-Study-1.19.16.pdf
o 2015 APR Post Consumer Bottle Recycling report - https://plastics.americanchemistry.com/2015-United-States-National-Postconsumer-Plastic-Bottle-Recycling-Report.pdf
o Paperboard recycling - https://www.epa.gov/sites/production/files/2016-11/documents/2014_smm_tablesfigures_508.pdf
Laundry Detergent Pods A popular format for laundry detergent has become the use of pods, which are pre-measured packets that replace liquid or powdered detergent. The pod format has also been used for dishwasher detergent as well. For this Life Cycle Assessment study, two popular package formats were evaluated: Table 9-J. Laundry Detergent Pods Evaluation Comparison
Packages as close as possible in size/volume were selected to make the lifecycle comparison. Not in all cases were packs of identical size/volume available for purchase. Fossil Fuel Consumption, Greenhouse Gas Emissions, and Water Consumption Comparison The charts on the following page will highlight results of the fossil fuel usage, greenhouse gas (GHG) emissions and water consumption for each of the package formats evaluated. These are some of the common indicators that package developers consider when appraising the environmental impacts of a particular package. The EcoImpact-COMPASS® software “normalizes” the data based on the functional unit such as weight or number of uses to allow comparison between package formats which may not be the exact same size.
The Fossil Fuel Consumption chart shows that the rigid PET containers has a fossil fuel usage nearly five times (+504%) that of the stand-up pouch with zipper. With both products being made of plastic, weight is the primary driver and the rigid container weighs about seven times that of the pouch (148.9g vs. 20.0g). The injection molding process in the manufacturing stage of the rigid PET container is also much more energy intensive than the laminating process used by the flexible pouch, where multiple layers of thin films are adhered to each other, often through the use of an adhesive. Thus, the stand-up pouch comes out much more favorably in fossil fuel consumption, driven largely by the weight and manufacturing, or conversion efficiency advantage. Figure 9-11. Laundry Detergent Pods – GHG Emissions
When considering the greenhouse gas (GHG) emissions of the two primary package types, the pouch has a significant advantage, again largely due to using much less material. The manufacturing process (injection molding) for the rigid container also results in additional energy used in the process, leading to a higher overall GHG emissions (+726%). The stand-up pouch uses a laminating process where multiple layers of thin films are layered upon each other, usually through use of an adhesive. The laminating process is a much less energy intensive process than injection molding, which
150
requires a lot of heat or energy. Again, this leads to an advantage for the stand-up pouch in the area of greenhouse gas emissions. Figure 9-12. Laundry Detergent Pods – Water Consumption
The graph above, Figure 9-12, compares water consumption during the life cycle of both package formats. The rigid PET container has a significantly larger water footprint (+660%) than the pouch. This again, is driven by the weight discrepancy between the two packages as well as the use of water to cool molds during the injection molding process, which drives the large value in the manufacturing value on the chart. The graphs above show that the stand-up pouch with a zipper format uses significantly lower amounts of fossil fuel and water, and also has a significantly lower greenhouse gas impact than the rigid PET container. All of these results are driven by the large weight benefit the pouch has over the rigid package (20g vs. 148.9g), as well as the conversion process advantage that flexible pouch offers. Both package formats are made entirely of plastic, but the stand-up pouch requires seven times less material, driving its advantage across these three metrics. End of Use Results In this section, we will explore the impacts of a material recycled or sent to municipal solid waste to ensure that the package aligns with Circular Economy or Sustainable Materials Management (SMM) goals. Table 9-K shows the results when current recycling rates are considered, as well the product-to-package ratio, which is a measure of the resource efficiency of the materials used. For this measure, a high product and a low package number are desired. Table 9-K on the following page summarizes the data from this section.
151
Table 9-K. Laundry Detergent Pod Packaging - Recycled and Landfilled Comparison Format Component Pkg
Wt. (g)
Product % Wt.
Package % Wt.
Pkg wt. (g)/
1000 kg
Pkg Recycled
(g)/ 1000 kg
pods
Pkg Landfilled (g)/1000 kg pods
Stand -up Pouch w Zipper
Pouch with Zipper
20.0 97.9% 2.1% 21,209 0 21,209
Rigid PET Container
PET Container/
Lid
148.9 89.4% 10.6% 118,175 35,571 82,604
To determine the package recycled and packaging discard rate, the following assumptions were made:
• PET container recycling rate of 30.1% (2015 APR Post Consumer Bottle Recycling report) • Flexible packaging was assumed to have 0% recycling rate • All material collected for recycling was assumed to be actually recycled • Package landfilled is amount of packaging not recycled, goes to municipal solid waste
End of Use Summary A SMM system (see Chapter 4) looks to maximize the use of resources in packaging. Additionally, the U.S. EPA Waste Hierarchy (see Chapter 5) has source reduction and reuse at the very top of the hierarchy as a method to reduce overall waste. The data above shows how well the stand-up pouch with zipper aligns with a SMM framework, with nearly 98% of the weight on a retail shelf being attributed to the product, and only about 2% attributed to the package. When taking current recycling rates into consideration, the rigid PET container results in nearly four times as much material ending up in municipal solid waste than the flexible stand-up pouch. In order for the PET container to have the same level of municipal solid waste as the stand-up pouch has today, the recycling rate of both the container and cap would need to reach over 80%. The examples above highlight that while many flexibles materials are not yet recovered in any significant amount, they still result in a substantial reduction in the amount of material sent to landfill versus other package formats. Summary/Implications The results of the laundry pod case study show that the stand-up pouch has a number of sustainability benefits (fossil fuel usage, carbon impact, water consumption, and municipal solid waste) over the PET rigid container, even when taking the current recycling rate of the rigid container into consideration.
152
When selecting a particular package format, a number of product and package attributes need to be considered. These may include retail environment, shelf impact, consumer usage, product branding, reclose features and sustainability benefits. Sustainability attributes are never considered on their own, but always as part of broader, more holistic packaging solution. Table 9-L below summarizes much of the critical data and package comparison discussed for this laundry detergent pod packaging case study. Table 9-L. Laundry Detergent Pod Packaging Comparison Summary
Format Fossil Fuel Consumption
(MJ-Equiv)
GHG Emissions (kg-CO2 equiv)
Water Consumption
(l)
Product-to-Package ratio and
percent wt.
Pkg Landfilled
(g)/1000 kg pods
Stand -up Pouch w zipper
76.73 3.10 5.00 47.2:1 97.9%:2.1%
21,209
Rigid PET Container
463.68 (+504%)
25.60 (+726%)
37.98 (+660%)
8.5:1 89.4%:10.6%
82,604 (+289%)
Notes:
• A normalized product weight (common value divisible by all package formats) of 1376 uses of product was used for Fossil Fuel, GHG and Water Consumption calculations.
• All percentages cited are for other formats compared to the stand-up flexible pouch. • A higher number for product-to-package ratio (first number) cited means a higher percentage of
weight is attributed to product, and less to packaging, resulting in more efficient use of packaging resources.
• Package landfilled values are based on the of amount of packaging sent to municipal solid waste after recycling, based on 1000 kg of laundry detergent pods.
Sources:
• Recycling rates used in calculations based on EPA Advancing Sustainable Materials Management Fact Sheet, November 2016 (Accessed November 29, 2017)
• Additional recycling rate sources: o Other recycling rates determined from “A Study of Packaging Efficiency
as It Relates to Waste Prevention,” January 2016. Use Less Stuff Report - http://use-less-stuff.com/wp-content/uploads/2017/10//2016-Packaging-Efficiency-Study-1.19.16.pdf
o 2015 APR Post Consumer Bottle Recycling report - https://plastics.americanchemistry.com/2015-United-States-National-Postconsumer-Plastic-Bottle-Recycling-Report.pdf
Cat Litter Cat litter is a requirement for all cat owners and is sold in a number of different formats. It is a fairly heavy product and requires a strong package. Cat litter is also moisture sensitive, meaning that if it gets wet or moist from humidity, the product will clump. Therefore, any package needs to consider a moisture barrier to ensure the product meets the consumer needs when the product is opened. All three of the package formats evaluated for this life cycle assessment study meet the strength and moisture barrier criteria. For this Life Cycle Assessment study, three popular package formats were evaluated: Table 9-M. Cat Litter Evaluation Comparison
Package Type/Product Weight
Structure (package weight) Photo
Stand-up Bag -15 lbs. (6.80 kg)
Stand-up Bag – 48 ga. PET/ 48 ga. PET/3.5 mil HDPE and Nylon Coex – 60.8g
TOTAL = 60.8g
Barrier Carton - 15 lbs. (6.80 kg)
Carton – SUS paperboard – 552.1g
Barrier Film – PET – 5.6g (estimated)
TOTAL = 557.7g
Rigid Pail w Handle - 12 lbs. (5.44 kg)
Tub with Handle – PP – 525.3g
Lid – PP – 156.9g TOTAL = 682.2g
Packages as close as possible in size/volume were selected to make the lifecycle comparison. Not in all cases were packs of identical size/volume available for purchase.
154
Fossil Fuel Consumption, Greenhouse Gas Emissions, and Water Consumption Comparison The charts below will highlight results of the fossil fuel usage, greenhouse gas (GHG) emissions and water consumption for each of the package formats evaluated. These are some of the primary indicators that package developers consider when appraising the environmental impacts of a particular package. The EcoImpact-COMPASS® software “normalizes” the data based on the functional unit such as weight or number of uses to allow comparison between package formats which may not be the exact same size. Figure 9-13. Cat Litter – Fossil Fuel Consumption
As can be seen in the chart above, the stand-up bag uses considerably less fossil fuel in manufacturing than the carton (+69.6%), and significantly less than the rigid pail (+1429%). This is driven largely by the rigid pail requiring eleven times as much material as the flexible bag (682.2g versus 60.8g). The higher fossil fuel consumption for the carton is largely driven the energy needed in the paper making process as well as the much higher material by weight (557.7g versus 60.8g). Thus, largely through its weight advantage, the stand-up bag comes ahead of the other package types in fossil fuel consumption. Figure 9-14. Cat Litter – GHG Emissions
+1429%
155
Figure 9-14 (above) compares the greenhouse gas emissions (GHG) of the three pack formats. Again, the flexible pouch comes out as preferable, by a wide margin over the carton (+331%) and pail (+996%). In both cases, the other package formats use considerably more material by weight than the pouch, which usually correlates to both packages having greater GHG impact during the manufacturing stage. Additionally, the injection molding process which the pail uses, requires more energy than carton production and film lamination (adhering multiple layers of a thin plastic film to make a multi-material flexible structure). This advantage for the stand-up bag appears in the manufacturing process part of the chart for Figure 9-14. One unique factor that can be seen with the carton, is that it appears to have a negative GHG impact in the material processing stage. This is due to a carbon “credit” for the carbon sink/sequestration that occurs as a tree grows. The EcoImpact-COMPASS® software considers biogenic carbon (emissions of burning biomass for electricity) and designates as carbon negative, explaining why the material impact (red on the graph) remains negative even with the processing of the wood into the paper-based structures. The other value that jumps out for the carton is the impact at end of life. The end of life impact is large for the carton because as a composite structure (paperboard with a film layer on top) it is assumed that all of the package will end up as municipal solid waste. Paperboard without the film layer would often be typically recycled at a higher rate, but due to the moisture barrier needed for cat litter, a film layer is added, which makes recycling much more difficult. This is calculated as a burden and an emission of GHG. The other package formats have an end of life impact as well, but the flexible pouch is smaller due to the significant reduction in material used which ends up as solid waste. The rigid pail end of life impact is also reduced as there are some benefits calculated from recycling or waste to energy recovery. Figure 9-15. Cat Litter – Water Consumption
The graph above, Figure 9-15, looks at a comparison of the water consumption during the life cycle of both package formats. Paper manufacturing requires significant
+1370%%
+3573%%
156
amounts of water in the paper forming process. Water is added to wood fibers initially to create a slurry of fibers, and then needs to be removed once the fibers are optimally aligned to create the paper sheet used in packaging. All of this results in a much higher water consumption rate (+3573%) versus the stand-up bag. The rigid pail also has a much higher water footprint than the flexible bag (+1370%), driven largely by the water used to cool the molds used in production of the plastic pails. Water is flushed into the molds to quickly cool the molten plastic and increase production speeds. Thus, the stand-up bag has a significant advantage in water consumption versus the other two formats. End of Use Results In this section, we will explore the impacts of a material recycled or sent to municipal solid waste to ensure that the package aligns with Circular Economy (CE) or Sustainable Materials Management (SMM) goals. Table 9-N (below) shows the results when current recycling rates are considered, as well the product-to-package ratio, which is a measure of the resource efficiency of the materials used. For this measure, a high product and a low package number are desired. Table 9-N. Cat Litter Packaging - Recycled and Landfilled Comparison
To determine the package recycled and packaging discard rate, the following assumptions were made:
• PP container recycling rate of 11.0% (A Study of Packaging Efficiency as It Relates to Waste Prevention,” January 2016)
• Barrier carton assumed to have 0% recycling rate due to barrier film, which makes carton a composite (two materials) and difficult to recycle
• Flexible packaging was assumed to have 0% recycling rate • All material collected for recycling was assumed to be actually recycled • Package landfilled is amount of packaging not recycled, goes to municipal solid waste
157
End of Use Summary The data collected in Table 9-N shows that the stand-up bag offers a very high product-to-package ratio of over 99%! This means that in order to successfully deliver cat litter product to a consumer, with the required moisture barrier and strength, the package is only 1% by weight of what sits on the shelf. The other formats result in the package weighing 7.5% for the carton option and 11.1% for the rigid pail. Table 9-N also shows the amount of material that ends up in a landfill as municipal solid waste. None of the package formats are recycled in any large amount today. The paperboard carton is not typically recycled because of the film lamination to the board, which is needed to provide the appropriate moisture barrier. Based on this, the stand-up pouch results in about nine times less material to landfill than the carton, and over twelve times less material by weight than the rigid pail, even considering the recycling rate of the pail. The pail and lid would need to achieve a recycling rate of over 90%, from today’s 11.1%, to have the same weight of material sent to landfill as the stand-up bag. Summary/Implications The results of the data when comparing different cat litter package options shows that the stand-up bag has a number of significant benefits (fossil fuel usage, carbon impact, water consumption, and municipal solid waste) over the rigid pail and barrier carton, even when taking the current recycling rate of the rigid container into consideration. The cat litter packaging example also highlights this: while many multi-layer flexible materials are not yet recovered and recycled in any significant amount, they still significantly reduce the amount of material sent to landfill versus other package types. Other package formats in this case study would need to drive a massive increase in recycling rates in order to match the current levels of municipal solid waste enabled through flexible packaging. When selecting an appropriate package format, there are other package attributes such as product protection, brand message, ease of use and other consumer features that must be considered, including the sustainability benefits of each package format, on which this report focuses for flexibles, and the total package design using a holistic approach. Sustainability attributes are never considered on their own, but always as part of broader, more holistic packaging solution. Table 9-O summarizes much of the critical data and package comparison discussed for this cat litter packaging case study.
158
Table 9-O. Cat Litter Packaging Comparison Summary Format Fossil Fuel
Consumption (MJ-Equiv)
GHG Emissions (kg-CO2 equiv)
Water Consumption
(l)
Product-to-Package ratio and
percent wt.
Pkg Landfilled
(g)/1000 kg cat litter
Stand-up bag 2,248 125.40 182 111.8:1 99.1%:0.9%
8,941
Barrier carton 3812 (+69.6%)
540.46 (+331%)
6,684 (+3573%)
12.3:1 92.5%:7.5%
82,015 (+817%)
Rigid pail 34,371 (+1429%)
1,373.85 (+996%)
2676 (+1370%)
8.0:1 88.9%:11.1%
111,610 (+1148%)
Notes:
• A normalized product weight (common value divisible by all package formats) of 2720 kg of product was used for Fossil Fuel, GHG and Water Consumption calculations.
• All percentages cited are for other formats compared to the stand-up flexible pouch. • A higher number for product-to-package ratio (first number) cited means a higher percentage of
weight is attributed to product, and less to packaging, resulting in more efficient use of packaging resources.
• Package landfilled values are based on the of amount of packaging sent to municipal solid waste after recycling, based on 1000 kg of cat litter.
Sources:
• Recycling rates used in calculations based on EPA Advancing Sustainable Materials Management Fact Sheet, November 2016 (Accessed November 29, 2017)
• Additional recycling rate sources: o Other recycling rates determined from “A Study of Packaging Efficiency
as It Relates to Waste Prevention,” January 2016. Use Less Stuff Report - http://use-less-stuff.com/wp-content/uploads/2017/10//2016-Packaging-Efficiency-Study-1.19.16.pdf
o 2015 APR Post Consumer Bottle Recycling report - https://plastics.americanchemistry.com/2015-United-States-National-Postconsumer-Plastic-Bottle-Recycling-Report.pdf
o Paperboard recycling - https://www.epa.gov/sites/production/files/2016-11/documents/2014_smm_tablesfigures_508.pdf
Beverages: Single Serve Juice Flavored Beverages Beverages are sold in a wide variety of package formats based on their volume, content, usage (on the go, at home, at work), target audience, and branding, among many other considerations. Beverages are also heavy, requiring a package format that is robust enough to contain the volume without breaking during transport or usage. An example of a beverage that is sold in a wide variety of package formats is juice or fruit flavored beverages. For this Life Cycle Assessment study, we evaluated five popular beverage formats used for juice/fruit flavored beverages. Table 9-P. Single Serve Juice Evaluation Comparison
Package Type/Product Weight
Structure (package weight) Photo
Drink Pouch - (6 fl. oz.) 177 ml
Pouch - PET/Foil/LLDPE -4.5g
Straw - PP - 0.4g TOTAL = 4.9g
Composite Carton - 6.75 fl. oz. (200 ml)
Carton - SUS paper/LLDPE/ Aluminum - 8.9g
Straw - PP - .4g TOTAL = 9.3g
PET Bottle - 8 fl. oz. (237 ml)
Bottle - PET - 8.6g
Cap - PP –-1.3g Label - Paper - 0.6g TOTAL = 10.5g
160
Package Type/Product Weight
Structure (package weight) Photo
Aluminum Can – 5.5 fl. oz. (163 ml)
Can - aluminum - 9.2g
TOTAL = 9.2g
Glass Bottle – 10 fl. oz. (296 ml)
Bottle – glass – 152g
Cap – PP – 3g Label – PS – 2g TOTAL = 157g
Packages as close as possible in size/volume were selected to make the lifecycle comparison. Not in all cases were packs of identical size/volume available for purchase. As you can see from looking at Table 9-P, the glass bottle requires significantly more packaging material than other formats, one of the reasons that it is not as widely used as in the past for fruit or flavored beverages. The flexible pouch, aluminum can, and composite carton are at the other end of the spectrum, with under 10g of packaging for these drink packages, though holding less beverage (6 fl. oz. versus 10 fl. oz.) than the glass bottle. The PET bottle package is very close as well 10.3g of material used for 8 oz. of a beverage. An interesting observation as well is that the closure alone for the glass bottle weighs in at 3g, nearly the same weight of the entire flexible pouch in this example, which was 4.5g (without the straw). Fossil Fuel Consumption, Greenhouse Gas Emissions, and Water Consumption Comparison The charts on the following page will highlight results of the fossil fuel usage, greenhouse gas (GHG) emissions, and water consumption for each of the package formats evaluated. These are some of the primary indicators that package developers consider when appraising the environmental impacts of a particular package. The EcoImpact-COMPASS® software “normalizes” the data based on the functional unit such as weight or number of uses to allow comparison between package formats which may not be the exact same size.
161
Figure 9-16. Single Serve Juice Packaging – Fossil Fuel Consumption
As can be seen in the chart above (Figure 9-16), the drink pouch uses considerably less fossil fuel in material processing and manufacturing stages than most of the other package formats, including the PET bottle, aluminum can, and glass bottle. These are all driven by requiring more material to hold the same amount of product, as well as the material production of the other package formats being more energy intense. The process to form glass and aluminum both require large amounts of heat, and thus energy, which drives their much larger fossil fuel consumption. The composite carton comes out quite similar to the drink pouch at just 7.34% more fossil fuel consumption. This is driven by both package formats being relatively close in weight of material needed to hold around 6 fl. oz. of a juice beverage. They are also both multi-layer composite structures, which means they use multiple thin layers of material to provide the barrier and strength needed to contain a beverage. Thus, the drink pouch and composite carton come out with more favorable results in fossil fuel consumption. Figure 9-17. Single Serve Juice Packaging – GHG Emissions
162
Figure 9-17 compares the greenhouse gas (GHG) emissions of the five package formats that were evaluated. The drink pouch has the lowest overall GHG emissions of all of the packs evaluated. The composite container comes in next with a carbon impact 28.2% greater than the drink pouch. Again, since both the drink pouch and the composite carton are lightweight structures and have very energy efficient process, as noted in the fossil fuel consumption section, they tend to have the lowest GHG emissions. The PET bottle, which uses a blow mold process to form the bottle, using heat and pressurized air to form the bottle within a mold. This process results in GHG emissions significantly lower than the aluminum can or glass bottle, but it is 57.3% greater than the drink pouch. Both the aluminum can and the glass bottle have GHG emissions which are significantly higher than the drink pouch. The aluminum can is a relatively lightweight package, but the production of aluminum is a very energy intensive process, which drives its high carbon impact. Finally, the glass bottle is by far the heaviest package option, and thus could be expected to have among the highest GHG emissions. Its heavy weight also results in it having a fairly large transportation impact for GHG emissions, compared to the other package formats. Therefore, the drink pouch has the lowest GHG emissions of the options due largely to its light weight and overall efficient material and manufacturing process. Figure 9-18. Single Serve Juice Packaging – Water Consumption
Figure 9-18 (above) compares water consumption during the life cycle of all package formats. The drink pouch uses the least amount of water by a wide margin of all of the packages. The laminating process of combining multiple thin film layers together used for the drink pouch uses very little water. The composite carton water consumption is driven by its use of paper, which makes up a majority of the multi-material structure. Paper, while being a bio-based material, has a very water intensive production process.
+1633%%
163
The aluminum can and glass bottle both use large amounts of water in the manufacturing of their respective materials as part of the overall cooling process, which drives their significantly higher water consumption values. End of Use Results In this section, we will explore the impacts of a material recycled or sent to municipal solid waste to ensure that the package aligns with Circular Economy or Sustainable Materials Management goals. Table 9-Q (below) shows the results when current recycling rates are considered, as well as the product-to-package ratio, which is a measure of the resource efficiency of the materials used. For this measure, a high product and a low package number are desired. Table 9-Q. Single Serve Juice Packaging - Recycled and Landfilled Comparison
• PET container recycling rate of 30.1% (2015 APR Post Consumer Bottle Recycling report) • Aluminum container recycling rate of 55.1% (2014 EPA Advancing Sustainable Materials
Management Fact Sheet) • Composite carton recycling rate of 10% (A Study of Packaging Efficiency as It Relates to Waste
Prevention,” January 2016) • Drink pouch was assumed to have 0% recycling rate • All material collected for recycling was assumed to be actually recycled • Package landfilled is amount of packaging not recycled, goes to municipal solid waste
164
End of Use Summary There are some interesting results to highlight from Table 9-Q. First, is the fact that all of the package formats, except for the glass bottle, result in a product-to-package ratio by percentage of over 94%. This shows that most package formats today are very efficient in their usage of materials to transport beverages. The drink pouch is the most efficient with a product-to-package ratio by percentage of over 97%. Another interesting note is that when considering the amount of packaging that ends up as municipal solid waste based on current recycling rates, the aluminum can and drink pouch are quite similar (25,388g versus 27,734g of package/1000 kg of beverage), with the aluminum can resulting in about 8% less material to landfill as the drink pouch. This is driven by the aluminum can being quite lightweight, as well as having a recycling rate of 55%. The drink pouch was assumed to not be recycled at all. The composite carton and PET bottle results in more material being landfilled (at 52% and 20% respectively) than the drink pouch. Composite cartons have begun to be recycled in the past few years, based on industry efforts to drive collection. The comparison between the aluminum can and drink pouch is an example of a case where other environmental indicators such as fossil fuel use, GHG emissions, and water consumption should be taken into consideration to get a more holistic environmental picture. These are all areas that the flexible pouch had significantly more favorable results than the aluminum can. Of course, product protection, target consumer, usage, equipment, and other variables need to be taken into consideration as well. However, the example highlights the risk of looking at any single environmental metric when making a decision based on the “best” package. The examples above highlight that while many flexibles materials are not yet recovered and recycled in any significant amount, they still result in a substantial reduction in the amount of material sent to landfill versus most other package formats, as well as an advantage in fossil fuel consumption, GHG emissions and water consumption. Summary/Implications The results of the data comparing the different juice package formats show the drink pouch has a number significant benefits (fossil fuel usage, carbon impact, water consumption) over the other formats when considering these environmental indicators. The drink pouch also results in much less municipal solid waste than all of the package formats, except for the aluminum can, which has a slight advantage based on its relatively high recycling rate. The juice flavored beverage package example highlights the need to holistically consider a wide range of environmental attributes when selecting the “most sustainable package.” There are a number of metrics that can be considered, and it’s important for package developers and other stakeholders to consider the whole picture.
165
When selecting a particular package format, a number of product and package attributes need to be considered. These may include product protection, retail environment, consumer usage, product branding, operational impacts, and sustainability benefits. Sustainability attributes are never considered on their own, but always as part of broader more holistic packaging solution to get to the optimal solution. Table 9-R below summarizes much of the critical data and package comparison discussed for this single serve juice flavored beverage packaging case study. Table 9-R. Single Serve Juice Packaging Comparison Summary
Format Fossil Fuel Consumption
(MJ-Equiv)
GHG Emissions (kg-CO2 equiv)
Water Consumption
(l)
Product-to-Package ratio and
percent wt.
Pkg Landfilled (g)/1000 kg juice
Drink Pouch
88,736 4,652 12,108 36.1:1 97.3%:2.7%
27,734
Composite carton
95,250 (+7.34%)
5,967 (+28.2%)
71,685 (+492%)
21.5:1 95.5%:4.5%
42,126 (+52%)
PET Bottle 140,231 (+58%)
7,319 (+57.3%)
28,738 (+137%)
22.5:1 95.8%:4.2%
33,442 (+20%)
Aluminum Can
275,766 (+211%)
27,105 (+483%)
91,812 (+658%)
17.7:1 94.6%:5.4%
25,388 (-8%)
Glass Bottle
326,690 (+268%)
25,612 (+451%)
209,809 (+1633%)
1.9:1 65.3%:34.7%
364,169 (+1213%)
Notes: A normalized product weight (common value divisible by all package formats) of 1,188,000 fl. oz. of product was used for Fossil Fuel, GHG and Water Consumption calculations. Notes:
• A normalized product weight (common value divisible by all package formats) of 1,188,000 fl. oz. of product was used for Fossil Fuel, GHG and Water Consumption calculations.
• All percentages cited are for other formats compared to the stand-up flexible pouch. • A higher number for product-to-package ratio (first number) cited means a higher percentage of
weight is attributed to product, and less to packaging, resulting in more efficient use of packaging resources.
• Package landfilled values are based on the of amount of packaging sent to municipal solid waste after recycling, based on 1000 kg of juice.
Sources:
• Recycling rates used in calculations based on EPA Advancing Sustainable Materials Management Fact Sheet, November 2016 (Accessed November 29, 2017)
• Additional recycling rate sources:
166
o Other recycling rates determined from “A Study of Packaging Efficiency as It Relates to Waste Prevention,” January 2016. Use Less Stuff Report - http://use-less-stuff.com/wp-content/uploads/2017/10//2016-Packaging-Efficiency-Study-1.19.16.pdf
o 2015 APR Post Consumer Bottle Recycling report - https://plastics.americanchemistry.com/2015-United-States-National-Postconsumer-Plastic-Bottle-Recycling-Report.pdf
APR Association of Plastic Recyclers BON Biaxially Oriented Nylon EPA U.S. Environmental Protection Agency EVOH Ethylene Vinyl Alcohol GHG Greenhouse Gas HDPE High Density Polyethylene (labeled as #2 plastic) LCA Life Cycle Assessment LDPE Low Density Polyethylene (labeled as #4 plastic) LLDPE Linear Low Density Polyethylene NAPCOR National Association for PET Container Resources PET Polyethylene Terephthalate (labeled as #1 plastic) PP Polypropylene (labeled as #5 plastic) PS SMM
Polystyrene Sustainable Materials Management
168
THIS PAGE INTENTIONALLY LEFT BLANK
169
Chapter 10
The Future for Flexible Packaging and Sustainability
Introduction The future for flexible packaging is bright. Flexible packaging delivers a number of key attributes that benefit members of the entire packaging value chain including brand owners, retailers, and most importantly, consumers. For producers and retailers, flexible packaging offers the benefits of extended shelf life, especially when combined with processing technologies such as modified atmosphere packaging (MAP), high pressure processing (HPP), or vacuum packaging. These technologies help reduce costs and food waste. Other sustainability-oriented benefits include being lightweight, having a favorable life cycle assessment for carbon, fossil fuel, and water usage versus other packaging formats. Additionally, there is often a transportation benefit in the number of trucks needed for inbound package delivery due to the compact format flexible packaging is shipped (often in a roll, or flat bags). From a consumer side, some of the benefits such as extended shelf life and less material used or disposed are similar to brand owner benefits. Flexible packaging, however, also has a number of usage benefits such as easy open/reclose (convenience, freshness), portability and in pack cooking features.
Flexible packaging also aligns very favorably with Sustainable Materials Management (SMM) systems, which focuses on the efficient use of resources, and minimizing the carbon impact throughout the package life cycle. Packaging format and materials design and construction must protect the product, provide
appropriate shelf/usage life, and fit with brand equity, among many other attributes. Sustainability attributes alone are usually not enough to get consumers and brand owners to make a packaging change, though it is certainly a growing consideration in packaging decisions. Future Growth Opportunity Areas for Flexible Packaging While flexible packaging usage has grown across a number a product formats, due to the benefits it provides, there are a number of new future growth opportunities. Table 10-A outlines many of these areas, along with rationale for growth. Note that the opportunities are not in order of importance.
Figure 10-1. Retailer/Brand Owner and Consumer Sustainability Benefits of Flexible Packaging
170
Table 10-A. Future Opportunities and Needs for Flexible Packaging
Biobased materials that provide good barrier properties or can be composted, depending on need.
Consumer communication/ education
Enhanced consumer communication about benefits of flexible packaging and sustainability, along with greater usage of tools like the How2Recycle label scheme.
E-commerce overwraps
E-commerce is experiencing global growth of about 20% annually. Shippers charge based on dimensional weight (volume + weight). Flexible packaging could target clothing, footwear, and lightweight items not damage prone. Flexible packaging overwraps reduce overall package size and weight versus corrugated and they reduce shipping costs and promote fitting more products on a delivery truck.
E-commerce returnable packaging
E-commerce clothing and footwear products are returned at a rate of 20-30%. Easy open/returnable flexible packaging solutions are needed.
Emerging markets Consumers in emerging markets will continue to look for the convenience and safety of packaged goods but will need help in developing recovery infrastructure.
Food waste – compostable packaging
As more communities require food waste collection, the desire for certified compostable flexible packaging for foodservice as well as retail will grow, which may permit consumers to place food waste and compostable packaging together (in areas where composters accept compostable packaging).
Food waste reduction technologies
Processing technologies like MAP, HPP, vacuum package utilize flexible packaging to keep product fresh/extend shelf life without the need for additives.
Increased recycled content
In a push toward a more circular economy, the inclusion of post-consumer recycled content, particularly for non-food applications will grow.
Life cycle tools 1. Design - Tools that take a holistic life cycle approach to measure and determine environmental impacts of package formats will be more important as companies move from lightweighting to more holistic measures and goals for sustainable packaging impacts. These tools (like EcoImpact-COMPASS®) can help quantify carbon impact benefits for cross value chain initiatives like Walmart’s Project Gigaton.
171
2. Food waste - Future tools will allow for quick life cycle assessment (LCA) of product and package together, providing data on benefits of packaging in reducing waste.
Recyclable multi-layer, single material laminates
Flexible packaging structures that provide required barrier but can also be recycled in store drop-off programs as part of How2Recycle program will provide a first step toward getting more flexible packaging recycled, using existing infrastructure.
Industry Challenges/Needs While there are a number of benefits of flexible packaging, and certainly a number of opportunities, there remain challenges and needs that will require broader collaboration. These are areas where holistic solutions and collaborations need to be developed. Recovery and Recycling of Multi-Material Structures Two separate, but related items are the recovery or collection of multi-material flexible packaging, as well as the development of recycling technologies. Recovery of flexible packaging is required because without a recovery there is no need or push to find recycling technologies, since material is not available for recycling. On the other hand, improvement of recycling technologies for multi-material laminates will be needed for flexible packaging to play an important role in a circular economy, where the focus is on collection and recycling of materials. Potential areas for recycling technology improvements include:
• Expansion of How2Recycle + Wrap Recycling Action Program (WRAP) where consumers bring their polyethylene (PE) bag for drop-off at stores. Research from Europe notes that approximately 80% of flexible packaging today is made from mono-material (mostly PE), showing that the bag drop-off program has a great opportunity to expand flexible packaging recycling.
• Collection and screening at MRFs – groups such as Materials Recovery for the Future (MRRF) and CEFLEX (Europe), are using industry wide collaborations to identify technologies to collect, sort, and find outlets for flexible packaging.
• Chemical recycling – currently expensive but offers opportunity to take mixed plastics and chemically degrade the collected plastic waste into its monomers or other basic chemicals for use in making new polymers.
• Waste to Energy(WTE)/Pyrolysis– WTE is a very large part of recovery of multi-material packaging in Europe and parts of Asia. There is some movement toward pyrolysis in U.S., capturing higher value than landfill materials, though it is still a small part of overall waste management.
• Fuels-program like Hefty® EnergyBag program, which collect flexible packaging at the consumer level and use as a fuel source with its high BTU content.
172
Legislative Challenges While flexible packaging has a very positive sustainability story, the lack of cost effective recycling technologies can lead to unintended consequences, such as litter or marine debris. These issues tend to be most prevalent in emerging markets without developed waste and recycling systems; they also are an issue in developed markets, including the U.S., when consumers do not properly dispose of packaging. This is leading to a legislative push in regions such as Europe, at times specifically targeting single use or plastic packaging. Some recent examples of proposed or discussed legislation include:
• Circular Economy legislation – driving push for more recyclable packaging • Marine debris – considering alternative materials to plastic, which does not
marine degrade, or looking to limit plastic usage • Single use plastics tax – to fund collection of marine debris • Extended Producer Responsibility (EPR) – to tax and fund recovery/recycling
infrastructure, moving cost from municipalities • Disposable coffee cup levy – to fund collection system and recycling system for
single use coffee cups In Europe in particular, but also in emerging markets such as India and China, there has been a focus on litter and marine debris, and in some areas highlighting single use plastic packaging as the main target. While this report has shown that flexible packaging has a number of positive sustainability attributes, that story has not necessarily been understood in the general public and media. In Europe, some retailers are leveraging the social concerns around marine debris and litter and have proclaimed they will phase out the use of plastic in their private brand packaging. However, a report by the consulting group Trucost, and commissioned by the American Chemistry Council, found that moving from plastics to alternative materials would have an environmental cost about four times that of using plastic, because of the lightweight nature of plastics and shelf life extension of food. Regardless, due to the lack of current recycling systems, industry needs to be cognizant of these social issues and continue to work collaboratively to communicate and educate packaging’s benefits, while also striving to improve the social, environmental and economic value of flexible packaging.
173
Path Forward The path forward for flexible packaging and further expanding its sustainability credentials will require industry collaboration. Collaboration will be needed to bring forward next generation technologies in biobased materials, consumer education, mono-material recyclable structures, and especially recycling infrastructure. Companies will also need to embrace triple bottom line thinking. They need to consider not only economic and environmental elements, but social implications as well. Many of the hot button issues around marine debris, litter, and recyclability have strong social components to them, which will continue to be a more important consideration in the future. The flexible packaging community will also need to embrace the moonshots, farther out technologies such as marine degradable materials, universal markers on packaging to aid in recycling, and chemical recycling. All are disruptive and have the ability to greatly impact flexible packaging, merging both Sustainable Materials Management (SMM) and Circular Economy (CE) principles. Finally, remember that sustainability is a journey. As soon as one goal is achieved, another opportunity will present itself. The flexible packaging industry needs to embrace that journey, as Lao-Tzu said, “A journey of a thousand miles begins with a single step.”
Figure 10-2. Triple Bottom Line
174
Acronyms – Chapter 10
BTU British Thermal Unit CE Circular Economy CEFLEX Circular Economy for Flexible Packaging EPR Extended Producer Responsibility HPP High Pressure Processing LCA Life Cycle Assessment MAP Modified Atmosphere Packaging PE Polyethylene SMM Sustainable Materials Management WRAP Wrap Recycling Action Program WTE Waste to Energy
175
References and Sources:
Communication From the Commission to The European Parliament, The Council, The European Economic and Social Committee and The Committee of The Regions. Strategy for Plastics in a Circular Economy. European Commission, 16 Jan. 2018, ec.europa.eu/environment/circular-economy/pdf/plastics-strategy.pdf. Houlder, Graham, et al. Mapping Flexible Packaging in a Circular Economy [F.I.A.C.E]. Delft University of Technology, 14 Oct. 2016, ceflex.eu/public_downloads/FIACE-Final-report-version-24-4-2017-non-confidential-version-Final.pdf. “Iceland supermarket chain aims to be plastic free by 2023.” BBC News, BBC, 16 Jan. 2018, www.bbc.com/news/business-42692642. Johnston, Ian. “India just banned all forms of disposable plastic in its capital.” The Independent, Independent Digital News and Media, 25 Jan. 2017, www.independent.co.uk/news/world/asia/india-delhi-bans-disposable-plastic-single-use-a7545541.html/. Kottasová, Ivana. “Latte levy: Disposable coffee cups should be taxed, say UK lawmakers.” CNNMoney, Cable News Network, 5 Jan. 2018, money.cnn.com/2018/01/05/news/coffee-cup-tax-latte-levy/index.html. The New Plastics Economy: Catalysing action. Ellen MacArthur Foundation , 13 Jan. 2017, www.ellenmacarthurfoundation.org/assets/downloads/New-Plastics-Economy_Catalysing-Action_13-1-17.pdf. Study from Trucost Finds Plastics Reduce Environmental Costs by Nearly 4 Times Compared to Alternatives. American Chemistry Council, 28 July 2016, plastics.americanchemistry.com/Study-from-Trucost-Finds-Plastics-Reduce-Environmental-Costs/%20. Walker, Peter. “UK considers tax on single-Use plastics to tackle ocean pollution.” The Guardian, Guardian News and Media, 17 Nov. 2017, www.theguardian.com/environment/2017/nov/18/uk-considers-tax-on-single-use-plastics-to-tackle-ocean-pollution.
176
THIS PAGE INTENTIONALLY LEFT BLANK
177
Appendix
Life Cycle Assessment and Case Study Data Input
178
Coffee: EcoImpact-COMPASS® LCA Tool inputs:
Format Prod. Wt.
Component Material Wt. (g) Process Pkg Type
Plastic Container
306 g Rigid canister
HDPE 52.7 Injection Molding
Other Plastic
Container Lidstock PET .26 Lamination Composite Aluminum .19 Sheet Rolling Composite LDPE .55 Lamination Composite Lid LDPE 10 Injection
Molding Other
Plastic Pkg Steel Can 226.8
g Steel can and pull
top
Steel 102 Production of tin can
Food and Other Cans
Lid LDPE 9 Injection Molding
Other Plastic Pkg
Stand up pouch
340 g Stand up pouch
PET 3.34 Lamination Composite
Aluminum 2.38 Sheet Rolling Composite
LDPE 1.67 Lamination Composite
Tin Tie Steel .9 Steel Wire Drawing
Other Steel Pkg
179
Motor Oil: EcoImpact-COMPASS® LCA Tool inputs:
Format Prod. Wt.
Component Material Wt. (g) Process Pkg Type
HDPE Bottle
56.4 g
Rigid Bottle HDPE 56.6 Injection Molding
Other Plastic
Container Closure PP 2.8 Lamination Composite Stand up pouch
19.2 g
Stand up pouch
Nylon 6 1.72 Lamination Composite
HDPE 14.56 Lamination Composite
Fitment LDPE 2.9 Lamination Composite
180
Baby Food: EcoImpact-COMPASS® LCA Tool inputs:
Format Prod. Wt.
Component Material Wt. (g) Process Pkg Type
Glass Jar 89.2 g
Glass Jar Container Glass
82.8 Production of Container Glass
Food & Other
Bottles & Jars
Closure Steel 6 Production of Tin Can
Other Steel Pkg
Label Oriented Poly-
Propylene
.4 N/A Bags, Sacks & Wraps
Thermo-formed Tub
10.1 g
Tub Poly-propylene
6.7 Thermoforming plastic sheet
Composite
Lid PET 2.8 Thermoforming plastic sheet
Other Plastic Pkg
Lidstock PET .09 Laminating Composite Aluminum .13 Alum Sheet