Page 1
Clemson UniversityTigerPrints
All Theses Theses
12-2017
A Hybrid Approach for Treatment of NaphthenicAcid Fraction Compounds in Oil Sands Process-Affected WaterDaniel Peter GaspariClemson University
Follow this and additional works at: https://tigerprints.clemson.edu/all_theses
This Thesis is brought to you for free and open access by the Theses at TigerPrints. It has been accepted for inclusion in All Theses by an authorizedadministrator of TigerPrints. For more information, please contact [email protected] .
Recommended CitationGaspari, Daniel Peter, "A Hybrid Approach for Treatment of Naphthenic Acid Fraction Compounds in Oil Sands Process-AffectedWater" (2017). All Theses. 2806.https://tigerprints.clemson.edu/all_theses/2806
Page 2
A HYBRID APPROACH FOR TREATMENT OF NAPHTHENIC ACID FRACTION
COMPOUNDS IN OIL SANDS PROCESS-AFFECTED WATER
A Thesis
Presented to
the Graduate School of
Clemson University
In Partial Fulfillment
of the Requirements for the Degree
Master of Science
Hydrogeology
by
Daniel Peter Gaspari
December 2017
Accepted by:
Dr. James W. Castle, Committee Chair
Dr. John H. Rodgers, Jr.
Dr. Monique Simair
Page 3
ii
ABSTRACT
Extensive volumes of oil sands process-affected waters (OSPWs) are produced at
surface mines in the Athabasca Oil Sands. OSPW contains constituents, including a
complex mixture of refractory organics known as naphthenic acid fraction compounds
(NAFCs), that require treatment prior to government-mandated reclamation of mining
leases. Hybrid constructed wetland treatment systems (CWTSs) implementing film-based
TiO2 photocatalysis were investigated as a passive, low-energy method for treatment of
constituents of concern (COCs) in OSPW.
Bench-scale settled TiO2 batch reactors were assembled and degradation of
NAFCs in a specific OSPW was measured as a function of cumulative solar ultraviolet
radiation (UV insolation) and by high performance liquid chromatography (HPLC) of
naphthenic acids (NA) derivatives. Settled layers of TiO2 were photoactivated by solar
UV-A radiation transmitted through OSPW, which decreased naphthenic acid (NA) mass
by 86% at an exponential rate with a mean UV insolation half-life of 1.1±0.2 MJ·m-2.
Evapotranspiration increased half-lives for NA concentration removal by approximately
90%, highlighting the need for further experimentation with flow-through fixed-film
reactors to evaluate if this approach can increase removal rates and efficiencies of NA
concentration in OSPW. Following this proof of concept experiment, solar TiO2 fixed-
film photocatalytic reactors and wetland cells were implemented into a hybrid pilot-scale
CWTS. Performance of the hybrid CWTS was measured in terms of changes in toxicity
and constituent concentration and composition over three sampling periods. NAFC
concentrations decreased by 75.9% from inflow (43.1±5.9 mg/L) to outflow (10.4±6.0
Page 4
iii
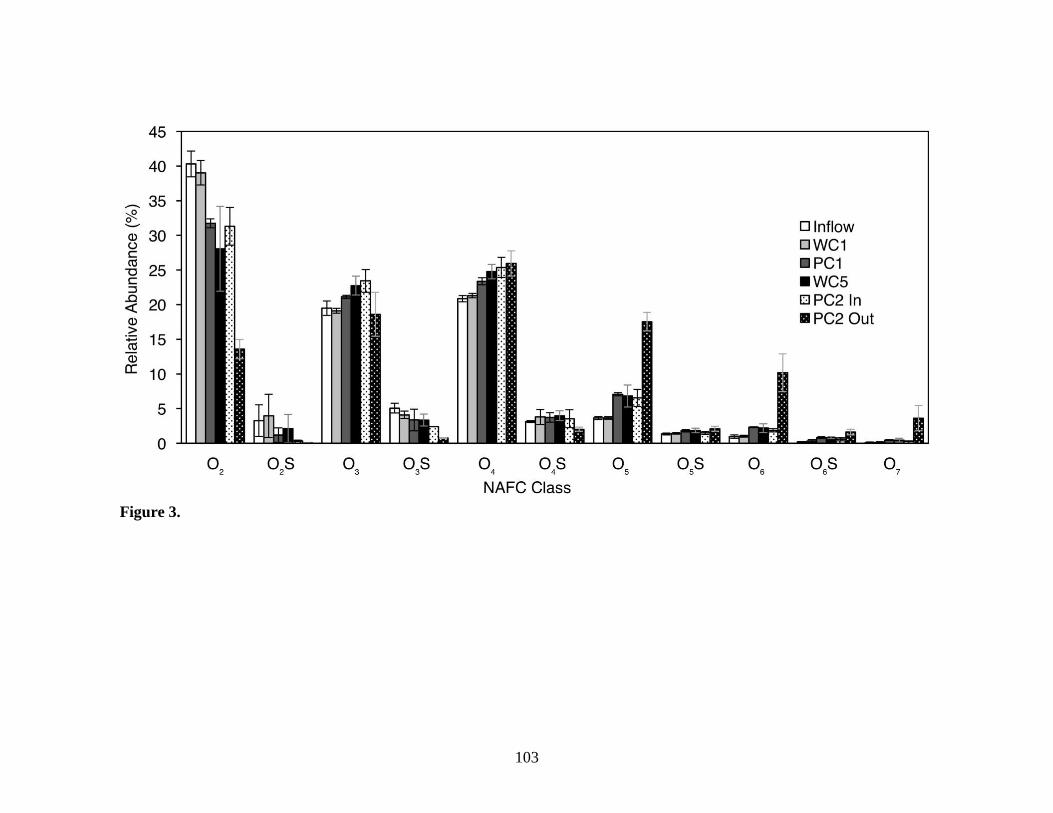
mg/L) of the hybrid pilot-scale CWTS, and class distribution shifted from regimes
dominated by acutely toxic classical NAs (i.e. O2 NAs; O2=40.3%, ∑O3–9=45.0%) to
sparingly toxic poly-oxygenated classes (O3–9; O2=13.6%, ∑O3–9=77.0%). The influence
of weather conditions on performance was demonstrated by increases in Cl-
concentrations due to evapotranspiration during the first sampling period and inhibition
of NAFC aerobic degradation by near freezing temperatures in the third sampling period.
In sampling periods 2 and 3, toxicity to C. dubia was eliminated in all samples collected
from the hybrid CWTS. Reproduction of C. dubia was impaired in 4 of 8 samples
collected during sampling period 1, likely due to increased Cl- concentrations. Changes in
toxicity and distribution of NAFC classes reported with biogeochemical conditions in the
hybrid pilot-scale CWTS will inform further development of this technology.
In this study of a specific OSPW, solar photocatalysis over settled TiO2
significantly decreased NA concentration and mass, aerobic degradation in wetland cells
paired with fixed-film photocatalysis altered composition and decreased concentration of
NAFCs, and in both experiments toxicity associated with NAFCs in OSPW decreased.
Results from these bench- and pilot-scale experiments provide proof of concept data
supporting further development of fixed-film photocatalytic reactors and testing of
CWTSs in the Athabasca Oil Sands for treatment of NAFCs in OSPW.
Page 5
iv
DEDICATION
This thesis is dedicated to my parents, Michael and Marsha. Dad, following your
example has taught me that hard work is always rewarded. Your devotion to your family
and to help others will always inspire me. Mom, you fostered my curiosity of the natural
world, which guided my path through academia. Both of your love, support, and advice
made this thesis possible.
Page 6
v
ACKNOWLEDGEMENTS
Dr. Castle’s wise advice, both scientific and professional, and meticulous reviews
have made me a better writer and scientist. I wish him a fulfilling and relaxing retirement.
I thank Dr. Rodgers for teaching me invaluable professional skills throughout my
participation in the Oil Sands Process-Affected Water Research Group. Discussions with
Dr. Simair, as well as her thorough reviews, have expanded my knowledge of topics
essential to completion of this thesis. I was extremely fortunate to work with a group of
highly motivated and intelligent graduate students. Maas, Andrew, Ciera, Sam, Alyssa,
Rebecca, Megan, and Tyler, thank you for your collaboration, assistance, and
discussions. Dr. Chao provided analytical assistance, help locating laboratory supplies,
and always a cheery disposition. I greatly appreciate the work of Dr. Headley, Kerry
Peru, and their colleagues at the Environment and Climate Change Canada National
Hydrology Research Centre, who performed extraction and ultra-high resolution mass
spectrometry of NAFCs in samples from the hybrid pilot-scale CWTS. The staff of
Contango Strategies are thanked for their assistance in relaying these samples. Finally, I
thank my girlfriend Bailey for her unwavering love and support throughout the
completion of this thesis.
Page 7
vi
TABLE OF CONTENTS
Page
TITLE PAGE .................................................................................................................... i
ABSTRACT ..................................................................................................................... ii
DEDICATION ................................................................................................................ iv
ACKNOWLEDGEMENTS ............................................................................................. v
LIST OF TABLES ......................................................................................................... vii
LIST OF FIGURES ......................................................................................................... x
CHAPTER
I. INTRODUCTION ............................................................................................ 1
II. SOLAR PHOTOCATALYSIS OF AN OIL SANDS PROCESS-AFFECTED
WATER OVER SETTLED TiO2 ..................................................................... 8
Abstract .................................................................................................... 8
Introduction .............................................................................................. 9
Materials and Methods ........................................................................... 12
Results .................................................................................................... 21
Discussion .............................................................................................. 27
Conclusions ............................................................................................ 37
References .............................................................................................. 38
III. A HYBRID PILOT-SCALE CONSTRUCTED WETLAND TREATMENT
SYSTEM FOR REMEDIATION OF AN OIL SANDS PROCESS-AFFECTED
WATER .......................................................................................................... 52
Abstract .................................................................................................. 52
Introduction ............................................................................................ 53
Materials and Methods ........................................................................... 58
Results and Discussion .......................................................................... 68
Conclusions ............................................................................................ 87
References .............................................................................................. 89
IV. CONCLUSIONS .......................................................................................... 112
V. APPENDICES .............................................................................................. 116
Chapter II: Supporting Information ..................................................... 117
Chapter III: Supporting Information .................................................... 123
Standard Operating Procedures............................................................ 131
Page 8
vii
LIST OF TABLES
Table Page
Chapter II
Table 1. Naphthenic acid (NA) mass and concentration removal extents (i.e. final mass or
concentration measured), efficiencies (Eqn. 10, 18), rate coefficients (Eqn. 6-7,
14-15), and half-lives (Eqn. 8-9, 16-17) for photocatalytic, photolytic, and dark
control reactors. Data are reported as means and standard deviations calculated
from values measured in replicate reactors (n=3). Removal of NA
concentrations were measured until the midpoint of the experiment, and NA
mass removal was determined throughout the entire duration of the
experiment. .................................................................................................... 51
Table S1. Methods for measurement of water quality characteristics, UV irradiance, and
concentrations of metals, major ions, and naphthenic acid. Unless noted
otherwise, methods were adapted from American Public Health Association
(APHA) standard methods (APHA, 2012). ................................................ 119
Table S2. Mean temperature, pH, dissolved oxygen (DO), and conductivity measured in
photocatalytic, photolytic, and dark control reactors during the photocatalysis
experiment. .................................................................................................. 120
Table S3. Water quality characteristics in exposures of untreated OSPW and from
photocatalytic, photolytic, and dark control reactors used in bioassays.
Reported values are means and standard deviations (n=3). ........................ 120
Table S4. Concentrations of organics and acid soluble elements in exposures of untreated
OSPW and from photocatalytic, photolytic, and dark control reactors used in
bioassays. Reported values are means and standard deviations (n=3). ....... 121
Table S5. Survival and reproduction of C. dubia exposed to untreated OSPW, laboratory
controls (Control 1 and 2), and photocatalysis, photolysis, and dark control
treatments. Statistical comparisons were made between Control 1 and OSPW
and between Control 2 and the treatments. ................................................. 122
Table S6. Survival and biomass of P. promelas exposed to untreated OSPW, laboratory
controls (Control 1 and 2) and photocatalysis, photolysis, and dark control
treatments. Statistical comparisons were made between Control 1 and OSPW
and between Control 2 and treatments. ....................................................... 122
Page 9
viii
List of Tables (continued)
Table Page
Chapter III
Table 1. Identification of constituents of concern (COC) in samples of oil sands process-
affected water (OSPW) by comparison of water quality characteristics and
concentrations of nutrients and major ions with lowest water quality criteria
(WQC) from regulatory agencies including United States Environmental
Protection Agency (USEPA, 2007), Canadian Council of Ministers of the
Environment (CCME, 2011), and Alberta Environment and Parks (AEP,
2014). .......................................................................................................... 106
Table 2. Identification of constituents of concern (COC) in samples of oil sands process-
affected water (OSPW) by comparison of concentrations of organics and acid
soluble metal and metalloids with lowest water quality criteria (WQC) from
regulatory agencies including United States Environmental Protection Agency
(USEPA, 2007) and Canadian Council of Ministers of the Environment
(CCME, 2011). ............................................................................................ 107
Table 3. Inflow and outflow volumes, precipitation, ambient air temperature, and UV
insolation during sampling periods in hybrid constructed wetland (HCW) and
polishing photocatalytic reactor (PC2) Series A and B. ............................. 108
Table 4. Changes in concentrations of oil and grease (O&G) and total suspended solids
(TSS) measured in hybrid constructed wetland (HCW) Series A and B. ... 109
Table 5. Changes in metal and metalloid concentration from inflow to outflow of hybrid
constructed wetland (HCW) series during three sampling events. Adjusted
concentrations are reported to assess changes in concentration independent of
evaporation, transpiration, and precipitation (Section 2.4; Eqn. 3). ........... 110
Table 6. Percent survival and reproduction of C. dubia in static renewal, 7-day bioassays
conducted according to Environment and Climate Change Canada protocols
for single-concentration tests (ECCC, 2007). Samples were compared to
laboratory controls to determine if survival and reproduction were impaired
(⍺=0.05). Comprehensive toxicity data are presented in supplementary data
(Table S5). ................................................................................................... 111
Page 10
ix
List of Tables (continued)
Table Page
Chapter III
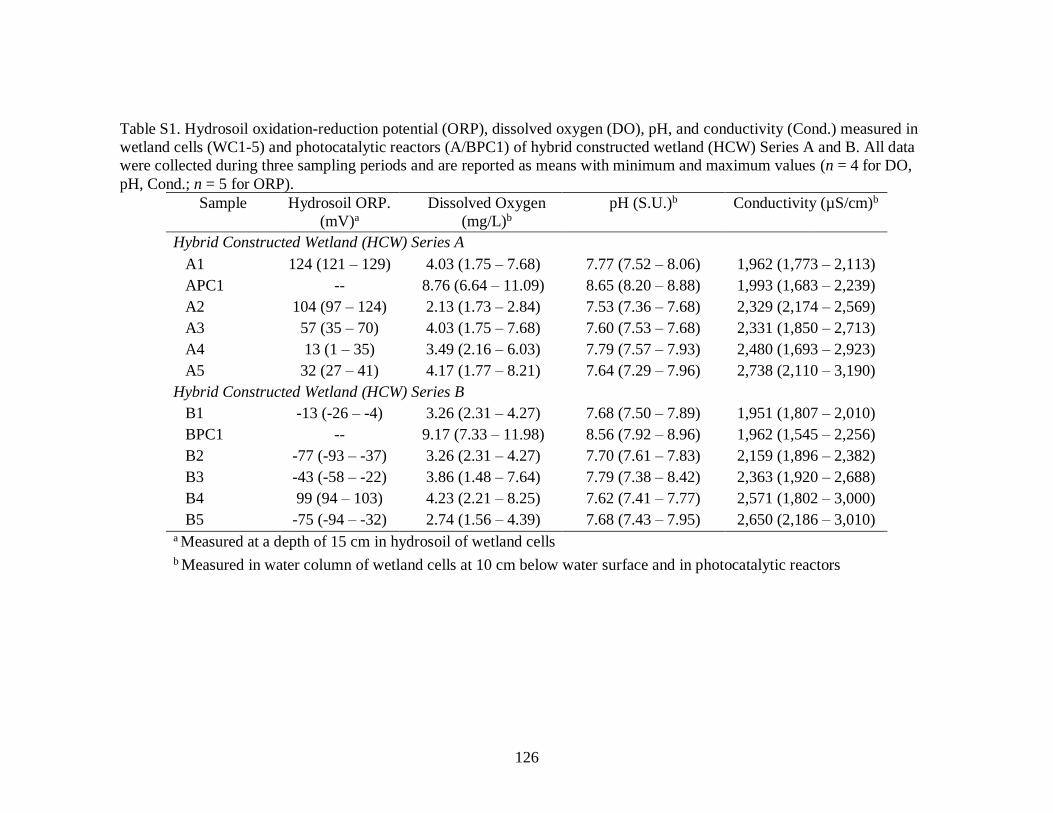
Table S1. Hydrosoil oxidation-reduction potential (ORP), dissolved oxygen (DO), pH,
and conductivity (Cond.) measured in wetland cells (WC1-5) and
photocatalytic reactors (A/BPC1) of hybrid constructed wetland (HCW) Series
A and B. All data were collected during three sampling periods and are
reported as means with minimum and maximum values (n = 4 for DO, pH,
Cond.; n = 5 for ORP). ................................................................................ 126
Table S2. Mean relative abundance of NAFC classes in hybrid pilot-scale CWTS
measured over three sampling periods by ESI-Orbitrap MS. Samples were
collected from untreated OSPW influent (inflow), outflows from initial
wetland cells (WC1), initial photocatalytic reactors (PC1), and final wetland
cells (WC5), and polishing photocatalytic reactor (PC2) inflow and outflow.
Orbitrap-MS of composite samples from replicate Series A and B (Figure 1)
was conducted in Dr. John Headley’s laboratory at the Environment and
Climate Change Canada National Hydrology Research Center. NAFC classes
with relative abundance <1% at all positions in the hybrid pilot-scale CWTS
were not included in this table. ................................................................... 127
Table S3. General water quality characteristics and chloride concentrations measured in
samples collected from hybrid constructed wetland (HCW) and polishing
photocatalysis (PC2) Series A and B. All data were collected during three
sampling periods and are reported as mean and range (n = 3). ................... 128
Table S4. Comparison of mean element concentrations measured in outflows of hybrid
constructed wetland (HCW) and polishing photocatalysis (PC2) Series A and
B (n=3 sampling periods; ⍺=0.05). ............................................................. 129
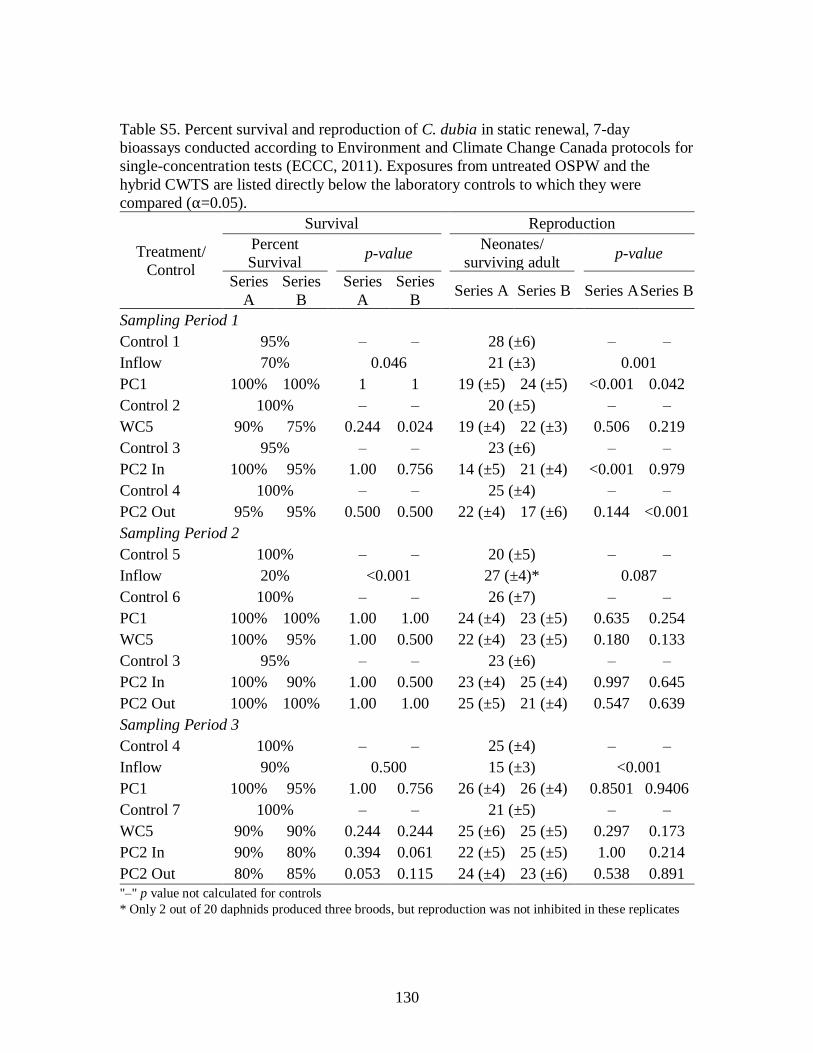
Table S5. Percent survival and reproduction of C. dubia in static renewal, 7-day
bioassays conducted according to Environment and Climate Change Canada
protocols for single-concentration tests (ECCC, 2011). Exposures from
untreated OSPW and the hybrid CWTS are listed directly below the laboratory
controls to which they were compared (⍺=0.05). ....................................... 130
Page 11
x
LIST OF FIGURES
Figure Page
Chapter II
Figure 1. Transmittance of UV-A, UV-B, and UV-C radiation in OSPW, a suspension of
0.01 g/L TiO2 in OSPW, and samples collected from photocatalytic reactors
0.5 and 2.0 h after a 1.0 g/L TiO2/OSPW suspension was poured into the
reactors. Wavelengths in the UV-A range were least absorbed in OSPW, and
0.01 g/L TiO2 significantly decreased transmittance of UV radiation in OSPW
(p<0.001). Transmittance of samples collected 0.5 and 2 h after TiO2/OSPW
suspensions were added to the reactors indicates that TiO2 was suspended
initially, but settled before 2 h. ..................................................................... 46
Figure 2. Attenuation of solar UV radiation as a function of depth in two OSPWs. OSPW
1 contained 6±2 mg/L total suspended solids (TSS) and no measurable oil and
grease (O&G; <4 mg/L), and OSPW 2 contained 69±11 mg/L TSS and 30
mg/L O&G. Each point represents mean UV irradiance (I) measured at depth,
divided by incident UV irradiance (Io). Data are correlated with exponential
functions according to the Beer-Lambert law (Eqn. 2). Error bars represent
standard deviation of five UV irradiance measurements made at 5-second
intervals. ........................................................................................................ 46
Figure 3. Naphthenic acid (NA) concentration in photocatalytic, photolytic, and dark
control reactors plotted versus UV insolation. After an experimental duration
of 32 h, UV insolation reached 1.78 MJ·m-2 over a photoperiod of 16 h. Each
point represents mean NA concentration of three replicate reactors. Error bars
represent one standard deviation (n=9). ........................................................ 46
Figure 4. Naphthenic acid (NA) mass in photocatalytic, photolytic, and dark control
reactors plotted against UV insolation. After an experimental duration of 82 h,
UV insolation reached 3.57 MJ·m-2 over a photoperiod of 32 h. Each point
represents mean NA mass measured in three replicate reactors. Error bars
represent one standard deviation (n=9). ........................................................ 46
Page 12
xi
List of Figures (continued)
Figure Page
Chapter II
Figure 5. A) Percent survival of C. dubia exposed to untreated OSPW and
photocatalysis, photolysis, and dark control treatments. B) Mean neonates
produced in first 3 broods by C. dubia surviving after exposure to untreated
OSPW and photocatalysis, photolysis, and dark control treatments. Asterisks
above OSPW indicate survival and reproduction were statistically lower than
laboratory control. Reproduction in all treatments was not different from the
laboratory control (Table S5). Tukey’s test indicates that the photocatalysis
treatment had significantly greater reproduction than photolysis and dark
control treatments (p = 0.0249 and 0.017, respectively). .............................. 47
Figure 6. A) Percent survival of P. promelas exposed to untreated OSPW and samples
from photocatalytic, photolytic, and dark controls reactors. B) Cumulative
mean biomass per surviving P. promelas fry. Error bars represent one standard
deviation (n=3). There were no significant differences in survival and biomass
between OSPW, the treatments, and laboratory controls (Table S6). ........... 47
Figure S1. UV irradiance (W·m-2; solid line) measured while photocatalytic and
photolytic reactors were exposed to direct sunlight (photoperiod=32 h).
Irradiance was integrated with respect to photoperiod to calculate UV
insolation (MJ·m-2; dashed line). Reactors were covered from 6:00 PM until
9:00 AM. Irradiance was not measured when reactors were covered......... 117
Figure S2. Extraterrestrial and terrestrial solar spectra (Gueymard, 2003 and ASTM,
2012, respectively) for UV-A, UV-B, and UV-C radiation. Atmospheric
transmittance of UV light is the quotient of terrestrial and extraterrestrial
spectral irradiance. These data illustrate that the majority of UV irradiance
reaching the earth’s surface is from UV-A wavelengths. ........................... 117
Page 13
xii
List of Figures (continued)
Figure Page
Chapter III
Figure 1. Diagram of hybrid pilot-scale CWTS (not to scale). The CWTS is composed of
a hybrid constructed wetland (HCW) and a polishing photocatalytic reactor
(PC2). The HCW consists of duplicate series (Series A and B), each containing
wetland cells (WC1-5) and an initial photocatalytic reactor (PC1), composed of
4 individual reactor units. FMI piston pumps, calibrated to achieve a nominal
hydraulic retention time (HRT) of 16 d, conveyed OSPW from a storage tank
to HCW series. Outflows from HCW series were collected, transferred to PC2
inflow tanks, and circulated through PC2 series (APC2, BPC2) until exposed
to >1.5 MJ/m2 UV insolation. ....................................................................... 99
Figure 2. Mean relative abundance of naphthenic acid fraction component (NAFC)
classes in OSPW measured by electrospray ionization Orbitrap mass
spectrometry following weak anion exchange (WAX) extraction according to
Ajaero et al. (2017). Error bars represent one standard deviation (n=4). ..... 99
Figure 3. Mean relative abundance of NAFC classes in hybrid pilot-scale CWTS
measured over three sampling periods by electrospray ionization Orbitrap mass
spectrometry, which was conducted by Dr. John Headley’s laboratory at the
National Hydrology Research Centre in Saskatoon, SK. Samples were
collected from untreated OSPW influent (inflow), outflows from initial
wetland cells (WC1), initial photocatalytic reactors (PC1), and final wetland
cells (WC5), and polishing photocatalytic reactor (PC2) inflow and outflow
(Section 2.3). Orbitrap-MS was conducted on composite samples from
replicate Series A and B (Figure 1). Error bars indicate ± one standard
deviation. NAFC classes with relative abundance <1% at all positions in the
hybrid pilot-scale CWTS were not included in this graph. ........................... 99
Page 14
xiii
List of Figures (continued)
Figure Page
Chapter III
Figure 4. A) Change in concentration of NAs relative to nominal hydraulic retention time
(HRT) during three sampling periods in hybrid constructed wetland (HCW)
Series A. B) Change in NA concentration in HCW Series B. C) Change in
concentration of NAFCs in composite samples from HCW Series A and B
(Section 2.3). NAFC concentrations were measured by Orbitrap mass
spectrometry in Dr. John Headley’s laboratory at the National Hydrology
Research Centre in Saskatoon, SK, and NA concentrations were measured by
derivatization and HPLC. ............................................................................ 100
Figure 5. A) NAFC and NA concentrations averaged over three sampling periods in
hybrid constructed wetland (HCW) and polishing photocatalytic reactor (PC2)
Series A and B. B) Mean NAFC and NA concentrations adjusted for volumes
lost to evapotranspiration in HCW and PC2 Series A and B (Section 2.4; Eqn.
3). NAFC concentrations were determined by Orbitrap mass spectrometry of
composite samples from Series A and B (Section 2.3), and NA concentrations
were measured by derivatization and HPLC in samples from each series.
Concentrations were measured in HCW and PC2 inflows (Inflow and PC2 In,
respectively) and outflows (WC5 and PC2 Out, respectively). Error bars are
one standard deviation (n=3)....................................................................... 100
Figure S1. Mean hydrosoil oxidation reduction potential (ORP) in wetland cells of
hybrid constructed wetland Series A and B. ORP measured at probes inserted
15 cm deep in hydrosoil. Error bars represent one standard deviation (n=5).123
Figure S2. Mean green shoot density in wetland cells of hybrid constructed wetland
Series A and B. Daily mean water temperature at sediment-water interface in
wetland cell B3. Error bars represent one standard deviation (n=5). .......... 123
Figure S3. A) Mean concentrations of arsenic measured in hybrid constructed wetland
(HCW) Series A and B during three sampling periods. B) Mean zinc
concentrations measured in HCW Series A and B. Dotted lines represent water
quality guidelines for As and Zn (0.005 and 0.03 mg/L, respectively; CCME,
2011). Error bars represent one standard deviation. ................................... 123
Page 15
1
CHAPTER I
INTRODUCTION
The Athabasca Oil Sands (AOS) of northern Alberta, Canada are the third largest
petroleum deposit in the world (AER, 2012; Hein et al., 2013). Bitumen, a highly viscous
and heavily degraded oil (Hein et al., 2013), is recovered from surface mined ore through
an alkaline extraction process that produces liquid tailings called oil sands process-
affected water (OSPW). Continued production of this impaired water combined with a
ban on the release of liquid tailings by the Alberta Environmental Protection and
Enhancement Act have caused 800-1,000 million m3 of OSPW to accumulate in tailings
ponds across the AOS (Madill et al., 2001; Mikula, 2013). Refractory naphthenic acid
fraction compounds (NAFCs), which include a complex mixture of alkyl-substituted
cylcoaliphatic carboxylic acids traditionally called naphthenic acids (NAs), are the
predominant source of toxicity in OSPW (MacKinnon and Boerger, 1986; Verbeek,
1994; Marentette et al., 2015a,b; Morandi et al., 2015; McQueen et al., 2017a). Ultrahigh
resolution mass spectrometry (UHRMS) has confirmed that NAFCs are also composed of
poly-oxygenated species as well as nitrogen and sulfur heteroatom classes (Grewer et al.,
2010; Headley et al., 2012). OSPW also contains metals, metalloids, residual
hydrocarbons, and suspended and dissolved solids in concentrations exceeding protective
water quality criteria (Allen, 2008a; Mahaffey and Dube, 2016; McQueen et al., 2017a).
The government of Alberta’s tailings management framework is implemented by
Directive 085 (AER, 2016), which mandates that liquid tailings (OSPW) must be treated
progressively and ready to reclaim within 10 years of oil sands mine closure. Oil sands
Page 16
2
operators are seeking passive approaches for treating large volumes of OSPW to comply
with this directive (COSIA, 2015).
Specifically designed constructed wetland treatment systems (CWTSs) have
successfully remediated impaired waters containing complex mixtures of constituents,
including refinery effluents and oil field produced waters (Gillespie et al., 2000;
Huddleston et al., 2000; Murray-Gulde et al., 2003). These versatile systems support a
diverse array of reactions, including biodegradation, photolysis, precipitation, oxidation,
reduction, and sorption (Reddy and DeLaune, 2008; Rodgers and Castle, 2008; Vymazal,
2010), and may be constructed and operated at lower cost than conventional water
treatment systems (Halverson et al., 2004; Mooney and Murray-Gulde, 2008). By
promoting aerobic biodegradation, wetland sediment microcosms decreased NA
concentrations (Toor et al., 2013), hydroponic treatments with macrophytes decreased
toxicity of OSPW (Armstrong et al., 2009), and pilot-scale CWTSs eliminated acute
toxicity of OSPW to Ceriodaphnia dubia (McQueen et al., 2017b). Treatment of NAFCs
in CWTSs may be augmented by implementing an advanced oxidation process as a
hybrid component (McQueen et al., 2017b). Photocatalysis over TiO2 is a potent
advanced oxidation process that generates reactive radical species in the presence of
water and ultraviolet (UV) radiation (<400 nm; Fujishima et al., 2000). Bench-scale
experiments demonstrate that solar photocatalysis over TiO2 slurries can decrease
concentration and change composition of NAFCs in OSPW (Leshuk et al., 2017). In this
research, fixed-film photocatalytic reactors were implemented into a hybrid pilot-scale
CWTS to enhance degradation and transformation of NAFCs in a specific OSPW.
Page 17
3
To meet the goal of implementing hybrid CWTSs for remediation of OSPW,
fundamental questions must be answered concerning the ability of film-based
photocatalysis to treat NAFCs in OSPW and the performance of hybrid pilot-scale
CWTSs for OSPW. The major objectives of this research were to 1) measure rates and
extents of NA degradation and responses of sentinel aquatic organisms in OSPW treated
by solar photocatalysis over settled-TiO2, and 2) measure performance of a hybrid pilot-
scale CWTS treating a specific OSPW.
Measure rates and extents of NA degradation and responses of sentinel aquatic
organisms in OSPW treated by solar photocatalysis over settled-TiO2
This research assessed the feasibility of using film-based solar TiO2
photocatalysis to decrease concentrations of NAs in OSPW and subsequently decrease
toxicity of this complex mixture. This goal was achieved by completing the following
objectives:
1. measure absorption and attenuation of UV radiation in a specific OSPW;
2. measure rates and extents of NA degradation with respect to UV insolation in
settled TiO2 photocatalytic reactors treating the OSPW; and
3. compare survival and reproduction of Ceriodaphnia dubia and survival and
biomass of Pimephales promelas exposed to the OSPW before and after
treatment.
Measure performance of a hybrid pilot-scale CWTS treating a specific OSPW
The aim of this research was to measure biogeochemical conditions and treatment
performance, in terms of changes in toxicity and COC concentration and composition, in
Page 18
4
a hybrid pilot-scale CWTS treating a specific OSPW. To achieve this overall objective,
specific objectives were to:
1) characterize OSPW treated by a hybrid pilot-scale CWTS for identification of
COCs;
2) assemble and operate a hybrid pilot-scale constructed wetland for treatment of
the OSPW;
3) analyze changes in NAFC concentration and class distribution measured by
UHRMS in Dr. John Headley’s laboratory at the Environment and Climate
Change Canada National Hydrology Research Center; and
4) measure changes in concentration of COCs and survival and reproduction of
Ceriodaphnia dubia.
Thesis Organization
This thesis is organized into four chapters including the introduction (Chapter I)
and conclusions (Chapter IV). Chapters II and III are written as independent manuscripts;
therefore, some content may be repeated in the chapters. The manuscripts are:
Chapter II: Solar Photocatalysis of an Oil Sands Process-Affected Water over
Settled TiO2;
Chapter III: A Hybrid Pilot-Scale Constructed Wetland Treatment System for
Remediation of an Oil Sands Process-affected Water.
These manuscripts provide proof of concepts for film-based photocatalysis of
OSPW and for implementing this technology into hybrid pilot-scale constructed wetlands
treating OSPW.
Page 19
5
References
Ajaero, C., McMartin, D.W., Peru, K.M., Bailey, J., Haakensen, M., Friesen, V., Martz,
R., Hughes, S.A., Brown, C., Chen, H., McKenna, A.M., 2017.
Fourier Transform Ion Cyclotron Resonance Mass Spectrometry Characterization
of Athabasca Oil Sand Process-Affected Waters Incubated in the Presence of
Wetland Plants. Energy & Fuels. 31(2), 1731-1740.
Alberta Energy Regulator (AER), 2016. Fluid Tailings Management for Oil Sands
Mining Projects. Oil Sands Conservation Act Directive 085. Alberta Energy
Regulator, Calgary, AB. https://www.aer.ca/documents/directives/
Directive085.pdf.
Allen, E.W., 2008. Process water treatment in Canada’s oil sands industry: I. Target
pollutants and treatment objectives. Journal of Environmental Engineering and
Science. 7, 123-138.
Armstrong, S.A., Headley, J.V., Peru, K.M., Germida, J.J., 2009. Differences in
phytotoxicity and dissipation between ionized and nonionized oil sands
naphthenic acids in wetland plants. Environmental Toxicology and Chemistry. 28,
2167-2174.
Canada's Oil Sands Innovation Alliance (COSIA), 2015. Passive Organics Treatment
Technology. Canada's Oil Sands Innovation Alliance, Calgary, AB.
http://www.cosia.ca/uploads/files/challenges/water/COSIA%20
Challenge%20Water%20-%20Passive%20Organics%20Treatment
%20Technology.pdf
Fujishima, A., Rao, T.N., Tryk, D.A., 2000. Titanium dioxide photocatalysis. Journal of
Photochemistry and Photobiology C: Photochemistry Reviews. 1, 1-21.
Gillespie, W.B., Hawkins, W.B., Rodgers, J.H., Cano, M.L., Dorn, P.B., 2000. Transfers
and transformations of zinc in constructed wetlands: Mitigation of a refinery
effluent. Ecological Engineering. 14, 279-292.
Grewer, D.M., Young, R.F., Whittal, R.M., Fedorak, P.M., 2010. Naphthenic acids and
other acid-extractables in water samples from Alberta: what is being measured?
Science of the Total Environment. 408, 5997-6010.
Halverson, N.V., 2004. Review of Constructed Subsurface Flow vs. Surface Flow
Wetlands. Westinghouse Savannah River Company, Aiken, SC, Prepared for US
Department of Energy (DOE). DOE Contract number: WSRC-TR-2004-00509.
US DOE, Washington, DC.
Headley, J.V., Peru, K.M., Fahlman, B., McMartin, D.W., Mapolelo, M.M., Rodgers,
R.P., Marshall, A.G., 2012. Comparison of the levels of chloride ions to the
characterization of oil sands polar organics in natural waters by use of Fourier
transform ion cyclotron resonance mass spectrometry. Energy & Fuels, 26(5),
2585-2590.
Page 20
6
Hein, F.J., Leckie, D., Larter, S., Suter, J.R., 2013. Heavy oil and bitumen petroleum
systems in Alberta and beyond: The future is nonconventional and the future is
now. In: Hein, F.J., Leckie, D., Larter, S., Suter, J.R. (Eds.). Heavy-Oil and Oil-
Sand Petroleum Systems in Alberta and Beyond. AAPG Studies in Geology. 64: 1,
1-21. American Association of Petroleum Geologists (AAPG) Special Volumes.
Huddleston, G.M., Gillespie, W.B., Rodgers, J.H., 2000. Using constructed wetlands to
treat biochemical oxygen demand and ammonia associated with a refinery
effluent. Ecotoxicology and Environmental Safety. 45, 188-193.
Leshuk, T., Wong, T., Linley, S., Peru, K.M., Headley, J.V., Gu, F., 2016. Solar
photocatalytic degradation of naphthenic acids in oil sands process-affected water.
Chemosphere. 144, 1854-1861.
MacKinnon, M.D. and Boerger, H., 1986. Description of two treatment methods for
detoxifying oil sands tailings pond water. Water Quality Research Journal of
Canada. 21, 496-512.
Madill, R.E., Orzechowski, M.T., Chen, G., Brownlee, B.G., Bunce, N.J., 2001.
Preliminary risk assessment of the wet landscape option for reclamation of oil
sands mine tailings: bioassays with mature fine tailings pore water.
Environmental Toxicology. 16, 197-208.
Mahaffey, A., and Dubé, M., 2016. Review of the composition and toxicity of oil sands
process-affected water. Environmental Reviews. 25, 97-114.
Marentette, J.R., Frank, R.A., Bartlett, A.J., Gillis, P.L., Hewitt, L.M., Peru, K.M.,
Headley, J.V., Brunswick, P., Shang, D., Parrott, J.L., 2015. Toxicity of
naphthenic acid fraction components extracted from fresh and aged oil sands
process-affected waters, and commercial naphthenic acid mixtures, to fathead
minnow (Pimephales promelas) embryos. Aquatic Toxicology. 164, 108-117.
Marentette, J.R., Frank, R.A., Hewitt, L.M., Gillis, P.L., Bartlett, A.J., Brunswick, P.,
Shang, D., Parrott, J.L., 2015. Sensitivity of walleye (Sander vitreus) and fathead
minnow (Pimephales promelas) early-life stages to naphthenic acid fraction
components extracted from fresh oil sands process-affected waters.
Environmental Pollution. 207, 59-67.
McQueen, A.D., Kinley, C.M., Hendrikse, M., Gaspari, D.P., Calomeni, A.J., Iwinski,
K.J., Castle, J.W., Haakensen, M.C., Peru, K.M., Headley, J.V., 2017a. A risk-
based approach for identifying constituents of concern in oil sands process-
affected water from the Athabasca Oil Sands region. Chemosphere. 173, 340-350.
McQueen, A.D., Hendrikse, M., Gaspari, D.P., Kinley, C.M., Rodgers, J.H., Castle, J.W.,
2017b. Performance of a hybrid pilot-scale constructed wetland system for
treating oil sands process-affected water from the Athabasca oil sands. Ecological
Engineering. 102, 152-165.
Page 21
7
Mikula, R., 2013. Trading water for oil: Tailings management and water use in surface-
mined oil sands. In: Hein, F.J., Leckie, D., Larter, S., Suter, J.R. (Eds.). Heavy Oil
and Oil-Sand Petroleum Systems in Alberta and Beyond. AAPG Studies in
Geology 64: 1, 689-699. American Association of Petroleum Geologists (AAPG)
Special Volumes.
Mooney, F.D., and Murray-Gulde, C., 2008. Constructed treatment wetlands for flue gas
desulfurization waters: Full-scale design, construction issues, and performance.
Environmental Geosciences. 15, 131-141.
Morandi, G.D., Wiseman, S.B., Pereira, A., Mankidy, R., Gault, I.G., Martin, J.W.,
Giesy, J.P., 2015. Effects-directed analysis of dissolved organic compounds in oil
sands process-affected water. Environmental Science & Technology. 49, 12395-
12404.
Murray-Gulde, C., Heatley, J.E., Karanfil, T., Rodgers, J.H., Myers, J.E., 2003.
Performance of a hybrid reverse osmosis-constructed wetland treatment system
for brackish oil field produced water. Water Research. 37, 705-713.
Reddy, K.R., and DeLaune, R.D., 2008. Biogeochemistry of wetlands: science and
applications. CRC Press, Boca Raton, FL.
Rodgers Jr, J.H., Castle, J.W., 2008. Constructed wetland systems for efficient and
effective treatment of contaminated waters for reuse. Environmental Geosciences.
15, 1-8.
Toor, N.S., Franz, E.D., Fedorak, P.M., MacKinnon, M.D., Liber, K., 2013. Degradation
and aquatic toxicity of naphthenic acids in oil sands process-affected waters using
simulated wetlands. Chemosphere. 90, 449-458.
Verbeek, A.G., 1994. A toxicity assessment of oil sands wastewater. University of
Alberta, Edmonton, AB. Master's Thesis.
Vymazal, J., 2010. Constructed wetlands for wastewater treatment: five decades of
experience. Environmental Science & Technology. 45, 61-69.
Page 22
8
CHAPTER II
SOLAR PHOTOCATALYSIS OF AN OIL SANDS PROCESS-AFFECTED WATER
OVER SETTLED TiO2
Abstract
Extensive volumes of oil sands process-affected waters (OSPWs) containing a
complex mixture of toxic and refractory organics, consisting largely of naphthenic acids
(NAs), are stored in tailings ponds on mining leases in the Athabasca Oil Sands. Film-
based solar photocatalysis over TiO2 was evaluated as a passive method for degrading
NAs and decreasing toxicity of OSPW. The primary objective of this study was to
measure rates and extents of NA degradation and responses of sentinel aquatic organisms
in a specific OSPW treated by solar photocatalysis over settled-TiO2. Photocatalytic
reactors consisted of thin films (~0.5 mm) of TiO2 settled in OSPW. OSPW without TiO2
was irradiated by sunlight in photolytic reactors, and dark control reactors accounted for
sorption or aerobic degradation of NAs. Rates and extents of changes in NA mass and
concentration were calculated with respect to cumulative solar UV radiation (UV
insolation) and photoperiod. Photocatalysis over settled TiO2 decreased NA concentration
by an average of 37% after 1.78 MJ·m-2 UV insolation accumulated over a 16-h
photoperiod and decreased NA mass by 86% after 3.57 MJ·m-2 UV insolation (32-h
photoperiod). In photocatalytic reactors, removal of NA mass as functions of UV
insolation and photoperiod was modeled using first-order rate kinetics with 50%
degradation occurring at 1.1±0.2 MJ·m-2 and 10.2±0.8 h of sunlight exposure. Photolysis
decreased NA mass by 39% after 32 h of sunlight exposure and 3.57 MJ·m-2, but
Page 23
9
increased NA concentration by 59±9% after a 16-h photoperiod because evaporative
volume loss outpaced mass removal. Compared to a laboratory control, OSPW adversely
affected C. dubia survival and reproduction. Toxicity was eliminated after treatment in
photocatalytic, photolytic, and dark control reactors. Removal of NA mass and
concentration in the settled TiO2 reactors provides a proof of concept for film-based solar
photocatalysis. Further experimentation with flow-through fixed-film reactors is
warranted to improve performance of film-based TiO2 photocatalysis for treatment of
OSPW.
1.0 Introduction
The oil sands of northern Alberta, Canada are the third largest petroleum deposit
in the world (AER, 2012; Hein et al., 2013). Oil sands ore is surface mined and bitumen
is recovered through an alkaline extraction process, which produces liquid tailings called
oil sands process-affected water (OSPW). Continued production of this impaired water
combined with prohibition on liquid tailings release by the Alberta Environmental
Protection and Enhancement Act and lack of scalable treatment technologies have caused
800-1,000 million m3 of OSPW to accumulate in tailings ponds (Madill et al., 2001;
Mikula, 2013; Quinlan and Tam, 2015). OSPW is a complex effluent containing
suspended sediments, dissolved salts, metals, metalloids, and an organic fraction
predominantly composed of naphthenic acids and residual bitumen (Allen, 2008).
Naphthenic acids (NAs) are considered the most problematic constituent in
OSPW (MacKinnon and Boerger, 1986), as they have adversely affected aquatic
invertebrates (Bartlett et al., 2017), fish (Kavanagh et al., 2011), macrophytes (Armstrong
Page 24
10
et al., 2008), and mammals (Rogers et al., 2002), and are recalcitrant to biodegradation,
with estimated degradation half-lives of 13-14 years in tailings ponds (Han et al., 2009).
NAs are a complex mixture of thousands of alkyl-substituted cylcoaliphatic carboxylic
acids traditionally defined by the formula CnH2n+ZO2, where n is the number of carbon
atoms and Z is the hydrogen deficiency (Brient et al., 1995; Headley and McMartin,
2004; Clemente and Fedorak, 2005). Ultrahigh-resolution mass spectrometry of OSPW
organics has identified compounds with structures that do not conform to the “classical”
NA formula, including aromatic (Mohamed et al., 2008), diamondoid (Rowland et al.,
2011), heteroatomic (Mohamed et al., 2008), and poly-oxygenated species (Barrow et al.,
2009; Martin et al., 2009). Grewer et al. (2010) found that <50% of compounds in
extracts of OSPW were classical NAs, and Headley et al. (2012) submitted the term
naphthenic acid fraction compounds (NAFCs) to more accurately describe this group.
NAFCs having greater cyclicity, carbon number, and alkyl branching are increasingly
resistant to biodegradation (Scott et al., 2005; Han et al., 2008; Toor et al., 2013) and
require more robust treatment methods to decrease concentration and alter composition.
Advanced oxidation processes, such as ozonation (Scott et al., 2008; Hwang et al.,
2013) and persulfate and permanganate oxidation (Drzewicz et al., 2012; Soharbi et al.,
2013), have decreased NAs concentrations and may increase the biodegradability of
residual NAs (Martin et al., 2009). Solar photocatalysis over TiO2 is a potent advanced
oxidation process that generates highly reactive radical species, such as hydroxyl radicals
(+2.27 V) and superoxide anions (-0.52 V), in the presence of water and ultraviolet (UV)
radiation (<400 nm; Fujishima et al., 2000). Degussa® and Aeroxide® P25 are blends of
Page 25
11
TiO2 polymorphs (~70% anatase, ~30% rutile) that are widely used due to their low cost,
low toxicity, high photoreactivity, and chemical stability (Gaya and Abudulla, 2008;
Malato et al., 2009). TiO2 photocatalysis driven by solar radiation has degraded an array
of recalcitrant organic compounds, including pharmaceuticals, polycyclic aromatic
hydrocarbons, and NAs (Headley et al., 2009; Malato et al., 2009; Chong et al., 2010). In
a bench-scale study, Leshuk et al. (2016) utilized solar photocatalysis of OSPW over an
agitated TiO2 slurry to remove >98% of NAFCs over 14 h of sunlight exposure. Slurry
photocatalysis requires vigorous mixing and post-treatment recovery of TiO2 by
microfiltration (Malato et al., 2009). These energy intensive steps impede the
commercialization of this processes (Chong et al., 2010) and may preclude this
technology from implementation at scales required for treating OSPW. TiO2 fixed-films
may provide a low-energy method for implementing solar photocatalysis, as they
eliminate catalyst recovery and mixing (Malato et al., 2009; Zayani et al., 2009).
McQueen et al. (2016) utilized fixed-film photocatalysis to decrease concentrations of a
commercial NA blend (Fluka NAs) by >92% and eliminate acute toxicity to Daphnia
magna and Pimephales promelas. To date, no investigations of photocatalytic
degradation of NAs in OSPW have used film-based TiO2, assessed performance using
sentinel aquatic organisms, or measured rates and extents of NA degradation with respect
to cumulative solar UV radiation (UV insolation; McMartin et al., 2004; Headley et al.,
2009; Mishra et al., 2010; Leshuk et al., 2016a,b).
To investigate the feasibility of film-based photocatalysis as a method for
degrading NAs and decreasing acute OSPW toxicity, settled layers of TiO2 were used in
Page 26
12
place of immobilized catalysts for treatment of a specific OSPW. Settled TiO2 is
functionally similar to fixed-films because UV radiation is attenuated before activating
catalysts (Malato et al., 2009). Attenuation of UV radiation decreases efficiency of film-
based photocatalytic reactors (Malato et al., 2009; Zayani et al., 2009) necessitating
characterization of attenuation and absorption of UV radiation (250 to 400 nm) by
constituents in OSPW. This research is a first-order demonstration of film-based
photocatalysis of OSPW to determine rates and extents of NA concentration and mass
removal in bench-scale batch reactors.
The overall objective of this research was to measure rates and extents of NA
degradation and responses of sentinel aquatic organisms in OSPW treated by solar
photocatalysis over settled-TiO2. Specific objectives were to: 1) measure absorption and
attenuation of UV radiation in the OSPW, 2) measure rates and extents of NA
degradation with respect to UV insolation in settled TiO2 photocatalytic reactors treating
the OSPW, and 3) compare survival and reproduction of Ceriodaphnia dubia and
survival and biomass of Pimephales promelas exposed to the OSPW before and after
treatment.
2.0 Materials and Methods
2.1 OSPW Source
In November 2015, ~40,000 L of OSPW was collected from the clarified zone of
an external tailings facility in northern Alberta, Canada and shipped to Clemson
University. The OSPW was stored outdoors in 3,875 L polypropylene storage tanks and a
Page 27
13
~20,000 L tanker trailer. OSPW used in photocatalysis experiments was collected from a
storage tank after being mixed for 24 h by a 0.56 kW (0.75 HP) submersible pump.
2.2 Absorption and attenuation of UV radiation in OSPW
The absorption of UV radiation by OSPW was measured using a SpectraMax®M2
spectrophotometer (Molecular Devices Corp.; Sunnyvale, CA) in quartz cuvettes with a 1
cm pathlength. Absorbance (A) was measured from 250 to 400 nm and converted to
transmittance (T) using Eqn. 1:
𝑇 = 10−(𝐴−𝐴𝑜) (1)
where Ao is the absorbance of a quartz cuvette with NANOpure® water.
UV irradiance was measured with an Apogee Instruments Inc. SU-100 broadband
UV sensor (Logon, UT; spectral range 250 to 400 nm) connected to a HOBO UX120-
006M data logger (Onset; Bourne, MA). The sensor was placed in a waterproof housing
constructed from polyvinyl chloride (PVC) pipes and joints, a quartz disk, and silicone
caulk (GE Silicone I). This device was used to measure relative differences in UV
irradiance, but could not determine absolute values of irradiance because the quartz glass
cover altered the sensor’s spectral response. The device was secured to the side of a
leveled, 20-L polyethylene bucket filled with OSPW and was used to measure UV
irradiance between depths of 0 to 20 cm at 1-3 cm intervals. UV attenuation experiments
were conducted in Clemson, SC on cloudless days in October 2016. Total suspended
solids (TSS) were measured as explanatory parameters for UV attenuation in OSPW
according to methods 2130B and 2540D, respectively (APHA, 2012).
Page 28
14
The Beer-Lambert Law states that UV irradiance attenuates exponentially with
increased depth in a medium (Eqn. 2):
𝐼 = 𝐼𝑜𝑒−µ𝑧 (2)
where I is UV irradiance (W·m-2·s-1), Io is incident UV irradiance (W·m-2·s-1), µ is the
attenuation coefficient (cm-1), and z is depth (cm). This relationship can be expressed in
terms of transmittance and transformed to a linear function (Eqns. 3, 4):
𝑇 =𝐼
𝐼𝑜= 𝑒−µ𝑧 (3)
−𝑙𝑛 𝑇 = µ𝑧 (4)
Linear regression through the origin (RTO) of depth and natural logarithm transmittance
produced a strong correlation (r2 = 0.997) supporting that the device was suitable to
measure UV attenuation in OSPW. After verifying this method, UV irradiance was
measured at the surface and then immediately at depth in OSPW, and attenuation
coefficients were calculated (Eqn. 5):
µ = −𝑙𝑛(𝐼/𝐼𝑜) /𝑧 (5)
2.3 Rates and extents of naphthenic acid removal
2.3.1 Photoreactor assembly and experimental design
The experimental design included photocatalytic, photolytic, and dark control
reactors with three independent replicates for each reactor type. Photocatalytic reactors
were assembled in leveled 59x59x4.5 cm laboratory-grade fiberglass trays (MFG Tray
Company; Linesville, PA) by pouring 3.48 L suspensions of 1,000 mg/L TiO2
(AeroxideTM P25; Fisher Scientific, Fair Lawn, NJ) in OSPW. This same method was
Page 29
15
followed to make dark control reactors, which used opaque high-density polyethylene
(HDPE) covers to block sunlight. TiO2 in the photocatalytic and dark control reactors
aggregated and settled out of suspension rapidly, forming ~0.5 mm thick layers of
catalyst on the bottom surface of the trays. Transmittance of samples collected 0.5 and 2
h after TiO2/OSPW suspensions were poured into the photocatalytic reactors was
measured to assess settling. Photolytic reactors consisted of fiberglass trays containing
OSPW exposed to sunlight without TiO2. Depth of OSPW in all reactors was 1 cm. The
experiment was conducted from February 27, 2016 to March 1, 2016 on a roof receiving
direct sunlight (34° 40' 27.25'' N, 82° 50' 7.46'' W). HDPE covers were placed on all
reactors between ~6:00 PM and 9:00 AM each day of the experiment.
To measure changes in NA concentration during the experiment, 10 mL samples
were pipetted from the water column of each reactor and stored in 15 mL glass vessels.
Conductivity, dissolved oxygen, and pH were measured in situ at each sampling event
(Table S1). Conductivity and pH were measured using an Orion Star A221 portable meter
(Thermo Fisher Scientific, Waltham, MA) equipped with a 9157BNMD Triode pH probe
and a 013010MD conductivity cell. DO was measured using a HQ30d meter with a
LDO101 optical dissolved oxygen probe (HACH; Loveland, CO). Water temperature and
depth were measured at each sampling event. Ambient temperature data were collected
from a proximal weather station (Weather Underground, 2016; N 34° 40' 48'', W 82° 49'
55''). Incident UV irradiance (W·m-2) was measured throughout the experiment using a
SU-100 UV sensor (without waterproof housing). Irradiance data were collected using a
UX120-006M data logger and integrated to UV insolation (MJ·m2) using Simpson’s rule.
Page 30
16
As the experiment progressed, volumes in the photocatalytic and photolytic
reactors decreased due to evaporation. To maintain a water depth of 1 cm and preserve
volume for chemical analyses and bioassays, photocatalytic and photolytic reactors were
reconstituted to initial volumes (3.48 L) after 16, 24, and 32 h of sunlight exposure.
Reconstitution was performed by collecting and measuring volumes of TiO2/OSPW
suspensions and OSPW in the photocatalytic and photolytic reactors and replacing
evaporated volumes with NANOpure® water. After reconstitution, TiO2/OSPW
suspensions were poured back into trays and settled overnight. The covered dark controls
lost <18% volume to evaporation and were not reconstituted.
2.3.2 Chemical analysis
Naphthenic acids concentrations were quantified using derivatization and high
performance liquid chromatography (HPLC) methods modified from Yen et al. (2004). In
this method, 2-nitrophenolhydrazine is derivatized to nitrophenolhydrazide by naphthenic
acids. Samples were derivatized in 2.0 mL glass HPLC vials, and concentrations were
measured using a Dionex UltiMate-3000 HPLC (Sunnyvale, CA) equipped with an
Agilent LiChrospher 100 RP-18 column (5 µm particle size, 125mm x 4 mm) and a guard
column containing 2 µm RP-18 solid phase material. Column temperature was fixed at
40°C. Samples were mobilized with HPLC grade methanol (Fisher Scientific, Fair Lawn,
NJ) at a flow rate of 60 µL·min-1. Absorbance of naphthenic acid derivatives was
measured at 400 nm. Chromatograms were integrated using a baseline hold between
retention times of 2.9 and 6 min, and integrated areas were used to calculate NA
concentration. Quantification of NA concentrations was performed using a 5-point
Page 31
17
calibration curve of nominal concentrations of a commercial NA blend (Fluka NAs;
Sigma-Aldrich; St. Louis, MO). All samples and standards analyzed by derivatization and
HPLC were divided into pseudo-replicates, and NA concentrations were expressed as
means of pseudo-replicates (n=3). Fluka NA standards were made from serial dilution of
a water accommodated fraction (WAF) containing 140 mg/L NAs. WAFs were mixed for
24±4 h in 1-L volumetric flasks using magnetic stirrers producing vortices extending to
30-50% of the solution depth (OECD, 2002).
Biochemical oxygen demand (BOD) and chemical oxygen demand (COD) were
measured in OSPW before and after treatment by photocatalysis. PolySeed® (InterLab;
Spring, TX) was used to inoculate samples in BOD experiments. Alkalinity, BOD, COD,
hardness, total suspended solids (TSS), and total dissolved solids (TDS) were measured
in all reactors according to Standard Methods for Examination of Water and Wastewater
(APHA, 2012; Table S1). Concentrations of oil and grease (O&G) were measured in
untreated OSPW according to USEPA method 1664A (USEPA, 1999). Concentrations of
acid soluble Al, B, Ca, Cl, Cu, Fe, Mg, Mn, P, Na, and Zn were determined by
inductively coupled plasma-atomic emission spectroscopy (ICP-AES) using EPA method
200.7 (USEPA, 2001). ICP-AES analysis was conducted at Clemson University’s
Agricultural Services Laboratory.
2.3.3 Calculating naphthenic acid removal rates and efficiencies
NA degradation in photocatalytic and photolytic reactors was assessed by
calculating rates of change in concentration and mass as functions of UV insolation and
photoperiod. First order rate kinetics was used to model decreases in NA concentration in
Page 32
18
the photocatalytic reactors with respect to UV insolation and photoperiod. The first-order
rate equation was arranged so that rate coefficients were calculated as slopes of trend
lines determined by linear RTO of natural log transformed NA concentrations and UV
insolation or photoperiod (Eqn. 6, 7):
𝑙𝑛(𝐶𝑖/𝐶𝑜) = − 𝑘𝐸𝑐𝐸𝑖 (6)
𝑙𝑛(𝐶𝑖/𝐶𝑜) = − 𝑘𝑡𝑐𝑡𝑖 (7)
Where Ci is naphthenic acid concentration (mg/L), Co is initial naphthenic acid
concentration (mg/L), Ei is UV insolation (MJ·m-2), ti is photoperiod (h), and 𝑘𝐸𝑐 and 𝑘𝑡𝑐
are rate coefficients for change in NA concentration as functions of UV insolation
(m2·MJ-1) and photoperiod (h-1), respectively. Rate coefficients were used to calculate
NA degradation half-lives in terms of UV insolation and photoperiod (Eqn. 8, 9):
𝑇0.5𝐸𝑐 = −𝑙𝑛(0.5)/𝑘𝐸𝑐 (8)
𝑇0.5t𝑐 = −𝑙𝑛(0.5)/𝑘𝑡𝑐 (9)
Where 𝑇0.5𝐸𝑐 and 𝑇0.5t𝑐 are degradation half-lives for NA concentration as functions of
UV insolation (MJ·m-2) and photoperiod (h), respectively. Removal efficiencies (%) for
NA concentration were calculated using Eqn. 10:
RemovalEfficiency(%) = (𝐶𝑜 − 𝐶𝑖)/𝐶𝑜 · 100 (10)
Rate coefficients, half-lives, and removal efficiencies for NA concentration removal were
calculated at the midpoint of the experiment when photocatalytic reactors were
reconstituted after a photoperiod of 16 h and 1.79 MJ·m-2 UV insolation.
Page 33
19
Volumes of OSPW in photocatalytic and photolytic reactors were not measured
prior to reconstitution at the experiment midpoint. To estimate volume and calculate NA
mass prior to reconstitution, UV insolation was correlated with evaporated volumes
measured in the photocatalytic and photolytic reactors at t = 0, 16, 24, 32 h. Linear
regression showed a strong correlation between UV insolation and cumulative evaporated
volume (R2 = 0.99). The slope of this regression line (β; 1.08 L·m2·MJ-1) was multiplied
by UV insolation (Ei; MJ·m2) to estimate evaporated volume (VE; L; Eqn. 11).
𝑉𝐸 = 𝐸𝑖𝛽 (11)
This model predicted measured evaporated volumes within 5.1% and was substituted into
Eqn. 12 to calculate reactor volume (Vi; L):
𝑉𝑖 = 𝑉𝑜 − 𝑉𝐸 − 𝑉𝑠 (12)
where Vo is initial volume of the reactor and Vs is the volume removed by sampling. Once
reactor volume was calculated, Eqn. 13 was used to determine NA mass.
𝑀𝑖 = 𝐶𝑖𝑉𝑖 (13)
where Mi is NA mass (mg). This equation was also used to calculate NA mass after the
experiment midpoint when volumes were measured directly.
NA mass removal was modeled by first-order rate kinetics. First-order rate
coefficients were calculated by linear RTO of natural log transformed NA mass and UV
insolation or photoperiod (Eqn. 14, 15):
𝑙𝑛(𝑀𝑖/𝑀𝑜) = − 𝑘𝐸𝑚𝐸𝑖 (14)
Page 34
20
𝑙𝑛(𝑀𝑖/𝑀𝑜) = − 𝑘𝑡𝑚𝑡𝑖 (15)
Where Mo is initial naphthenic acid mass and 𝑘𝐸𝑚 and 𝑘𝑡𝑚 are rate coefficients for
change in NA mass as functions of UV insolation (m2·MJ-1) and photoperiod (h-1),
respectively. UV insolation and photoperiod half-lives for NA mass removal were
calculated using rate coefficients (Eqn. 16, 17).
𝑇0.5𝐸𝑚 = −𝑙𝑛(0.5)/𝑘𝐸𝑚 (16)
𝑇0.5t𝑚 = −𝑙𝑛(0.5)/𝑘𝑡𝑚 (17)
Where 𝑇0.5𝐸𝑚 and 𝑇0.5𝑡𝑚 are degradation half-lives for NA mass with respect to UV
insolation (MJ·m-2) and photoperiod (h), respectively. Removal efficiencies (%) for NA
mass were calculated using Eqn. 18:
RemovalEfficiency(%) = (𝑀𝑜 −𝑀𝑖)/𝑀𝑜 · 100 (18)
2.4 Toxicity Testing
Photocatalytic, photolytic, and dark control reactors were assessed for their ability
to alter exposures of OSPW to Pimephales promelas and Ceriodaphnia dubia. These
organisms were selected for toxicity testing because they occur in freshwaters across the
United States and Canada (Scott and Crossman, 1973; Pennak, 1978; Carpenter et al.,
1985) and respond adversely to NAs in OSPW (Zubot et al., 2012; Marentette et al.,
2015b; Morandi et al., 2015). P. promelas larvae and C. dubia neonates, both <24h old,
were obtained from healthy cultures at the Clemson University Aquatic Animal Research
Laboratory. Procedures for measuring survival and growth of P. promelas and survival
and reproduction of C. dubia were adapted from Environment and Climate Change
Page 35
21
Canada (ECCC, 2007; ECCC, 2011) biological test methods. Single concentration tests
were conducted, where the presence or absence of toxicity was assessed by statistical
comparison to laboratory controls, which consisted of formulated moderately-hard water
(USEPA, 2002).
Reproduction of C. dubia and biomass of P. promelas were tested for normality
and homogeneity using Chi-square and Barlett’s tests, respectively. Differences between
normally distributed, homogenous data were determined by analysis of variance
(ANOVA) followed by many-to-one comparison of treatments (i.e. photocatalytic,
photolytic, and dark control reactors) to laboratory controls using Dunett’s test or by all-
possible pairwise comparisons via Tukey’s test. Quantal data, including the survival of C.
dubia and P. promelas, were compared with laboratory controls using Fisher’s exact test.
Differences were considered significant at p≤0.05. Statistical analyses were performed in
JMP (version 12.1; SAS Institute Inc.; Cary, NC, USA).
3.0 Results
3.1 Absorption and attenuation of UV radiation in OSPW
UV-C and UV-B (200-280 nm and 280-315 nm, respectively) radiation are more
strongly absorbed than UV-A radiation (315-400 nm; Figure 1) in OSPW. Transmittance
of UV-C and UV-B radiation in OSPW are <49% and 49 to 70%, respectively, and
transmittance increased by ~0.62%·nm-1 from 250 to 315 nm. By comparison,
transmittance of UV-A radiation in OSPW ranges from 70 to 88%, and increased by
~0.21%·nm-1 from 315 to 400 nm. When measured immediately following mixing, a
suspension of 0.01 g/L TiO2 in OSPW significantly decreased transmittance of UV
Page 36
22
radiation between 8 and 20% (250 to 400 nm, p<0.0001). However, TiO2 settled rapidly
after 1 g/L TiO2/OSPW slurries were poured in photocatalytic reactors. Mean
transmittance of a sample collected 0.5 h after TiO2/OSPW slurries were poured was
slightly less than OSPW without TiO2 (58±13% and 68±18%, respectively). After TiO2
had settled for 2 h, transmittance was equal or slightly greater than in OSPW without
TiO2.
The Beer-Lambert law accurately modeled UV light attenuation in OSPW (R2 =
0.997, 0.993; Eqn. 2). The mean attenuation coefficient (µ) for the OSPW used in this
experiment was -0.13±0.02 cm-1 (Figure 2). The UV attenuation device (Section 2.2)
determined that at a depth of 1 cm in OSPW, which is the same depth as the reactors, UV
irradiance decreased by 12%, and 50% of UV light energy was attenuated at 5.4 cm. To
assess the effect of TSS and O&G on attenuation of UV radiation in OSPW, an
experiment was conducted on OSPW with 69±11 mg/L TSS and 30 mg/L O&G. These
values of TSS and O&G approximately doubled the UV attenuation coefficient of OSPW
(µ =-0.28±0.02 cm-1). UV irradiance decreased by 25% at a depth of 1 cm in this turbid
OSPW and decreased by 50% at 2.5 cm.
3.2 Environmental conditions
Over the 82 h duration of the experiment (), photoperiod (tp) of the
photocatalytic and photolytic reactors was 32 h and UV insolation (E) was 3.57 MJ·m-2.
Solar UV irradiance ranged from 1.55 to 45.54 W·m-2 (Figure S1) when the
photocatalytic and photolytic reactors were uncovered and exposed to direct sunlight.
Over the 4 days and 3 nights that the experiment was conducted, ambient air temperature
Page 37
23
ranged from 0.5 to 23°C. Water temperature measured in the reactors during each
sampling event ranged from 8.6 and 17.7 °C (Table S2). Mean pH in the photocatalytic
reactors was 8.25±0.12, which was less than pH in the photolytic reactors or dark
controls (8.79±0.12 and 8.66±0.22, respectively). Mean DO in the photocatalytic reactors
was 9.40±1.48 mg/L, indicating that oxygen concentrations were near saturation.
Evaporation increased mean conductivity in photocatalytic and photolytic reactors
(2,638±584 and 2,589±568 µS/cm, respectively) relative to covered dark control reactors
(2,047±104 µS/cm).
3.3 Rates and extents of NA degradation
3.3.1 Photocatalysis
Initial mean NA concentration in the photocatalytic reactors was 89±7 mg/L. NA
concentrations in these reactors decreased by 36±6% to 57±6 mg/L after 1.78 MJ/m2 of
UV insolation, which occurred over an experimental duration of 32 h and a photoperiod
of 16 h (Table 1, Figure 3). Concentration data from each reactor (n=3) was plotted
against UV insolation using a first-order kinetic model, resulting in a mean rate
coefficient of -0.33±0.03 m2·MJ-1. Coefficients of determination (R2) for regression of the
first-order model ranged from 0.63 to 0.93. NA concentration decreased by 50% after
2.1±0.2 MJ·m-2 UV insolation (Eqn. 8). Decreases in NA concentration were measured
with photoperiod, and followed similar trends as NA degradation with respect to UV
insolation. The mean first-order rate coefficient for change in NA concentration with
photoperiod was -0.036±0.003 h-1 (R2 =0.67 to 0.94; Table 1), which resulted in a half-
life of 19±2 h of sunlight exposure (Eqn. 9).
Page 38
24
At the midpoint of the experiment (E=1.78 MJ/m2, t=16 h, =32 h), volumes in
the photocatalytic and photolytic reactors had decreased between 52 and 57% due to
evaporation. To continue the experiment, evaporated volumes were replaced with
Nanopure® water, and NA degradation was assessed in terms of mass removal. Initial
mean NA mass in the photocatalytic reactors was 310±16 mg (n=3). After 3.57 MJ·m-2
UV insolation, which accumulated over an experimental duration of 82 h and a
photoperiod of 32 h, NA mass decreased by 86±3% on average (n=3) to an extent of
44±11 mg (Table 1, Figure 4). Exponential regression of NA mass and UV insolation
showed a strong correlation (R2 = 0.87 to 0.98) supporting that mass removal by
photocatalysis conformed to first-order rate kinetics. The mean rate coefficient (Eqn. 14)
determined from regression of UV insolation and NA mass was -0.68±0.011 m2·MJ-1.
The UV insolation half-life for NA mass removal (Eqn. 16) supported the first-order
model, as it predicted correctly that 50% removal would occur after 1.1±0.2 MJ·m-2 UV
insolation (n=3). Mean NA mass calculated at 1.13 MJ·m-2 was 160±5 mg, a 49±4%
decrease from initial mass. The mean first-order rate coefficient for NA mass degradation
as a function of photoperiod was -0.07±0.01 h-1 (Eqn. 15; R2 =0.85 to 0.98), resulting in a
mean half-life of 10.0±1.6 h (Eqn. 17). NA mass in the reactors was 160±5 mg at 8.6 h of
sunlight exposure, supporting that photoperiod-based model accurately predicted NA
degradation in this experiment.
3.3.2 Photolysis and dark control
Initial NA concentrations in the photolytic reactors and dark controls were 92±13
and 89±7 mg/L on average (n=3), respectively. After 1.78 MJ·m-2 UV insolation
Page 39
25
accumulated over a photoperiod of 16 h, NA concentrations in the photolytic reactors
increased between 50 and 66%, resulting in a mean NA concentration of 146±7 mg/L
(Table 1, Figure 3). By the midpoint of the experiment (=32 h), NA concentrations had
increased significantly in the dark control reactors (110±6 mg/L; p=<0.0001); however,
conductivity was 1,981±51 µS/cm, which is not statistically different from initial
conductivity (1,949±5 µS/cm; p= 0.38), and volume decreased by <8.6% (<0.3 L). Figure
3 shows that in the dark controls most of the increase in NA concentrations between
experiment initiation and midpoint occurred from = 27 to 32 h (1.14 and 1.78 MJ·m-2).
These data suggest that the increase in NA concentrations measured in the dark controls
at the experiment midpoint was likely an artifact of derivatization.
OSPW volume in the photolytic reactors decreased by an average of ~54% after
16 h of sunlight exposure (E=1.78 MJ·m2) causing NA concentrations to increase
significantly (p<0.001). However, NA mass decreased from 320±8 mg to 230±14 mg
during this interval (Figure 4). After 3.57 MJ·m-2 of UV insolation, photolysis decreased
NA mass by 39±8% to 195±23 mg. In the photolytic reactors, change in NA mass with
respect to UV insolation was modeled by first-order rate kinetics (R2= 0.80 to 0.95). The
mean rate coefficient for change in NA mass by photolysis as a function of UV insolation
was -0.14±0.04 m2·MJ-1. The mean first-order rate coefficient for change in NA mass
with photoperiod was -0.015±0.004 h-1 (R2 =0.80 to 0.95), which results in a mean half-
life of 46±13 h. Final mean NA mass in the dark reactors was 280±27 mg, which was
lower, but not significantly different, from initial mass (310±16 mg, p = 0.21).
3.4 Toxicity testing
Page 40
26
3.4.1 Exposure Characterization
Water quality characteristics and concentrations of metals, metalloids, major ions,
and NAs were measured to characterize exposures of untreated OSPW and OSPW from
photocatalytic, photolytic reactors, and dark control reactors (Tables S3, S4). Evaporation
decreased volume in the dark control reactors by 16.7±0.9%, accounting for increases in
conductivity, TDS, and concentrations of ions (e.g, HCO3-, Cl-, and Na+) relative to
OSPW and samples from the reconstituted photocatalytic and photolytic reactors.
Concentrations of Cu and Zn in untreated OSPW exceeded water quality criteria (0.011
mg Cu/L [USEPA, 2007] and 0.03 mg Zn/L [CCME, 2011], respectively), but Cu was
detected above the USEPA criteria only in the photolysis treatment. B and Cl- were
measured in excess of Canadian Council of Ministers of the Environment (CCME)
criteria (1.5 mg B/L and 120 mg Cl-/L [CCME, 2011]) in all treatments and in untreated
OSPW. Final concentrations of NAs in photocatalysis, photolysis, and dark control
treatments were 18±5, 79±9, and 97±8 mg/L, respectively. These values exceed a 96 h
EC50 for P. promelas embryo viability (7.5 mg/L; Marentette et al., 2015a); however,
toxicity of NAs in OSPW is determined by concentration and speciation (Brown and
Ulrich, 2015; Maffey and Dubé, 2016; McQueen et al., 2017b).
3.4.2 Ceriodaphnia dubia
Survival and reproduction of C. dubia was measured to assess the ability of each
treatment (i.e., photocatalysis, photolysis, and dark control) to mitigate risk associated
with OSPW (Figure 5; Table S5). Untreated OSPW was toxic to C. dubia, as survival
(55%; p = 0.004) and reproduction (14±7 neonate·adult-1; p <0.001) were significantly
Page 41
27
less than a laboratory control (95%; 28±6 neonate·adult-1). Photocatalysis increased
survival and reproduction of C. dubia relative to untreated OSPW. No mortality and the
highest reproduction of all treatments (23±6 neonates·adult-1) were observed in OSPW
treated by photocatalysis. Reproduction and survival in the dark and photolysis
treatments also were not significantly different from a laboratory control. However,
Tukey’s test indicates that daphnids exposed to OSPW treated by photocatalysis had
significantly greater reproduction than C. dubia exposed to photolysis (p = 0.025) and
dark (p = 0.017) treatments.
3.4.3 Pimephales promelas
Survival and biomass of juvenile P. promelas exposed to untreated OSPW was
88% and 472±32 µg, respectively (Figure 6; Table S6). These endpoints were not
significantly different from a laboratory control (p=0.502 and 0.321, respectively).
Survival and biomass of P. promelas fry exposed to OSPW in the photocatalysis,
photolysis, and dark control treatments were not significantly different from a laboratory
control (Table S6). However, fry exposed to OSPW treated by photocatalysis had the
greatest biomass (494±39 µg) followed by photolysis (432±77 µg), and biomass was least
in the dark control (409±28 µg).
4.0 Discussion
4.1 Absorption and attenuation of UV radiation in OSPW
To achieve charge separation and initiate photocatalysis, TiO2 must absorb UV
radiation with wavelengths <400 nm (Fujishima et al., 2000). Comparison of terrestrial
and spaceborne reference solar irradiance spectra demonstrates that 0% of UV-C, 0 to
Page 42
28
15% of UV-B, and 15 to 65% of UV-A radiation is transmitted through the atmosphere
(Figure S2; ATSM, 2012; Gueymard, 2003). Terrestrial irradiance distribution deviates
from the ASTM reference spectrum with changes in location, elevation, and atmospheric
conditions (ATSM, 2012). Mean transmittance of detectable terrestrial UV-B
wavelengths (i.e. 305 to 315 nm; ASTM, 2012) is 67% in OSPW, and mean
transmittance of UV-A radiation in OSPW is 80%. Photoexcitation conditions of TiO2
and transmittance of UV radiation in OSPW and the atmosphere suggest that wavelengths
between 305 and 400 nm are the primary source of irradiance for film-based
photocatalysis of OSPW. Across this range, UV-A radiation has greater terrestrial
spectral irradiance and transmittance through OSPW than UV-B radiation, supporting
that UV-A radiation is the primary source of UV photons for film-based solar
photocatalysis of OSPW.
These data suggest that the broadband UV sensor used to determine attenuation of
solar UV irradiance in OSPW was measuring predominantly UV-A radiation. Compared
to oligotrophic freshwater water lakes, in which UV radiation may penetrate meters
(Wetzel, 1975), OSPW used in the photocatalysis experiment strongly attenuated solar
UV radiation, as <10% of surface UV irradiance was measured at depths >20 cm.
Multiple studies measuring light absorption in OSPWs and solutions of NAFCs found
that UV radiation is strongly absorbed by OSPW NAs (McMartin et al., 2004; Leshuk et
al., 2016a,b). TSS and O&G increased attenuation of UV light in OSPW by scattering
and absorbing UV photons, as demonstrated by 2.2-times greater attenuation coefficients
in turbid OSPW (69±11 mg/L TSS, 30 mg/L O&G) compared to OSPW with 6±2 mg/L
Page 43
29
TSS and no measurable O&G. Floating bitumen and hydrocarbon sheens, which have
been observed in some OSPWs (Gosselin et al., 2010; Allen, 2008; McQueen et al.,
2017a), may require treatment prior to photocatalysis to decrease attenuation of UV
radiation (Clark et al., 2009). Dissolved iron may complex with organic acids in OSPW
and strongly absorb UV light (Leshuk et al., 2016b). Iron concentrations in OSPW treated
in this study were only 0.086±0.010 mg/L, compared to 13.1 mg/L measured by Leshuk
et al. (2016b) in strongly colored OSPW, and likely did not have a measureable effect on
UV absorption.
Measurement of UV absorption and attenuation in OSPW will be important steps
in designing pilot- and full-scale photocatalytic reactors and determining if pretreatment
is necessary, as attenuation of solar UV radiation is a major factor in determining
throughput of fixed-bed photoreactors (Bousselmi et al., 2004; Zayani et al., 2009). Low
TSS and absence of a hydrocarbon sheen (oil and grease <4 mg/L) precluded OSPW used
in this experiment from pretreatment prior to photocatalysis. For pretreatment of OSPW
at tailings facilities, constructed wetlands offer a low-energy and low-maintenance
approach for settling suspended solids, precipitating soluble iron, and degrading
hydrocarbons (Rodgers and Castle, 2008; Pardue et al., 2014; McQueen et al., 2017b).
Absorption spectra of samples from the photocatalytic reactors and previous
research on agglomeration and sedimentation of TiO2 (Keller et al., 2010; Brunelli et al.,
2013) support that bench-scale settled TiO2 photocatalytic reactors were suitable proxies
for immobilized catalyst layers. Samples collected from the water column of the
photocatalytic reactors 0.5 h after OSPW/TiO2 suspensions were poured showed only
Page 44
30
slightly lower transmittance of UV radiation than OSPW with no TiO2 (73% versus 88%
at 400 nm), suggesting that a small amount of TiO2 was still suspended. However,
transmittance in a sample collected 2 h after experiment initiation was equal or greater
than in initial OSPW, supporting that TiO2 had settled. Keller et al. (2010) found that
agglomeration and settling rates of TiO2 increase commensurately with initial
concentration, supporting that high initial TiO2 concentrations (1,000 mg/L) in the
photocatalytic reactors promoted rapid sedimentation. Brunelli et al. (2013) concluded
that initial concentration, over ionic strength and dissolved organic matter concentration,
was the primary factor in determining settling rates even at low TiO2 concentrations (i.e.
0.01 to 10 mg/L).
4.2 Rates and extents of NA degradation
NA degradation proceeded at faster rates and achieved greater removal in terms of
both concentration and mass in photocatalytic reactors, compared to photolytic and dark
control reactors. Photocatalytic reactors decreased NA concentration by the midpoint of
the experiment (t=16 h; E=1.78 MJ·m-2; =32 h), while concentrations increased in
photolytic reactors due to evaporation. Photolysis decreased NA mass by 39±8% after a
32-h photoperiod and 3.57 MJ·m-2 of UV insolation; however, the mean UV insolation
half-life for photolysis was 4.5 times greater than the half-life for photocatalysis. Settled
TiO2 photocatalytic reactors decreased NA mass by 40% after only 7 h of sunlight
exposure and 0.7 MJ·m-2 of UV insolation. NA mass in the dark controls decreased by
~8% while concentration increased by ~9%, but neither change was significantly
different from initial values (p=0.21 and 0.24, respectively).
Page 45
31
Settled TiO2 photocatalytic reactors achieved approximately 86% removal of NA
mass in OSPW, but degradation rates were slower than in studies utilizing TiO2 slurries.
Headley et al. (2009) observed 86% removal of NAFCs in solution with distilled water
after 8 h of sunlight exposure in bench-scale TiO2 slurry photoreactors (i.e. transparent
Petri flasks with 2 g/L TiO2). Leshuk et al. (2016a) decreased NAFC concentrations by
>98% after one day of direct sunlight (~14 h photoperiod) using solar photocatalysis over
a 0.5 mg/L agitated suspension of TiO2 in OSPW. The inorganic composition of OSPW
used in this research is similar to centrifuged OSPWs used by Leshuk et al. (2016 a,b), so
the discrepancy in performance is attributed primarily to poor mass transfer in the settled
TiO2 reactors, where only diffusion and wind-shear contributed to mixing. When
photocatalyst particles are immobilized in films or are poorly agitated, photonic
efficiency is diminished due to decreased surface area available for adsorption of
contaminants and absorption of UV photons (Malato et al., 2009). Efficiency of film-
based reactors is increased by maximizing throughput, which improves mass transfer of
reactants, oxygen, and degradation byproducts (Zayani et al., 2009). However, Bouseelmi
et al. (2004) and Zayani et al. (2009) found that improving degradation rates by
increasing throughput in pilot-scale thin film fixed-bed photocatalytic reactors was
eventually limited by increases in laminar liquid film thickness, which attenuated solar
UV radiation. Rates and extents of NA removal in settled TiO2 batch reactors provide a
conservative proof of concept for film-based photocatalysis of NAs in OSPW and may be
improved by introducing flow and utilizing films of immobilized TiO2.
Page 46
32
The photolytic reactors used in this study represent close to ideal conditions for
photolysis as they received direct sunlight, were reconstituted, and had a high surface
area relative to depth (3,481 cm2 to 1 cm). Thus, the removal of NA mass by photolysis
was greater in this research compared to previous studies (McMartin et al., 2007;
Headley et al., 2009; Leshuk et al., 2016a), which used UV-transparent sealed vessels
that prevented evaporation. However, NA concentrations in the photolytic reactors
increased by 59% at the experiment midpoint, demonstrating that photolysis is not a
viable pathway without reconstitution.
The minor removal of NA mass in dark control reactors (~8% decrease) is
consistent with previous photocatalysis experiments in closed systems, which report 4 to
9% decreases in NA concentration attributed to adsorption onto TiO2 (Headley et al.,
2009; Leshuk et al., 2016a). Concentrations of Na+, Ca2+, Mg2+, and SO42- measured in
the dark controls may decrease solubility of NAs (Janfada et al., 2006), which combined
with the high surface area of Aeroxide® TiO2 (55±15 m2·g-1) may promote adsorption of
weakly polar, hydrophobic polycyclic NAs onto catalyst particles (Kannel and Gan,
2012). Janfada et al. (2006) concluded that low partitioning to the water column is
expected for NAs and observed rapid sorption of OSPW NAs dissolved in synthetic
groundwater to soil particles under pH and temperature conditions (8.0±0.4 and 23±1°C,
respectively) similar to pH and temperature in the photocatalysis experiment.
Additionally, surrogate NAs, such as benzoic acid, have been shown to adsorb to TiO2
nanoparticles (Zhang et al., 2005; Chan et al., 2002; Vione et al., 2005).
Page 47
33
As indicated by final concentrations of NAs and COD (18±5 and 31±33 mg/L,
respectively), complete mineralization of NAs was not achieved in the photocatalytic
reactors. However, BOD/COD ratios, which can be used as an indicator of
biodegradability (OECD, 1992), increased from 0.018 to 0.19 after photocatalysis of
OSPW. Increased biological activity in inoculated samples of post-photocatalysis OSPW
is attributed to transformation of NAs to more labile degradation intermediates (Leshuk et
al. 2016a). Early work on photocatalysis of OSPW NAs suggested that lower molecular
weight NAs were targeted (Headley et al., 2009), but ultra-high resolution Oribtrap-MS
indicates that structurally complex (i.e. polycyclic and/or high double bond equivalence)
and higher carbon-number NAs are preferentially degraded during photocatalysis
(Leshuk et al., 2016a). Additionally, photocatalysis shifts distributions of NAFC classes
from regimes dominated by classical NAs (i.e. O2 NAFCs) to regimes enriched in poly-
oxygenated NAs (Leshuk et al., 2016a). Complex, higher molecular weight NAFCs are
recalcitrant to biodegradation (Scott et al., 2005; Han et al., 2008; Martin et al., 2009,
Brown and Ulrich, 2015), and the ability of photocatalysis to transform these compounds
into more labile degradation intermediates suggests that this pathway could be paired
with aerobic degradation as a hybrid approach for treating NAs in OSPW.
4.3 Changes in Toxicity to Sentinel Species
Survival and reproduction of C. dubia were more sensitive endpoints for
measuring toxicity of OSPW exposures and treatments (i.e. photocatalysis, photolysis,
dark controls) compared to survival and biomass of P. promelas. A previous
toxicological investigation of OSPW received in the ~40,000 L shipment measured
Page 48
34
lowest observed effect concentrations (LOECs) for P. promelas growth and C. dubia
reproduction of 50% and 25% OSPW, respectively (McQueen et al., 2017a). However, as
noted in the results, survival and biomass of P. promelas exposed to OSPW used in the
current investigation was not significantly different from laboratory controls (p=0.502
and 0.321, respectively) in this experiment. In the first toxicity identification evaluation
of OSPW, Verbeek (1994) ameliorated acute OSPW toxicity by C18 absorption, thus
attributing adverse effects to polar organics. Multiple studies have confirmed the
conclusion of this seminal work (Marentette et al., 2015a,b; McQueen et al., 2017a), and
effects directed analysis has specifically implicated classical O2 NAs as the primary
source of toxicity in OSPW (Morandi et al., 2015; Hughes et al, 2017). However, Zubot
et al. (2012) concluded that impaired survival and reproduction of salinity-sensitive C.
dubia (Cl- EC50=461 mg/L) in OSPW may be attributed to synergism between dissolved
salts and the organic fraction.
Photocatalysis was the most effective treatment for altering exposures of OSPW
to C. dubia, yielding the least mortality and greatest number of neonates per adult
daphnid. However, survival and reproduction of C. dubia also improved in photolysis and
dark control treatments, relative to untreated OSPW. NA concentrations were
significantly different between treatments and OSPW (p<0.001), yet survival and
reproduction of C. dubia exposed to all treatments was not different from control
organisms. This result is another example of how changes in NA concentration are not
necessarily correlated to toxicity (Brown and Ulrich, 2015; Mahaffey and Dube, 2016;
McQueen et al., 2017b). Minor differences in water quality characteristics and
Page 49
35
concentrations of ions and metals measured in OSPW and the treatments were unlikely to
significantly influence toxicity. The change in response of C. dubia exposed to OSPW
from the photocatalytic and photolytic reactors and the dark controls is therefore
attributed to compositional alteration of NAs.
After photocatalysis over suspended TiO2, Leshuk et al. (2016a) measured a shift
in the relative abundance of NA classes from “classical”, O2 NAFCs to poly-oxygenated
classes, which are sparingly toxic relative to O2 NAs (Morandi et al., 2015). Slurry
photocatalysis of OSPW altered composition within NAFCs classes, increasing the
relative abundance of lower weight and less complex (i.e. lower double bond
equivalence) compounds (Leshuk et al., 2016a). Similar compositional alteration of NAs
is assumed to have occurred in the settled TiO2 photocatalytic reactors used in this
experiment, although the extent of transformation may be lower. Klamerth et al. (2015)
suggested that degradation byproducts from advanced oxidation of NAs in OSPW may
potentially increase toxicity. However, no evidence of increased toxicity after
photocatalysis was found in this study, which may be the first to measure toxicity of
OSPW to sentinel aquatic species before and after photocatalysis.
Photolysis decreased NA mass and likely altered the composition of NAs in
OSPW. Prince et al. (2003) determined that polycyclic aromatic hydrocarbons with
greater degrees of alkylation are more susceptible to photolysis. Because naphthenic
acids consist predominantly of alkyl-substituted cycloaliphatic carboxylic acids (Headley
and McMartin, 2004) and are known to contain aromatic compounds (Mohamed et al.,
2008), it is feasible that these compounds would be targeted in photolysis of OSPW.
Page 50
36
Scarlett et al. (2013) found that an aromatic fraction of NAs extracted from OSPW was
acutely toxic to larval zebra fish, and it is possible that elimination of these compounds
explains increased survival and reproduction of C. dubia after photolysis of OSPW.
Removal of toxicity by the dark controls was unexpected, especially since the
samples were not reconstituted resulting in higher concentrations of NAs and salinity.
This result may be anomalous, as it seems unlikely that adsorption or aerobic
degradation, which are the most likely treatment pathways in the dark controls, could
have altered NA composition sufficiently to improve survival and reproduction of C.
dubia. Phosphorus concentrations decreased in the dark control, and temperature, DO,
and pH were within ranges found to promote degradation of a commercial blend of NAs
(Kinley et al., 2016), but only continuous flow biofilm reactors have achieved measurable
degradation of NAs in OSPW within a duration similar to that of this experiment (i.e., 64
h; Hwang et al., 2013; McKenzie et al., 2014). Removal of benzoic acid, a simple single
ring aromatic carboxylic acid that has been used as a surrogate NA (Zhang et al., 2005),
has been detected in dark controls in previous photocatalysis experiments and attributed
to sorption (Chan et al., 2002; Vione et al., 2005). However, since removal of NA mass
was not significant in the dark controls, changes in NA exposure by either aerobic
degradation or sorption would have been limited to compositional changes not detectable
by derivatization and HPLC.
These toxicity experiments suggest that photocatalysis may be a suitable
mechanism for rapid amelioration of toxicity from OSPW. However, it must be noted
that exposures from the photocatalytic and photolytic reactors were altered by periodic
Page 51
37
reconstitution during sunlight exposure. This procedure impacted results of the bioassays,
given the low salt tolerance of C. dubia, but allowed effects of changes in the organic
fraction to be assessed.
5.0 Conclusions
Rates and extents of NA degradation and changes in response of Ceriodaphnia
dubia and Pimephales promelas were measured in a specific OSPW treated by
photocatalysis over settled TiO2 as a proof-of-concept for film-based photocatalysis.
Absorption of UV light in OSPW was measured, determining that UV-A radiation is the
primary source of solar irradiance driving film-based photocatalysis. In OSPW with <4
mg/L O&G and 6±2 mg/L TSS, attenuation of UV radiation was attributed to absorption
by NAFCs resulting in an attenuation coefficient of -0.13 cm-1 for UV radiation.
Photocatalysis over settled TiO2 removed ~37% of NA concentration after 1.78 MJ·m-2
of UV insolation over a 16 h photoperiod and ~86% of NA mass after 32 h of sunlight
exposure and 3.57 MJ·m-2 of UV insolation. NA mass decreased exponentially with 50%
degradation at approximately 1.1 MJ·m-2 and 10 h of sunlight exposure. Measurable NA
mass removal occurred in photolytic reactors (~39% removal), but degradation occurred
slower rates (𝑇0.5𝐸𝑚=5.0 MJ·m-2, 𝑇0.5𝑡𝑚= 46 h). Survival and reproduction of C. dubia
were impaired in exposures of OSPW, but there were no significant differences in
survival and biomass of P. promelas exposed to untreated OSPW. Daphnids exposed to
OSPW treated by photocatalysis showed highest reproduction, but photolysis and dark
control treatments also increased survival and reproduction of C. dubia relative to
untreated OSPW.
Page 52
38
In the specific OSPW studied, photocatalysis over settled TiO2 degraded NAs,
providing a proof-of-concept for film-based photocatalysis of OSPW. Bench-scale
experimentation with flow-through fixed-film reactors is warranted to improve the
performance of film-based TiO2 photocatalysis for treatment of OSPW. To increase rates
of NA removal, pre-treatment of suspended solids and oil sheens prior to photocatalysis
may be required for some OSPWs. Increased BOD:COD ratios after photocatalysis
suggests that pairing photocatalysis with aerobic degradation may be a more effective
method for treating NAs in OSPW than photocatalysis alone. This study is a first step in
development of film-based photocatalysis for treatment of OSPW and the integration of
this technology into passive systems capable of mitigating risks associated with this
mixture.
6.0 References
Alberta Energy Regulator (AER), 2012. Alberta’s Energy Reserves 2011 and
Supply/Demand Outlook 2012–2021. ST98-2012. https://www.aer.ca/
documents/sts/ST98/ST98-2012.pdf.
Allen, E.W., 2008. Process water treatment in Canada’s oil sands industry: I. Target
pollutants and treatment objectives. Journal of Environmental Engineering and
Science. 7, 123-138.
American Public Health Association (APHA), American Water Works Association,
Water Environment Federation, 2012. Standard methods for the examination of
water and wastewater, 21st edition. American Public Health Association, Port City
Press., Baltimore, MA.
Armstrong, S.A., Headley, J.V., Peru, K.M., Germida, J.J., 2007. Phytotoxicity of oil
sands naphthenic acids and dissipation from systems planted with emergent
aquatic macrophytes. Journal of Environmental Science and Health, Part A. 43,
36-42.
American Society for Testing and Materials (ASTM), 2012. Standard Tables for
Reference Solar Spectral Irradiances: Direct Normal and Hemispherical on 37
Tilted Surface. G173-03. ASTM International, West Conshohocken, PA.
Page 53
39
Barrow, M.P., Headley, J.V., Peru, K.M., Derrick, P.J., 2009. Data visualization for the
characterization of naphthenic acids within petroleum samples. Energy & Fuels.
23, 2592-2599.
Bartlett, A.J., Frank, R.A., Gillis, P.L., Parrott, J.L., Marentette, J.R., Brown, L.R.,
Hooey, T., Vanderveen, R., McInnis, R., Brunswick, P., 2017. Toxicity of
naphthenic acids to invertebrates: Extracts from oil sands process-affected water
versus commercial mixtures. Environmental Pollution. 227, 271-279.
Bousselmi, L., Geissen, S., Schroeder, H., 2004. Textile wastewater treatment and reuse
by solar catalysis: results from a pilot plant in Tunisia. Water Science and
Technology. 49, 331-337.
Brient, J.A., Wessner, P.J., Doyle, M.N., 1995. Naphthenic acids. In: Kroschwitz, J.I.
(Ed.). Encyclopedia of Chemical Technology. John Wiley & Sons, New York,
1017-1029.
Brown, L.D. and Ulrich, A.C., 2015. Oil sands naphthenic acids: a review of properties,
measurement, and treatment. Chemosphere. 127, 276-290.
Brunelli, A., Pojana, G., Callegaro, S., Marcomini, A., 2013. Agglomeration and
sedimentation of titanium dioxide nanoparticles (n-TiO2) in synthetic and real
waters. Journal of Nanoparticle Research. 15, 1684.
Canadian Council of Ministers of the Environment (CCME), 2011. Canadian water
quality guidelines for the protection of aquatic life. Canadian environmental
quality guidelines, 1999. Canadian Council of Ministers of the Environment,
Winnipeg, MB.
Carpenter, S.R., Kitchell, J.F., Hodgson, J.R., 1985. Cascading trophic interactions and
lake productivity. Bioscience. 35, 634-639.
Chan, A.H., Chan, C.K., Barford, J.P., Porter, J.F., 2003. Solar photocatalytic thin film
cascade reactor for treatment of benzoic acid containing wastewater. Water
Research. 37, 1125-1135.
Chong, M.N., Jin, B., Chow, C.W., Saint, C., 2010. Recent developments in
photocatalytic water treatment technology: a review. Water Research. 44, 2997-
3027.
Clark, R.N., Curchin, J.M., Hoefen, T.M., Swayze, G.A., 2009. Reflectance spectroscopy
of organic compounds: 1. Alkanes. Journal of Geophysical Research: Planets.
114.
Clemente, J.S.and Fedorak, P.M., 2005. A review of the occurrence, analyses, toxicity,
and biodegradation of naphthenic acids. Chemosphere. 60, 585-600.
Drzewicz, P., Perez-Estrada, L., Alpatova, A., Martin, J.W., Gamal El-Din, M., 2012.
Impact of peroxydisulfate in the presence of zero valent iron on the oxidation of
cyclohexanoic acid and naphthenic acids from oil sands process-affected water.
Environmental Science & Technology. 46, 8984-8991.
Page 54
40
Environment and Climate Change Canada (ECCC), 2011. Biological test method: larval
growth and survival using fathead minnows. EPS 1/RM/22. 2nd edition.
Environment and Climate Change Canada, Ottawa, ON.
Environment and Climate Change Canada (ECCC), 2007. Biological test method: test of
reproduction and survival using the Cladoceran Ceriodaphnia dubia. EPS
1/RM/21 2nd edition. Environment and Climate Change Canada, Ottawa, ON.
Fujishima, A., Rao, T.N., Tryk, D.A., 2000. Titanium dioxide photocatalysis. Journal of
Photochemistry and Photobiology C: Photochemistry Reviews. 1, 1-21.
Gaya, U.I. and Abdullah, A.H., 2008. Heterogeneous photocatalytic degradation of
organic contaminants over titanium dioxide: a review of fundamentals, progress
and problems. Journal of Photochemistry and Photobiology C: Photochemistry
Reviews. 9, 1-12.
Gosselin, P., Hrudey, S.E., Naeth, M.A., Plourde, A., Therrien, R., Van Der Kraak, G.,
Xu, Z., 2010. Environmental and health impacts of Canada’s oil sands industry.
The Royal Society of Canada, Ottawa, ON.
Grewer, D.M., Young, R.F., Whittal, R.M., Fedorak, P.M., 2010. Naphthenic acids and
other acid-extractables in water samples from Alberta: what is being measured?
Science of the Total Environment. 408, 5997-6010.
Gueymard, C.A., 2003. The sun’s total and spectral irradiance for solar energy
applications and solar radiation models. Solar Energy. 76, 423-453.
Han, X., MacKinnon, M.D., Martin, J.W., 2009. Estimating the in-situ biodegradation of
naphthenic acids in oil sands process waters by HPLC/HRMS. Chemosphere. 76,
63-70.
Han, X., Scott, A.C., Fedorak, P.M., Bataineh, M., Martin, J.W., 2008. Influence of
molecular structure on the biodegradability of naphthenic acids. Environmental
Science & Technology. 42, 1290-1295.
Headley, J.V., Du, J., Peru, K.M., McMartin, D.W., 2009. Electrospray ionization mass
spectrometry of the photodegradation of naphthenic acids mixtures irradiated with
titanium dioxide. Journal of Environmental Science and Health Part A. 44, 591-
597.
Headley, J.V. and McMartin, D.W., 2004. A review of the occurrence and fate of
naphthenic acids in aquatic environments. Journal of Environmental Science and
Health, Part A. 39, 1989-2010.
Headley, J.V., Peru, K.M., Fahlman, B., McMartin, D.W., Mapolelo, M.M., Rodgers,
R.P., Marshall, A.G., 2012. Comparison of the levels of chloride ions to the
characterization of oil sands polar organics in natural waters by use of Fourier
transform ion cyclotron resonance mass spectrometry. Energy & Fuels, 26(5),
2585-2590.
Page 55
41
Hein, F.J., Leckie, D., Larter, S., Suter, J.R., 2013. Heavy oil and bitumen petroleum
systems in Alberta and beyond: The future is nonconventional and the future is
now. In: Hein, F.J., Leckie, D., Larter, S., Suter, J.R. (Eds.). Heavy-Oil and Oil-
Sand Petroleum Systems in Alberta and Beyond. AAPG Studies in Geology. 64, 1.
1-21. American Association of Petroleum Geologists (AAPG) Special Volumes.
Hughes, S.A., Mahaffey, A., Shore, B., Baker, J., Kilgour, B., Brown, C., Peru, K.M.,
Headley, J.V., Bailey, H.C., 2017. Using ultrahigh-resolution mass spectrometry
and toxicity identification techniques to characterize the toxicity of oil sands
process-affected water: the case for classical naphthenic acids. Environmental
Toxicology and Chemistry. Online version of record, August 7, 2017.
Hwang, G., Dong, T., Islam, M.S., Sheng, Z., Pérez-Estrada, L.A., Liu, Y., El-Din, M.G.,
2013. The impacts of ozonation on oil sands process-affected water
biodegradability and biofilm formation characteristics in bioreactors. Bioresource
Technology. 130, 269-277.
Janfada, A., Headley, J.V., Peru, K.M., Barbour, S., 2006. A laboratory evaluation of the
sorption of oil sands naphthenic acids on organic rich soils. Journal of
Environmental Science and Health Part A. 41, 985-997.
Kannel, P.R. and Gan, T.Y., 2012. Naphthenic acids degradation and toxicity mitigation
in tailings wastewater systems and aquatic environments: a review. Journal of
Environmental Science and Health, Part A. 47, 1-21.
Kavanagh, R.J., Frank, R.A., Oakes, K.D., Servos, M.R., Young, R.F., Fedorak, P.M.,
MacKinnon, M.D., Solomon, K.R., Dixon, D.G., Van Der Kraak, G., 2011.
Fathead minnow (Pimephales promelas) reproduction is impaired in aged oil
sands process-affected waters. Aquatic Toxicology. 101, 214-220.
Keller, A.A., Wang, H., Zhou, D., Lenihan, H.S., Cherr, G., Cardinale, B.J., Miller, R., Ji,
Z., 2010. Stability and aggregation of metal oxide nanoparticles in natural
aqueous matrices. Environmental Science & Technology. 44, 1962-1967.
Kinley, C.M., Gaspari, D.P., McQueen, A.D., Rodgers, J.H., Castle, J.W., Friesen, V.,
Haakensen, M., 2016. Effects of environmental conditions on aerobic degradation
of a commercial naphthenic acid. Chemosphere. 161, 491-500.
Klamerth, N., Moreira, J., Li, C., Singh, A., McPhedran, K.N., Chelme-Ayala, P.,
Belosevic, M., El-Din, M.G., 2015. Effect of ozonation on the naphthenic acids'
speciation and toxicity of pH-dependent organic extracts of oil sands process-
affected water. Science of the Total Environment. 506, 66-75.
Leshuk, T., de Oliveira Livera, D., Peru, K.M., Headley, J.V., Vijayaraghavan, S., Wong,
T., Gu, F., 2016. Photocatalytic degradation kinetics of naphthenic acids in oil
sands process-affected water: Multifactorial determination of significant factors.
Chemosphere. 165, 10-17.
Page 56
42
Leshuk, T., Wong, T., Linley, S., Peru, K.M., Headley, J.V., Gu, F., 2016. Solar
photocatalytic degradation of naphthenic acids in oil sands process-affected water.
Chemosphere. 144, 1854-1861.
Madill, R.E., Orzechowski, M.T., Chen, G., Brownlee, B.G., Bunce, N.J., 2001.
Preliminary risk assessment of the wet landscape option for reclamation of oil
sands mine tailings: bioassays with mature fine tailings pore water.
Environmental Toxicology. 16, 197-208.
Mahaffey, A. and Dubé, M., 2016. Review of the composition and toxicity of oil sands
process-affected water. Environmental Reviews. 25, 97-114.
Malato, S., Fernández-Ibáñez, P., Maldonado, M.I., Blanco, J., Gernjak, W., 2009.
Decontamination and disinfection of water by solar photocatalysis: recent
overview and trends. Catalysis Today. 147, 1-59.
Marentette, J.R., Frank, R.A., Bartlett, A.J., Gillis, P.L., Hewitt, L.M., Peru, K.M.,
Headley, J.V., Brunswick, P., Shang, D., Parrott, J.L., 2015a. Toxicity of
naphthenic acid fraction components extracted from fresh and aged oil sands
process-affected waters, and commercial naphthenic acid mixtures, to fathead
minnow (Pimephales promelas) embryos. Aquatic Toxicology. 164, 108-117.
Marentette, J.R., Frank, R.A., Hewitt, L.M., Gillis, P.L., Bartlett, A.J., Brunswick, P.,
Shang, D., Parrott, J.L., 2015b. Sensitivity of walleye (Sander vitreus) and
fathead minnow (Pimephales promelas) early-life stages to naphthenic acid
fraction components extracted from fresh oil sands process-affected waters.
Environmental Pollution. 207, 59-67.
Martin, J.W., Barri, T., Han, X., Fedorak, P.M., El-Din, M.G., Perez, L., Scott, A.C.,
Jiang, J.T., 2010. Ozonation of oil sands process-affected water accelerates
microbial bioremediation. Environmental Science & Technology. 44, 8350-8356.
McKenzie, N., Yue, S., Liu, X., Ramsay, B.A., Ramsay, J.A., 2014. Biodegradation of
naphthenic acids in oils sands process waters in an immobilized soil/sediment
bioreactor. Chemosphere. 109, 164-172.
McMartin, D.W., Headley, J.V., Friesen, D.A., Peru, K.M., Gillies, J.A., 2004. Photolysis
of naphthenic acids in natural surface water. Journal of Environmental Science
and Health, Part A. 39, 1361-1383.
McQueen, A.D., Kinley, C.M., Hendrikse, M., Gaspari, D.P., Calomeni, A.J., Iwinski,
K.J., Castle, J.W., Haakensen, M.C., Peru, K.M., Headley, J.V., 2017a. A risk-
based approach for identifying constituents of concern in oil sands process-
affected water from the Athabasca Oil Sands region. Chemosphere. 173, 340-350.
McQueen, A.D., Hendrikse, M., Gaspari, D.P., Kinley, C.M., Rodgers, J.H., Castle, J.W.,
2017b. Performance of a hybrid pilot-scale constructed wetland system for
treating oil sands process-affected water from the Athabasca Oil Sands.
Ecological Engineering. 102, 152-165.
Page 57
43
McQueen, A.D., Kinley, C.M., Kiekhaefer, R.L., Calomeni, A.J., Rodgers, J.H., Castle,
J.W., 2016a. Photocatalysis of a commercial naphthenic acid in water using fixed-
film TiO2. Water, Air, & Soil Pollution. 227, 132.
Mikula, R., 2013. Trading water for oil: Tailings management and water use in surface-
mined oil sands. In: Hein, F.J., Leckie, D., Larter, S., Suter, J.R. (Eds.). Heavy Oil
and Oil-Sand Petroleum Systems in Alberta and Beyond. AAPG Studies in
Geology 64: 1, 689-699. American Association of Petroleum Geologists (AAPG)
Special Volumes.
Mishra, S., Meda, V., Dalai, A.K., McMartin, D.W., Headley, J.V., Peru, K.M., 2010.
Photocatalysis of naphthenic acids in water. Journal of Water Resource and
Protection. 2, 644.
Mohamed, M.H., Wilson, L.D., Headley, J.V., Peru, K.M., 2008. Screening of oil sands
naphthenic acids by UV-Vis absorption and fluorescence emission
spectrophotometry. Journal of Environmental Science and Health Part A. 43,
1700-1705.
Morandi, G.D., Wiseman, S.B., Pereira, A., Mankidy, R., Gault, I.G., Martin, J.W.,
Giesy, J.P., 2015. Effects-directed analysis of dissolved organic compounds in oil
sands process-affected water. Environmental Science & Technology. 49, 12395-
12404.
Organization for Economic Cooperation and Development (OECD), 2002. Guidance
Document on Aquatic Toxicity Testing of Difficult Substances and Mixtures, 23rd
edition. Organization for Economic Co-operation and Development, Paris, FR.
Organization for Economic Cooperation and Development (OECD), 1992. Test No. 301:
Ready Biodegradability. Organization for Economic Co-operation and
Development, Paris, FR.
Pardue, M.J., Castle, J.W., Rodgers, J.H., Huddleston, G.M., 2014. Treatment of oil and
grease in produced water by a pilot-scale constructed wetland system using
biogeochemical processes. Chemosphere. 103, 67-73.
Pennak, R.W., 1978. Freshwater invertebrates of the United States, 2nd edition. John
Wiley & Sons. New York, NY.
Prince, R.C., Garrett, R.M., Bare, R.E., Grossman, M.J., Townsend, T., Suflita, J.M., Lee,
K., Owens, E.H., Sergy, G.A., Braddock, J.F., 2003. The roles of photooxidation
and biodegradation in long-term weathering of crude and heavy fuel oils. Spill
Science & Technology Bulletin. 8, 145-156.
Quinlan, P.J. and Tam, K.C., 2015. Water treatment technologies for the remediation of
naphthenic acids in oil sands process-affected water. Chemical Engineering
Journal. 279, 696-714.
Page 58
44
Rodgers Jr, J.H. and Castle, J.W., 2008. Constructed wetland systems for efficient and
effective treatment of contaminated waters for reuse. Environmental Geosciences.
15, 1-8.
Rogers, V.V., Wickstrom, M., Liber, K., MacKinnon, M.D., 2002. Acute and subchronic
mammalian toxicity of naphthenic acids from oil sands tailings. Toxicological
Sciences. 66, 347-355.
Rowland, S.J., Scarlett, A.G., Jones, D., West, C.E., Frank, R.A., 2011. Diamonds in the
rough: identification of individual naphthenic acids in oil sands process water.
Environmental Science & Technology. 45, 3154-3159.
Scarlett, A., Reinardy, H., Henry, T., West, C., Frank, R., Hewitt, L., Rowland, S., 2013.
Acute toxicity of aromatic and non-aromatic fractions of naphthenic acids
extracted from oil sands process-affected water to larval zebrafish. Chemosphere.
93, 415-420.
Scott, A.C., Mackinnon, M.D., Fedorak, P.M., 2005. Naphthenic acids in Athabasca oil
sands tailings waters are less biodegradable than commercial naphthenic acids.
Environmental Science & Technology. 39, 8388-8394.
Scott, A.C., Zubot, W., MacKinnon, M.D., Smith, D.W., Fedorak, P.M., 2008. Ozonation
of oil sands process water removes naphthenic acids and toxicity. Chemosphere.
71, 156-160.
Scott, W.B. and Crossman, E.F., 1978. Freshwater Fishes of Canada. Fisheries Research
Board of Canada, Ottawa, Ontario.
Sohrabi, V., Ross, M., Martin, J., Barker, J., 2013. Potential for in situ chemical oxidation
of acid extractable organics in oil sands process affected groundwater.
Chemosphere. 93, 2698-2703.
Toor, N.S., Han, X., Franz, E., MacKinnon, M.D., Martin, J.W., Liber, K., 2013.
Selective biodegradation of naphthenic acids and a probable link between mixture
profiles and aquatic toxicity. Environmental Toxicology and Chemistry. 32, 2207-
2216.
United States Environmental Protection Agency (USEPA), 2007. National recommended
water quality criteria-correction. EPA 822-Z-99–001. Office of Water,
Washington, DC.
United States Environmental Protection Agency (USEPA), 2002. Short-term methods for
estimating the chronic toxicity of effluents and receiving waters to freshwater
organisms. 4th edition. EPA-821-R-02-013. Environmental Monitoring Systems
Lab, Cincinnati, OH.
United States Environmental Protection Agency (USEPA), 2001. Trace elements in
water, solids, and biosolids by inductively coupled plasma-atomic emission
spectrometry. 5th Revision. EPA Method 200.7. EPA-821-R-01-010. Office of
Water, Washington, DC.
Page 59
45
United States Environmental Protection Agency (USEPA), 1999. Revision A: n-hexane
extractable material (HEM; oil and grease) and silica gel treated n-hexane
extractable material (SGTHEM; non-polar material) by extraction and gravimetry.
EPA Method 1664. EPA-821-R-10-001. Office of Water, Washington, DC.
Verbeek, A.G., 1994. A toxicity assessment of oil sands wastewater. University of
Alberta, Edmonton, AB. Master's Thesis.
Vione, D., Minero, C., Maurino, V., Carlotti, M.E., Picatonotto, T., Pelizzetti, E., 2005.
Degradation of phenol and benzoic acid in the presence of a TiO2-based
heterogeneous photocatalyst. Applied Catalysis B: Environmental. 58, 79-88.
Weather Underground, 2017. Station ID: KSCCLEMS1, Station Name: CU Ent Dept.
2016. https://www.wunderground.com/personal-weather-station/
dashboard?ID=KSCCLEMS1#history/s20160227/e20160301/mcustom
Wetzel, R.G., 1975. Limnology: Lake and River Ecosystems, 3rd edition. Academic
Press, San Diego, CA.
Yen, T., Marsh, W.P., MacKinnon, M.D., Fedorak, P.M., 2004. Measuring naphthenic
acids concentrations in aqueous environmental samples by liquid
chromatography. Journal of Chromatography A. 1033, 83-90.
Zayani, G., Bousselmi, L., Mhenni, F., Ghrabi, A., 2009. Solar photocatalytic degradation
of commercial textile azo dyes: performance of pilot plant scale thin film fixed-
bed reactor. Desalination. 246, 344-352.
Zhang, A., Ma, Q., Wang, K., Tang, Y., Goddard, W.A., 2005. Improved processes to
remove naphthenic acids. Final Technical Report, Department of Energy (DOE)
Contract number: DE-FC26-02NT15383. US DOE, Washington, DC.
Zubot, W., MacKinnon, M.D., Chelme-Ayala, P., Smith, D.W., El-Din, M.G., 2012.
Petroleum coke adsorption as a water management option for oil sands process-
affected water. Science of the Total Environment. 427, 364-372.
Page 60
46
Figure 1. Transmittance of UV-A, UV-B, and UV-C radiation in OSPW, a suspension of
0.01 g/L TiO2 in OSPW, and samples collected from photocatalytic reactors 0.5 and 2.0 h
after a 1.0 g/L TiO2/OSPW suspension was poured into the reactors. Wavelengths in the
UV-A range were least absorbed in OSPW, and 0.01 g/L TiO2 significantly decreased
transmittance of UV radiation in OSPW (p<0.001). Transmittance of samples collected
0.5 and 2 h after TiO2/OSPW suspensions were added to the reactors indicates that TiO2
was suspended initially, but settled before 2 h.
Figure 2. Attenuation of solar UV radiation as a function of depth in two OSPWs. OSPW
1 contained 6±2 mg/L total suspended solids (TSS) and no measurable oil and grease
(O&G; <4 mg/L), and OSPW 2 contained 69±11 mg/L TSS and 30 mg/L O&G. Each
point represents mean UV irradiance (I) measured at depth, divided by incident UV
irradiance (Io). Data are correlated with exponential functions according to the Beer-
Lambert law (Eqn. 2). Error bars represent standard deviation of five UV irradiance
measurements made at 5-second intervals.
Figure 3. Naphthenic acid (NA) concentration in photocatalytic, photolytic, and dark
control reactors plotted versus UV insolation. After an experimental duration of 32 h, UV
insolation reached 1.78 MJ·m-2 over a photoperiod of 16 h. Each point represents mean
NA concentration of three replicate reactors. Error bars represent one standard deviation
(n=9).
Figure 4. Naphthenic acid (NA) mass in photocatalytic, photolytic, and dark control
reactors plotted against UV insolation. After an experimental duration of 82 h, UV
insolation reached 3.57 MJ·m-2 over a photoperiod of 32 h. Each point represents mean
Page 61
47
NA mass measured in three replicate reactors. Error bars represent one standard deviation
(n=9).
Figure 5. A) Percent survival of C. dubia exposed to untreated OSPW and
photocatalysis, photolysis, and dark control treatments. B) Mean neonates produced in
first 3 broods by C. dubia surviving after exposure to untreated OSPW and
photocatalysis, photolysis, and dark control treatments. Asterisks above OSPW indicate
survival and reproduction were statistically lower than laboratory control. Reproduction
in all treatments was not different from the laboratory control (Table S5). Tukey’s test
indicates that the photocatalysis treatment had significantly greater reproduction than
photolysis and dark control treatments (p = 0.0249 and 0.017, respectively).
Figure 6. A) Percent survival of P. promelas exposed to untreated OSPW and samples
from photocatalytic, photolytic, and dark controls reactors. B) Cumulative mean biomass
per surviving P. promelas fry. Error bars represent one standard deviation (n=3). There
were no significant differences in survival and biomass between OSPW, the treatments,
and laboratory controls (Table S6).
Page 62
48
Figure 1
Figure 2
Page 63
49
Figure 3
Figure 4
Page 64
50
Figure 5
Figure 6
Page 65
51
Table 1. Naphthenic acid (NA) mass and concentration removal extents (i.e. final mass or concentration measured),
efficiencies (Eqn. 10, 18), rate coefficients (Eqn. 6-7, 14-15), and half-lives (Eqn. 8-9, 16-17) for photocatalytic, photolytic,
and dark control reactors. Data are reported as means and standard deviations calculated from values measured in replicate
reactors (n=3). Removal of NA concentrations were measured until the midpoint of the experiment, and NA mass removal was
determined throughout the entire duration of the experiment.
Parameter Concentrationa Massb
Photocatalysis Photolysis Dark Control Photocatalysis Photolysis Dark Control
UV Insolation (MJ·m-2) 1.78 1.78 0
3.57 3.57 0
Total Photoperiod (h) 16 16 0
32 32 0
Initial NA (±SD) 89 (±6) 92 (±13) 89 (±6)
310 (±16) 320 (±8) 310 (±16)
Removal Extent (±SD) 56 (±6) 146 (±7) 110 (±6)
44 (±11) 195 (±23) 280 (±27)
Removal Efficiency (%) 37 (±6) -59 (±9) -24 (±12)
86 (±3) 39 (±8) 9 (±10)
Rate Coefficient
UV Insolation (m2·MJ-1) -0.33 (±0.03) c c
-0.61 (±0.10) -0.14 (±0.04)
c
Photoperiod (h-1) -0.036 (±0.003) c c
-0.068 (±0.011) -0.015 (±0.004) c
R2 d
UV Insolation (MJ·m-2) 0.63 to 0.93 c c
0.87 to 0.98 0.80 to 0.95
c
Photoperiod (h) 0.67 to 0.94 c c
0.85 to 0.98 0.80 to 0.95 c
Half-life
UV Insolation (MJ·m-2) 2.1 (±0.2)e c c
1.1 (±0.2) 5.0 (±1.4)e
c
Photoperiod (h) 19 (±2)e c c
10 (±2) 46 (±13)e c
a Initial NA and removal extent reported in mg/L b Initial NA and removal extent reported in mg c Removal rates, half-lives, and R2 were not calculated because NA concentration or mass was not significantly different from initial mass d R2 reported as minimum and maximum value
e Half-lives extrapolated from available data, no half-lives reached
Page 66
52
CHAPTER III
A HYBRID PILOT-SCALE CONSTRUCTED WETLAND TREATMENT SYSTEM
FOR REMEDIATION OF AN OIL SANDS PROCESS-AFFECTED WATER
Abstract
Surface mines in the Athabasca Oil Sands store massive volumes of oil sands
process-affected waters (OSPWs) that contain potentially hazardous constituents, most
notably the carboxylic acid class (O2 class) of naphthenic acid fraction compounds
(NAFCs). The objective of this research was to assemble a hybrid pilot-scale constructed
wetland treatment system (CWTS) and assess its performance for a specific OSPW by
measuring changes in concentration and composition of targeted constituents and toxicity
to Ceriodaphnia dubia. Characterization of the OSPW indicated that As, B, Cl-, Cu, Pb,
Zn, total suspended solids (TSS), oil and grease (O&G), and NAFCs were constituents of
concern (COCs). The hybrid pilot-scale CWTS was assembled outdoors in Clemson, SC,
consisted of wetland cells and solar TiO2 fixed-film photocatalytic reactors, and was
measured during three sampling periods to assess performance. Orbitrap mass
spectrometry (Orbitrap MS) conducted at the National Hydrology Research Centre in
Saskatoon, SK showed that after treatment in wetland cells and photocatalytic reactors,
NAFC class distributions shifted from regimes dominated by acutely toxic O2 NAFCs
(O2=40.3%, ∑O3–9=45.0%) in untreated OSPW to sparingly toxic oxidized NAFCs (i.e.
O3–9; O2=13.6%, ∑O3–9=77.0%). Concentrations of NAFCs decreased by 75.9% from
inflow (43.1±5.9 mg/L) to outflow (10.4±6.0 mg/L) of the hybrid pilot-scale CWTS. TSS
and O&G achieved compliance with narrative water quality criteria, mean arsenic
Page 67
53
concentrations decreased from 0.026 to between 0.011–0.013 mg/L (48 to 57%), and
mean Zn concentrations decreased from 0.129 mg/L to between 0.052 and 0.040 mg/L
(49 to 54%). Between 30 and 39% of water was lost to evapotranspiration during the first
two sampling events causing concentrations of NAFCs, B, Cl-, Cu, and Pb to increase or
remain constant in the wetland cells. “Polishing” photocatalytic reactors treating outflow
from the final wetland cells decreased NAFC concentrations from 29.3±3.0 to 10.4±6.0
mg/L. In sampling periods 2 and 3, toxicity to C. dubia was eliminated at all positions
within the CWTS. Reproduction of C. dubia was impaired in 4 of 8 samples collected
during sampling period 1, likely due to increased Cl- concentrations. This study
demonstrates that pairing aerobic degradation in wetland cells with fixed-film
photocatalysis can alter composition and decrease concentrations of NAFCs in OSPW.
Performance data, biogeochemical conditions, and design criteria presented in this hybrid
pilot-scale CWTS experiment will inform further development of this technology.
1.0 Introduction
Extraction of bitumen from surficial deposits in the Athabasca oil sands (AOS)
has produced between 800 and 1,000 million m3 of oil sands process-affected waters
(OSPWs; Mikula, 2013). The accumulation of these impaired waters in tailings ponds
across the AOS results from the combination of approximately 50 years of oil sands
extraction without implementation of scalable treatment technologies and the Alberta
Environmental Protection and Enhancement Act, which prohibits release of untreated
OSPW into surface and ground-waters (Madill et al., 2001; Mikula, 2013; Quinlan and
Tam, 2015). OSPW contains suspended sediments, dissolved salts, metals, metalloids,
Page 68
54
and an organic fraction predominantly composed of organic acids and residual bitumen
(Allen, 2008; McQueen et al., 2017a). Provincial laws mandating that liquid tailings (i.e.
OSPW) must be reclaimed within 10 years of oil sands mine closure have hastened
development of OSPW treatment technologies (AER, 2016). Oil sands operators are
seeking passive approaches for treating large volumes of OSPW to comply with this
directive (COSIA, 2015). Constructed wetlands are passive, low-energy treatment
systems that have demonstrated potential to mitigate risks associated with constituents in
OSPW.
Naphthenic acids (NAs) are the primary source of toxicity in OSPW (MacKinnon
and Boerger, 1986; Verbeek, 1994; Morandi et al., 2015a; Hughes et al., 2017), and have
elicited adverse effects across a diverse array of taxonomic groups including bacteria
(Frank et al., 2008), fish (Kavanagh et al., 2011), invertebrates (Bartlett et al., 2017),
mammals (Rogers et al., 2002), and vascular plants (Armstrong et al., 2008). NAs are a
complex group of thousands of carboxylic acids produced from biodegradation of mature
petroleum (Tissot and Welte, 1978; Quagraine et al., 2005), and solubilized into OSPW
during the alkaline bitumen extraction process (Schramm, 2000). This complex mixture
comprises cycloaliphatic carboxylic acids classically defined by the formula, CnH2n+ZO2,
where n is the number of carbon atoms and Z represents hydrogen deficiency (Brient et
al., 1995; Headley and McMartin, 2004; Clemente and Fedorak, 2005). Ultrahigh-
resolution mass spectrometry (UHRMS) of OSPW acidic extracts has found that <50% of
identified compounds conform to the classical NA formula (i.e. the O2 class; Grewer et
al., 2010), with the remainder of this fraction consisting of poly-oxygenated classes (O3–
Page 69
55
9), and sulfur and nitrogen heteroatoms (Headley et al., 2012). Thus, “naphthenic acid
fraction compounds” (NAFCs) was proposed as a more appropriate term for describing
this complex mixture of organic acids (Headley et al., 2012). Molecular composition
varies within each heteroatom class, and resistance to biodegradation increases with
greater cyclicity, carbon number, and alkyl branching (Scott et al., 2005; Han et al., 2008;
Toor et al., 2013b). Robust treatment methods are required to decrease concentration and
alter composition of NAFCs in OSPW.
Specifically designed constructed wetland treatment systems (CWTSs) have
successfully remediated impaired waters containing complex mixtures of contaminants,
including refinery effluents and oil field produced waters (Gillespie et al., 2000;
Huddleston et al., 2000; Murray-Gulde et al., 2003). The versatility of these systems
stems from the diverse array of reactions supported in natural wetlands, including
bioconcentration, biodegradation, photolysis, precipitation, oxidation, reduction, and
sorption (Rodgers and Castle, 2008; Vymazal, 2010; Reddy and DeLaune, 2008). By
promoting aerobic biodegradation, wetland sediment microcosms have decreased NA
concentrations (Toor et al., 2013b), hydroponic treatments with macrophytes have
decreased toxicity of OSPW (Armstrong et al., 2009), and pilot-scale CWTSs have
eliminated acute toxicity of OSPW to Ceriodaphnia dubia (McQueen et al., 2017b).
Hybrid components, including oil water separators, reverse osmosis membranes, and
photocatalytic reactors may be implemented into CWTSs to provide additional or
enhance existing treatment processes (Murray-Gulde et al., 2003; Kanagy et al., 2008a;
Pardue et al., 2014; McQueen et al., 2017b). Photocatalysis over TiO2 is a potent
Page 70
56
advanced oxidation process that generates reactive radical species in the presence of
water and solar UV radiation (<400 nm; Fujishima et al., 2000). This pathway may
augment treatment of NAFCs in OSPW when implemented as a hybrid component in
CWTSs (McQueen et al., 2017b). When implemented as a “polishing step”, fixed-film
TiO2 solar photocatalytic reactors decreased concentrations of residual NAs by up to 93%
in the outflow of a pilot-scale CWTS designed for OSPW. In this research, fixed-film
photocatalytic reactors were implemented into a hybrid pilot-scale CWTS to enhance
degradation and transformation of NAFCs in a specific OSPW.
Differences in ore composition (Schramm, 2000; Romanova et al., 2004), bitumen
separation methods, tailings management practices, and freshwater intake (Allen, 2008;
Zubot et al., 2012) cause concentrations of elements, suspended solids, residual
hydrocarbons, and NAFCs to range considerably in OSPWs produced at different mines
(Allen, 2008; Marentette et al., 2015a; Leshuk et al., 2017b). A thorough characterization
of OSPW to be treated in constructed wetlands is required to bound expected ranges of
constituent concentrations. Constituents of concern (COCs) are elements, organics, or
parameters that impede beneficial reuse of OSPW by exceeding water quality criteria
(WQC) or toxicity endpoints. CWTSs are designed to promote specific treatment
pathways capable of decreasing solubility, bioavailability, and reactivity of COCs
(Rodgers and Castle, 2008). These transfers and transformations are promoted by careful
integration of vegetation, hydrosoil, and hydroperiod (Hawkins et al., 1997; Gillespie et
al., 2000; Rodgers and Castle, 2008). Once assembled, CWTS operation is largely
passive and highly cost-effective, as these systems contain few mechanical parts and can
Page 71
57
have lifetimes of over 30 years (Lehman et al., 2001; Murray-Gulde et al., 2005a; Nelson
and Gladden, 2008). Operation of CWTSs involves measurement of biogeochemical
parameters, flow management, and performance monitoring. Biogeochemical conditions,
including pH, hydrosoil oxidation-reduction potential (ORP), dissolved oxygen
concentration (DO), and shoot density, are measured to assess if conditions are suitable
for promotion of targeted transfers and transformations (Lehman et al., 2001; Rodgers
and Castle, 2008). Flow management consists of measuring volumetric inflow and
outflow rates, calculating water balance, and using these data to assess removal of COC
mass (Bishay, 1998; Lehman et al., 2001). Performance of CWTSs is monitored by
measuring changes in concentration and composition of COCs and responses of sentinel
aquatic species with respect to hydraulic retention time (HRT). These organisms may be
vulnerable to additive and synergistic effects from mixtures of constituents in OSPW that
cannot be analytically determined (Norberg-King, 1992), and thus provide a composite
measure of performance. Pairing bioassays with UHRMS allows responses of test
organisms to be compared with changes in distributions of NAFC classes in OSPW
(Morandi et al., 2015; Hughes et al., 2017).
The overall objective of this research was to measure performance of a hybrid
pilot-scale CWTS treating OSPW. Specific objectives were to: 1) Characterize a specific
OSPW treated by a hybrid pilot-scale CWTS for identification of COCs, 2) assemble and
operate a hybrid pilot-scale constructed wetland for treatment of the OSPW, 3) analyze
changes in NAFC concentration and class distribution measured by UHRMS in Dr. John
Headley’s laboratory at the Environment and Climate Change Canada National
Page 72
58
Hydrology Research Centre, and 4) measure changes in concentration of COCs and
survival and reproduction of Ceriodaphnia dubia.
2.0 Materials and Methods
2.1 Characterizing OSPW for identification of COCs
For this study, COCs were water quality characteristics, elements, and groups of
organic compounds in concentrations exceeding water quality criteria (WQC) for fresh
surface waters. COCs were identified using the most protective WQC available from
regulatory agencies including the Ministry of Alberta Environment and Parks (AEP),
Canadian Council of Ministers of the Environment (CCME), and United States
Environmental Protection Agency (USEPA). In November 2015, ~40,000 L of OSPW
were collected by Shell Canada from the clarified zone (1-3 m depth below surface) of an
external tailings facility at the Muskeg River Mine in northern Alberta, Canada. In
addition to outfall from bitumen extraction processes, major inputs to this tailings facility
include precipitation, runoff, and groundwater from mine dewatering and capture of dyke
seepage (Allen, 2008; Roy et al., 2016; Shell Canada Ltd., 2016). OSPW was transported
in two stainless steel tanker trailers to Clemson, SC, USA and conveyed to 3,785 L high
density polyethylene (HDPE) tanks for storage. Following 24 h of mixing in the storage
tanks using a 0.56 kW (0.75 HP) submersible pump, grab samples of OSPW were
collected for chemical characterization and COC identification. Water quality
characteristics, including pH, conductivity, alkalinity, hardness, total suspended solids
(TSS), total dissolved solids (TDS), total ammonia, and total phosphorus were measured
according to Standard Methods for Examination of Water and Wastewater (APHA,
Page 73
59
2012). Total recoverable concentrations of elements (i.e., Al, As, Ba, B, Cd, Ca, Cr, Cl,
Co, Cu, Fe, Pb, Mg, Mn, Ni, K, Se, Na, Zn) were determined by acidifying unfiltered
samples with 2% (v/v) trace metal grade HNO3 (15.9 N; Sigma-Aldrich, St. Louis, MO,
USA) prior to inductively coupled plasma atomic emission spectroscopy (ICP-AES;
Spectro Flame Modula, Mahwah, NJ, USA) according to EPA method 200.7 (USEPA,
2001). Concentrations of oil and grease (O&G) were measured in untreated OSPW
according to USEPA method 1664A (USEPA, 1999).
After collection of samples for OSPW characterization, 500 mL aliquots were
stored in 1-L HDPE bottles, frozen, and shipped to Dr. John V. Headley’s laboratory at
the Environment and Climate Change Canada (ECCC) National Hydrology Research
Centre in Saskatoon, SK for analysis of concentration, composition, and speciation of
NAFCs by electrospray ionization ultrahigh resolution mass spectrometry (ESI-
UHRMS). NAFCs were recovered from thawed OSPW samples using weak anion
exchange solid phase extraction (WAX) as described by Ajaero et al. (2017). This
extraction method is preferred for diagnostic analysis of NAFCs in complex
environmental matrices (Ajaero et al., 2017). ESI-UHRMS analysis of extracted organic
acids was conducted using a LTQ Orbitrap Elite Mass Spectrometer (Oribtrap; Thermo
Fisher Scientific, San Jose, CA). Total concentrations of NAFCs were determined using a
5-point calibration curve of nominal concentrations of Shell OSPW-derived acid
extractable organics (Headley et al., 2011; Hughes et al., 2017). Diagnostic
characterization of NAFCs was conducted with the Orbitrap in full scan, negative-ion
mode, with mass resolution set to 240,000, and m/z scan range of 100-600 (Hughes et al.,
Page 74
60
2017). Mass accuracy error was <2 ppm for all assignments, and root mean square error
was 0.12-0.45 ppm for assignments associated with the entire mass spectra (Hughes et
al., 2017). Detected NAFCs were grouped according to the following classes: Ox (x =1-
10), OxS (x =1-8), Nx (x=1-3), Sx (x=1-2), NxOy (x=1-3, y=1-5) NxOyS (x=1-3, y=1-3).
NAFC class distribution and concentration data were sent electronically by Kerry Peru to
researchers at Clemson University where the data were analyzed to identify COCs and
determine changes in NAFC concentration and composition within the hybrid pilot-scale
CWTS.
Derivatization and high performance liquid chromatography (HPLC) were used as
a rapid, low-resolution method to quantify the carboxylic acid fraction of OSPW organics
(Yen et al., 2004). Total concentrations measured by derivatization and HPLC are
referred to as naphthenic acids (NAs) in this paper to differentiate between total NAFC
concentrations determined by WAX and Orbitrap MS. Samples were derivatized in 2.0
mL glass vials then analyzed using a Dionex UltiMate-3000 HPLC (Sunnyvale, CA)
equipped with an Agilent LiChrospher 100 RP-18 column (5 µm particle size, 125mm x
4 mm) and a guard column containing 2 µm RP-18 solid phase material. Absorbance of
NA derivatives was measured at 400 nm. Chromatograms were integrated via baseline
hold between retention times of 2.9 and 6 min. Concentration was calculated from
integrated areas using a 5-point standard curve derived from a dilution series of a 120
mg/L stock solution of a commercial NA blend (Fluka NAs; Sigma-Aldrich; St. Louis,
MO). All samples and standards were divided into pseudo-replicates prior to
Page 75
61
derivatization, and total NA concentrations were expressed as means of pseudo-replicates
(n=3).
2.2 CWTS assembly and operation
Given the composition and concentrations of NAFCs in this OSPW (Section 3.1)
and the body of literature attesting to their toxicity (McKinnon and Boerger, 1986;
Verbeek, 1994; Marentette et al., 2015a,b; McQueen et al., 2017a; Hughes et al., 2017),
the hybrid pilot-scale CWTS was assembled using components capable of transforming
OSPW organics as discussed in section 3.2.1. The hybrid pilot-scale CWTS consisted of
two major parts: a hybrid constructed wetland (HCW) and a polishing photocatalytic
reactor (PC2; Figure 1). The HCW was composed of duplicate series (Series A and B)
with each series containing five free-water surface wetland cells (WC1-5) and an initial
photocatalytic reactor (PC1) located between the first and second wetlands cells. FMI®
piston pumps (Fluid Metering, Inc., Syosset, NY) conveyed OSPW from a 3,785 L
HDPE storage tank to the first wetland cell in each series (A1, B1) at an inflow rate of
14.9 L/d. This flow rate was selected to achieve a nominal hydraulic retention time
(HRT) of 16 d in each HCW series and was calculated using Eqn. 1.
𝑄𝑖𝑛 = 𝑉/𝐻𝑅𝑇 (1)
where Qin is the inflow rate (L/d), V is the aqueous volume of a series (L), and HRT is the
nominal hydraulic retention time (d). HCW series were constructed on an approximately
15° slope to promote gravity driven flow. Polyvinyl chloride (PVC) fittings were used to
connect photocatalytic reactors and wetland cells. Outflows from final wetland cells
(WC5) in HCW series were stored in HDPE tanks and transferred by FMI pumps to the
Page 76
62
polishing photocatalytic reactor (PC2). PC2 was composed of two duplicate series (APC2
and BPC2). Each series consisted of a photocatalytic reactor, a FMI pump, and inflow
(A/BPC2 In) and outflow storage tanks (A/BPC2 Out). Outflows from HCW series were
circulated through PC2 series until exposed to >1.5 MJ/m2 UV insolation. This threshold
is based on NA degradation in a solar TiO2 fixed-film photocatalytic reactor treating
OSPW collected from pilot-scale CWTS outflows (McQueen et al., 2017b). UV
irradiance (J·s-1·m-2) was measured and recorded with an Apogee Instruments SU-100
UV sensor (spectral range 250 to 400 nm; Logan, UT) connected to a HOBO UX120-
006M Analog Data Logger (Bourne, MA). Irradiance data were integrated over time to
calculate UV insolation (MJ/m2).
2.2.1 Wetland cells
Wetland cells were contained in 115 L polypropylene barrels (76 cm height, 51
cm upper diameter, 44 cm lower diameter). Hydrosoil was collected from Eighteen Mile
Creek (Pendleton, SC) and consisted of alluvial sediment containing approximately 84%
medium to coarse grained sand, 15% gravel, <1% clay/silt, and <1% organic matter
(Kanagy et al., 2008b). Wetland cells were filled with hydrosoil to a depth of
approximately 20 cm and amended with 5 g/L Osmocote® time-released fertilizer. In
July 2016 mature broadleaf cattail (Typha latifolia) were collected from local ponds and
planted at an initial density of 30 shoots/m2 (6-8 plants per cell). Water depth was fixed at
20 cm and mean total volume of water, including saturated pore space, in the wetland cell
was 44±2 L (n=10). The nominal HRT of each wetland cell was 3 d.
2.2.2 Photocatalytic reactors
Page 77
63
TiO2 fixed films were assembled by applying ~0.1 cm thick layers of epoxy (West
System® 105 epoxy resin and 206 hardener; Bay City, MI) to 0.32 cm thick stainless
steel sheets and coating the epoxy with TiO2 (AeroxideTM P25; Fisher Scientific;
Fairlawn, NJ). TiO2 films were placed in 15x72x31 cm HDPE containers with PVC
fittings installed approximately 1.5 cm above film surfaces. Each photocatalytic reactor
(APC1, BPC1, APC2, BPC2) consisted of 4 fixed-film containers (reactor units). The
total volume of each initial photocatalytic reactor (APC1, BPC1) was approximately 15
L, which achieved a nominal HRT of 24 h given the inflow rate of 14.9 L/d (Eqn. 1). This
design ensured that under continual loading of OSPW, all throughput of the initial
photocatalytic reactors was exposed to daylight.
Outfall from HCW series was collected in storage tanks for transfer into in
polishing photocatalytic reactor Series A and B (APC2 In, BPC2 In). When predicted sky
cover was <50% (NWS, 2017), FMI pumps were activated and OSPW was conveyed to
each PC2 series. Reactor units in the PC2 series were covered when this threshold was
not met or inclement weather was predicted. Inflow rates were calibrated to achieve
between 6 and 8 h HRT to match daily duration of direct sunlight. Outflow from each
PC2 series was collected and recirculated until volumes of OSPW had been exposed to
>1.5 MJ/m2 UV insolation (McQueen et al., 2017b).
2.2.3 Sampling of hybrid pilot-scale CWTS
Samples were collected for analysis of water quality characteristics, shifts in
NAFC class distribution, and changes in COC concentration and survival and
reproduction of Ceriodaphnia dubia. The HCW series were sampled according to a
Page 78
64
nominal HRT (t=16 d) so that a single volume (i.e. plug) of OSPW could be analyzed.
Plug flow was initiated when inflow pumps were activated. Samples were collected from
outflows of initial wetland cells (WC1) and photocatalytic reactors (PC1) at HRT=3 and
4 d, respectively. Outflow samples were collected from the second (WC2), third (WC3),
fourth (WC4), and fifth (WC5) wetland cells at HRT=7, 10, 13, and 16 d, respectively.
Performance data for the pilot-scale CWTS were compiled over three successive
sampling periods. Sampling periods started on 10/14/16, 11/9/16, and 12/2/16. On these
starting dates, grab samples were collected from the OSPW storage tank for
characterization of inflow. OSPW was mixed for 24 h prior to sample collection and
continuously throughout each sampling period using a 0.56 kW (3/4 HP) submersible
pump. Each sampling period started when inflow pumps were activated, continued as
samples were collected according to plug flow, and ended when cumulative inflow
volumes were equivalent to HCW series volumes.
Performance monitoring of the polishing photocatalytic reactors (PC2) was also
divided into three successive sampling periods which started on 12/1/2016, 12/21/2016,
and 1/12/2017. Durations of PC2 sampling periods were determined by photoperiods
required to achieve UV insolation >1.5 MJ/m2, and ranged from 28.0 to 45.8 h,
depending on weather conditions. Samples were collected from PC2 series inflow tanks
(APC2 In, BPC2 In) on start dates and from outflow tanks (APC2 Out, BPC2 Out) after
UV insolation thresholds were achieved (Figure 1).
Water balances for each HRT were calculated for HCW and PC2 series according
to Eqn. 2:
Page 79
65
∆𝑉 = 𝑄𝑖𝑛𝑡 − 𝑉𝑜𝑢𝑡 (2)
where ∆V (L) is the change in volume, Qin (L/d) is the volumetric inflow rate, t (d) is
inflow duration, and Vout (L) is the sum of recovered volume and sample volume.
Volumetric inflow rate was measured daily using a graduated cylinder and stopwatch,
and outflow volumes were measured directly.
2.2.4 Explanatory parameters
Green shoot density and hydrosoil oxidation-reduction potential (ORP, mV) were
measured biweekly starting in August 2016. Hydrosoil ORP was measured 15 cm below
the sediment-water interface in the center of each wetland cell using in situ platinum-
tipped electrodes and an Accumet® calomel (Hg2Cl2) reference electrode connected to a
GardnerBender® GDT-311 voltmeter (Faulkner et al., 1989). Water temperature in
wetland cells was monitored using a HOBO Pendant® Temperature/Light 64K Data
Logger (Bourne, MA) located at the sediment water interface in wetland cell B3.
Conductivity and pH were measured in situ using an Orion Star A221 portable meter
(Thermo Fisher Scientific, Waltham, MA) equipped with a 9157BNMD Triode pH probe
and a 013010MD conductivity cell. DO was measured using a HQ30d meter with a
LDO101 optical dissolved oxygen probe (HACH; Loveland, CO). Conductivity, pH, and
DO were measured during each sampling period at a depth of 10 cm below the wetland
cell water surface and near outflows of the initial photocatalytic reactors (PC1). AVS was
measured using the diffusion method (Leonard et al., 1996), in which sulfide ions were
trapped in sulfide anti-oxidant buffer (SAOB) and measured using an ion-selective
electrode (ISE; Fisher Accumet 950 pH/ion meter) to determine the molar concentration
Page 80
66
of AVS. Ambient temperature and precipitation data were collected from a weather
station located 1.1 km from the hybrid CWTS (Weather Underground, 2017).
2.3 Changes in NAFC concentration and class distribution
Changes in NAFC composition and concentration were determined by conducting
ESI-Orbitrap MS on composite samples of OSPW from strategic locations within the
hybrid pilot-scale CWTS. Composite samples consisted of 50:50 mixtures of aliquots
from samples collected simultaneously at parallel positions in Series A and B. Samples
collected from the following positions in Series A and B were composited: inflows to
PC2 and outflows of WC1, PC1, WC5, and PC2. Distributions of NAFC class (e.g., O2,
O4, O2S) relative abundance, which is the abundance of a class relative to the sum of all
classes, were determined for each composite sample. NAFC classes with a mean relative
abundance of <1% at one or more positions in the hybrid CWTS were excluded from
figures and tables.
2.4 Changes in COC concentration
COC concentrations in samples collected from wetland cells and photocatalytic
reactors in HCW and PC2 Series A and B were measured according to methods described
in section 2.1. Evaporation, transpiration, and precipitation influenced COC
concentrations in the hybrid CWTS. Eqn. 3. was used to calculate volume-adjusted COC
concentrations in outflows of the HCW and PC2 series:
𝐶adj = 𝐶𝑜𝑢𝑡𝑉𝑜𝑢𝑡/𝑉𝑖𝑛 (3)
Page 81
67
where Cadj (mg/L) is the adjusted COC concentration, Cin (mg/L) is inflow concentration,
Cout (mg/L) is the outflow concentration, and Vin (L) is cumulative inflow volume
calculated from the water balance (Eqn. 2). Extents of removal, which are COC
concentrations measured in HCW or PC2 outflows, and removal efficiencies (Eqn. 4) are
reported for measured and adjusted-concentrations.
Removal Efficiency = ((𝐶𝑖𝑛 − 𝐶𝑜𝑢𝑡)/𝐶𝑖𝑛) · 100 (4)
2.5 Ceriodaphnia dubia bioassays and statistics
Ceriodaphnia dubia is an ecologically significant species ubiquitous in North
American lentic freshwaters (Pennak, 1978; Carpenter et al., 1985). This daphnid is
sensitive to constituents found in OSPW including NAFCs, major ions, and divalent
metals (Goodfellow et al., 2000; Zubot et al., 2012; McQueen et al., 2017a). C. dubia,
obtained from healthy cultures maintained at the Clemson University Aquatic Animal
Research Laboratory, were used to assess toxicity of samples collected from untreated
OSPW (inflow), initial photocatalytic reactor (PC1) outflows, hybrid constructed wetland
(HCW) outflows, and polishing photocatalytic reactor inflows and outflows (PC2 In, PC2
Out). Survival and reproduction of C. dubia neonates were measured in these samples
using a static/renewal bioassay conducted according to ECCC protocols (ECCC, 2007).
Responses of exposures and laboratory controls, which consisted of formulated
moderately hard water (USEPA, 2002), were compared following ECCC methods for
single concentration tests. Exposures eliciting adverse responses had significantly
different survival and reproduction compared to laboratory controls. Differences between
normally distributed, homogeneous reproduction data were determined by analysis of
Page 82
68
variance (ANOVA) followed by comparison of exposures to laboratory controls using
Dunnett’s test. Reproduction data were tested for normality and homogeneity using Chi-
square and Barlett’s tests, respectively. Survival data were compared to laboratory
controls using Fisher’s exact test. Students t-test for comparison of means was used to
determine the statistical significance of differences between various parameters in the
hybrid CWTS (e.g., COC concentrations, water quality characteristics). Statistical
analyses were performed using JMP Pro V12.1 (⍺= 0.05; SAS Institute Inc.; Cary, NC,
USA).
3.0 Results and Discussion
3.1 OSPW characterization and COC identification
Ranges of TDS (1026-1546 mg/L), hardness (116-132 mg/L as CaCO3), and pH
(8.62-8.91) indicate that the OSPW was slightly saline (McNeely et al., 1979),
moderately soft to hard, and slightly alkaline (Table 1). In descending order of
concentration, major ions in this OSPW were HCO3-, Na+, Cl-, SO4
2-, K+, Mg2+, Ca2+, and
CO32-. Ranges of water quality characteristics and concentrations of major ions are
consistent with values reported in previous characterizations of OSPWs (Allen et al.,
2008; Toor et al., 2013a; Mahaffey and Dubé, 2016; Leshuk et al., 2016b; McQueen et
al., 2017a). Bicarbonate concentrations in the OSPW ranged from 326 to 415 mg/L,
contributing to alkalinity and stable pH of this water. Cl- concentrations ranged from 248
to 260 mg/L, exceeding CCME’s chronic WQC and concentrations measured in
freshwater bodies within the Athabasca oil sands (<1 to 73 mg/L; Golder Associates,
2001), and therefore Cl- is considered a COC. Total suspended solids ranged from 6 to
Page 83
69
113 mg/L, and have the potential to exceed water quality criteria if discharges increase
TSS in a receiving water body by more than 25 mg/L within a 24 h period (CCME,
2011). Ammonia has historically been a source of toxicity in OSPW (Allen, 2008; Bishay
et al., 1998); however, ammonia concentrations did not exceed WQC in the OSPW used
in this research (CCME, 2011). Phosphorus concentrations in this OSPW exceeded
CCME trigger ranges for discharge into mesotrophic receiving waters (CCME, 2011).
However, for the purposes of this research, phosphorus was not identified as a COC
because this nutrient is associated with lower removal extents and higher biodegradation
rates for OSPW organics (Herman et al., 1994; Lai et al., 1996; Toor et al., 2013a). Acid
soluble concentrations of As, B, Cu, Pb, and Zn exceeded the most conservative WQC
available and were identified as COCs (Table 2). When compared to laboratory derived
toxicity endpoints for C. dubia, maximum Zn concentrations (0.208 mg/L) exceeded a 7-
d LOEC for C. dubia reproduction (0.128 mg Zn/L; Zuiderveen and Birge, 1997), but
concentration of As, B, Cu, and Pb were less than toxicity thresholds for C. dubia
(Belanger and Cherry, 1990; Hickey, 1989; Hu et al., 2012; Zuiderveen and Birge, 1997).
The organic acid fraction of OSPW has been identified repeatedly as a primary
source of toxicity in these complex mixtures (Verbeek, 1994; Marentette et al., 2015a,b;
McQueen et al., 2017a); however, WQC have not been developed for this fraction.
USEPA guidance (USEPA, 1991) states that narrative criteria of “no toxics in toxic
amounts” should be applied if numeric WQC are not available. Based on this guidance
and literature supporting the toxicity of these compounds, NAFCs, including compounds
measured as NAs by derivatization and HPLC, were identified as COCs in this OSPW.
Page 84
70
Concentrations of NAs and NAFCs were 61 to 89 mg/L and 39.4 to 57.8 mg/L,
respectively. These values exceed a 96 h EC50 for P. promelas embryo viability (7.5
mg/L; Marentette et al., 2015a); however, toxicity of NAFCs in OSPW is influenced by
concentration and speciation (Brown and Ulrich, 2015; Mahaffey and Dubé, 2016;
McQueen et al., 2017b). Untreated OSPW was composed primarily of O2, O3, and O4
classes, with relative abundance of 40.8, 19.6, and 20.7%, respectively (Figure 2). Sulfur
containing species of these oxygenated classes were also present in untreated OSPW,
with relative abundance between 3.1 and 5.3%. Highly oxidized (O6-O10), hydroxyl, and
nitrogen-containing classes were all detected at <1% relative abundance. Effect directed
analysis of fractionated NAFCs have identified the O2 class as the most acutely toxic
fraction, while O3 and O4 classes are not considered significant sources of toxicity
(Morandi et al., 2015; Yue et al., 2015a; Hughes et al., 2017). The O2 class is composed
of species which fit to classical definition of NAs (i.e., CnH2n+zO2). High relative
abundance of classical NAs supports that NAFCs are a significant driver of toxicity in
this OSPW and the identification of this group of compounds as a COC.
Concentrations of oil and grease (O&G) were determined as an aggregate
measure of residual hydrocarbon compounds in OSPW. O&G concentrations ranged
from 5 to 30 mg/L, producing a sheen on untreated OSPW. The WQC for O&G is
narrative mandating that sheens, films, or discolorations cannot be visible, thus, O&G
was identified as a COC (Health Canada, 2012).
3.2 Assembly and operation of hybrid CWTS
3.2.1 Hybrid CWTS assembly
Page 85
71
Wetland cells were constructed using combinations of vegetation, hydrosoil, and
water depth utilized in previous pilot-scale CWTS experiments (Alley et al., 2013;
Pardue et al., 2014) that maintained biogeochemical conditions suitable for heterotrophic
aerobic microorganisms and decreased concentrations of hydrocarbons via aerobic
degradation. Aerobic degradation promoted in biofilm reactors (Hwang et al., 2013;
McKenzie et al., 2014), wetland sediment microcosms (Toor et al., 2013a), and
macrophyte-planted hydroponic treatments (Armstrong et al., 2009) has altered
composition and decreased concentration and toxicity of NAFCs in OSPW. In the hybrid
pilot-scale CWTS, aerobic degradation was promoted in wetland cells by the following
features: 1) T. latifolia, a macrophyte known to release oxygen from its extensive
horizontal rhizome system (Inoue and Tsuchiya, 2008; Vymazal, 2013); 2) coarse-sand
hydrosoil amended with Osmocote® time-released fertilizer, which provided nutrients for
plants and microbial assemblages, and had sufficient hydraulic conductivity (K=10-3–100
cm/s) to promote diffusion of oxygen from rhizomes and transpiration-driven circulation
(Beebe et al., 2013; Haakensen et al., 2015); 3) water depth of <23 cm, which promoted
diffusion of atmospheric oxygen in the water column (Alley et al., 2014); and 4) a
residence time of 3 d per wetland cell (15 d total), allowing sufficient time for measurable
changes in NAFC composition and concentration via aerobic degradation to occur
(unpublished data; Brown et al., 2013; McKenzie et al, 2014). In a pilot-scale CWTS
treating OSPW, McQueen et al. (2017b) utilized similar combination of features to
achieve conditions suitable for aerobic degradation in wetland cells, including DO >2.0
mg/L and hydrosoil ORP >-50 mV (Rodgers and Castle, 2008). Conditions supporting
Page 86
72
dissimilatory sulfate reduction, an anaerobic form of respiration utilized by sulfate
reducing bacteria (SRB), have been measured in detritus-rich sediments within the upper
20 cm of similarly designed wetland cells (Jurinko, 2013). Dissimilatory sulfate reduction
generates sulfide in the presence of sulfate, hydrosoil ORP from -75 to -250 mV, and
organic matter (Murray-Gulde et al., 2005b). This process is the targeted pathway for
decreasing bioavailability of Cu, Pb, and Zn in the wetland cells, as sulfides form
insoluble complexes with these divalent metals and become sequestered in hydrosoil
(Murray-Gulde et al., 2005b; Haynes, 2016). Concentrations of As are decreased by co-
precipitation with Fe (III) oxyhydroxides in the water column of wetland cells and by
sulfide complexation in detritus-rich hydrosoil (Lizama et al., 2011; Schwindaman et al.,
2014).
To increase rates of NAFC degradation (Headley et al., 2009; Leshuk et al.,
2016a; McQueen et al., 2017b), fixed-film solar photocatalytic reactors were paired with
wetland cells in hybrid constructed wetland (HCW) series. Solar photocatalysis of OSPW
over agitated TiO2 slurries has removed >98% of NAFCs and may increase susceptibility
of OSPW organics to biodegradation (Leshuk et al., 2016a). TiO2 fixed-film reactors
were incorporated into the hybrid CWTS, as they do not require recovery or mixing of
catalyst particles (Malato et al., 2009; Zayani et al., 2009). In HCW series, initial wetland
cells (WC1) were placed before photocatalytic reactors to adsorb and degrade O&G and
settle suspended solids. These constituents attenuate solar UV radiation in OSPW
(Chapter 2, section 4.1), and may impede photocatalytic degradation of NAFCs.
Polishing photocatalytic reactors (PC2) received outflow from the HCW series and
Page 87
73
provided treatment of residual NAFCs. HCW outflow was circulated in the PC2 series
until exposed to a UV insolation threshold of 1.5 MJ/m2. This threshold is based on
photocatalytic degradation of NAs in a solar fixed-film reactor treating OSPW collected
from pilot-scale CWTS outflows (McQueen et al., 2017b). This polishing photocatalytic
reactor decreased NA concentrations by an average of 77±10% (n=3) when exposed to
mean UV insolation of 1.45±0.17 MJ/m2 (McQueen et al., 2017b).
Hybrid CWTSs have successfully treated impaired waters with TDS exceeding
6,500 mg/L (Murray-Gulde et al., 2003) and chloride concentrations greater than 4,000
mg/L (Kanagy et al., 2008a). Murray-Gulde et al. (2003) decreased TDS by 94% in
brackish oil field produced water by implementing reverse osmosis prior to treatment of
residual organics (O&G) and metals in wetland cells. Concentrations of Cl- and B in
OSPW must be decreased to achieve compliance with WQC; however, reverse osmosis
may not be practical for treating these constituents as this technology is subject to
fouling, produces concentrated brine byproducts, and has high capital and operating costs
(Igunnu and Chen, 2012). Augmentation of surface waters in the Athabasca Oil Sands
with treated outflows from CWTSs is a potential method for beneficial reuse of this
slightly saline water. Procedures for comanagement of wetland-treated OSPW in
receiving water bodies, including development of mixing zones and scheduling of
releases during high flow, may be developed in coordination with regulators (USEPA,
1991). To provide conservative estimates of performance, comanagement practices were
not implemented in this hybrid pilot-scale CWTS experiment.
Page 88
74
3.2.2 Conditions during operation of hybrid CWTS
From the start of sampling period 1 (10/14/2016) to the end of sampling period 3
(12/20/2016), hydrosoil ORP was stable with mean values in Series A and B ranging
from 59 to 73 and -18 to 0 mV (n=7), respectively, during this period (Figure S1, Table
S1). During operation of HCW series, mean DO concentrations measured in the water
column of wetland cells were 3.41±2.14 and 3.26±2.19 mg/L in Series A and B,
respectively (n=15; Table S1). Mean values of hydrosoil ORP and DO were within
thresholds supportive of aerobic biodegradation (>-50 mV and >2.0 mg/L; Castle and
Rodgers, 2008; McQueen et al., 2017b). However, mean hydrosoil ORP was -77 and -75
mV in wetland cells B2 and B5, respectively, and AVS was detected in detritus-rich
sediments at concentrations between 1 and 10 µmol/g, with a mean concentration of 4
µmol/g. These data demonstrate that dissimilatory sulfate reduction occurred in wetland
cells and sulfide was available for complexation with divalent metals (e.g., Cu, Pb, and
Zn).
Following seasonal decreases in ambient air temperature (Table 3), mean water
temperature in the wetland cells decreased from 16.7±3.4 °C to 6.9±2.8 °C from the first
to last sampling period, respectively, and vegetation underwent senescence (Figure S2).
At the beginning of sampling period 1, mean green shoot density was 75 and 87
shoots/m2 in Series A and Series B, respectively. Green shoot density declined during
sampling period 2 (from 62 to 11 shoots/m2 in Series A and 37 to 16 shoots/m2 in Series
B) and all plants were dormant during sampling period 3. Senescence did not impair the
ability of wetland cells to decrease concentrations of O&G and TSS prior to the initial
Page 89
75
photocatalytic reactors (PC1). Mean inflow concentrations of O&G were 15±13 mg/L
(n=3) and decreased to the detection limit (<4 mg/L) by the outflow of the initial wetland
cells (WC1) during all sampling periods (Table 4). Over three sampling periods, TSS
decreased from an average of 56±40 mg/L in untreated OSPW to 6±3 and 6±2 mg/L in
outflows of HCW Series A and B, respectively. UV radiation attenuation coefficients
measured in outflows of WC1 suggest that treatment of O&G and TSS in WC1 improved
UV light penetration in OSPW, which likely improved the performance of PC1 for
treatment of NAFCs. Mean UV attenuation coefficient measured in untreated OSPW
collected at the initiation of sampling period 2 was -0.28±0.02 cm-1, and improved to -
0.14±0.07 cm-1 after treatment in the initial wetland cells.
Increased frequency of overcast and inclement weather and seasonal decrease in
photoperiod caused mean daily UV insolation to decrease 51% during operation of the
HCW series from sampling period 1 (0.690 MJ·m-2·d-1) to sampling period 3 (0.341
MJ·m-2·d-1; Table 3). During operation of the polishing photocatalytic reactor (PC2)
series (12/1/2016 to 1/28/17), mean daily UV insolation increased from 0.999 MJ·m-2·d-1
during sampling period 1 to 1.390 MJ·m-2·d-1 during sampling period 3. Mean daily UV
insolation is the total UV insolation accumulated while pumps were conveying OSPW
through photoreactors divided by the duration of pumping in days. Despite overlapping
periods of operation, mean daily UV insolation during PC2 was greater than values
measured in the HCW series because PC2 reactor units were covered and pumps were not
activated during cloudy or inclement weather. Outflow from HCW series was cycled
through PC2 series until the UV insolation target of 1.5 MJ/m2 was reached. Volumes of
Page 90
76
HCW outflow were cycled through PC2 series over 28.0 to 48.8 h of direct sun exposure
and accumulated between 1.476 and 2.712 MJ/m2 of UV insolation. McQueen et al.
(2017b) measured between 0.85 to 1.65 MJ/m2 UV insolation during 12-h photoperiods
at the same location from May to June 2016.
Total precipitation accumulated during operation of the HCW series was 4.28 cm
(Table 3), which is less than the 17.16 cm predicted by climate normals for Clemson, SC
(NOAA, 2011). These weather conditions yielded negative water balances during
sampling periods 1 and 2, when between 31 and 39% of water was lost to
evapotranspiration in the HCW. A neutral water balance was observed during sampling
period 3. During operation of PC2, 10±4% (n=6) of volume was lost to evaporation.
3.3 Changes in NAFC class distribution and concentration
3.3.1 NAFC class distribution
ESI-Orbitrap MS determined that NAFC class distributions were altered by
photocatalysis and biodegradation in the hybrid CWTS (Figure 3). Untreated OSPW was
composed primarily of O2, O3, and O4 classes, with relative abundances of 40.3±1.8,
19.5±1.0, and 20.9±0.5%, respectively. Distributions of NAFC classes shifted towards
poly-oxygenated classes (i.e. O5-O9) after treatment in the hybrid pilot-scale CWTS.
During three sampling events, relative abundance of the O2 class decreased to 13.6±1.4%,
the O3 class increased initially and then decreased to initial values, and O4, O5, and O6
classes increased by factors of 1.2, 4.8, and 10.7, respectively. The progressive increase
in relative abundance of poly-oxygenated classes observed within the hybrid CWTS is
consistent with previous work on photocatalysis of OSPW and has been observed during
Page 91
77
biodegradation of NAs (Tomczyk et al., 2001; Martin et al., 2010; Marentette et al.,
2015a, Leshuk et al., 2016a). The shift of NAFCs towards higher oxygen content is
pertinent because poly-oxygenated NAs are less toxic than classical NAs in the O2 class
(Morandi et al., 2015; Yue et al., 2015a).
Mean relative abundance of the O2 class declined from 40.3±1.8% in untreated
OSPW to 28±6.1% in HCW series outflow (n=3 sampling periods). During sampling
periods 1 and 2, 58.4 and 52.5% of O2 class degradation occurring in the HCW series
took place in wetland cells (i.e. WC1, WC2-5). Decreases in relative abundance of the O2
class in the wetland cells were commensurate with increases in the O3 and O4 classes,
suggesting that biotransformation of compounds in the O3 and O4 classes was outpaced
by production of degradation intermediates. These speciation data support the occurrence
of aerobic degradation of NAFCs in wetland cells and indicate that decreases in
evapotranspiration-adjusted concentrations of NAFCs were caused predominantly by
transformation of compounds in the O2 class (Section 3.3.2). This observation is
consistent with studies by Han et al. (2008) and Martin et al. (2010), who observed
greater removal efficiencies for aerobic degradation of the O2 class compared to the O3
class, and with previous work identifying more abundant oxidized NAs in older OSPWs
subjected to greater extents of in situ biodegradation (Han et al., 2009; Marentette et al.,
2015a). However, the increase in relative abundance of poly-oxygenated classes and
decrease in the O2 class is contrary to Yue et al. (2015b), who observed declines in
relative abundance of O3 and O4 classes and increases in the O2 class in a continuous flow
fixed-bed biofilm reactor.
Page 92
78
Environmental conditions (i.e. nutrient concentrations, temperature, DO, and pH)
influence metabolic pathways, microbiome composition, and microbial abundance (Paris
et al., 1981), which in turn affect rates and extents of aerobic NA degradation (Paslawski
et al., 2009; Kinley et al., 2015). During sampling period 3, NAFCs concentrations and
relative abundance of the O2 class did not decrease in wetland cells (Figure 4 and Table
S2). Mean daily water temperature during sampling period 3 (6.91±2.62°C) was
significantly lower than during sampling periods 1 (16.72±3.43; p=<0.0001) and 2
(9.04±2.65; p=<0.0001). Kinley et al. (2015) found that when pH, DO, and nutrients
concentrations were non-limiting, a similar range of temperatures (5±1°C) decreased
microbial diversity and prolonged aerobic degradation of a commercial NA blend
(Fluka). Ratios of carbon to nitrogen and phosphorus (C:N=330:1; C:P=1200:1), DO
(2.84 to 8.25 mg/L), and pH (7.39 to 7.95) were supportive of aerobic degradation during
sampling period 3, suggesting that aerobic degradation of NAFCs was impaired by
temperature.
Fixed-film solar photocatalysis achieved greater decreases in NAFC class relative
abundance in less time than achieved by aerobic degradation in the wetland cells. Over
three sampling events, mean removal efficiency of the O2 class in PC1 was 18.7% over a
1-d HRT, compared to 14.8% over a 16-d HRT in the wetland cells (WC1, WC2-5). Over
a mean photoperiod of 38.3±8.1 h, PC2 decreased relative abundance of the O2 class
56.6% from inflow (31.3±2.7%) to outflow (13.5±1.4%), and increased relative
abundance of degradation intermediates in the O5, O6, and O7, classes by factors of 2.7,
5.5, and 13.7, respectively. Using photocatalysis over agitated TiO2 slurries, Leshuk et al.
Page 93
79
(2016a) observed similar shifts in class distribution and extensive degradation of NAFCs
within 14 h of sunlight exposure.
Changes in class distribution demonstrate that aerobic degradation and solar
fixed-film photocatalysis implemented sequentially in a hybrid pilot-scale CWTS can
alter composition of the organic fraction of OSPW. These processes were effective in
decreasing the relative abundance of the O2 class, which has been identified as the
primary source of toxicity within the organic fraction of NAs (Morandi et al., 2015; Yue
et al., 2015a; Hughes et al., 2017). Operation of the hybrid CWTS at mean daily
temperatures between 0 and 11°C suggests that biodegradation of NAFCs in the wetland
cells was impaired within this range. Polishing photocatalysis in fixed film photocatalytic
reactors targeting >1.5 MJ/m2 UV insolation altered class distributions of NAFCs
remaining after treatment in HCW series. The hybrid CWTS shifted NAFC classes from
regimes dominated by classical NAs (i.e., O2 class) to sparingly toxic poly-oxygenated
classes (i.e. O3-7) within 2-3 weeks, compared to natural attenuation processes (i.e.
biodegradation and photolysis) that may require months to years to achieve similar
alterations (Han et al., 2009; Toor et al., 2013a; Wan et al., 2014).
3.3.2 NAFC concentrations
Mean NA concentration, determined by derivatization and HPLC, in untreated
OSPW was 67±4 mg/L (n=9). During three sampling periods, the hybrid pilot-scale
CWTS decreased NA concentrations by 67±9% and 72±2% in Series A and B,
respectively. Mean NAFCs concentration decreased by 77.6±11.3% (n=3) from inflow
(43.1±5.9 mg/L) to outflow (10.4±6.0 mg/L) of the hybrid pilot-scale CWTS. Decreases
Page 94
80
in NA and NAFC concentrations occurred primarily in PC1 and PC2 (Figures 4, 5). For
example, mean NAFCs concentrations decreased from 43.4±9.6 to 34.5±4.9 mg/L
(19.5±6.8%) in PC1 and from 29.3±3.0 to 10.4±6.0 mg/L (69.3±15.7%) in PC2. UV
insolation during PC2 ranged from 1.48 to 2.71 MJ/m2, which was significantly greater
(p=0.0003) than insolation measured during PC1 (0.311 and 0.698 MJ/m2), accounting
for the greater removal efficiencies during polishing photocatalysis (PC2). Over three
sampling events, PC2 Series A and B achieved NA removal efficiencies (67±9 and
72±2% in Series A and B, respectively) similar to McQueen et al. (2017b), but required
greater UV insolation (2.07±0.59 and 2.02±0.64 MJ/m2 in Series A and B, respectively)
despite similarities in design. Rates of photocatalytic degradation of NAFCs in OSPW
decrease commensurately with temperature (Leshuk et al., 2016a,b). Mean daily
minimum and maximum temperatures reported in McQueen et al. (2017b) were greater
than values measured during operation of PC2 (17 to 36°C and 4 to 19°C, respectively),
and may account for differences in UV insolation required to achieved similar removal
efficiencies.
Between 31 and 39% of OSPW was lost to evapotranspiration in the HCW series
during sampling periods 1 and 2, increasing concentrations of conservative constituents
(e.g., Cl-, B) and masking treatment of recalcitrant OSPW organics. As a result, there
were not significant differences between mean NAFC concentrations in untreated OSPW
and outflow from WC5 (n=3 sampling periods; p=0.739; Figure 5). However, when
values are adjusted for evapotranspiration (Section 2.4; Eqn. 3) mean NAFC
concentration was significantly lower in WC5 outflow (p=0.0217) and decreased 29%
Page 95
81
relative to untreated OSPW (Figure 5). NA and NAFC concentration decreased within
PC1, but concentrations increased or did not change in the following wetland cells.
However, between PC1 and WC5, percent increases in Cl- concentration and conductivity
were greater than increases in NAFC and NA concentration (Tables S1, S3) suggesting
that OSPW organics were degraded partially in wetland cells (WC2-5) after PC1. For
example, Cl- increased 34% (Series A) and 39% (Series B) during sampling period 2,
while NAFC concentration increased 12.3% and NA concentrations increased 6% and
3% in Series A and Series B, respectively. Ranges of hydrosoil ORP, and DO
concentrations, and carbon to nitrogen and phosphorous ratios in wetland cells were
within ranges supportive of aerobic microbial degradation of NAs (Kinley et al., 2015;
McQueen et al., 2017b). In previous studies, continuous flow biofilm reactors achieved
NA removal efficiencies up to 38% at rates between 2.82 and 12.6 mg·L-1·d-1 (Hwang et
al., 2013; McKenzie et al., 2014), supporting removal of NAs by biodegradation in
engineered systems. Toor et al. (2013a) observed decrease in NAFC concentrations in
OSPW by 40% after 40 days in incubated wetland sediment microcosms when aeration
and nutrients were provided. Similar to Toor et al. (2013a), passive treatment
experiments utilizing macrophyte planted microcosms (Armstrong et al., 2009) and
wetland cells to mediate aerobic degradation measured increases or no changes in NAFC
concentration; (McQueen et al., 2017b). Armstrong et al., (2009), Toor et al., (2013a),
and McQueen et al., (2017b) measured decreases in toxicity irrespective of changes in
NA concentration, supporting the ability of microbial processes associated with wetland
Page 96
82
sediments and macrophytes to change exposures of OSPW via compositional alteration
of NAFCs.
3.4 Change in concentration of metals and metalloids
Mean As concentration in untreated OSPW was 0.026±0.004 mg/L (n=3 sampling
events), and decreased to 0.011±0.002 and 0.013±0.005 mg/L in outflows of HCW Series
A and B, respectively (Table 5). Arsenic concentrations decreased rapidly in the initial
wetland cells (WC1) and photocatalytic reactors (PC1; Figure S3), but mean
concentrations fluctuated between 0.008 and 0.013 mg/L in the remaining wetland cells
(WC2-5). Zn decreased from mean initial concentrations of 0.129±0.071 mg/L by 49±8
and 54 ±16% in outflows of HCW Series A and B, respectively (n=3 sampling events).
Zn concentrations decreased sharply in WC1 (Figure S3), but concentrations increased
slightly by the outflow of final wetland cells (WC5). Over three sampling events,
concentrations of Cu and Pb were not significantly different between untreated OSPW
and outflows from HCW series (Series A: p=0.25 for Cu, p=0.35 for Pb; Series B:
p=0.21 for Cu, p=0.64 for Pb). Boron concentrations increased slightly from 2.33±0.09
mg/L to 2.89±0.52 and 2.82±0.48 mg/L in HCW Series A and B, respectively. There
were no significant differences in mean concentrations of B, Cu, Pb, and Zn between
outflows of HCW and PC2 (Table S4).
Although concentrations of As and Zn were below WQC in samples collected
within HCW series (Figure S3), concentrations of all metals and metalloids in outflows of
HCW series exceeded conservative WQC (Table 2). However, when compared to
laboratory derived toxicity endpoints for C. dubia, concentrations of As, B, Cu, Pb, and
Page 97
83
Zn in all samples collected from HCW Series A and B outflow were less than toxicity
thresholds for C. dubia including: a 2-d LC50 of 2.4 mg As/L (Hu et al., 2012), a 14-d
LOEC of 18 mg B/L for reproduction (Hickey, 1989), a 7-d LOEC of 0.099 mg Cu/L
(Belanger and Cherry, 1990), 0.080 mg Pb/L (Zuiderveen and Birge, 1997), and 0.128
mg Zn/L for reproduction (Zuiderveen and Birge, 1997). Additionally, McQueen et al.
(2017a) and Verbeek (1994) concluded that metals are not a significant source of toxicity
in OSPW after observing no decrease in acute toxicity of OSPW to C. dubia and Vibrio
fischeri, respectively, after chelation of metals with ethylenediaminetetraacidic acid
(EDTA).
When concentrations of metals and metalloids measured in outflows of HCW
series were adjusted for evaporative and precipitative fluxes (Eqn. 3; Table 5), removal
efficiencies improved in sampling periods 1 and 2, and changed only slightly during
sampling period 3, which had a near neutral water balance. Arsenic removal efficiencies
during sampling periods 1 and 2 ranged from 30 to 59% prior to adjustment for
evaporation, and improved to between 53 and 74% after adjustment. Concentrations of
Zn decreased by 57±9.5% in HCW series during sampling periods 1 and 2 (n=4), and
mean removal efficiency improved to 72±7.7% after adjustment for evapotranspiration.
Prior to adjustment, B concentrations increased up to 46.5% from inflow to outflow of
HCW series. After adjustment, concentrations of B in outflows of Series A and B
decreased by 7.58±4.65 and 11.2±4.52% (n=3), respectively. After adjustment for
evapotranspiration, Cu and Pb concentrations decreased, but were not significantly
Page 98
84
different from initial concentrations in Series A (p=0.19; p=0.16) or Series B (p=0.55;
p=0.20).
Arsenic can be sequestered in wetland cells through co-precipitation with Fe/Mn
oxy-hydroxides, which form when bulk oxidizing conditions are achieved (i.e. DO>2.0
mg/L; ORP>-50mV; Lizama et al., 2011; Schwindaman et al., 2014). Over the duration
of three sampling periods, mean DO concentration was 3.64±2.15 and 8.96±1.69 mg/L in
WC1 and PC1, respectively, coinciding with precipitous decreases in As concentration
(Figure S3). Reddy and DeLaune (2008) and Jurinko (2012) found that co-precipitation
of Zn with oxyhydroxides is the dominant pathway for decreasing aqueous Zn
concentrations in wetlands at pH=6.5 to 8.0 and ORP = -50 to 250 mV. These ranges of
pH, DO, and ORP are consistent with values measured in A1 and B1 (Table S1), in
which mean Zn concentrations decreased from initial concentrations of 0.129±0.071 to
0.052±0.028 mg/L and 0.040±0.001 mg/L (n=3), respectively. Decreases in B
concentration, which were observed only after concentrations were adjusted for
evapotranspiration, are attributed to plant uptake for use in structural maintenance of cell
walls (Golbach and Wimmer, 2007). When all plants senesced during sampling period 3,
removal efficiencies of adjusted B concentrations decreased accordingly.
Pilot and full-scale CWTSs have decreased concentrations of Cu and Pb in
impaired waters, eliminating toxicity and meeting National Pollutant Discharge
Elimination System (NPDES) limits (Hawkins et al., 1997; Murray-Gulde et al., 2005b;
Huddleston et al., 2008; Johnson et al., 2008; Kanagy et al., 2008a). In a study by Kanagy
et al. (2008a), Cu concentrations decreased by 89% (from 0.89 to 0.099 mg/L) and Pb
Page 99
85
concentrations decreased by 93% (from 2.56 to 0.176 mg/L) over a 4-d HRT in a pilot-
scale CWTS assembled with T. latifolia and Schoenoplectus californicus. A full-scale
CWTS designed specifically to sequester Cu decreased mean acid-soluble Cu
concentration from 0.027±0.009 to 0.004±0.002 mg/L (85%; Murray-Gulde et al.,
2005b). These CWTSs contained wetland cells designed to promote bulk reducing
conditions (i.e. DO<2 mg/L; ORP =-250 to -50 mV) and production of AVS. In the
hybrid pilot-scale CWTS studied in the current investigation, AVS was produced in
micro-environments within the hydrosoil and detritus of wetland cells, but not in
sufficient quantities to decrease concentrations of Cu and Pb to below the most protective
WQC. To achieve compliance with WQC for Cu and Pb, future CWTSs for OSPW
should include “reducing cells” containing hydrosoil near saturation with AVS.
3.5 Change in survival and reproduction of Ceriodaphnia dubia
Survival of C. dubia in untreated OSPW was significantly less than laboratory
controls (i.e. moderately-hard water; USEPA, 2002) in sampling periods 1 and 2
(p=0.045 and p<0.0001, respectively; Table 6). Reproduction was impaired relative to
controls in inflow samples collected during sampling periods 1 and 3 (p<0.001 and
p<0.001, respectively). In sampling period 2, reproduction was not adversely affected in
surviving daphnids; however, only 2 out of 20 daphnids produced three broods. Survival
exceeded 95% in outflows of PC1 during all sampling periods (n=6). During sampling
periods 2 and 3, reproduction improved in PC1 outflows relative to untreated OSPW;
however, reproduction was significantly lower than controls in outflows from APC1 and
BPC1 during sampling period 1 (p<0.001 and p=0.042, respectively). Toxicity was
Page 100
86
eliminated in all HCW series outflow samples, except for HCW Series B during sampling
period 1, in which survival was significantly lower than the control (p=0.024).
Reproduction of daphnids exposed to outflow of PC2 Series B during sampling period 1
was also adversely affected. Toxicity was eliminated in all other samples collected from
PC2 series.
Adverse effects to survival and reproduction of C. dubia were eliminated at all
positions within the hybrid CWTS during sampling periods 2 and 3. During sampling
period 1, reproduction was impaired in outflows of APC1, BPC1, BPC2 In, and BPC2
Out, and mortality was statistically lower than the control in B5 outflow. Approximately
40% of OSPW loaded into HCW series was lost to evapotranspiration during the first
sampling period, increasing concentrations of recalcitrant constituents, most notably Cl-
and NAFCs. Process based manipulations have identified polar organics as the primary
source of acute toxicity in OSPW (McQueen et., 2017a; Verbeek, 1994); however, Zubot
et al. (2012) suggested that synergism between dissolved salts and NAFCs may impair
survival and reproduction of salinity-sensitive C. dubia (e.g., EC50 for C. dubia
reproduction = 461 mg Cl- /L; Zubot et al., 2012). Additionally, Nero et al. (2006) found
that the toxicity of NAFCs to juvenile yellow perch increased with salinity, resulting in
greater mortality and levels of gill proliferative relative to exposures of NAFCs alone. As
Cl- concentrations increased during sampling period 1, the relative abundance of acutely
toxic O2 NAFCs decreased. Changes in relative abundance of the O2 class were similar
during sampling period 1 and 2 (Table S2), but Cl- concentrations were up to 16% higher
in sampling period 1. As the primary driver of toxicity in OSPW, similar changes in
Page 101
87
relative abundance of O2 NAs should yield similar responses to C. dubia. The higher
frequency of impaired reproduction and survival in sampling period 1 may therefore be
attributed to synergism between increased concentrations of Cl- and NAFCs.
While rainbow trout and fathead minnows have been used extensively to measure
toxicity of NAFCs (Verbeek, 1994; Morandi et al., 2015, Marentette et al., 2015a,b),
sensitivity of C. dubia to OSPW organics and salts makes this species well suited for
measuring performance of passive treatment systems for OSPW, where extended HRTs
required for aerobic degradation of organics may increase concentrations of conservative
constituents due to evapotranspiration. C. dubia bioassays provide endpoints
representative of toxicity of the OSPW matrix as a whole, as opposed to the organic
fraction alone.
4.0 Conclusions
The hybrid pilot-scale CWTS decreased concentrations and changed compositions
of NAFCs in a specific OSPW by sequential implementation of fixed-film TiO2
photocatalytic reactors and aerobic degradation in wetland cells. Orbitrap MS showed
that this approach decreased NAFC concentrations by 75.9%, and shifted class
distributions from regimes dominated by acutely toxic O2 NAFCs (O2=40.3%, ∑O3–
9=45.0%) in untreated OSPW to sparingly toxic poly-oxygenated classes (O3–9;
O2=13.6%, ∑O3–9=77.0%). The initial wetland cells (WC1) removed TSS and O&G and
decreased attenuation of solar UV radiation in OSPW prior to treatment in the initial
photocatalytic reactors (PC1). Concentrations of As, B, Cu, Pb, and Zn in outflows from
hybrid constructed wetland (HCW) and polishing photocatalytic reactor series (PC2;
Page 102
88
Figure 1) exceeded protective WQC, but were below LOECs for C. dubia survival and
reproduction. Performance of the hybrid CWTS was influenced by weather conditions in
this outdoor pilot-scale experiment. During sampling periods 1 and 2, evapotranspiration
increased Cl- concentrations and masked removal of NAFC concentrations by aerobic
degradation in wetland cells. Changes in NAFC concentration and composition were
limited outside of the photocatalytic reactors in sampling period 3, suggesting that near-
freezing temperatures inhibited aerobic degradation in the wetland cells. Toxicity to C.
dubia was eliminated in all samples recovered from the hybrid CWTS during sampling
periods 2 and 3, but reproduction was impaired in 4 of 8 samples during the first
sampling event and was potentially caused by synergism between Cl- and residual
NAFCs.
Hybrid CWTSs offer a comprehensive approach for treating the wide range of
COCs in OSPW, as opposed to technologies which target NAFCs alone. Further
development of fixed-film photocatalytic reactors and determination NAFC
biodegradation kinetics in OSPW treated by photocatalysis will refine designs of future
hybrid CWTS experiments. Currently, there is a dearth of literature concerning the use of
constructed wetlands for treatment of OSPW and a scarcity of studies reporting
performance data for COCs in OSPW alongside biogeochemical conditions in
experimental wetlands. This study, which reports changes in distribution of NAFC
classes measured contemporaneously with biogeochemical conditions in a hybrid pilot-
scale CWTS, is a pertinent contribution to the growing body of literature supporting the
application of constructed wetlands for remediation of OSPW.
Page 103
89
5.0 References
Ajaero, C., McMartin, D.W., Peru, K.M., Bailey, J., Haakensen, M., Friesen, V., Martz,
R., Hughes, S.A., Brown, C., Chen, H., 2017. Fourier Transform Ion Cyclotron
Resonance Mass Spectrometry Characterization of Athabasca Oil Sand Process-
Affected Waters Incubated in the Presence of Wetland Plants. Energy & Fuels.
31, 1731-1740.
Alberta Energy Regulator (AER), 2016. Fluid Tailings Management for Oil Sands
Mining Projects. Oil Sands Conservation Act Directive 085. Alberta Energy
Regulator, Calgary, AB. https://www.aer.ca/documents/directives/
Directive085.pdf.
Alberta Environment and Parks (AEP), 2014. Environmental Quality Guidelines for
Alberta Surface Waters. Water Policy Branch, Policy Division, Edmonton, AB.
http://aep.alberta.ca/water/education-guidelines/documents/Environmental
QualitySurfaceWaters-2014.pdf.
Allen, E.W., 2008. Process water treatment in Canada’s oil sands industry: I. Target
pollutants and treatment objectives. Journal of Environmental Engineering and
Science. 7, 123-138.
Alley, B.L., Willis, B., Rodgers, J., Castle, J.W., 2013. Water depths and treatment
performance of pilot-scale free water surface constructed wetland treatment
systems for simulated fresh oilfield produced water. Ecological Engineering. 61,
190-199.
American Public Health Association (APHA), American Water Works Association,
Water Environment Federation, 2012. Standard methods for the examination of
water and wastewater, 21st edition. American Public Health Association, Port City
Press., Baltimore, MA.
Armstrong, S.A., Headley, J.V., Peru, K.M., Germida, J.J., 2009. Differences in
phytotoxicity and dissipation between ionized and nonionized oil sands
naphthenic acids in wetland plants. Environmental Toxicology and Chemistry. 28,
2167-2174.
Armstrong, S.A., Headley, J.V., Peru, K.M., Germida, J.J., 2008. Phytotoxicity of oil
sands naphthenic acids and dissipation from systems planted with emergent
aquatic macrophytes. Journal of Environmental Science and Health, Part A. 43,
36-42.
Beebe, D.A., Castle, J.W., Molz, F., Rodgers, J.H., 2014. Effects of evapotranspiration on
treatment performance in constructed wetlands: Experimental studies and
modeling. Ecological Engineering. 71, 394-400.
Belanger, S.E., and Cherry, D.S., 1990. Interacting effects of pH acclimation, pH, and
heavy metals on acute and chronic toxicity to Ceriodaphnia dubia (Cladocera).
Journal of Crustacean Biology. 10, 225-235.
Page 104
90
Bishay, F.S., 1998. The use of constructed wetlands to treat oil sands wastewater. Fort
McMurray, Alberta, Canada. University of Alberta. Masters Thesis.
Brient, J.A., Wessner, P.J., Doyle, M.N., 1995. Naphthenic acids. In: Encyclopedia of
Chemical Technology. Kroschwitz, J.I. (Ed.). John Wiley & Sons, New York.
1017-1029.
Brown, L.D., Pérez-Estrada, L., Wang, N., El-Din, M.G., Martin, J.W., Fedorak, P.M.,
Ulrich, A.C., 2013. Indigenous microbes survive in situ ozonation improving
biodegradation of dissolved organic matter in aged oil sands process-affected
waters. Chemosphere. 93, 2748-2755.
Brown, L.D., and Ulrich, A.C., 2015. Oil sands naphthenic acids: a review of properties,
measurement, and treatment. Chemosphere. 127, 276-290.
Canada's Oil Sands Innovation Alliance (COSIA), 2015. Passive Organics Treatment
Technology. Canada's Oil Sands Innovation Alliance, Calgary, AB.
http://www.cosia.ca/uploads/files/challenges/water/COSIA%20Challenge%20Wa
ter%20-%20Passive%20Organics%20Treatment %20Technology.pdf
Canadian Council of Ministers of the Environment (CCME), 2011. Canadian Water
Quality Guidelines for the Protection of Aquatic Life. Canadian environmental
quality guidelines, 1999. Canadian Council of Ministers of the Environment,
Winnipeg, MB. http://st-ts.ccme.ca/en/index.html.
Carpenter, S.R., Kitchell, J.F., Hodgson, J.R., 1985. Cascading trophic interactions and
lake productivity. Bioscience. 35, 634-639.
Clemente, J.S., and Fedorak, P.M., 2005. A review of the occurrence, analyses, toxicity,
and biodegradation of naphthenic acids. Chemosphere. 60, 585-600.
Cumulative Environmental Management Association (CEMA), 2014. Guidelines for
wetlands establishments on reclaimed oil sands leases. 3rd edition. Alberta
Environment, Fort McMurray, AB.
Environment and Climate Change Canada (ECCC), 2007. Biological test method: test of
reproduction and survival using the Cladoceran Ceriodaphnia dubia. EPS
1/RM/21 2nd edition. Environment and Climate Change Canada, Ottawa, ON.
Faulkner, S., Patrick, W., Gambrell, R., 1989. Field techniques for measuring wetland
soil parameters. Soil Science Society of America Journal. 53, 883-890.
Frank, R.A., Kavanagh, R., Burnison, B.K., Arsenault, G., Headley, J.V., Peru, K.M.,
Van Der Kraak, G., Solomon, K.R., 2008. Toxicity assessment of collected
fractions from an extracted naphthenic acid mixture. Chemosphere. 72, 1309-
1314.
Fujishima, A., Rao, T.N., Tryk, D.A., 2000. Titanium dioxide photocatalysis. Journal of
Photochemistry and Photobiology C: Photochemistry Reviews. 1, 1-21.
Page 105
91
Gillespie, W.B., Hawkins, W.B., Rodgers, J.H., Cano, M.L., Dorn, P.B., 2000. Transfers
and transformations of zinc in constructed wetlands: Mitigation of a refinery
effluent. Ecological Engineering. 14, 279-292.
Goldbach, H.E., and Wimmer, M.A., 2007. Boron in plants and animals: Is there a role
beyond cell‐wall structure? Journal of Plant Nutrition and Soil Science. 170, 39-
48.
Golder Associates, 2001. Oil Sands Regional Aquatics Monitoring Program (RAMP)
2000. Volume 1: Chemical and Biological Monitoring. Golder Associates Ltd.,
Calagary, AB.
Goodfellow, W.L., Ausley, L.W., Burton, D.T., Denton, D.L., Dorn, P.B., Grothe, D.R.,
Heber, M.A., Norberg‐King, T.J., Rodgers, J.H., 2000. Major ion toxicity in
effluents: a review with permitting recommendations. Environmental Toxicology
and Chemistry. 19, 175-182.
Grewer, D.M., Young, R.F., Whittal, R.M., Fedorak, P.M., 2010. Naphthenic acids and
other acid-extractables in water samples from Alberta: what is being measured?
Science of the Total Environment. 408, 5997-6010.
Haakensen, M., Pittet, V., Spacil, M.M., Castle, J.W., Rodgers Jr, J.H., 2015. Key aspects
for successful design and implementation of passive water treatment systems.
Journal of Environmental Solutions for Oil, Gas, and Mining. 1, 59-81.
Han, X., MacKinnon, M.D., Martin, J.W., 2009. Estimating the in situ biodegradation of
naphthenic acids in oil sands process waters by HPLC/HRMS. Chemosphere. 76,
63-70.
Han, X., Scott, A.C., Fedorak, P.M., Bataineh, M., Martin, J.W., 2008. Influence of
molecular structure on the biodegradability of naphthenic acids. Environmental
Science & Technology. 42, 1290-1295.
Hawkins, W.B., Rodgers, J.H., Gillespie, W., Dunn, A., Dorn, P., Cano, M., 1997.
Design and construction of wetlands for aqueous transfers and transformations of
selected metals. Ecotoxicology and Environmental Safety. 36, 238-248.
Haynes, W.M., 2014. CRC handbook of chemistry and physics. CRC Press. Boca Raton,
FL.
Headley, J.V., Du, J., Peru, K.M., McMartin, D.W., 2009. Electrospray ionization mass
spectrometry of the photodegradation of naphthenic acids mixtures irradiated with
titanium dioxide. Journal of Environmental Science and Health Part A. 44, 591-
597.
Headley, J.V., and McMartin, D.W., 2004. A review of the occurrence and fate of
naphthenic acids in aquatic environments. Journal of Environmental Science and
Health, Part A. 39, 1989-2010.
Page 106
92
Headley, J.V., Peru, K.M., Janfada, A., Fahlman, B., Gu, C., Hassan, S., 2011.
Characterization of oil sands acids in plant tissue using Orbitrap ultra‐high
resolution mass spectrometry with electrospray ionization. Rapid
Communications in Mass Spectrometry. 25, 459-462.
Headley, J.V., Peru, K.M., Fahlman, B., McMartin, D.W., Mapolelo, M.M., Rodgers,
R.P., Marshall, A.G., 2012. Comparison of the levels of chloride ions to the
characterization of oil sands polar organics in natural waters by use of Fourier
transform ion cyclotron resonance mass spectrometry. Energy & Fuels. 26(5),
2585-2590.
Health Canada, 2012. Guidelines for Canadian Recreational Water Quality, 3rd Edition.
Water, Air and Climate Change Bureau, Healthy Environments and Consumer
Safety Branch, Ottawa, ON. H129-15/2012E.
Herman, D.C., Fedorak, P.M., MacKinnon, M.D., Costerton, J., 1994. Biodegradation of
naphthenic acids by microbial populations indigenous to oil sands tailings.
Canadian Journal of Microbiology. 40, 467-477.
Hickey, C.W., 1989. Sensitivity of four New Zealand cladoceran species and Daphnia
magna to aquatic toxicants. New Zealand Journal of Marine and Freshwater
Research. 23, 131-137.
Hu, J., Wang, D., Forthaus, B.E., Wang, J., 2012. Quantifying the effect of nanoparticles
on As (V) ecotoxicity exemplified by nano‐Fe2O3 (magnetic) and nano‐Al2O3.
Environmental Toxicology and Chemistry. 31, 2870-2876.
Huddleston III, G.M., and Rodgers Jr, J.H., 2008. Design of a constructed wetland system
for treatment of copper-contaminated wastewater. Environmental Geosciences.
15, 9-19.
Huddleston, G.M., Gillespie, W.B., Rodgers, J.H., 2000. Using constructed wetlands to
treat biochemical oxygen demand and ammonia associated with a refinery
effluent. Ecotoxicology and Environmental Safety. 45, 188-193.
Hughes, S.A., Mahaffey, A., Shore, B., Baker, J., Kilgour, B., Brown, C., Peru, K.M.,
Headley, J.V., Bailey, H.C., 2017. Using ultrahigh-resolution mass spectrometry
and toxicity identification techniques to characterize the toxicity of oil sands
process-affected water: the case for classical naphthenic acids. Environmental
Toxicology and Chemistry. Online version of record, August 7, 2017.
Hwang, G., Dong, T., Islam, M.S., Sheng, Z., Pérez-Estrada, L.A., Liu, Y., El-Din, M.G.,
2013. The impacts of ozonation on oil sands process-affected water
biodegradability and biofilm formation characteristics in bioreactors. Bioresource
Technology. 130, 269-277.
Igunnu, E.T., and Chen, G.Z., 2012. Produced water treatment technologies. International
Journal of Low-Carbon Technologies. 9, 157-177.
Page 107
93
Inoue, T.M., and Tsuchiya, T., 2008. Interspecific differences in radial oxygen loss from
the roots of three Typha species. Limnology. 9, 207-211.
Johnson, B.M., Kanagy, L.E., Rodgers Jr, J.H., Castle, J.W., 2008. Feasibility of a pilot-
scale hybrid constructed wetland treatment system for simulated natural gas
storage produced waters. Environmental Geosciences. 15, 91-104.
Jurinko, K.N., 2012. Biogeochemical processes in hydrosoil of a pilot-scale constructed
wetland treatment system designed for treatment of metals. Clemson University,
Clemson, SC. Master’s Thesis.
Kanagy, L.E., Johnson, B.M., Castle, J.W., Rodgers, J.H., 2008a. Design and
performance of a pilot-scale constructed wetland treatment system for natural gas
storage produced water. Bioresource Technology. 99, 1877-1885.
Kanagy, L.E., Johnson, B.M., Castle, J.W., Rodgers Jr, J.H., 2008b. Hydrosoil conditions
in a pilot-scale constructed wetland treatment system for natural gas storage
produced waters. Environmental Geosciences. 15, 105-113.
Kinley, C.M., Gaspari, D.P., McQueen, A.D., Rodgers, J.H., Castle, J.W., Friesen, V.,
Haakensen, M., 2016. Effects of environmental conditions on aerobic degradation
of a commercial naphthenic acid. Chemosphere. 161, 491-500.
Lai, J.W., Pinto, L.J., Bendell‐Young, L.I., Moore, M.M., Kiehlmann, E., 1996. Factors
that affect the degradation of naphthenic acids in oil sands wastewater by
indigenous microbial communities. Environmental Toxicology and Chemistry.
15, 1482-1491.
Lehman, R.W., Gladden, J.B., Bell, J.F., Rodgers Jr., J.H., Murray-Gulde, C., Mooney,
F.D., 2002. Wetlands for industrial wastewater treatment at the Savannah River
Site. Westinghouse Savannah River Company (WSRC) Report Number: WSRC-
MS-2002-00161. WSRC, Aiken, SC.
Leonard, E.N., Ankley, G.T., Hoke, R.A., 1996. Evaluation of metals in marine and
freshwater surficial sediments from the Environmental Monitoring and
Assessment Program relative to proposed sediment quality criteria for metals.
Environmental Toxicology and Chemistry. 15, 2221-2232.
Leshuk, T., Wong, T., Linley, S., Peru, K.M., Headley, J.V., Gu, F., 2016a. Solar
photocatalytic degradation of naphthenic acids in oil sands process-affected water.
Chemosphere. 144, 1854-1861.
Leshuk, T., de Oliveira Livera, D., Peru, K.M., Headley, J.V., Vijayaraghavan, S., Wong,
T., Gu, F., 2016b. Photocatalytic degradation kinetics of naphthenic acids in oil
sands process-affected water: Multifactorial determination of significant factors.
Chemosphere. 165, 10-17.
Lizama, K., Fletcher, T.D., Sun, G., 2011. Removal processes for arsenic in constructed
wetlands. Chemosphere. 84, 1032-1043.
Page 108
94
MacKinnon, M.D., and Boerger, H., 1986. Description of two treatment methods for
detoxifying oil sands tailings pond water. Water Quality Research Journal of
Canada. 21, 496-512.
Madill, R.E., Orzechowski, M.T., Chen, G., Brownlee, B.G., Bunce, N.J., 2001.
Preliminary risk assessment of the wet landscape option for reclamation of oil
sands mine tailings: bioassays with mature fine tailings pore water.
Environmental Toxicology. 16, 197-208.
Mahaffey, A., and Dubé, M., 2016. Review of the composition and toxicity of oil sands
process-affected water. Environmental Reviews. 25, 97-114.
Malato, S., Fernández-Ibáñez, P., Maldonado, M.I., Blanco, J., Gernjak, W., 2009.
Decontamination and disinfection of water by solar photocatalysis: recent
overview and trends. Catalysis Today. 147, 1-59.
Marentette, J.R., Frank, R.A., Bartlett, A.J., Gillis, P.L., Hewitt, L.M., Peru, K.M.,
Headley, J.V., Brunswick, P., Shang, D., Parrott, J.L., 2015. Toxicity of
naphthenic acid fraction components extracted from fresh and aged oil sands
process-affected waters, and commercial naphthenic acid mixtures, to fathead
minnow (Pimephales promelas) embryos. Aquatic Toxicology. 164, 108-117.
Marentette, J.R., Frank, R.A., Hewitt, L.M., Gillis, P.L., Bartlett, A.J., Brunswick, P.,
Shang, D., Parrott, J.L., 2015. Sensitivity of walleye (Sander vitreus) and fathead
minnow (Pimephales promelas) early-life stages to naphthenic acid fraction
components extracted from fresh oil sands process-affected waters.
Environmental Pollution. 207, 59-67.
Martin, J.W., Barri, T., Han, X., Fedorak, P.M., El-Din, M.G., Perez, L., Scott, A.C.,
Jiang, J.T., 2010. Ozonation of oil sands process-affected water accelerates
microbial bioremediation. Environmental Science & Technology. 44, 8350-8356.
McKenzie, N., Yue, S., Liu, X., Ramsay, B.A., Ramsay, J.A., 2014. Biodegradation of
naphthenic acids in oils sands process waters in an immobilized soil/sediment
bioreactor. Chemosphere. 109, 164-172.
McNeely, R.N., Neimanis, V.P., Dwyer, L., 1979. Water quality sourcebook: a guide to
water quality parameters. In: Water Quality Sourcebook: A Guide to Water
Quality Parameters. Environment Canada, Gatineau, QC.
McQueen, A.D., Kinley, C.M., Hendrikse, M., Gaspari, D.P., Calomeni, A.J., Iwinski,
K.J., Castle, J.W., Haakensen, M.C., Peru, K.M., Headley, J.V., 2017a. A risk-
based approach for identifying constituents of concern in oil sands process-
affected water from the Athabasca Oil Sands region. Chemosphere. 173, 340-350.
McQueen, A.D., Hendrikse, M., Gaspari, D.P., Kinley, C.M., Rodgers, J.H., Castle, J.W.,
2017b. Performance of a hybrid pilot-scale constructed wetland system for
treating oil sands process-affected water from the Athabasca oil sands. Ecological
Engineering. 102, 152-165.
Page 109
95
Mikula, R., 2013. Trading water for oil: Tailings management and water use in surface-
mined oil sands. In: Hein, F.J., Leckie, D., Larter, S., Suter, J.R. (Eds.). Heavy Oil
and Oil-Sand Petroleum Systems in Alberta and Beyond. AAPG Studies in
Geology 64: 1, 689-699. American Association of Petroleum Geologists (AAPG)
Special Volumes.
Morandi, G.D., Wiseman, S.B., Pereira, A., Mankidy, R., Gault, I.G., Martin, J.W.,
Giesy, J.P., 2015. Effects-directed analysis of dissolved organic compounds in oil
sands process-affected water. Environmental Science & Technology. 49, 12395-
12404.
Murray-Gulde, C.L., Bearr, J., Rodgers, J.H., 2005a. Evaluation of a constructed wetland
treatment system specifically designed to decrease bioavailable copper in a
wastestream. Ecotoxicology and Environmental Safety. 61, 60-73.
Murray-Gulde, C.L, Heatley, J.E., Karanfil, T., Rodgers, J.H., Myers, J.E., 2003.
Performance of a hybrid reverse osmosis-constructed wetland treatment system
for brackish oil field produced water. Water Research. 37, 705-713.
Murray-Gulde, C.L., Huddleston, G.M., Garber, K.V., Rodgers, J.H., 2005b.
Contributions of Schoenoplectus californicus in a constructed wetland system
receiving copper contaminated wastewater. Water, Air, & Soil Pollution. 163,
355-378.
National Oceanic and Atmospheric Administration (NOAA), 2011. 1981-2010 Climate
Normals: Clemson University. National Centers for Environmental Information,
Asheville, NC. South Carolina State Climatology Office Climate Data.
http://www.dnr.sc.gov/climate/sco/ClimateData/8110Normals.php.
National Weather Service (NWS), 2017. Hourly Weather Forecast. Greenville-
Spartanburg National Weather Service Forecast Office, Clemson, SC.
http://forecast.weather.gov/MapClick.php?map.x=115&map.y=187&marine=0&s
ite=GSP&zmx=1&zmy=1&FcstType=graphical&lat=&lon=.
Nelson, E.A., and Gladden, J.B., 2008. Full-scale treatment wetlands for metal removal
from industrial wastewater. Environmental Geosciences. 15, 39-48.
Nero, V., Farwell, A., Lee, L., Van Meer, T., MacKinnon, M., Dixon, D., 2006. The
effects of salinity on naphthenic acid toxicity to yellow perch: gill and liver
histopathology. Ecotoxicology and Environmental Safety. 65, 252-264.
Norberg-King, T., 1992. Toxicity identification evaluation: Characterization of
chronically toxic effluents: Phase I. EPA/600/6-91/005F. US Environmental
Protection Agency, Office of Research and Development, Environmental
Research Laboratory. Duluth, MN.
Pardue, M.J., Castle, J.W., Rodgers, J.H., Huddleston, G.M., 2014. Treatment of oil and
grease in produced water by a pilot-scale constructed wetland system using
biogeochemical processes. Chemosphere. 103, 67-73.
Page 110
96
Paris, D.F., Steen, W.C., Baughman, G.L., Barnett, J.T., 1981. Second-order model to
predict microbial degradation of organic compounds in natural waters. Applied
and Environmental Microbiology. 41, 603-609.
Paslawski, J.C., Headley, J.V., Hill, G.A., Nemati, M., 2009. Biodegradation kinetics of
trans-4-methyl-1-cyclohexane carboxylic acid. Biodegradation. 20, 125-133.
Pennak, R.W., 1978. Freshwater invertebrates of the United States, 2nd ed. John Wiley &
Sons.
Quagraine, E., Headley, J., Peterson, H., 2005. Is biodegradation of bitumen a source of
recalcitrant naphthenic acid mixtures in oil sands tailing pond waters? Journal of
Environmental Science and Health. 40, 671-684.
Quinlan, P.J., and Tam, K.C., 2015. Water treatment technologies for the remediation of
naphthenic acids in oil sands process-affected water. Chemical Engineering
Journal. 279, 696-714.
Reddy, K.R., and DeLaune, R.D., 2008. Biogeochemistry of wetlands: science and
applications. CRC Press, Boca Raton, FL.
Rodgers Jr, J.H., and Castle, J.W., 2008. Constructed wetland systems for efficient and
effective treatment of contaminated waters for reuse. Environmental Geosciences.
15, 1-8.
Romanova, U.G., Yarranton, H.W., Schramm, L.L., Shelfantook, W.E., 2004.
Investigation of oil sands froth treatment. The Canadian Journal of Chemical
Engineering. 82, 710-721.
Roy, J., Bickerton, G., Frank, R., Grapentine, L., Hewitt, L., 2016. Assessing risks of
shallow riparian groundwater quality near an oil sands tailings pond.
Groundwater. 54, 545-558.
Schramm, L.L., 2000. Surfactants: fundamentals and applications in the petroleum
industry. Cambridge University Press. Cambridge, UK.
Schwindaman, J.P., Castle, J.W., Rodgers, J.H., 2014. Biogeochemical Process-Based
Design and Performance of a Pilot-Scale Constructed Wetland for Arsenic
Removal from Simulated Bangladesh Groundwater. Water, Air, & Soil Pollution.
225, 2009-2020.
Scott, A.C., Mackinnon, M.D., Fedorak, P.M., 2005. Naphthenic acids in Athabasca oil
sands tailings waters are less biodegradable than commercial naphthenic acids.
Environmental Science & Technology. 39, 8388-8394.
Shell Canada, 2016. Oil Sands Performance Report 2015. Shell Canada Limited,
http://s01.static-shell.com/content/dam/royaldutchshell/documents/corporate/she-
2055-oil-sands-performance-report-2015-final1.pdf.
Tissot, B.P., and Welte, D.H., 1978. Petroleum Formation and Occurrence, 2nd Edition.
Springer Science, New York, NY.
Page 111
97
Tomczyk, N., Winans, R., Shinn, J., Robinson, R., 2001. On the nature and origin of
acidic species in petroleum. 1. Detailed acid type distribution in a California crude
oil. Energy & Fuels. 15, 1498-1504.
Toor, N.S., Franz, E.D., Fedorak, P.M., MacKinnon, M.D., Liber, K., 2013a. Degradation
and aquatic toxicity of naphthenic acids in oil sands process-affected waters using
simulated wetlands. Chemosphere. 90, 449-458.
Toor, N.S., Han, X., Franz, E., MacKinnon, M.D., Martin, J.W., Liber, K., 2013b.
Selective biodegradation of naphthenic acids and a probable link between mixture
profiles and aquatic toxicity. Environmental Toxicology and Chemistry. 32, 2207-
2216.
United States Environmental Protection Agency (USEPA), 2007. National recommended
water quality criteria-correction. EPA 822-Z-99–001. Office of Water,
Washington, DC.
United States Environmental Protection Agency (USEPA), 2002. Short-term methods for
estimating the chronic toxicity of effluents and receiving waters to freshwater
organisms. 4th Edition. EPA-821-R-02-013. Environmental Monitoring Systems
Lab, Cincinnati, OH.
United States Environmental Protection Agency (USEPA), 2001. Trace elements in
water, solids, and biosolids by inductively coupled plasma-atomic emission
spectrometry. 5th Revision. EPA Method 200.7. EPA-821-R-01-010. Office of
Water, Washington, DC.
United States Environmental Protection Agency (USEPA), 1999. Revision A: n-hexane
extractable material (HEM; oil and grease) and silica gel treated n-hexane
extractable material (SGTHEM; non-polar material) by extraction and gravimetry.
EPA Method 1664. EPA-821-R-10-001. Office of Water, Washington, DC.
United States Environmental Protection Agency (USEPA), 1991. Technical support
document for water quality based toxics control. EPA/505/2-90-001. Office of
Water, Washington, DC.
Verbeek, A.G., 1994. A toxicity assessment of oil sands wastewater. University of
Alberta, Edmonton, AB. Master's Thesis.
Vymazal, J., 2013. Emergent plants used in free water surface constructed wetlands: a
review. Ecological Engineering. 61, 582-592.
Vymazal, J., 2010. Constructed wetlands for wastewater treatment: five decades of
experience. Environmental Science & Technology. 45, 61-69.
Wan, Y., Wang, B., Khim, J.S., Hong, S., Shim, W.J., Hu, J., 2014. Naphthenic acids in
coastal sediments after the Hebei spirit oil spill: a potential indicator for oil
contamination. Environmental Science & Technology. 48, 4153-4162.
Page 112
98
Weather Underground, 2017. Station ID: KCEU Station Name: Oconee County Regional.
February 3, 2017. https://www.wunderground.com/history/airport/KCEU/
DailyHistory.html.
Yen, T., Marsh, W.P., MacKinnon, M.D., Fedorak, P.M., 2004. Measuring naphthenic
acids concentrations in aqueous environmental samples by liquid
chromatography. Journal of Chromatography A. 1033, 83-90.
Yue, S., Ramsay, B.A., Wang, J., Ramsay, J., 2015. Toxicity and composition profiles of
solid phase extracts of oil sands process-affected water. Science of the Total
Environment. 538, 573-582.
Zayani, G., Bousselmi, L., Mhenni, F., Ghrabi, A., 2009. Solar photocatalytic degradation
of commercial textile azo dyes: performance of pilot plant scale thin film fixed-
bed reactor. Desalination. 246, 344-352.
Zubot, W., MacKinnon, M.D., Chelme-Ayala, P., Smith, D.W., El-Din, M.G., 2012.
Petroleum coke adsorption as a water management option for oil sands process-
affected water. Science of the Total Environment. 427, 364-372.
Zuiderveen, J.A., Birge, W.J., 1997. The relationship between chronic values in toxicity
tests with Ceriodaphnia dubia. In: Environmental Toxicology and Risk
Assessment: Modeling and Risk Assessment Sixth Volume. ASTM International,
West Conshohocken, PA.
Page 113
99
Figure 1. Diagram of hybrid pilot-scale CWTS (not to scale). The CWTS is composed of
a hybrid constructed wetland (HCW) and a polishing photocatalytic reactor (PC2). The
HCW consists of duplicate series (Series A and B), each containing wetland cells (WC1-
5) and an initial photocatalytic reactor (PC1), composed of 4 individual reactor units.
FMI piston pumps, calibrated to achieve a nominal hydraulic retention time (HRT) of 16
d, conveyed OSPW from a storage tank to HCW series. Outflows from HCW series were
collected, transferred to PC2 inflow tanks, and circulated through PC2 series (APC2,
BPC2) until exposed to >1.5 MJ/m2 UV insolation.
Figure 2. Mean relative abundance of naphthenic acid fraction component (NAFC)
classes in OSPW measured by electrospray ionization Orbitrap mass spectrometry
following weak anion exchange (WAX) extraction according to Ajaero et al. (2017).
Error bars represent one standard deviation (n=4).
Figure 3. Mean relative abundance of NAFC classes in hybrid pilot-scale CWTS
measured over three sampling periods by electrospray ionization Orbitrap mass
spectrometry, which was conducted by Dr. John Headley’s laboratory at the National
Hydrology Research Centre in Saskatoon, SK. Samples were collected from untreated
OSPW influent (inflow), outflows from initial wetland cells (WC1), initial photocatalytic
reactors (PC1), and final wetland cells (WC5), and polishing photocatalytic reactor (PC2)
inflow and outflow (Section 2.3). Orbitrap-MS was conducted on composite samples
from replicate Series A and B (Figure 1). Error bars indicate ± one standard deviation.
NAFC classes with relative abundance <1% at all positions in the hybrid pilot-scale
CWTS were not included in this graph.
Page 114
100
Figure 4. A) Change in concentration of NAs relative to nominal hydraulic retention time
(HRT) during three sampling periods in hybrid constructed wetland (HCW) Series A. B)
Change in NA concentration in HCW Series B. C) Change in concentration of NAFCs in
composite samples from HCW Series A and B (Section 2.3). NAFC concentrations were
measured by Orbitrap mass spectrometry in Dr. John Headley’s laboratory at the National
Hydrology Research Centre in Saskatoon, SK, and NA concentrations were measured by
derivatization and HPLC.
Figure 5. A) NAFC and NA concentrations averaged over three sampling periods in
hybrid constructed wetland (HCW) and polishing photocatalytic reactor (PC2) Series A
and B. B) Mean NAFC and NA concentrations adjusted for volumes lost to
evapotranspiration in HCW and PC2 Series A and B (Section 2.4; Eqn. 3). NAFC
concentrations were determined by Orbitrap mass spectrometry of composite samples
from Series A and B (Section 2.3), and NA concentrations were measured by
derivatization and HPLC in samples from each series. Concentrations were measured in
HCW and PC2 inflows (Inflow and PC2 In, respectively) and outflows (WC5 and PC2
Out, respectively). Error bars are one standard deviation (n=3).
Page 120
106
Table 1. Identification of constituents of concern (COC) in samples of oil sands process-
affected water (OSPW) by comparison of water quality characteristics and concentrations
of nutrients and major ions with lowest water quality criteria (WQC) from regulatory
agencies including United States Environmental Protection Agency (USEPA, 2007),
Canadian Council of Ministers of the Environment (CCME, 2011), and Alberta
Environment and Parks (AEP, 2014).
Parameter
(mg/L, unless noted)
Concentration in OSPW Regulatory
Agency
Water
Quality
Criteria
COC
Mean (n=4) (Min – Max) Yes/No
Water quality characteristics and nutrients
pH (S.U.) 8.76 (8.62 – 8.91) USEPA 6.5-9.0 No
Conductivity (µS/cm) 1883 (1863 – 1929) – – No
Alkalinity (mg/L as CaCO3) 348 (304 – 368) USEPA 20a No
Hardness (mg/L as CaCO3) 125 (116 – 132) – – No
Total dissolved solids (TDS) 1386 (1026 – 1546) – – No
Total suspended solids (TSS) 44 (6 – 113) CCME * Yes
Total ammonia (N) 0.036 (<0.014 – 0.056) CCME 0.17-1.5b No
Total phosphorus (P) 0.069 (<0.020 – 0.174) CCME 0.01-0.02c Nod
Major ions
– –
Bicarbonate (HCO3-) 382 (326 – 415) – – No
Calcium (Ca2+) 18 (10 – 21) CCME 1000 No
Carbonate (CO32-) 35 (<2 – 100) – – No
Chloride (Cl-) 256 (248 – 260) CCME 120 Yes
Magnesium (Mg2+) 20 (19 – 21) – – No
Potassium (K+) 22 (21 – 23) – – No
Sodium (Na+) 390 (378 – 398) – – No
Sulfate (SO42-) 90 (88 – 92) AEP 309e No
“–” Water quality criteria not available for characteristic or constituent
a Minimum threshold
b Temperature range from 5 to 20°C and pH range from 8.0 to 8.5 S.U.
c Trigger range for mesotrophic lakes and rivers
d Measured range considered beneficial to processes in constructed wetlands
e Hardness from 76 to 180 mg/L
* TSS cannot increase more than 25 mg/L above background level in receiving water body over a 24-h period
Page 121
107
Table 2. Identification of constituents of concern (COC) in samples of oil sands process-
affected water (OSPW) by comparison of concentrations of organics and acid soluble
metal and metalloids with lowest water quality criteria (WQC) from regulatory agencies
including United States Environmental Protection Agency (USEPA, 2007) and Canadian
Council of Ministers of the Environment (CCME, 2011).
Parameter (mg/L) Concentration in OSPW Regulatory
Agency
Water
Quality
Criteria
COC
Mean (n=4) (Min - Max) Yes/No
Metals and metalloids
Aluminum 0.058 (0.050 – 0.066) USEPA 0.087 No
Arsenic 0.026 (0.022 – 0.029) CCME 0.005 Yes
Barium 0.200 (0.175 – 0.220) – – No
Boron 2.218 (2.114 – 2.425) CCME 1.5 Yes
Cadmium 0.0002 (<0.0002 – <0.0002) CCME 0.00038a No
Cobalt 0.0023 (0.0005 – 0.0035) – – No
Chromium 0.004 (<0.004 – <0.004) CCME 0.0089 No
Copper 0.013 (0.010 – 0.016) CCME 0.0024a Yes
Iron 0.100 (0.018 – 0.218) CCME 0.3b No
Lead 0.012 (0.011 – 0.012) USEPA 0.0025 Yes
Manganese 0.015 (<0.010 – 0.022) CCME 0.2 No
Nickel 0.008 (0.006 – 0.009) CCME 0.0096 No
Selenium 0.002 (<0.002 – <0.002) USEPA 0.0031 No
Zinc 0.081 (0.010 – 0.208) CCME 0.03 Yes
Organics
Naphthenic acid fraction
components (NAFCs)c
47.8 (39.4 – 57.8) * * Yes
Naphthenic acids (NAs)d 71 (61 – 89) * * Yes
Oil and grease (O&G) 16 (5 – 30) ** ** Yes
“–” Water quality criteria not available for constituent a Hardness: 100 mg/L as CaCO3 b Dissolved fraction c Measured by electrospray ionization Orbitrap mass spectrometry (ESI-Orbitrap MS)
d Measured by HPLC
* “No toxics in toxic amounts” (USEPA, 1991)
** No visible sheen, film, or discoloration (Health Canada, 2011)
Page 122
108
Table 3. Inflow and outflow volumes, precipitation, ambient air temperature, and UV insolation during sampling periods in
hybrid constructed wetland (HCW) and polishing photocatalytic reactor (PC2) Series A and B.
Sampling
Period
Start
Date End Date
Inflow (L) Outflow (L) Cumul.
Precip.
(cm)a
Temperaturea UV Insolation
Series
A
Series
B
Series
A
Series
B
Min.
(°C)
Max.
(°C)
Mean Daily
(MJ·m-2·d-1)b
Series A
(MJ·m-2)c
Series B
(MJ·m-2)c
Hybrid constructed wetland (HCW)
1 10/14/16 10/31/16 240 241 146 147 0.00 14 27 0.690 0.682 0.698
2 11/9/16 11/26/17 258 250 179 168 0.18 6 20 0.461 0.315 0.311
3 12/9/16 12/20/17 245 246 247 244 4.10 0 11 0.341 0.545 0.484
Polishing photocatalytic reactors (PC2)
1 12/1/16 12/15/16 104 107 88 95 NAd 4 12 0.999e 1.476 1.453
2 12/21/16 1/10/17 90 93 84 90 NAd 4 13 1.106e 2.084 1.883
3 1/12/17 1/28/17 107 107 93 98 NAd 9 19 1.342e 2.650 2.712 a Cumulative precipitation (cumul. precip.) and mean daily minimum and maximum temperature during each sampling period measured at local
station: https://www.wunderground.com/history/airport/KCEU b UV insolation accumulated during operation of photocatalytic reactors (i.e. when OSPW was pumped through uncovered photoreactors) divided
by duration of pumping in days c UV insolation measured during collection of samples from initial photocatalytic reactor (PC1) in HCW series and from outflow of final reactor
units in PC2 series d Not applicable (NA). Reactors were covered during precipitation events e Photocatalytic reactors were only operated when exposed to direct sunlight and were covered during cloudy and inclement weather. Mean daily
UV insolation in PC2 is thus equivalent to total UV insolation divided by photoperiod in days.
Page 123
109
Table 4. Changes in concentrations of oil and grease (O&G) and total suspended solids
(TSS) measured in hybrid constructed wetland (HCW) Series A and B.
Sampling
Period
Inflow
(mg/L)
Outflow (mg/L) Percent Removal
Series A Series B Series A Series B
Oil and grease (O&G)*,**
1 5 <4 <4 20 20
2 30 <4 <4 87 87
3 11 <4 <4 64 64
Mean (±SD) 15 (±13) <4 (±0) <4 (±0) 57 (±34) 57 (±34)
Total suspended solids (TSS)**
1 11 8 8 33 26
2 69 <4 <4 94 94
3 89 7 9 92 90
Mean (±SD) 56 (±40) 6 (±2) 7 (±3) 73 (±35) 70 (±38)
* Samples of O&G collected at outflow of initial wetland cells (WC1)
** Detection limit for O&G and TSS is 4 mg/L
Page 124
110
Table 5. Changes in metal and metalloid concentration from inflow to outflow of hybrid constructed wetland (HCW) series
during three sampling events. Adjusted concentrations are reported to assess changes in concentration independent of
evaporation, transpiration, and precipitation (Section 2.4; Eqn. 3).
Sampling
Period
Inflow
(mg/L)
Concentration Adjusted Concentration Outflow (mg/L) Percent Removal Outflow (mg/L) Percent Removal Series A Series B Series A Series B Series A Series B Series A Series B
Arsenic
1 0.022
0.010 0.012
57 48
0.006 0.007
74 68
2 0.027
0.011 0.019
59 30
0.008 0.013
72 53
3 0.029
0.013 0.010
54 65
0.013 0.010
54 66
Mean (±SD) 0.026 (±0.004) 0.011 (±0.002) 0.013 (±0.005)
57 (±2) 48 (±17)
0.009 (±0.004) 0.010 (±0.003)
66 (±10.9) 62 (±7.9)
Boron
1 2.31
3.39 3.24
-46.5 -40.1
2.06 1.98
10.9 14.5
2 2.25
2.93 2.91
-30.3 -29.5
2.03 1.96
9.59 13.0
3 2.43
2.35 2.30
3.05 5.28
2.37 2.28
2.26 6.05
Mean (±SD) 2.33 (±0.09)
2.89 (±0.52) 2.82 (±0.48) -24.6 (±25.3) -21.4 (±23.7)
2.15 (±0.19) 2.07 (±0.18)
7.58 (±4.65) 11.2 (±4.52)
Copper
1 0.016
0.020 0.036
-25 -120
0.012 0.022
24 -37
2 0.016
0.016 0.021
3.1 -28
0.011 0.014
33 14
3 0.014
0.016 0.016
-11 -11
0.016 0.015
-12 -9.8
Mean (±SD) 0.015 (±0.001) 0.017 (±0.003) 0.024 (±0.011)
-11 (±14) -53 (±59)
0.013 (±0.003) 0.017 (±0.004)
15 (±24) -11 (±26)
Lead
1 0.012
0.012 0.011
0.0 8.3
0.007 0.007
39 44
2 0.011
0.014 0.010
-27 17
0.010 0.007
12 44
3 0.011
0.011 0.012
0.0 -9.1
0.011 0.012
-0.8 -8.2
Mean (±SD) 0.011 (±0.001) 0.012 (±0.002) 0.011 (±0.001)
-9.1 (±16) 5.3 (±13)
0.009 (±0.002) 0.008 (±0.003)
17 (±20) 27 (±30)
Zinc
1 0.208
0.089 0.061
57 71
0.054 0.037
74 82
2 0.107
0.055 0.050
49 53
0.038 0.034
64 69
3 0.071
0.042 0.044
41 39
0.042 0.043
40 39
Mean (±SD) 0.129 (±0.071) 0.062 (±0.024) 0.052 (±0.009) 49 (±8) 54 (±16) 0.045 (±0.008) 0.038 (±0.005) 60 (±17) 63 (±22)
Page 125
111
Table 6. Percent survival and reproduction of C. dubia in static renewal, 7-day bioassays
conducted according to Environment and Climate Change Canada protocols for single-
concentration tests (ECCC, 2007). Samples were compared to laboratory controls to
determine if survival and reproduction were impaired (⍺=0.05). Comprehensive toxicity
data are presented in supplementary data (Table S5).
Treatment Percent Survival Reproduction
Series A Series B Series A Series B
Sampling Period 1
Inflow 70%
Impaired
PC1 100% 100%
Impaired Impaired
WC5 90% 75%
No effect No effect
PC2 In 100% 95%
No effect Impaired
PC2 Out 95% 95%
No effect Impaired
Sampling Period 2
Inflow 20%
No effect*
PC1 100% 100%
No effect No effect
WC5 100% 95%
No effect No effect
PC2 In 100% 90%
No effect No effect
PC2 Out 100% 100%
No effect No effect
Sampling Period 3
Inflow 90%
Impaired
PC1 100% 95%
No effect No effect
WC5 90% 90%
No effect No effect
PC2 In 90% 80%
No effect No effect
PC2 Out 80% 85% No effect No effect
*Only 2 out of 20 initial daphnids produced three broods, but
reproduction was not inhibited in these two replicates
Page 126
112
CHAPTER IV
CONCLUSIONS
This thesis investigated the application of hybrid constructed wetland treatment
systems (CWTSs) to mitigate risks associated with oil sands process-affected water
(OSPW) by decreasing concentrations and altering compositions of constituents of
concern (COCs) in a specific OSPW. Solar photocatalysis over settled TiO2 was
investigated as an advanced oxidation process to degrade naphthenic acids (NAs) in
OSPW and decrease toxicity to sentinel aquatic organisms. Following this proof of
concept experiment, flow-through TiO2 fixed-film photocatalytic reactors were
implemented into a hybrid pilot-scale CWTS. The major objectives of this thesis were to
1) measure rates and extents of NA degradation and responses of sentinel aquatic
organisms in OSPW treated by solar photocatalysis over settled TiO2, and 2) to measure
the performance of a hybrid pilot-scale CWTS treating a specific OSPW.
Measure rates and extents of NA degradation and responses of sentinel aquatic
organisms in OSPW treated by solar photocatalysis over settled-TiO2
A first-order investigation of film-based photocatalysis was conducted by
assembling photocatalytic batch reactors consisting of thin films (~0.5 mm) of TiO2
settled in OSPW and comparing changes in NA concentration and toxicity between
photocatalytic, photolytic, and dark control reactors. Rates and extents of NA mass and
concentration removal were calculated with respect to photoperiod and cumulative solar
UV radiation (UV insolation). Specific objectives were to: 1) measure absorption and
attenuation of UV radiation in a specific OSPW, 2) measure rates and extents of NA
degradation with respect to UV insolation in settled TiO2 photocatalytic reactors treating
Page 127
113
the OSPW, and 3) compare survival and reproduction of Ceriodaphnia dubia and
survival and biomass of Pimephales promelas exposed to OSPW before and after
treatment.
UV light absorption and attenuation experiments determined that TiO2 film-based
solar photocatalysis is driven primarily by UV-A radiation and that suspended solids and
residual hydrocarbon sheens increased attenuation of solar UV radiation in OSPW. UV
radiation transmitted through OSPW activated settled layers of TiO2 and decreased NA
mass by 86% at an exponential with UV insolation and photoperiod half-lives of 1.1±0.2
MJ·m-2 and 10.2±0.8 h, respectively. Decreases in NA concentration were also modeled
using first-order rate kinetics, and rates were slowed by evaporation, yielding UV
insolation and photoperiod half-lives of 2.1±0.2 MJ·m-2 and 19±2 h. Adverse effects
were not observed in survival and biomass of juvenile P. promelas after exposure to
OSPW. Survival and reproduction of C. dubia were impaired in untreated OSPW, and no
adverse effects were observed in any of the treatments (i.e. photocatalysis, photolysis,
dark control). Daphnids exposed to OSPW treated by photocatalysis had significantly
greater reproduction than C. dubia in the photolysis and dark control treatments. These
data provide a proof-of-concept for film-based photocatalysis of OSPW and highlight the
need for further bench-scale experimentation with flow-through fixed-film reactors to
increase NA removal rates and efficiencies. This study is a first step in development of
film-based photocatalysis for treatment of OSPW and the integration of this technology
into hybrid systems capable of mitigating risks associated with this mixture.
Page 128
114
Measure performance of a hybrid pilot-scale CWTS treating a specific OSPW
A hybrid pilot-scale CWTS for remediation of OSPW was assembled using
information from UV attenuation, bench-scale photocatalysis, and previous pilot-scale
constructed wetland experiments. Performance of the hybrid CWTS was measured in
terms of changes in toxicity and constituent concentration and composition over three
sampling periods. Specific objectives were to: 1) Characterize a specific OSPW treated
by a hybrid pilot-scale CWTS for identification of COCs, 2) assemble and operate a
hybrid pilot-scale constructed wetland for treatment of the OSPW, 3) analyze changes in
concentration and class distribution of naphthenic acid fraction compounds (NAFCs)
using ultrahigh resolution mass spectrometry (UHRMS) in Dr. John Headley’s laboratory
at the Environment and Climate Change Canada National Hydrology Research Center,
and 4) measure changes in concentration of COCs and survival and reproduction of
Ceriodaphnia dubia. Characterization of the OSPW indicated that NAFCs, As, B, Cl-,
Cu, Pb, Zn, total suspended solids (TSS), and oil and grease (O&G) were COCs,
exceeding numeric or narrative water quality criteria (WQC). Fixed-film photocatalytic
reactors were implemented in series with wetland cells, designed to promote aerobic
degradation, in two hybrid constructed wetland (HCW) treatment trains. Initial wetland
cells decreased concentrations of O&G and TSS and decreased attenuation of UV
radiation in OSPW, prior to treatment in initial fixed-film photocatalytic reactors. To
degrade residual NAFCs, outflows from HCW series were collected and treated by
polishing photocatalytic reactors (PC2). The hybrid CWTS decreased NAFC
concentrations by 75.9%, and changed class distributions from regimes dominated by
Page 129
115
acutely toxic O2 NAFCs (O2=40.3%, ∑O3–9=45.0%) to sparingly toxic poly-oxygenated
classes (O3–9; O2=13.6%, ∑O3–9=77.0%). The influence of weather conditions on
performance was demonstrated by up to 53% increases in Cl- concentrations caused by
evapotranspiration during the first sampling period and inhibition of NAFC aerobic
degradation by near-freezing temperatures in the third sampling period. In sampling
periods 2 and 3, toxicity to C. dubia was eliminated in all samples collected from the
hybrid CWTS. Reproduction of C. dubia was impaired in 4 of 8 samples collected during
sampling period 1, likely due to increased Cl- concentrations. Concentrations of As, B,
Cu, Pb, and Zn in outflows of the HCW and PC2 exceeded protective WQC, but were
below lowest observable effect concentrations (LOECs) for C. dubia reproduction and
survival. This study demonstrates that hybrid CWTSs, implementing fixed-film
photocatalysis, are capable of altering composition and decreasing concentrations of
NAFCs and toxicity associated with this fraction. Currently, there is a dearth of literature
concerning the use of constructed wetlands for treatment of OSPW and a scarcity of
studies reporting performance data with biogeochemical conditions. This study, which
reports changes in distribution of NAFC classes measured contemporaneously with
biogeochemical conditions in a hybrid pilot-scale CWTS, is a pertinent contribution to
the growing body of literature supporting the application of constructed wetlands for
remediation of OSPW. Performance data, biogeochemical conditions, and design-criteria
presented in this hybrid pilot-scale CWTS experiment will inform further development of
this technology.
Page 131
117
APPENDIX A
Chapter II: Supporting Information
Figure S1. UV irradiance (W·m-2; solid line) measured while photocatalytic and
photolytic reactors were exposed to direct sunlight (photoperiod=32 h). Irradiance was
integrated with respect to photoperiod to calculate UV insolation (MJ·m-2; dashed line).
Reactors were covered from 6:00 PM until 9:00 AM. Irradiance was not measured when
reactors were covered.
Figure S2. Extraterrestrial and terrestrial solar spectra (Gueymard, 2003 and ASTM,
2012, respectively) for UV-A, UV-B, and UV-C radiation. Atmospheric transmittance of
UV light is the quotient of terrestrial and extraterrestrial spectral irradiance. These data
illustrate that the majority of UV irradiance reaching the earth’s surface is from UV-A
wavelengths.
Page 132
118
Figure S1.
Figure S2.
Page 133
119
Table S1. Methods for measurement of water quality characteristics, UV irradiance, and
concentrations of metals, major ions, and naphthenic acid. Unless noted otherwise,
methods were adapted from American Public Health Association (APHA) standard
methods (APHA, 2012).
Parameter Method Method Detection
Limit (MDL)
pH Electrometric method 4500-H+ B: Orion Star model
A221 with Triode® electrode 0.01 SU
Temperature Laboratory method 2550 B: Orion Star Model A221 0.1 °C
Dissolved oxygen Membrane electrode method 4500-O G: HQ30d meter
with LDO101 probe 0.1 mg/L
Conductivity Laboratory method 2510 B: Orion Star Model A221 with
013010MD conductivity cell 1 μS/cm
Alkalinity Titration Method 2320 B 2 mg/L as CaCO3
Hardness EDTA Titrimetric Method 2340 C 2 mg/L as CaCO3
TSS Total Suspended Solids Dried at 103-105°C: Method
2540 D 4 mg/L
TDS Total Dissolved Solids Dried at 180°C Method 2540 C 20 mg/L
BOD5 5-Day Biological Oxygen Demand Test Method 5210 B 1 mg/L
COD Colorimetric Method Chemical oxygen demand 5220 D 4 mg/L
UV Irradiance Direct Instrumentation: Apogee Instruments SU-100 UV
Sensor and HOBO UX120-006M Analog Data Logger 0.188 W·m-2
Naphthenic Acids (NAs) Derivatization and HPLC based on Yen et al. (2004) 6 mg/L
Oil and grease (O&G) USEPA Method 1664 A (Environmental Express
StepSaver Modification; USEPA, 1999) 4 mg/L
Metals and Metalloids
(mg/L)
Inductively Coupled Plasma-Atomic Emissions Spectrometry (ICP-AES) EPA
Method 200.7 (USEPA, 2001)
Aluminum (Al) 0.045 mg/L
Boron (B) 0.01 mg/L
Calcium (Ca2+) 0.002 mg/L
Chloride (Cl-) 0.03 mg/L
Copper (Cu) 0.01 mg/L
Iron (Fe) 0.036 mg/L
Magnesium (Mg2+) 0.01 mg/L
Manganese (Mn) 0.01 mg/L
Potassium (K+) 0.1 mg/L
Phosphorus (P) 0.02 mg/L
Sodium (Na+) 0.03 mg/L
Zinc (Zn) 0.01 mg/L
Page 134
120
Table S2. Mean temperature, pH, dissolved oxygen (DO), and conductivity measured in
photocatalytic, photolytic, and dark control reactors during the photocatalysis experiment.
Parameter (±SD) Photocatalysis Photolysis Dark
Temperature (°C) 13.4 (±3.3) 13.0 (±3.6) 14.7 (±1.6)
pH (S.U.) 8.25 (±0.12) 8.79 (±0.12) 8.66 (±0.22)
DO (mg/L) 9.40 (±1.48) 10.62 (±0.67) 9.87 (±0.96)
Conductivity (µS/cm) 2,638 (±584) 2,589 (±568) 2,047 (±104)
Table S3. Water quality characteristics in exposures of untreated OSPW and from
photocatalytic, photolytic, and dark control reactors used in bioassays. Reported values
are means and standard deviations (n=3).
Parameter OSPW Photocatalysis Photolysis Dark
Temperature (°C) 22.8 (±0.3) 22.2 (±0.9) 24.4 (±4.7) 21.9 (±0.7)
pH (S.U.) 8.83 (±0.01) 8.41 (±0.14) 8.68 (±0.04) 8.47 (±0.12)
Dissolved O2 (mg/L) 8.71 (±0.35) 8.38 (±0.37) 8.70 (±0.81) 8.35 (±0.53)
Conductivity (µS/cm) 1,965 (±6) 1,987 (±48) 1,940 (±63) 2,234 (±16)
Alkalinity (mg/L CaCO3) 422 (±8) 368 (±11) 366 (±8) 445 (±9)
Hardness (mg/L CaCO3) 165 (±8) 152 (±1) 142 (±1) 211 (±4)
Total Dissolved Solids (mg/L) 1,334 (±29) 1,327 (±29) 1,384 (±25) 1,509 (±56)
Total Suspended Solids (mg/L) 6 (±2) 4 (±1) 8 (±3) 4 (±2)
Page 135
121
Table S4. Concentrations of organics and acid soluble elements in exposures of untreated
OSPW and from photocatalytic, photolytic, and dark control reactors used in bioassays.
Reported values are means and standard deviations (n=3).
Parameter (mg/L) OSPW Photocatalysis Photolysis Dark
Organics
Naphthenic Acids 89 (±8) 18 (±5) 79 (±9) 97 (±8)
Oil and Grease <4 – – –
Metals/Metalloids
Boron 2.31 (±0.05) 2.14 (±0.01) 2.20 (±0.04) 2.62 (±0.04)
Copper 0.024 (±0.002) < 0.01 0.019 (±0.002) < 0.01
Iron 0.086 (±0.010) 0.057 (±0.002) 0.074 (±0.028) 0.073 (±0.037)
Manganese < 0.01 < 0.01 < 0.01 < 0.01
Zinc 0.191 (±0.004) < 0.01 0.070 (±0.002) < 0.01
Major Ions
Bicarbonate 409 372 372 427
Calcium 20.19 (±0.66) 24.23 (±0.45) 27.36 (±0.49) 21.85 (±0.35)
Carbonate <2 <2 <2 <2
Chloride 246.79 (±4.13) 241.85 (±3.47) 243.01 (±3.67) 282.05 (±4.70)
Magnesium 20.16 (±0.48) 19.99 (±0.20) 20.54 (±0.47) 22.60 (±0.36)
Potassium 20.55 (±0.29) 21.15 (±0.14) 22.05 (±0.43) 23.88 (±0.48)
Phosphate 0.03 < 0.02 < 0.02 < 0.02
Sodium 380.37 (±6.32) 361.42 (±1.40) 368.51 (±5.84) 423.70 (±2.96)
Sulfate 87.66 (±2.26) 87.13 (±1.24) 87.98 (±2.26) 101.35 (±1.60)
“–” Oil and grease (O&G) not measured in photocatalytic, photolytic, and dark control reactors because
concentrations were below detection in untreated OSPW.
Page 136
122
Table S5. Survival and reproduction of C. dubia exposed to untreated OSPW, laboratory
controls (Control 1 and 2), and photocatalysis, photolysis, and dark control treatments.
Statistical comparisons were made between Control 1 and OSPW and between Control 2
and the treatments.
Name Survival (%) p-value Mean Reproduction
(±SD) p-value
Control 1 95 – 28 (±6) –
OSPW 55 0.004 14 (±7) <0.001
Control 2 95 – 20 (±4) –
Photocatalysis 100 1.000 23 (±6) 0.178
Photolysis 90 0.563 17 (±6) 0.336
Dark 90 0.563 17 (±4) 0.251
“–” p-values not calculated for controls because comparisons were made between controls and OSPW
and the treatments
Table S6. Survival and biomass of P. promelas exposed to untreated OSPW, laboratory
controls (Control 1 and 2) and photocatalysis, photolysis, and dark control treatments.
Statistical comparisons were made between Control 1 and OSPW and between Control 2
and treatments.
Name Survival (%) p-value Mean biomass of
surviving fish (µg; ±SD) p-value
Control 1 91 – 501 (±57) –
OSPW 88 0.502 472 (±32) 0.321
Control 2 94 – 460 (±45) –
Photocatalysis 97 0.869 494 (±39) 0.856
Photolysis 87 0.305 432 (±77) 0.967
Dark 100 1.0 409 (±28) 0.459
“–” p-values not calculated for controls because comparisons were made between controls and OSPW
and the treatments
Page 137
123
APPENDIX B
Chapter III: Supporting Information
Figure S1. Mean hydrosoil oxidation reduction potential (ORP) in wetland cells of
hybrid constructed wetland Series A and B. ORP measured at probes inserted 15 cm deep
in hydrosoil. Error bars represent one standard deviation (n=5).
Figure S2. Mean green shoot density in wetland cells of hybrid constructed wetland
Series A and B. Daily mean water temperature at sediment-water interface in wetland cell
B3. Error bars represent one standard deviation (n=5).
Figure S3. A) Mean concentrations of arsenic measured in hybrid constructed wetland
(HCW) Series A and B during three sampling periods. B) Mean zinc concentrations
measured in HCW Series A and B. Dotted lines represent water quality guidelines for As
and Zn (0.005 and 0.03 mg/L, respectively; CCME, 2011). Error bars represent one
standard deviation.
Page 138
124
Figure S1.
Figure S2.
Page 140
126
Table S1. Hydrosoil oxidation-reduction potential (ORP), dissolved oxygen (DO), pH, and conductivity (Cond.) measured in
wetland cells (WC1-5) and photocatalytic reactors (A/BPC1) of hybrid constructed wetland (HCW) Series A and B. All data
were collected during three sampling periods and are reported as means with minimum and maximum values (n = 4 for DO,
pH, Cond.; n = 5 for ORP).
Sample Hydrosoil ORP.
(mV)a
Dissolved Oxygen
(mg/L)b
pH (S.U.)b Conductivity (µS/cm)b
Hybrid Constructed Wetland (HCW) Series A
A1 124 (121 – 129) 4.03 (1.75 – 7.68) 7.77 (7.52 – 8.06) 1,962 (1,773 – 2,113)
APC1 -- 8.76 (6.64 – 11.09) 8.65 (8.20 – 8.88) 1,993 (1,683 – 2,239)
A2 104 (97 – 124) 2.13 (1.73 – 2.84) 7.53 (7.36 – 7.68) 2,329 (2,174 – 2,569)
A3 57 (35 – 70) 4.03 (1.75 – 7.68) 7.60 (7.53 – 7.68) 2,331 (1,850 – 2,713)
A4 13 (1 – 35) 3.49 (2.16 – 6.03) 7.79 (7.57 – 7.93) 2,480 (1,693 – 2,923)
A5 32 (27 – 41) 4.17 (1.77 – 8.21) 7.64 (7.29 – 7.96) 2,738 (2,110 – 3,190)
Hybrid Constructed Wetland (HCW) Series B
B1 -13 (-26 – -4) 3.26 (2.31 – 4.27) 7.68 (7.50 – 7.89) 1,951 (1,807 – 2,010)
BPC1 -- 9.17 (7.33 – 11.98) 8.56 (7.92 – 8.96) 1,962 (1,545 – 2,256)
B2 -77 (-93 – -37) 3.26 (2.31 – 4.27) 7.70 (7.61 – 7.83) 2,159 (1,896 – 2,382)
B3 -43 (-58 – -22) 3.86 (1.48 – 7.64) 7.79 (7.38 – 8.42) 2,363 (1,920 – 2,688)
B4 99 (94 – 103) 4.23 (2.21 – 8.25) 7.62 (7.41 – 7.77) 2,571 (1,802 – 3,000)
B5 -75 (-94 – -32) 2.74 (1.56 – 4.39) 7.68 (7.43 – 7.95) 2,650 (2,186 – 3,010) a Measured at a depth of 15 cm in hydrosoil of wetland cells b Measured in water column of wetland cells at 10 cm below water surface and in photocatalytic reactors
Page 141
127
Table S2. Mean relative abundance of NAFC classes in hybrid pilot-scale CWTS
measured over three sampling periods by ESI-Orbitrap MS. Samples were collected from
untreated OSPW influent (inflow), outflows from initial wetland cells (WC1), initial
photocatalytic reactors (PC1), and final wetland cells (WC5), and polishing
photocatalytic reactor (PC2) inflow and outflow. Orbitrap-MS of composite samples
from replicate Series A and B (Figure 1) was conducted in Dr. John Headley’s laboratory
at the Environment and Climate Change Canada National Hydrology Research Center.
NAFC classes with relative abundance <1% at all positions in the hybrid pilot-scale
CWTS were not included in this table. Sample Heteroatom Class Relative Abundance (%)
O2 O3 O4 O5 O6
Sampling Period 1
Inflow 39.4 18.8 20.6 3.8 1.1
WC1 38.0 18.8 21.0 3.7 1.1
PC1 31.9 20.9 23.0 7.1 2.4
WC5 24.6 24.0 25.4 7.2 2.3
PC2 In 28.2 24.8 26.9 7.8 2.1
PC2 Out 14.6 22.0 27.9 16.0 7.1
Sampling Period 2
Inflow 39.1 19.0 20.6 3.8 1.1
WC1 38.0 19.5 21.4 3.9 1.1
PC1 31.0 21.4 23.2 7.3 2.4
WC5 24.4 23.0 25.4 8.2 2.8
PC2 In 32.4 23.9 25.1 6.4 1.8
PC2 Out 14.2 18.0 25.7 18.1 11.2
Sampling Period 3
Inflow 42.4 20.7 21.4 3.4 0.7
WC1 41.1 19.0 21.6 3.4 0.9
PC1 32.3 21.1 23.9 6.8 2.2
WC5 35.1 21.3 23.6 5.1 1.5
PC2 In 33.4 21.6 24.1 5.4 1.6
PC2 Out 12.0 15.8 24.3 18.5 12.2
Mean (±SD)
Inflow 40.3 (±1.8) 19.5 (±1.0) 20.9 (±0.5) 3.6 (±0.2) 1.0 (±0.2)
WC1 39.0 (±1.8) 19.1 (±0.4) 21.3 (±0.3) 3.7 (±0.2) 1.0 (±0.1)
PC1 31.7 (±0.7) 21.1 (±0.2) 23.4 (±0.5) 7.1 (±0.2) 2.3 (±0.1)
WC5 28.1 (±6.1) 22.8 (±1.4) 24.8 (±1.0) 6.8 (±1.6) 2.2 (±0.6)
PC2 In 31.3 (±2.7) 23.4 (±1.6) 25.4 (±1.4) 6.5 (±1.2) 1.9 (±0.2)
PC2 Out 13.6 (±1.4) 18.6 (±3.2) 26.0 (±1.8) 17.5 (±1.3) 10.2 (±2.7)
Page 142
128
Table S3. General water quality characteristics and chloride concentrations measured in samples collected from hybrid
constructed wetland (HCW) and polishing photocatalysis (PC2) Series A and B. All data were collected during three sampling
periods and are reported as mean and range (n = 3). Sample Temperature
(°C)
pH (S.U.) Conductivity
(µS/cm)b
Dissolved
Oxygen (mg/L)
Alkalinity (mg/L
CaCO3)
Hardness (mg/L
CaCO3)
Chloride
(mg/L)
Inflow 21.1 8.96 1,889 8.81 363 128 255 (19.9–23.0) (8.81–9.08) (1,866–1,929) (8.62–8.91) (356–368) (120–132) (248–260)
Series A
APC1 20.0 9.46 2,049 8.40 388 131 273 (16.2–23.0) (7.75–11.65) (1,918–2,190) (8.27–8.55) (372–404) (120–144) (261–287)
A5 19.9 10.34 2,543 8.46 464 140 356 (13.8–23.0) (8.68–11.30) (2,004–3,040) (8.24–8.62) (396–516) (124–164) (277–430)
PC2 In 17.4 8.59 2,120 7.93 363 132 291 (17.3–17.5) (7.56–9.20) (1,728–2,650) (7.66–8.09) (292–404) (116–156) (240–362)
PC2 Out 19.0 6.59 2,524 8.21 438 148 353 (17.8–20.1) (4.88–8.29) (1,988–3,060) (7.91–8.50) (380–496) (120–176) (283–439)
Series B
APC1 20.5 8.91 2,057 8.31 404 136 276 (17.3–23.0) (8.15–10.24) (1,917–2,190) (8.13–8.43) (364–440) (124–160) (262–292)
A5 19.9 10.28 2,543 8.44 453 151 357 (13.8–23.0) (8.73–11.48) (1,984–2,955) (8.06–8.71) (360–520) (120–168) (274–416)
PC2 In 17.0 8.62 2,075 7.92 387 120 294 (16.6–17.5) (7.35–9.45) (1,648–2,570) (7.81–8.11) (340–460) (108–132) (235–368)
PC2 Out 18.9 6.64 2,221 7.85 392 130 313
(17.5–20.3) (4.76–8.52) (1,533–2,908) (7.36–8.33) (300–484) (96–164) (218–414)
Page 143
129
Table S4. Comparison of mean element concentrations measured in outflows of hybrid constructed wetland (HCW) and
polishing photocatalysis (PC2) Series A and B (n=3 sampling periods; ⍺=0.05).
Element WC5 Mean PC2 Out Mean p-value
Series A Series B Series A Series B Series A Series B
As 0.011 (±0.002) 0.013 (±0.005) 0.008 (±0.001) 0.007 (±0.006) 0.072 0.24
B 2.889 (±0.52) 2.816 (±0.48) 2.891 (±0.634) 2.751 (±0.857) 0.996 0.916
Cu 0.017 (±0.003) 0.024 (±0.011) 0.014 (±0.006) 0.017 (±0.005) 0.41 0.37
Pb 0.012 (±0.002) 0.011 (±0.001) 0.012 (±0.001) 0.013 (±0.003) 0.57 0.40
Zn 0.062 (±0.024) 0.052 (±0.009) 0.034 (±0.020) 0.049 (±0.012) 0.20 0.77
Page 144
130
Table S5. Percent survival and reproduction of C. dubia in static renewal, 7-day
bioassays conducted according to Environment and Climate Change Canada protocols for
single-concentration tests (ECCC, 2011). Exposures from untreated OSPW and the
hybrid CWTS are listed directly below the laboratory controls to which they were
compared (⍺=0.05).
Treatment/
Control
Survival Reproduction
Percent
Survival p-value Neonates/
surviving adult p-value
Series
A
Series
B Series
A
Series
B Series A Series B Series A Series B
Sampling Period 1
Control 1 95% – – 28 (±6) – –
Inflow 70% 0.046 21 (±3) 0.001
PC1 100% 100% 1 1 19 (±5) 24 (±5) <0.001 0.042
Control 2 100% – – 20 (±5) – –
WC5 90% 75% 0.244 0.024 19 (±4) 22 (±3) 0.506 0.219
Control 3 95% – – 23 (±6) – –
PC2 In 100% 95% 1.00 0.756 14 (±5) 21 (±4) <0.001 0.979
Control 4 100% – – 25 (±4) – –
PC2 Out 95% 95% 0.500 0.500 22 (±4) 17 (±6) 0.144 <0.001
Sampling Period 2
Control 5 100% – – 20 (±5) – –
Inflow 20% <0.001 27 (±4)* 0.087
Control 6 100% – – 26 (±7) – –
PC1 100% 100% 1.00 1.00 24 (±4) 23 (±5) 0.635 0.254
WC5 100% 95% 1.00 0.500 22 (±4) 23 (±5) 0.180 0.133
Control 3 95% – – 23 (±6) – –
PC2 In 100% 90% 1.00 0.500 23 (±4) 25 (±4) 0.997 0.645
PC2 Out 100% 100% 1.00 1.00 25 (±5) 21 (±4) 0.547 0.639
Sampling Period 3
Control 4 100% – – 25 (±4) – –
Inflow 90% 0.500 15 (±3) <0.001
PC1 100% 95% 1.00 0.756 26 (±4) 26 (±4) 0.8501 0.9406
Control 7 100% – – 21 (±5) – –
WC5 90% 90% 0.244 0.244 25 (±6) 25 (±5) 0.297 0.173
PC2 In 90% 80% 0.394 0.061 22 (±5) 25 (±5) 1.00 0.214
PC2 Out 80% 85% 0.053 0.115 24 (±4) 23 (±6) 0.538 0.891
"–" p value not calculated for controls
* Only 2 out of 20 daphnids produced three broods, but reproduction was not inhibited in these replicates
Page 145
131
APPENDIX C
Standard Operating Procedures
Method for Measuring General Water Quality Parameters: pH, Dissolved Oxygen,
Conductivity, Temperature, Alkalinity, and Hardness ................................................ 132
Method for Measuring Oxidation-Reduction Potential ............................................... 135
Method for Derivatizing Naphthenic Acids for HPLC Analysis ................................. 138
Method for Measuring Total Suspended and Total Dissolved Solids ......................... 140
Method for Measuring Chemical Oxygen Demand (COD) ......................................... 142
Method for Measuring Biochemical Oxygen Demand (BOD) .................................... 144
Method for Measuring Metal Concentrations using Inductively Coupled Plasma Atomic
Emission Spectrometer (ICP-AES).............................................................................. 146
Method for Measuring Oil and Grease (O&G) ............................................................ 149
Method for Determination of Acid-Volatile Sulfides in Hydrosoil ............................. 154
Page 146
132
METHOD FOR MEASURING GENERAL WATER QUALITY PARAMETERS:
PH, DISSOLVED OXYGEN, CONDUCTIVITY, TEMPERATURE,
ALKALINITY, AND HARDNESS
Daniel P. Gaspari; Jeff Schwindaman, Brenda M. Johnson, Laura E. Ober, John H.
Rodgers, Jr.
1.0 OBJECTIVE
The purpose of this protocol is to measure various general water quality parameters.
Parameters such as pH, dissolved oxygen (DO), conductivity, temperature, alkalinity, and
hardness are fundamental water quality parameters and are necessary for all water
chemistry related studies.
2.0 HEALTH AND SAFETY
Proper laboratory attire, including scrubs, lab coat, gloves and safety glasses must be
worn at all times.
3.0 PERSONAL/TRAINING/RESPONSIBILITIES
Any graduate research assistant familiar with the equipment and laboratory techniques
and trained in this and referenced SOPs may perform this procedure.
4.0 REQUIRED MATERIALS
4.1 Reagents
Reagent: Test:
NANOpure® water All tests
pH buffers (4,7, and 10) pH, Alkalinity
0.02 N standard sulfuric acid solution (H2SO4) Alkalinity
Eriochrome Black T indicator Hardness
Standard EDTA titrant (0.01M, 0.02N) Hardness
Buffer solution (Reference Standard Methods 2340C) Hardness
4.2 Supplies
Supply: Test:
Graduated cylinder Alkalinity, Hardness
100-mL beakers All tests
Magnetic stir bar Alkalinity, Hardness
50-mL burette and stand Alkalinity, Hardness
Page 147
133
4.3 Equipment
Orion Star A221 equipped with a 9157BNMD Triode pH probe
Orion Star A221 equipped with a 013010MD conductivity cell
HQ30d meter with a LDO101 optical dissolved oxygen probe
Magnetic stir plate
5.0 PROCEDURE
5.1 pH
1. Calibrate the pH meter using standard pH buffers 4, 7, and 10.
2. Rinse probe with NANOpure® water to remove any prior contaminant.
3. Remove the small blue rubber stopper from the probe
4. Submerge the tip of the probe in the sample and gentle stir the sample with
the probe.
5. When the pH reading has stabilized, record pH in S.U. to a tenth of a S.U.
6. Rinse probe with NANOpure® water between measurements and return to
holder when finished.
5.2 Dissolved Oxygen (DO)/Temperature
1. Turn on the dissolved oxygen Meter.
2. Rinse probe with NANOpure® water to remove any prior contaminant.
3. Completely submerge the tip of the probe in the sample.
4. When the DO reading has stabilized, record DO in mg/L. Also record the
temperature to a tenth of a degree (i.e. 20.1°C).
5. Rinse probe with NANOpure® water between measurements and return to
holder when finished.
5.3 Conductivity
1. Calibrate the conductivity meter using 10 and 1,413 µS/cm standards
2. Rinse probe with NANOpure® water to remove any prior contaminant.
3. Submerge the probe in the sample and gently stir the sample with the probe.
4. When the conductivity reading has stabilized the conductivity will record in
(mS/cm) and temperature in degrees Celsius.
5. Rinse probe with NANOpure® water and return to holder.
6. When finished turn off the meter
5.4 Alkalinity
1. Using a graduated cylinder, measure 50 mL of sample water and pour it into a 100-
mL beaker with a magnetic stir-bar.
Page 148
134
2. Place sample beaker on magnetic stir-plate. Turn on stir-plate to begin mixing
sample.
3. Calibrate the pH meter. Place probe in the appropriate stand, with the tip
completely submerged in the sample water. (Make sure the stir-bar does not hit the
pH probe).
4. Record the initial level of titrant (0.02 N H2SO4) in the burette (fill burette as
necessary).
5. Slowly drip titrant into the sample, allowing time for the pH meter to stabilize.
6. Titrate to pH 4.5.
7. Record the volume (mL) of titrant used to reach the pH endpoint
(pH=4.5).
8. Calculate: Total Alkalinity (mg/L as CaCO3) = col. Titrant (mL)x 20
9. Turn off stir-plate and discard sample.
5.5 Hardness
1. Using a graduated cylinder, measure 50 mL of sample water and pour it into a 100-
mL beaker with a magnetic stir-bar. (Dilutions can be made to conserve EDTA
titrant, be sure to calculate dilutions into the final equation.)
2. Add 2-5 mL of buffer solution (to give the sample a pH of 10.0-10.1).
3. Add 2-4 drops of Eriochrome Black T Indicator. Sample should turn pink.
4. Place sample beaker on magnetic stir-plate. Turn on plate to mix sample.
5. Record the level of titrant (EDTA) in the burette (fill burette as necessary).
6. Slowly drip titrant into the sample, allowing time for the color change to
stabilize.
7. Titrate until pink turns to a blue-green color.
8. Record the volume of titrant (mL) used to reach the color change.
9. Calculate: Hardness (mg/L CaCO3) = volume titrant (mL) x 20.
10. Turn off stir-plate and discard sample.
6.0 QUALITY CONTROL CHECKS AND ACCEPTANCE CRITERIA
All procedures are subject to review by the Quality Assurance Unit.
Page 149
135
METHOD FOR MEASURING OXIDATION-REDUCTION POTENTIAL
Daniel P Gaspari, Sarah E. Sundberg, Derek Eggert, J. Chris Arrington, John H. Rodgers
Jr.
1.0 OBJECTIVE
Oxidation and reduction (redox) reactions mediate the behavior of many chemical
constituents in wastewaters. The reactivities and mobilities of important elements in
biological systems, as well as those of a number of other metallic elements, depend
strongly on redox conditions. Like pH, Eh (redox) represents an intensity factor; it does
not characterize the capacity of the system for oxidation or reduction. Measurements are
made by potentiometric determination of electron activity (or intensity) with an inert
indicator electrode and a suitable reference electrode. Electrodes made of platinum are
most commonly used for Eh measurements. This protocol describes the method used to
measure redox in the hydrosoil of a constructed wetland treatment system.
2.0 HEALTH AND SAFETY
Proper laboratory attire, including scrubs, lab coat, gloves and safety glasses must be
worn at all times.
3.0 PERSONNEL/TRAINING/RESPONSIBILITIES
Any graduate research assistant familiar with the equipment and laboratory techniques
and trained in this and referenced SOPs may perform this procedure.
4.0 REQUIRED MATERIALS
4.1 Supplies
Potassium ferrocyanide K4Fe(CN)6•3H2O
Potassium ferricyanide, K3Fe(CN)6
Potassium chloride, KCl
4.2 Equipment
pH or millivolt meter
Reference electrode
Oxidation-reduction indicator electrode
Beakers
Magnetic Stirrer
Page 150
136
5.0 PROCEDURE
Prepare ZoBell’s standard redox solution by adding 1.408 g potassium ferrocyanide,
1.098 g potassium ferricyanide and, 7.455 g potassium chloride to 1,000 mL of
NANOpure® water at 25°C. These measurements must be as accurate as possible to
result in a reliable solution. When stored in dark plastic bottles in a refrigerator, this
solution is stable for several months.
Follow the manufacturer’s instructions for using the pH/millivolt meter and in preparing
electrodes for use. Immerse the reference electrode connected to the millivolt meter and
the redox indicator electrode (platinum tip end) in the gently stirred, standard solution in
a beaker. Connect the millivolt meter to the end of the indicator electrode opposite the
platinum tip. Allow several minutes for electrode equilibrium then record the reading to
the nearest millivolt. If the reading is within +10 mV from the theoretical redox standard
value at 25°C (+183 mV), record the reading. The indicator electrode is ready for
placement in the hydrosoil. If the reading is not within +10 mV, the indicator electrode
must be remade.
Place the indicator electrode’s platinum tip into the sediment making certain it is not near
the plant roots and at a depth of 10 cm in the hydrosoil. Secure the electrode with cable
ties. Allow the electrode to equilibrate for 24 hours prior to taking any readings. When
measuring the redox potential of the hydrosoil place the reference electrode in the same
water column as the probe. Connect the millivolt reader to the end of the indicator
electrode opposite the platinum tip. Record the redox potential in mV. Repeat a second
time by placing the reference electrode in another location. Successive readings that vary
less than +10 mV over 10 minutes are adequate for most purposes. Adjust the reading
according to field corrections and electrode calibration corrections.
Example: The field measurement of a hydrosoil was -206 mV. When the electrode was
initially calibrated in the laboratory, the redox reading was +193mV, which is +10mV
different from the theoretical redox standard value of +183 mV. The field redox
measurement must be corrected for this difference by subtracting 10 mV from -206 mV.
This gives a redox measurement of -216 mV. The standard correction factor for field
redox measurements for the millivolt reader is +240 mV. Therefore, this correction factor
is added to the redox measurement of -216 mV to yield a final redox measurement of +24
mV.
Ehsystem = Ehobserved - Ehreference observed + Ehfield correction
Ehsystem = -206mV + 183mV - 193mV + 240mV
6.0 QUALITY CONTROL CHECKS AND ACCEPTANCE CRITERIA
All procedures are subject to review by the Quality Assurance Unit.
Page 151
137
7.0 REFERENCES
Faulkner, S.P., W.H. Patrick, Jr., R.P. Gambrell, 1989. Field techniques for measuring
wetland soil parameters. Soil Science Society of America Journal 53, 883-890.
ZoBell, C. E., 1946. Studies on redox potential of marine sediments. Bulletin of the
American Association of Petroleum Geologists 30, 477-513.
Page 152
138
METHOD FOR DERIVATIZING NAPHTHENIC ACIDS FOR HPLC ANALYSIS
Sam Muller
1.0 OBJECTIVE
The objective of this standard operating procedure is to clearly outline the methods for
derivatizing naphthenic acids in solution for HPLC analysis.
2.0 HEALTH AND SAFETY
Proper personal protective equipment will be worn for the entirety of this procedure.
Reagents for derivatization should be prepared and handled within a fume hood.
3.0 PERSONNEL/TRAINING/RESPONSIBILITIES
Any graduate research assistant familiar with the equipment and laboratory techniques
and trained in this SOP may perform this procedure.
4.0 REQUIRED AND RECOMMENDED MATERIALS
4.1 Supplies
1 M NaOH
3 M HCl
0.4 M HCl
Ethanol, HPLC grade
Methanol, HPLC grade
Nano-pure water
Pyridine
KOH salt, reagent grade
2-NPH
1-EDC-HCl
50 mL opaque vials with screw caps
2-mL amber glass HPLC vials with caps and septa
4.2 Equipment
Water bath
Thermometer
Magnetic stir plate
Magnetic stir bar
pH meter with needle tip
100 mL volumetric flask
30 mL beakers
Page 153
139
30 mL medicine cups
100-1,000 μL volumetric pipette and tips
5-10 mL volumetric pipette and tips
Syringe and 0.22 μm syringe filter
5.0 PROCEDURE
5.1 Reagent Preparation
Prepare a 95% ethanol in water (v/v) solution in a 1-L volumetric flask. For the 2-
NPH reagent, mix 15 mL of the 95% ethanol solution, 5 mL 0.4 M HCl, and 60 mg of
2-NPH in a beaker. Stir fifteen minutes on a stir plate and store in an opaque vial with
screw top at 4° C in refrigerator. Prepare a 3% pyridine solution by adding 3 mL
pyridine to a 100 mL volumetric flask and filling with 95% v/v ethanol in Nano-pure
water. Add 10 mL 95% ethanol solution, 10 mL 3% pyridine solution, and 480 mg
EDC-HCl to a beaker and place on stir plate for fifteen minutes. Store the solution in
an opaque vial with screw top at 4° C. Prepare a 1 M KOH solution by dissolving
5.61 g KOH salt in 100 mL 80% v/v HPLC grade methanol solution in Nano-pure
water. Dilute to 140 mM by adding 14 mL of the prepared 1 M KOH solution to a
100 mL volumetric flask. Fill to 100 mL using 80% (v/v) methanol in Nano-pure
water.
5.2 Sample Preparation
Pour 5 mL of sample into a medicine cup. Add 1 M NaOH until pH reaches 12. Filter
with a syringe and 0.22 μm syringe filter. Adjust pH of filtered sample to between 8
and 10 with 3 M HCl solution, measuring with needle tip pH meter.
5.3 Derivitization
Turn on water bath and set temperature to 60°C. Pipet 600 μL of pH-adjusted, filtered
sample into a clean HPLC vial. Add 240 μL of 2-NPH reagent and 240 μL of 1-EDC-
HCl solution to each vial. Tightly cap the vial and place samples in water bath for 20
minutes. Remove samples from water bath. Add 120 μL of 140 mM KOH in 80%
(v/v) methanol/water to each vial. Recap vials and place in water bath for 15 minutes.
Measure pH to ensure it does not exceed 7.5. pH should read between 5.5 and 6.5.
Cool samples and take to HPLC.
6.0 REFERENCE
Yen, T.W., Marsh, W.P., MacKinnon, M.D., Fedorak, P.M., 2004. Measuring naphthenic
acids concentrations in aqueous environmental samples by liquid
chromatography. Journal of Chromatography 1033, 83-90.
Page 154
140
METHOD FOR MEASURING TOTAL SUSPENDED AND TOTAL DISSOLVED
SOLIDS
Sarah E. Sundberg, Derek Eggert, J. Chris Arrington, John H. Rodgers, Jr.
1.0 OBJECTIVE
Solids refer to matter suspended or dissolved in water or wastewater. Solids may affect
water or effluent quality adversely in a number of ways. Solid analyses are important in
the control of biological and physical wastewater treatment processes and for assessing
compliance with regulatory agency wastewater effluent limitations. This method
determines the concentration of the total suspended and total dissolved solids in a water
sample.
2.0 HEALTH AND SAFETY
Proper laboratory attire, including scrubs, lab coat, gloves and safety glasses must be
worn at all times.
3.0 PERSONNEL/TRAINING/RESPONSIBILITIES
Any graduate research assistant familiar with the equipment and laboratory techniques
and trained in this and referenced SOPs may perform this procedure.
4.0 REQUIRED AND RECOMMENDED MATERIALS
4.1 Supplies
Millipore glass fiber filter disks, 47mm
Filtration apparatus with reservoir & coarse (40 to 60 m) fritted disk as filter support
Graduated cylinder
Desiccator
Aluminum weight dishes
4.2 Equipment
Drying oven, for operation at 105°C
Analytical balance, capable of weighing 0.00001g
5.0 PROCEDURE
For one sample, label two aluminum weight dishes TSS and TDS. Place a glass-fiber
filter disk in the TSS aluminum dish with the wrinkled side up and obtain the weight (in
grams). Obtain weight of the empty TDS dish as well. Place the filter disk on the
filtration apparatus, apply vacuum, and wash the disk with approximately 20 mL distilled
Page 155
141
water. Continue suction to remove all traces of water on the disk, turn the vacuum off,
and discard water from the wash. Apply vacuum again, and pour 100 mL of sample
through the filter. Remove filtering apparatus, and collect 10 mL in the TDS aluminum
weight dish. Replace the funnel, rinse the graduated cylinder with distilled water, and
continue vacuum suction to remove all traces of water on the disk. Carefully remove the
disk and place in the TSS aluminum weight dish. Place the weight dishes in the oven at
105°C and dry for 24 hours.
Once dry, remove the dishes from the oven and place in a desiccator for approximately
20 minutes, or until the dishes are at room temperature. Obtain weights (in grams) of the
dishes.
TDS =𝑊𝑒𝑖𝑔ℎ𝑡𝑝𝑜𝑠𝑡 −𝑊𝑒𝑖𝑔ℎ𝑡𝑝𝑟𝑒
10mL×1000mL
1L×1000mg
1g
TSS =𝑊𝑒𝑖𝑔ℎ𝑡𝑝𝑜𝑠𝑡 −𝑊𝑒𝑖𝑔ℎ𝑡𝑝𝑟𝑒
100mL×1000mL
1L×1000mg
1g
6.0 QUALITY CONTROL CHECKS AND ACCEPTANCE CRITERIA
All procedures are subject to review by the Quality Assurance Unit.
Page 156
142
METHOD FOR MEASURING CHEMICAL OXYGEN DEMAND (COD)
Sarah E. Sundberg, Derek Eggert, J. Chris Arrington, John H. Rodgers, Jr.
1.0 OBJECTIVE
The chemical oxygen demand (COD) is defined as the amount of a specified oxidant that
reacts with the sample under controlled conditions. The quantity of oxidant consumed is
expressed in terms of its oxygen equivalence. Because of its unique chemical properties,
the dichromate ion (Cr2O72-) is the specified oxidant in this method. When a sample is
digested, the dichromate ion oxidizes COD material from the hexavalent (VI) state to the
trivalent (III) state. Both of these chromium species are colored and absorb in the visible
region of the spectrum. The chromic ion absorbs strongly in the 600 nm region. The
measured absorbance of the digested sample is the COD of the water sample.
2.0 HEALTH AND SAFETY
Proper laboratory attire, including scrubs, lab coat, gloves and safety glasses must be
worn at all times.
3.0 PERSONNEL/TRAINING/RESPONSIBILITIES
Any graduate research assistant familiar with the equipment and laboratory techniques
and trained in this and referenced SOPs may perform this procedure.
4.0 REQUIRED AND RECOMMENDED MATERIALS
4.1 Reagents
Water, 18 M Ω cm
Potassium hydrogen phthalate
4.2 Supplies
HACH COD digestion vials, dichromate, 0-1,500 mg/L range
Cuvettes
4.3 Equipment
Spectrophotometer, for use at 600 nm
Dry bath incubator, for operation at 150°C
5.0 PROCEDURE
Prepare five calibration standards by mixing 750 mg potassium hydrogen phthalate in
500 mL of water. This solution is good for 6 weeks. Dilute standard to 187 mg/L, 93
Page 157
143
mg/L, 46 mg/L, and 0 mg/L. Add 2 mL of standard solutions to labeled COD digestion
vials, carefully mix contents, and place on a dry bath incubator at 150°C for 2 hours, then
let sit for 24 hours. Measure the turbidity of the standards on the spectrophotometer at
600 nm. Plot the turbidity readings and concentrations to determine the equation of the
calibration curve.
Acidify water samples with approximately 2 drops of concentrated sulfuric acid to drop
the pH to less than 2 for storage. Dilute the water sample to achieve less than 1,500 mg/L
chlorides. Add 2 mL diluted sample to labeled COD digestion vials in duplicate.
Carefully mix contents of the COD vials, and place on a dry bath incubator at 150°C for
2 hours, then let sit for 24 hours. Measure the turbidity of the standards on the
spectrophotometer at 600 nm. Use the calibration equation of y = mx + b to determine
COD by substituting the spectrophotometer reading for y and solving for x, then
multiplying by the dilution factor used.
6.0 QUALITY CONTROL CHECKS AND ACCEPTANCE CRITERIA
All procedures are subject to review by the Quality Assurance Unit.
Page 158
144
METHOD FOR MEASURING BIOCHEMICAL OXYGEN DEMAND (BOD)
Sarah E. Sundberg, Derek Eggert, J. Chris Arrington, John H. Rodgers, Jr.
1.0 OBJECTIVE
The biochemical oxygen demand (BOD) is determined through the use of an empirical
test in which standardized laboratory procedures are used to find the relative oxygen
requirements of the wastewater. This method measures the molecular oxygen utilized
during a specified incubation period for the biochemical degradation of organic material
and the oxygen used to oxidize inorganic material such as sulfides and ferrous iron. It
also may measure the amount of oxygen used to oxidize reduced forms of nitrogen unless
their oxidation is prevented by an inhibitor.
2.0 HEALTH AND SAFETY
Proper laboratory attire, including scrubs, lab coat, gloves and safety glasses must be
worn at all times.
3.0 PERSONNEL/TRAINING/RESPONSIBILITIES
Any graduate research assistant familiar with the equipment and laboratory techniques
and trained in this and referenced SOPs may perform this procedure.
4.0 REQUIRED AND RECOMMENDED MATERIALS
4.1 Supplies
Incubation bottles, 300 mL foil-wrapped glass bottles having a ground-glass stopper
and a flared mouth are preferred
4.2 Equipment
Dissolved Oxygen Meter
5.0 PROCEDURE
Fill an incubation bottle to overflowing with sample water at 20°C. Measure the
dissolved oxygen (DO) in each bottle, insert stopper, and make an airtight seal. Incubate
at 20°C in the dark. Measure the DO in each bottle once a day. If DO falls to about 2
mg/L, re-aerate for approximately 30 minutes to oxygenate the water. Measure the DO
again. This concentration becomes the initial DO for the next measurement. Be sure to
replace any sample lost by the cap and DO probe displacement by adding additional
sample water. Calculate oxygen consumption during each time interval between
Page 159
145
aerations. After a 5-day period, combine all measured oxygen consumptions to determine
BOD5 of the sample.
6.0 QUALITY CONTROL CHECKS AND ACCEPTANCE CRITERIA
All procedures are subject to review by the Quality Assurance Unit.
Page 160
146
METHOD FOR MEASURING METAL CONCENTRATIONS USING
INDUCTIVELY COUPLED PLASMA ATOMIC EMISSION SPECTROMETER
(ICP-AES)
Daniel P. Gaspari, Maas Hendrikse, Michael J. Pardue, Jennifer Horner
1.0 OBJECTIVE
This method outlines the specific experimental details for analysis of select elements
using the ICP-AES as it pertains to oil sands process water (OSPW). This protocol is
intended for measuring acid soluble concentrations of metals and metalloids in aqueous
samples and is adapted from standard methods (USEPA, 2001).
2.0 HEALTH AND SAFETY
Proper lab attire, including lab coat, gloves, and safety glasses must be worn at all times.
3.0 PERSONNEL/TRAINING/RESPONSIBILITIES
Any graduate research assistant familiar with the equipment and laboratory techniques
and trained in this and referenced SOPs may perform this procedure.
4.0 REQUIRED AND RECOMMENDED MATERIALS
4.1 Supplies
Spectro Flame Modula ICP-AES (Spectro Analytical Instruments; Mahwah, NJ,
USA), 500 mL acidified NANOpure® water for rinse, standards for the elements of
interest.
4.2 Standards
Standards should not exceed a range of two orders of magnitude. Standards should be
made in a matrix to resemble that of the samples. Acidified in same manner as
samples (10% by volume with nitric acid). Standards should be made the day of
sample analysis.
5.0 PROCEDURE
This procedure only includes the basic methods for sample collection, ICP-AES use and
cleanup, and quality assurance controls. Instrumentation manual and EPA Method 200.7
(USEPA, 2001) should be reviewed.
Page 161
147
5.1 Sample Collection and Preparation
Collect samples in clean 50 mL plastic centrifuge tubes, do not allow the tube to
overfill when filling. Adjust sample pH to ≤ 2.0 with HNO3 (approximately 1% by
volume or 0.5 mL acid in 50 mL sample). Store sample in dark for storage up to 6
months at <3°C. Warm samples to room temperature before analysis.
5.2 ICP-AES Methods
The instrument manual for the ICP-AES contains procedures for calibration and
analysis of samples, and an SOP, written by Brenda M Johnson, Derek A. Eggert, and
Andrew McQueen (unpublished, 2007) containing step by step instructions for ICP-
AES use. The USEPA (2001) recommends the following wavelengths and guidance
for method detection limits.
Metal/Metalloid Wavelength
(nm)
Estimated Detection
Limit (mg/L)a
Al 308.215 0.02
As 193.759 0.008
Ba 493.409 0.001
B 249.0678 0.003
Cd 226.502 0.001
Ca 315.887 0.01
Cr 205.552 0.004
Co 228.616 0.002
Fe 259.94 0.003
Pb 220.353 0.01
Mg 279.079 0.02
Mn 257.61 0.001
Ni 231.604 0.005
K 766.491 0.3
Se 196.09 0.02
Na 588.995 0.03
Zn 213.856 0.002 a Estimated detection limit for acid soluble (i.e. total
recoverable) aqueous metals
Page 162
148
5.3 Cleaning
After ICP-AES use the system lines should be flushed with acidified NANOpure® for
5-10 minutes. Prior to and at the conclusion of each use of the ICP-AES all lines and
tubing should be checked for blocks and wear. Empty the waste container if
necessary. The remainder of unused standards can be disposed of in appropriate waste
containers and aqueous sample should be stored in centrifuge tubes in the refrigerator,
in case further analysis is required.
5.4 Quality Assurance
Quality assurance and quality control measures for ICP-AES metal analyses should
include standard recovery and standard addition every ten samples. Sample analyses
can be considered acceptable if standard recoveries are within ±10% of the calibration
concentration for individual metals. A middle standard should be used for standard
additions and the percent recovery should be within 70-130%. A new calibration
curve should be accepted every 20 samples and duplicate samples can be analyzed for
additional assurance. These quality assurance and control measures should be
considered as the minimum requirements of USEPA methods, additional quality
measures should be performed for unknown or excessively cloudy (non-
homogeneous) samples.
6.0 QUALITY CONTROL CHECKS AND ACCEPTANCE CRITERIA
All procedures are subject to review by the Quality Assurance Unit.
7.0 REFERENCES
United States Environmental Protection Agency (USEPA), 2001. Trace elements in
water, solids, and biosolids by inductively coupled plasma-atomic emission
spectrometry. 5th Revision. EPA Method 200.7. EPA-821-R-01-010. Office of
Water, Washington, DC.
Page 163
149
METHOD FOR MEASURING OIL AND GREASE (O&G)
Michael J. Pardue, Jennifer E. Horner
Adapted from the directions for the StepSaver apparatus manufactured by Environmental
Express, www.envexp.com
1.0 OBJECTIVE
The following protocol provides a method for measuring the concentration of oil and
grease (O&G) in a water sample. An apparatus manufactured by Environmental Express
was used to measure O&G using a modification on EPA method 1664 Revision A. EPA
Method 1664A is a performance based method, “The laboratory is permitted to modify
the method to overcome interferences or lower the cost of measurements, provided that
all performance criteria are met” (Section 1.7 of EPA 1664A). The procedure is a solid
phase extraction for O&G (defined as any components extractable by n-hexane). The
outlined procedure can yield false positive results because fatty acids in samples can be
extracted as O&G. There is a secondary test using silica gel to further distinguish
between n-hexane extractables and total petroleum hydrocarbons (TPH). This procedure
can be competed with the StepSaver apparatus from Environmental Express but was not
utilized in this research. The outlined procedure for O&G has four basic steps: rinse disk
with elution solvent, condition disk with methanol, extract analytes from water sample,
and elute analytes with elution solvent. Additional application notes on the StepSaver
apparatus can be found at the manufacture’s website www.envexp.com.
2.0 HEALTH AND SAFETY
Proper laboratory attire, including lab coat, gloves, and safety glasses must be worn at all
times.
3.0 PERSONNEL/TRAINING/RESPONSIBILITIES
Any graduate research assistant familiar with the equipment and laboratory techniques
and trained in this and referenced SOPs may perform this procedure.
4.0 REQUIRED AND RECOMMENDED MATERIALS
4.1 Reagents
n-hexane (85% purity or greater)
Methanol
Hydrochloric Acid
Hexadecane, stearic acid, and acetone
Deionized water
Page 164
150
4.2 Apparatus and Supplies
47mm or 90mm StepSaver glass with filtration manifold, water trap, and vacuum
source
Prefilter material such as Filter Aid 400, and/or appropriate sized glass fiber filters
Dried and weighed receiving flasks with 24/25 or 24/40 ground glass joint
5.5 g sodium sulfate drying cartridges
Stainless steel filter support screen
Teflon dispensing squirt bottles
Analytical balance
Desiccator
Water bath or other evaporative device capable of achieving at least 85°C
5.0 PROCEDURE
5.1 Sample Collection and Preparation
Collect 0.5 L samples in glass jars (EPA method recommends 1 L samples). Do not
allow sample to touch any glassware or plastic besides the sample container because
O&G will adhere to material and underestimate O&G sample concentration. Adjust
sample pH to ≤ 2.0 with HCl (approximately 1% or 5 mL acid in 0.5 L sample). Cool
sample in dark for storage up to 7 days.
5.2 O&G Extraction Methods
Extraction Disk Conditioning
Note: proper filter conditioning is essential for both adequate flow rate through
the disk and good recovery
1. Place the stainless steel filter support screen in the top of the StepSaver head. The
screen should be resting on the glass.
2. Place the Empore extraction disk into the filter gasket. The filter should be resting
inside the gasket, mesh side down, white side up towards the 1 liter funnel. 3. Place
the gasket and filter together onto the stainless steel screen, and center the funnel on
the head. While holding the funnel with one hand, squeeze the clamp firmly into place.
4. Attach a flask to collect waste solvent to collection arm of StepSaver with keck clip.
5. For extremely dirty samples, place a scoop of Filter Aid 400 atop the disk. 90mm
StepSavers have 4X the solids loading capacity of the 47mm StepSaver.
Note: Use of glass fiber pre-filters can result in low recoveries of the
stearic acid fraction.
6. Turn the upper stopcock with the red handles so that flow will be toward the
collection flask.
7. Position the valve on the manifold to the off/vent position. Wash the disk and walls
of the funnel with 10-15 mL of n-hexane. Quickly turn the manifold valve to the on
Page 165
151
(12 o’clock) position and then back to off/vent (9 o’clock/3 o’clock) position. This
should draw a small amount of hexane through the disk. Allow the disk to soak for two
minutes. Apply vacuum and pull remaining hexane through disk into collection flask.
Allow disk to vacuum dry for one to two minutes, making sure all hexane is removed
from the disk.
8. If the seal was leaking n-hexane repeat the n-hexane rinse steps above.
9. Position the valve on the manifold to the off/vent position.
10. Turn the StepSaver stopcock (upper stopcock) to the waste position. Add 10- 15
mL of methanol to the reservoir. If necessary, quickly turn manifold valve to on
position and then quickly back to off/vent position, and back up to the off/off position
(1 o’clock/ 6 o’clock) position. Allow the methanol to soak for one minute before
adding sample.
Note: If the vacuum pressure is not fully vented from the StepSaver, the methanol will
continue to flow through the disk even through the valve is in the off/off position.
Also, a small amount of methanol may leak from the vent hole in the manifold if the
stopcock is not moved up to the off/off position.
11. Add sample on top of methanol and immediately turn vacuum to ‘on’ position.
12. Set empty container on its edge so that the remaining water (1 to 3 mL) can collect,
then add this remaining water to the reservoir before the extraction is complete.
13. After elution is complete, continue vacuum to air dry the filter for 5-20 minutes.
The longer the better.
Note: While the filter is drying pre-weigh the collection flasks (5 decimal place
accuracy).
Sample Elution
1. Position StepSaver stopcock (upper stopcock) to collection position.
2. Remove waste flask and properly dispose of collected solvents. Gently attach a 5.5
g sodium sulfate cartridge to the luer tip in the collection arm of the StepSaver.
(When attaching and removing the cartridge be careful to pull straight up and down.)
Attach collection flask that has been dried and weighed.
3. Add 10-15 mL of n-hexane to sample container, rinsing down the sides. Shake the
hexane around the sample container, venting the cap occasionally. Pour the n- hexane
from sample container into StepSaver funnel.
4. Carefully apply vacuum and release to pull a few drops of n-hexane through the
disk. Allow the hexane to soak the filter for two minutes.
5. Carefully apply vacuum to slowly pull hexane through disk, through sodium sulfate
drying cartridge and into the pre-weighed flask. It is important to pass the n-hexane
through the drying cartridge slowly to allow adequate contact time for water
absorption.
6. After all hexane has passed into the collection flask, turn the vacuum to off/vent
position.
7. Rinse down the sides of the 1-liter funnel with 10-25 mL of n-hexane. Be sure to
rinse with hexane until all O&G is removed from the sides of the glass funnel.
Page 166
152
Note: Stearic acid sticks to glassware. Be sure to rinse the funnel walls with hexane
until all Stearic acid crystals dissolve. Failure to thoroughly rinse Stearic acid from
the glassware will result in low recoveries.
8. Remove pre-weighed collection flask, and evaporate n-hexane at a temperature of
80-85°C in a hot water bath. Do not boil or evaporate to absolute dryness. Sweep with
a vacuum tube to evaporate via air flow the final drops of n-hexane and fumes.
Desiccate to room temperature. Reweigh flask to obtain final weight.
Note: Hexadecane will volatilize if the n-hexane boils. Further, hexadecane begins to
volatilize soon after the weighing flask becomes dry. Be sure to weigh the flask
within an hour or two of placing it into the desiccator. Do not store weigh flask in
desiccator overnight. Reducing volatilization of hexadecane will improve recoveries.
5.4 Cleaning
For O&G applications only the funnel needs to be cleaned with soap and water after
use. The stopcock and the head of the StepSaver may be cleaned by rinsing with
hexane.
6.0 O&G STANDARDS AND QUALITY ASSURANCE
A method blank flask was carried through the procedure for quality assurance and
control. Blank mass was subtracted from or added to final mass measurements of sample
flasks. The reported method detection limit for EPA method 1664: Revision A is 1.4 mg
L-1 O&G. The method limit of detection for this specific procedure and for research
purposes was set at three times the standard deviation of the blanks for a given set of
samples.
Motor Oil Standards
Motor oil standards (i.e. known mass of motor oil in a known volume of water)
are used in this procedure to demonstrate calibration verification as part of ongoing
precision and recovery. If the standard recoveries are within the range specified (78-
114%), the extraction, distillation, and weighing processes are in control. Percent
recoveries for standards can be calculated using the following equation:
𝑃 = 100 ×𝐴
𝐵
where, P is the percent recovery, A is the measured concentration of the calibration
standard, and B is the theoretical concentration of the calibration standard (i.e. mass of
motor oil (mg)/volume of standard (L).
Sample Matrix Spiking
Analysis of a matrix spike is required to demonstrate recovery and to monitor matrix
interferences. Matrix spikes were completed by collecting duplicate samples and spiking
one with a known mass of motor oil. Matrix spikes should be conducted for each set of
Page 167
153
20 samples or less (USEPA, 1999). Acceptable matrix spike recoveries are 78-114%,
calculated using the following equation:
𝑃 = 100 ×𝐴 − 𝐵
𝑇𝐸
where, P is the percent recovery, A is the measure concentration of analyte after spiking,
B is the measured background concentration of the sample, and TE is the true
concentration of the spike.
If any part of the ongoing precision and recovery quality assurance and controls measures
are out of control (i.e. standards or matrix spike recoveries out of range) the operator
should trouble shoot the O&G procedure and make modifications as needed. Duplicate
samples may need to be collected and analyzed until the methods are under control.
7.0 QUALITY CONTROL CHECKS AND ACCEPTANCE CRITERIA
All procedures are subject to review by the Quality Assurance Unit.
8.0 REFERENCES
United States Environmental Protection Agency (USEPA), 1999. Revision A: n-hexane
extractable material (HEM; oil and grease) and silica gel treated n-hexane
extractable material (SGTHEM; non-polar material) by extraction and gravimetry.
EPA Method 1664. EPA-821-R-10-001. Office of Water, Washington, DC.
Page 168
154
METHOD FOR DETERMINATION OF ACID-VOLATILE SULFIDES IN
HYDROSOIL
Daniel P Gaspari, Kristen N. Jurinko
1.0 OBJECTIVE
Concentrations of AVS in the hydrosoil and detritus were measured by the modified
diffusion method (Leonard et al., 1996). AVS is operationally defined by Leonard et al.
(1996) as sediment sulfide that is liberated by treatment of the sediment with 1-N
hydrochloric acid. AVS is a measure of reactive sulfide, which includes primarily free
sulfides, amorphous iron monosulfide (FeS), and sulfides of other divalent metals (e.g.
Cd, Cu, Ni, and Zn; Di Toro et al., 1992; Yu et al., 2001).
2.0 HEALTH AND SAFETY
Proper laboratory attire, including scrubs, lab coat, gloves, and safety glasses must be
worn at all times.
3.0 PERSONNEL/TRAINING/RESPONSIBILITIES
Any graduate research assistant familiar with the equipment and laboratory techniques
and trained in this and referenced SOPs may perform this procedure.
4.0 REQUIRED AND RECOMMENDED MATERIALS
5.1 Supplies
50-mL polypropylene centrifuge tubes
500-mL glass bottle (capped)
Deionized water
5.2 Equipment
Magnetic stir bar
Magnetic stir plate
Analytical balance capable of weighing ± 0.1 mg
5.3 Reagents
1-N trace metal grade (37%) HCl
Sulfide Antioxidant Buffer (SAOB):
2 M NaOH to convert H2S into S2-
0.1 M ascorbic acid to prevent oxidation of S2-
Page 169
155
0.1 M EDTA to complex metals that may have catalyzed the oxidation of S2-
1.0 M Sulfide stock solution:
Prepare using freshly washed sodium sulfide crystals to remove oxidized sulfide
products & store at 4°C
For calibration of the ion-selective electrode (ISE), prepare dilutions over the
range 10-1 to 10-4 M in SAOB solution.
5.0 PROCEDURE
5.1 Making Standards
5.1.1 SAOB
To make 500 mL, add 100 mL of deionized water to a 500 mL glass bottle. Next, add
40 g NaOH pellets and stir until NaOH completely dissolves to form a white liquid.
Add 14.612 g EDTA and 8.8 g ascorbic acid. Make to volume and cover to prevent
oxidation. Store at 4°C. Use before solution turns dark brown.
5.1.2 Stock Standard
Set up vacuum filtration. Weigh and crush 2.4018 g NaS crystals with mortar and
pestol under fume hood. Rinse crystals with deionized water and vacuum filter water.
Quickly add NaS to 50 mL SAOB in a 100 mL volumetric flask and fill to volume
with deionized water. Stir with magnetic rod until crystals are dissolved. Cover with
Parafilm and store at 4°C.
5.1.3 Standards & Calibration Curve
The stock solution prepared above is the 10-1 M standard. To make 10-2 M, mix 25
mL SAOB with 5 mL stock solution and fill to volume with deionized water in a 50-
mL volumetric flask. Repeat making serial dilutions for 10-3 and 10-4 standards.
Clean and fill both the inner and outer filling solution of the reference probe. Place
both the sulfide probe and the reference probe in the standard poured into a small
beaker. Wait until the ISE reaches equilibrium; record mV readings to make a
calibration curve.
5.2 Sample Preparation & Acidification
Add 50 mL of 1-N de-aerated trace metal grade (37%) HCl and magnetic stir bar to
500 mL glass bottle. Add 30 mL SAOB to a 50-mL centrifuge tube cut to fit inside of
the glass bottle.
Weigh and cap 5 g of wet hydrosoil in a 50-mL centrifuge tube in an anaerobic
chamber. Quickly, place sample in bottom of the 500 mL glass bottle and cap. Stir for
60 minutes allowing it to be briskly stirred.
Page 170
156
Pour SAOB into a small beaker for measurement of sulfide.
5.3 Measurement of Sulfide
Measure the sulfide generated and trapped in the SAOB using an ion-selective
electrode. Rinse probes with deionized water between each measurement.
6.0 QUALITY CONTROL CHECKS
All procedures are subject to review by the Quality Assurance Unit.
7.0 REFERENCES
Di Toro, D.M., Mahony, J.D., Hansen, D.J., 1992. Acid volatile sulfide predicts the acute
toxicity of cadmium and nickel in sediments. Environmental Science &
Technology, 26, 96–101.
Leonard, E.N., Ankley, G.T., Hoke, R.A., 1996. Evaluation of metals in marine and
freshwater surficial sediments from the environmental monitoring and assessment
program relative to proposed sediment quality criteria for metals. Environmental
Toxicology, 15, 2221-2232.
Yu, K., Tsai, L., Chen, S., Ho, S., 2001. Chemical binding of heavy metals in anoxic
river sediments. Water Resources Research, 35(17), 4086-4094.