+ All Categories
Home > Documents > A HYPOTHESIS OF A RECENT POLEWARD SHIFT IN THE ... · aguas cálidas del Atlántico (AWP), un...

A HYPOTHESIS OF A RECENT POLEWARD SHIFT IN THE ... · aguas cálidas del Atlántico (AWP), un...

Date post: 03-Dec-2018
Category:
Upload: hoangdung
View: 214 times
Download: 0 times
Share this document with a friend
11
SCRS/2013/161 Collect. Vol. Sci. Pap. ICCAT, 70(4): 1998-2008 (2014) A HYPOTHESIS OF A RECENT POLEWARD SHIFT IN THE DISTRIBUTION OF NORTH ATLANTIC SWORDFISH Michael J. Schirripa 1 SUMMARY Observations of opposing trends in abundance for northern swordfish suggested the possibility of a shift in abundance from warm, southern latitudes to cooler, more northern latitudes. Several of the observed indices of abundance changed sharply in direction in from negative to positive, while others showed an opposite change. The observed changes in the direction of the abundance indices correspond with changes in trends in the size of the Atlantic Warm Pool (AWP), the change in sign of the Atlantic Multidecadal Oscillation (AMO), and the North Atlantic Oscillation (NAO). To quantify a possible relation between the changes in abundance and the various candidate environmental indices, we ran the assessment model without the influence of the environmental data and regressed the residuals of the fit to the CPUEs to the various environmental indices. Given the suspected temperature tolerance limits of swordfish, it is possible that their either their preferred habitat has moved north, a preferred prey species, or both. RÉSUMÉ Des observations des tendances opposées de l'abondance de l'espadon du Nord ont suggéré la possibilité d'un déplacement de l'abondance des latitudes tempérées méridionales aux latitudes plus fraîches plus au Nord. Plusieurs des indices d’abondance observés ont brusquement changé de direction, passant du négatif au positif, tandis que d'autres ont montré un changement opposé. Les changements observés dans la direction des indices d’abondance correspondent aux changements de tendance de la taille du "Atlantic Warm Pool" (AWP), au changement du signe de l'oscillation atlantique multidécennale (AMO) et de l'oscillation nord- atlantique (NAO). Afin de quantifier une possible relation entre les changements de l'abondance et les divers indices environnementaux potentiels, nous avons exécuté le modèle d’évaluation sans l'influence des données environnementales et régressé les valeurs résiduelles de l'ajustement des CPUE aux divers indices environnementaux. Étant donné les limites de tolérance présumées de l'espadon à la température, il est possible que son habitat préféré se soit déplacé vers le Nord ou vers ses proies préférées, ou bien vers les deux. RESUMEN Las observaciones de tendencias opuestas en la abundancia de pez espada septentrional sugieren la posibilidad de un desplazamiento en la abundancia de latitudes más cálidas y meridionales a latitudes más frías y septentrionales. Varios de los índices de abundancia observados cambiaban abruptamente de dirección de negativo a positivo mientras que otros mostraban un cambio opuesto. Los cambios observados en la dirección de los índices de abundancia se corresponden con cambios en las tendencias en el tamaño de la Piscina de aguas cálidas del Atlántico (AWP), un cambio de signo de la Oscilación Multidécada del Atlántico (AMO) y de la Oscilación del Atlántico Norte (NAO). Para cuantificar una posible relación entre los cambios en la abundancia y los diversos índices medioambientales posibles, se ejecutó el modelo de evaluación sin la influencia de los datos medioambientales, y se realizó una regresión de los residuos del ajuste de las CPUE a los diversos índices medioambientales. Teniendo en cuenta los presuntos límites de tolerancia a la temperatura del pez espada, es posible que su hábitat preferido se haya desplazado hacia el norte o que se haya desplazado hacia su presa preferida o ambos. KEYWORDS Abundance indices, Environmental factors, Stock distribution, Swordfish 1 NOAA Fisheries, Southeast Fisheries Center, Sustainable Fisheries Division, 75 Virginia Beach Drive, Miami, FL, 33149-1099, USA. Email: [email protected] 1998
Transcript

SCRS/2013/161 Collect. Vol. Sci. Pap. ICCAT, 70(4): 1998-2008 (2014)

A HYPOTHESIS OF A RECENT POLEWARD SHIFT IN

THE DISTRIBUTION OF NORTH ATLANTIC SWORDFISH

Michael J. Schirripa1

SUMMARY

Observations of opposing trends in abundance for northern swordfish suggested the possibility

of a shift in abundance from warm, southern latitudes to cooler, more northern latitudes.

Several of the observed indices of abundance changed sharply in direction in from negative to

positive, while others showed an opposite change. The observed changes in the direction of the

abundance indices correspond with changes in trends in the size of the Atlantic Warm Pool

(AWP), the change in sign of the Atlantic Multidecadal Oscillation (AMO), and the North

Atlantic Oscillation (NAO). To quantify a possible relation between the changes in abundance

and the various candidate environmental indices, we ran the assessment model without the

influence of the environmental data and regressed the residuals of the fit to the CPUEs to the

various environmental indices. Given the suspected temperature tolerance limits of swordfish, it

is possible that their either their preferred habitat has moved north, a preferred prey species, or

both.

RÉSUMÉ

Des observations des tendances opposées de l'abondance de l'espadon du Nord ont suggéré la

possibilité d'un déplacement de l'abondance des latitudes tempérées méridionales aux latitudes

plus fraîches plus au Nord. Plusieurs des indices d’abondance observés ont brusquement

changé de direction, passant du négatif au positif, tandis que d'autres ont montré un

changement opposé. Les changements observés dans la direction des indices d’abondance

correspondent aux changements de tendance de la taille du "Atlantic Warm Pool" (AWP), au

changement du signe de l'oscillation atlantique multidécennale (AMO) et de l'oscillation nord-

atlantique (NAO). Afin de quantifier une possible relation entre les changements de

l'abondance et les divers indices environnementaux potentiels, nous avons exécuté le modèle

d’évaluation sans l'influence des données environnementales et régressé les valeurs résiduelles

de l'ajustement des CPUE aux divers indices environnementaux. Étant donné les limites de

tolérance présumées de l'espadon à la température, il est possible que son habitat préféré se

soit déplacé vers le Nord ou vers ses proies préférées, ou bien vers les deux.

RESUMEN

Las observaciones de tendencias opuestas en la abundancia de pez espada septentrional

sugieren la posibilidad de un desplazamiento en la abundancia de latitudes más cálidas y

meridionales a latitudes más frías y septentrionales. Varios de los índices de abundancia

observados cambiaban abruptamente de dirección de negativo a positivo mientras que otros

mostraban un cambio opuesto. Los cambios observados en la dirección de los índices de

abundancia se corresponden con cambios en las tendencias en el tamaño de la Piscina de

aguas cálidas del Atlántico (AWP), un cambio de signo de la Oscilación Multidécada del

Atlántico (AMO) y de la Oscilación del Atlántico Norte (NAO). Para cuantificar una posible

relación entre los cambios en la abundancia y los diversos índices medioambientales posibles,

se ejecutó el modelo de evaluación sin la influencia de los datos medioambientales, y se realizó

una regresión de los residuos del ajuste de las CPUE a los diversos índices medioambientales.

Teniendo en cuenta los presuntos límites de tolerancia a la temperatura del pez espada, es

posible que su hábitat preferido se haya desplazado hacia el norte o que se haya desplazado

hacia su presa preferida o ambos.

KEYWORDS

Abundance indices, Environmental factors, Stock distribution, Swordfish

1 NOAA Fisheries, Southeast Fisheries Center, Sustainable Fisheries Division, 75 Virginia Beach Drive, Miami, FL, 33149-1099, USA.

Email: [email protected]

1998

Introduction

Directional differences in North Atlantic Swordfish CPUE were observed from fisheries operating mostly in the

northern latitudes of the northern hemisphere to those fishing more southern latitudes of the northern

hemisphere. Abrupt and opposite in direction changes in the northern CPUE of Canada and Japan in 1995 were

coincident in time with a drop in the southern most US CPUE. As these sets of indices are presumably indexing

the abundance of a single stock, these observations suggest the possibility of a poleward shift in the distribution

of Swordfish.

Although the different CPUEs are from different countries, they do not cleanly represent a particular zone

designation (Figure 1). Further examination of the area specific US CPUE’s by area showed similar trends

comparing north to south areas (Figure 2). To create a more zone refined examination of the trends the

combined CPUE time series was used to calculate the least square means of the (year*zone) effect (Ortiz et al.

2013). The trends in the lsmeans were supported the previous observations that the northern most zones (zones

7-12) were experiencing higher CPUE’s than the southern zones (zones 1-3), while the middle zones (zones 4-6)

remained relatively stable (Figure 3).

Poleward shifts in species distribution along the eastern seaboard of the United Sates have been documented for

several other species (citations). Swordfish are a highly mobile and migratory species and their biology and life

history characteristics suggest that changes in their distribution are quite conceivable. A poleward shift suggests

an imbalance in the suitability of the conditions between the area the fish are migrating from (the southern

latitudes of the northern hemisphere in this case) and those in the area the fish are migrating to (the northern

latitudes of the northern hemisphere). This imbalance could be the result of many things. In the case of

Swordfish, movement from the south (“push”) may be due unfavorable environmental conditions in the south,

such as undesirable temperature, decreased oxygen, changes in salinity, or lack of prey (perhaps for similar

reasons). Perhaps from another perspective, movement to the north (“pull’) may be more favorable conditions in

terms of temperatures, increased oxygen, and/or salinity or a poleward shift in a preferred prey item. Another

possibility is that the environmental cues some portion of the Swordfish population use to start an apparent

summer seasonal migration northward (assuming any exist) may have also started trending coincident with the

observed CPUE patterns.

Several oceanographic indicators changed direction coincident with the change in direction of the CPUE indices

of abundance (Figure 4). These include the Atlantic Multidecadal Oscillation (AMO), the size of the Atlantic

Warm Pool (AWP) (also referred to as the Western Hemisphere Warm Pool), and the North Atlantic Oscillation

(NAO) (IROC 2009-2012). These are generally temperature based indices and as such were found to be highly

correlated (Figure 5). While temperature is one of the most common explanatory variables used to account for

changes in the distributions in fish, the true underlying driver is more likely a combination of factors, some of

which could likely be correlated with temperature.

Published finding of PSAT tagging studies was examined to determine if Swordfish exhibit an upper temperature

tolerance. Studies suggest that Swordfish may in fact prefer temperature between 28 and 29 degrees Centigrade

(citations) (Figure 6). More work needs to be done here to verify the upper temperature tolerances and/or

preferred temperature of swordfish.

The AWP is a region of sea surface temperatures (SST) warmer than 28.5°C that develops west of Central

America in the spring, then expands to the tropical waters to the east. This index was chosen to represent the

thermal conditions experienced by Swordfish. The index of the size of the AWP changed from negative (smaller)

to positive (larger) in 1998 (Figure 7). Also of interest is the monthly climatology of the AWP (Figure 8). We

took US observer data and plotted the density of Swordfish observations by month and latitude across all years.

On top of this plot we overlaid the monthly climatology of the AWP. There was a distinct similarity between the

timing of the expansion of the AWP and the annual northward increase in the number of Swordfish observed

(Figure 9). It is possible that the expansion of the AWP is the trigger for Swordfish to start their annual

northward migration. It need be kept in mind that the US observer data is not the ideal dataset to detect the

location of swordfish in any given month; however, it can be used as a reasonable proxy the purposes of this

paper with the assumption that observers follow the fishermen, who in turn follow the swordfish. Furthermore,

the results are agreement with the accepted biology of the species. The size of the AWP was relatively small in

1996, the year of the lowest Canadian CPUE and was at a thirteen year high in 2010, the year of the highest

Canadian CPUE (Figure 10). It should be noted that the AWP forms a “C-shape” as it develops over the year

with the western edge expanding further north than the eastern edge.

1999

If there has indeed been a poleward shift in swordfish it could have management implications. First, the CPUE’s

used in the assessment might not match the configuration and structure of the assessment model, possibly

resulting in increased error and inaccuracies in the assessment. Second a redistribution of the stock across

management boundaries should be fully understood so that it can be determined if management decisions might

benefit by taking this shift into account. This study sought to address three questions: (1) is there sufficient

evidence to conclude that there has been a recent poleward shift in the Swordfish distribution in the north

Atlantic; (2) if so, can this shift be quantified and are we making managerial progress by accounting for it within

the stock assessment model; and (3) assuming number one is true, is this poleward shift unidirectional, or are we

merely observing an abbreviated section of a reoccurring decadal cycle, the direction of which could change

again sometime in the future.

Material and methods

The hypothesis that the expansion of the Atlantic Warm Pool could explain the residuals in the fit the CPUE

indices was tested using the northern Swordfish Stock Synthesis (SS) assessment model. Country (and by proxy,

zone) specific CPUE data from the 2013 Swordfish assessment was used as an annual index of abundance. The

preliminary assessment model for northern Swordfish was used to create deviations in the fit to the CPUE time

series without the influence of the environmental covariates (SS model Run_5). This process removes the trend

in the CPUE residuals created by changes population size and any other covariates used in the GLM to create the

indices. These residuals were then regressed against the various environmental indices to investigate relations.

The model that was tested used the United States, Canada, and the Japanese CPUE time series. The Spanish

CPUE residuals were also examined but they were not part of the model fit. This was because the Spanish age-

specific CPUE were used instead and it would have been inappropriate to use both in the same model. However,

the age-specific CPUE were also examined for similar trends.

Results

The AWP was able to account for a large portion of the variation in the Canadian CPUE residuals (r2 = 0.3735),

some of the variation in the Spanish (r2 = 0.1376) and virtually none of the US (r2 = 0.0026) or the Japanese (r2

= 0.0002) (Figure 11).

Other studies (Mejuto et al. SCRS/2013/107) have shown that CPUE’s might not be specific to zone but to age

as well. We investigated this by including the link to the environmental data to the five age-specific CPUE’s

already in use in Run_5. The AWP explained a great deal of the variations in the Spanish age-specific CPUE

residuals: age-1, r2 = 0.3686; age-2, r2 = 0.4047; age-3, r2 = 0.0031; age-4, r2 = 0.3421; age-5+, r2 = 0.4783)

(Figure 13).

Given the strong correlations outlined above, catchability of ten CPUE time series were allowed to vary

according to the size of the AWP. Of the ten CPUE time series considered, seven fleets had estimates of the

slope parameter significantly different from zero (Figures 14-16).

Discussion

This study sought to address three questions: (1) is there sufficient evidence to conclude that there has been a

recent poleward shift in the Swordfish distribution in the north Atlantic; (2) if so, can this shift be quantified and

are we making managerial progress by accounting for it within the stock assessment model; and (3) assuming

number one is true, is this poleward shift unidirectional, or are we merely observing an abbreviated section of a

reoccurring decadal cycle, the direction of which could change again sometime in the future.

I believe there is sufficient evidence to conclude the distribution of northern Swordfish has changed from what is

was prior to 1996. Furthermore, I believe that this is likely due to a change in one or more environmental factors,

be they related to oceanography, prey distribution, or both. I also think that attempting to account for this

redistribution within the stock assessment model is the correct approach. It can help account for conflicting

indices and provide a more precise fit the observational data. It is difficult to know if this shift is unidirectional.

However, if it is in fact a function of the size of the AWP or one of its correlated indices, such as the AMO, then

we may see the trend shift again as these indices change direction. However, there is no way of knowing exactly

what these indices will do in the future (yet).

2000

1

CPUE in Weight, Canada US Combined, Closed areas taken out

2

Figure 1. Distribution areas used in the standardization of the CPUEs of the different fleets.

Figure 2. Canada and USA combined standardized CPUE in weight. Closed areas have not been included in the

standardization.

2001

Several Ecosystem IndicatorsChanged in 1995 coincident with the Canadian CPUE

The Atlantic Multidecadal Oscillation (AMO)

The North Atlantic Oscillation (NAO)

Size of the Atlantic Warm Pool (AWP)

4

Lsmeans of year*area From GLM (Ortiz et al. 2013)

Northwest

Middle

Northeast

Southeast/west

3

Figure 3. Least square means of the interaction year*area from GLM (Ortiz et al. 2013).

Figure 4. Trend of several Ecosystem indicators showing the effect of the 1995 change on the Canadian CPUE.

2002

AWP

-1.5

-1.0

-0.5

0.0

0.5

-0.5

-0.3

-0.1

0.1

0.3

0.5

-5 -3 -1 1 3 5

-1.5 -1.0 -0.5 0.0 0.5

NAO

AMO.spring

-0.4 -0.2 0.0 0.2 0.4

-5

-3

-1

1

3

5

-0.5 -0.3 -0.1 0.1 0.3 0.5

-0.4

-0.2

0.0

0.2

0.4

AMO.summer

Although the AWP was chosen as the ENV index, all where highly correlated

5

SWO have been reported to have an upper tolerance of 28 degrees(This need more verification, perhaps via PSATs)

6

Figure 5. Effect of the ecosystem indicators on the indices of abundance. While temperature is one of the most

common explanatory variables used to account for changes in the distributions in fish, all indicators are highly

correlated.

Figure 6. Histograms of time spent in each of 12 programmed temperature bias during daytime (white bars),

crepuscular (grey bars), and nighttime hours (black bars) derived from time-at-temperature data sets for eight

swordfish tagged with PATs in the Florida Straits; error bars are ±SE.

2003

Atlantic Warm Pool (>28.5°C)

http://www.gccapitalideas.com/2012/05/24/spring-conditions-suggest-tempered-atlantic-hurricane-season-part-ii/http://www.aoml.noaa.gov/phod/regsatprod/awp/sst_anm.php

7

http://www.aoml.noaa.gov/phod/regsatprod/awp/sst_ts.php8

Figure 7. Distribution of the Atlantic Warm Pool (AWP) (>28.5º C.)

Figure 8. Yearly, monthly and daily distribution of the AWP.

2004

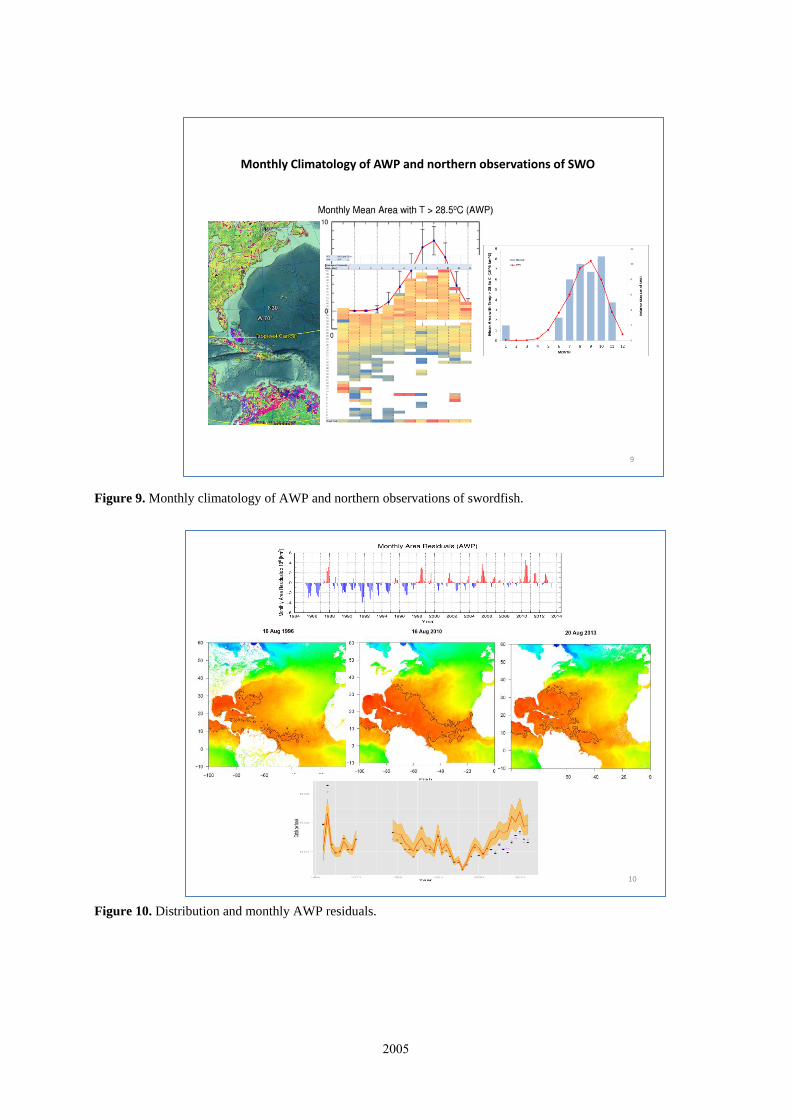
Monthly Climatology of AWP and northern observations of SWO

9

10

Figure 9. Monthly climatology of AWP and northern observations of swordfish.

Figure 10. Distribution and monthly AWP residuals.

2005

12

Figure 12. Temperature preferences of swordfish by sizes and age-specific standardized CPUE.

Figure 6. Deviations from the observed and expected CPUE regressedagainst the size of the Atlantic Warm Pool from Run_5 (the model thatdoes NOT include the ENV effect on catchability).

11

Figure 11. Deviations from the observed and expected CPUE

regressed against the size of the AWP from Run_5 (the model that

does not include the ENV effect on catchability).

2006

Fleet Catchability

Qy = Qbase * exp(β* AWPy)

where β is the new estimated parameter that describes the slope of the regression; is it different from 0?

• Run_5_ENV: Canadian, US, and Japan catchability (Q) was made a function of the size of the AWP (mean area with T>=28.5oC for that year in units of 10^6 km^2)

• Run_5_ENV_v2: Spanish age-specific CPUE’s were also given a ENV link

14

Figure 14. Catchability estimates specifications.

Figure 7. Deviations from the observed and expected Spanish age-specific CPUE regressed againstthe size of the Atlantic Warm Pool. The catchability of these fleets were not allowed to vary with theAWP index.

13

Figure 13. Deviations from observed and expected Spanish age.specific

CPUE regressed against the size of the AWP. The catchability of these fleets

were not allowed to vary with the AWP index.

2007

Beta Parameter Estimates

Num Label Value Parm_StDev Value-1.96*SD Value+1.96*SD <> 0

74 Q_envlink_2_US_2 0.0231 0.0437 -0.0625 0.1087

75 Q_envlink_3_US_3 -0.0973 0.0482 -0.1917 -0.0029 *

76 Q_envlink_5_Canada_5 0.1552 0.0237 0.1088 0.2017 *

77 Q_envlink_6_Japan_6 0.0345 0.0286 -0.0216 0.0906

78 Q_envlink_7_Japan_7 0.0409 0.1534 -0.2597 0.3415

79 Q_envlink_13_Age-1 0.1317 0.0295 0.0738 0.1896 *

80 Q_envlink_14_Age-2 0.0991 0.0235 0.0531 0.1451 *

81 Q_envlink_15_Age-3 0.0316 0.0141 0.0039 0.0593 *

82 Q_envlink_16_Age-4 -0.0528 0.0215 -0.0950 -0.0106 *

83 Q_envlink_17_Age-5+ -0.0371 0.0199 -0.0761 0.0020 *

15

Increase in Availability or Stock Size

Q > NorthQ > NorthQ < South

16

Figure 15. Beta parameter estimates.

Figure 16. Increase in availability or stock size.

2008


Recommended