Page 1
1
A Life Cycle Assessment (LCA) of Greenhouse Gas
Emissions from SRI and Flooded Rice Production
in SE India
Alfred Gathorne-Hardy1*
, with D. Narasimha Reddy2, Motkuri
Venkatanarayana2 and Barbara Harriss-White
1
1Oxford University, Oxford, UK;
2National Institute for Rural Development,
Hyderabad, India *Corresponding author: [email protected]
ABSTRACT
Rice feeds more people than any other crop, but each kilogram of rice is responsible for
substantially more greenhouse gas (GHG) emissions than other key staple foods. The System
of Rice Intensification (SRI) has recently received considerable attention for its ability to
increase yields while using less water. Yet so far there has been little research into the GHG
emissions associated with SRI production systems, and how they compare to those from
conventional flooded-rice production techniques.
A streamlined Life Cycle Assessment (LCA) methodology was used to compare the GHG
emissions and groundwater use from SRI and from conventional rice production. Input data
were derived from farmer questionnaires in SE India and appropriate secondary data sources.
The results showed that SRI methods substantially raised farmers' yields, from 4.8 tons to
7.6 ton per hectare, a 58% increase, while reducing water applications. At the same time it
was seen that SRI management offered opportunities for significant GHG reductions, both
per hectare and per kilogram of rice produced. These savings principally arise from reduced
methane emissions and reduced embodied emissions in the electricity used to pump water for
irrigation. SRI nitrous oxide emissions were somewhat higher than on control farms, but the
difference was significant only per hectare, not per kg of rice. The net effects of SRI practice
on reducing global warming potential were positive in that the small increases in N2O did not
offset the larger diminishment of CH4.
Key words: flooded rice production; greenhouse gas emissions; Life Cycle Assessment;
System of Rice Intensification
1.0 INTRODUCTION
Rice is the most important staple crop worldwide, directly feeding more than half the
world’s population. However, rice is also the most greenhouse gas-intensive staple crop,
producing about four times more GHG emissions per ton than wheat or maize (Linquist et al.
2012). The System of Rice Intensification (SRI) is novel set of rice production techniques
that has recently received considerable attention for their ability to increase yields. This paper
Page 2
2
uses a streamlined Life Cycle Assessment (LCA) methodology (White 2010) to compare the
GHG emissions and groundwater use resulting from conventional and SRI rice production
systems.
Three GHGs are important from rice production: carbon dioxide (CO2), methane (CH4)
and nitrous oxide (N2O).GHG emissions from conventional rice production are largely
associated with its water use via two mechanisms; first, through the embodied emissions
associated with irrigation provision, and second, from flooded soils which create the
anaerobic soil environments that drive microbial methane production. While rice does not
need to grow in flooded conditions, most rice does come from ponded systems (IRRI 2013).
This production system uses an estimated 34-43% of global irrigated water, or 24-30% of the
total freshwater withdrawals (Bouman et al. 2007). The pattern of GHG emissions from non-
flooded rice can be very different, with nitrous oxide playing an important role.
Embodied irrigation emissions derive from the energy used for pumping water. In
gravity-fed irrigation systems, this energy requirement can be minimal; but it can be high
with diesel-based groundwater extraction systems, or when using electricity not generated by
hydropower (Nelson et al. 2009).
The net methane emission from any specific paddy field is determined by a wide range of
factors (Adhya et al. 2000; Gathorne-Hardy 2013a; Yan et al. 2005), but two main drivers
dominate methane production: irrigation patterns, and the quantity of organic material in the
soil. The rate of oxygen diffusion through water is 10,000 times slower than through air, so
irrigation with flooding/ponding produces anaerobic conditions within hours of flooding
(Adhya et al. 2000; Bodelier 2003; Chanton et al. 1997).
Under anaerobic soil conditions, methanogens (methane-producing bacteria) produce
methane as a by-product of their respiration of organic matter. Under such conditions, the
supply of substrates for methanogens' subsistence is the commonest limiting factor (Wang et
Page 3
3
al. 2000; Yao et al. 1999). Organic matter in paddy fields originates from both direct by-
products of rice production (such as sloughed-off root cells and root exudates) and from
added materials (manures and crop residues). Control of methanogens' substrates is only
possible from modifying the latter.
In most arable agriculture, N2O is the dominant GHG, for example responsible for 80% of
wheat GHG emissions (Woods et al. 2008). Nitrous oxide is naturally produced from soils
during nitrification and de-nitrification by bacteria. In India, N2O is estimated to be
responsible for 13% of agricultural GHG emissions (MEF 2010).
However, direct N2O emissions from flooded paddy fields are minimal, as nitrification
does not occur under anaerobic conditions. Consequently neither can de-nitrification occur,
due to lack of NO3- in the soil (Qin et al. 2010). Even though minimal N2O emissions are
likely from the flooded soils, still some off-site (indirect) N2O emissions are likely from
irrigated rice production due to the addition of nitrogen fertiliser to fields because nitrogen
compounds can leach through the soil or are directly drained from the site.
The frequent draining of SRI-managed paddies creates intermittently aerobic soil
conditions that will allow bacterial nitrogen cycling in the soil, which can potentially increase
the N2O emissions from SRI fields compared to flooded fields (Hansen et al. 1993; Yan et al.
2000; Zheng et al. 2000). A trade-off is therefore expected between methane and nitrous
oxide as fully anaerobic soils inhibit the generation of N2O while facilitating methane
emissions. A more complicated relationship between CH4 and N2O emissions with regard to
flooded paddy fields is reported in this issue, however, when soil temperature, pH and other
factors are taken into account (Setiawan et al.). Also, several unpublished studies of this
relationship have not found N2O increases offsetting NH4 reductions under SRI management.
So this is a subject warranting further detailed investigation.
Page 4
4
1.1 The System of Rice Intensification
SRI methodology, developed in Madagascar in the 1980s, involves certain basic practices
that differ from age-old production techniques: (a) earlier transplanting, at the 2-3 leaf stage,
typically less than 15 days old, compared to up to 30-45 days old for conventional rice
transplanting; (b) only one plant per hill, in contrast to 3-5 or more plants; (c) hills laid out in
a grid pattern with wide spacing; (d) increased use of manure and other organic fertilisers;
and (e) intermittent flooding and draining of the rice paddies rather than continuously flooded
soils (Reddy and Mortkori 2013; Stoop et al. 2002; Uphoff 2008). Controlling weeds by the
use of a mechanical implement which disturbs the soil surface is highly recommended to
achieve the active soil aeration that better supports the growth of roots and the aerobic soil
biota.
While there has been controversy in the literature about the range of benefits associated
with SRI (Sumberg et al. 2013), a wide range of scientific journal articles, NGO literature,
and anecdotal reports suggest that grain yield gains are usually associated with it, as well as
reduced water use (Kassam et al. 2011; Sinha and Talati 2007; Uphoff 2008; WWF 2007).
However, there has been very little measurement of GHG emissions from SRI fields
compared to conventional paddy production. The literature offers little evidence that can used
to assess reliably the relative GHG impact of SRI crop and water management compared to
conventional production techniques (Choi et al. 2013).
Without systematic and quantified evidence it is hard to predict what the GHG impact is
likely to be since SRI management has direct impacts on many of the key paddy GHG
production processes. Methane emissions may be increased due to increased organic soil
amendments, or they could be decreased due to increased soil aeration. Nitrous oxide (N2O)
emissions, usually minimal from anaerobic (flooded) paddy fields, may increase when soils
are made more aerobic under SRI practice; or they could be little changed if the N supplied to
Page 5
5
fields is in organic rather than inorganic forms, so there is little excess reactive N to be
converted by microbial activity. Repeated flooding and drainage should result in less water
use; but whether pumping is actually reduced will depend upon the actual amount of flooding
and drainage compared to traditional water use, as well as on the kind and amount of energy
used for irrigation.
1.2 Life Cycle Assessment
The research reported here modelled and evaluated GHG (CO2, CH4 and N2O) emissions
from SRI compared to conventional flooded-irrigation paddy production techniques up to the
farm gate. Data were collected from Andhra Pradesh, India. It is part of a larger project that
generates and utilizes primary data to understand how a range of environmental effects (GHG
emissions, fossil and non-fossil energy, groundwater), social considerations (e.g., the
qualities, quantities and gender of jobs), and economic factors (costs, returns, value-added)
interact along the entire rice production-distribution supply chain, from field to shop, for four
different rice production techniques (SRI, organic, rainfed, and current conventional
management) and four different retail outlets. More information can be found at
http://www.southasia.ox.ac.uk/research-resources-potential-new-applications-resources-greenhouse-gases-
technology-and-jobs-indias.
GHG emissions from rice production were quantified using an analytical tool called Life
Cycle Assessment (LCA). LCA is defined as the ‘compilation and evaluation of the inputs,
outputs and the potential environmental impacts of a product system throughout its life cycle’
(ISO 2006). This includes all stages required for the creation of the material of interest
through to its disposal or recycling, and it includes a variety of criteria that range from energy
use to eco-toxicity. The research detailed in this paper is limited to assessing GHG emissions
and groundwater use, not the wider range of environmental impacts included within a fully
LCA, so accordingly we refer to the analysis as ‘streamlined’ LCA (White 2010).
Page 6
6
1.2.1 Issues of allocation
When more than one output is produced from a process, the associated emissions must be
allocated between or among them (European Commission, 2010; ISO, 2006). Consider, for
example, the role of livestock in paddy production. In addition to providing manure for
maintaining soil fertility, and in some cases providing traction (ploughing), cows produce
calves and milk. All of these outputs may have economic value. To assign all the emissions
from cows to just one of these outputs would give one output an inflated debit and would
give the other outputs unwarranted credit in terms of their respective contributions to global
warming potential (GWP).
Accordingly, the overall emissions from a production process must be allocated
appropriately between or among the outputs. Allocation can occur through different
measures, including by mass, by energy content, or by value (Anon. 2009). Economically-
based allocation of emission 'debits' best reflects the drivers of production (Williams et al.
2006). In economic allocation, the proportional allocation of emissions to each co-product is
determined by the respective economic value of each co-product, on the assumption that the
co-products drive the total production in proportion to their economic value.
The paddy field itself is a multi-functional resource, producing straw as well as paddy.
Yet in rice LCAs, rice straw is commonly not allocated to the emissions attributed to rice
(Blengini and Busto 2009), or even more commonly it is not even mentioned (Blengini and
Busto 2009; Hokazono and Hayashi 2012; Wang et al. 2010). As a useful by-product (straw
can be used for animal bedding, as soil mulch cover, for fodder or cooking, and in some parts
of India for paper making), it should be allocated a share of the environmental burden
associated with rice production.
Page 7
7
Since approximately equal weight and energy are involved in the production of straw and
paddy grain, the environmental costs/benefits of straw and paddy should be allocated equally
if mass or energy is used as the criterion of allocation. But this would not reflect the
motivating factors for paddy farming, which is driven mostly by paddy production
expectations, with straw considered by producers as a potentially useful by-product. This
makes economically-based allocation more realistic. Economic methods to allocate emissions
to straw are discussed under Methods, below.
2.0 METHODS
This research modelled GHG emissions from SRI and conventional/intensive rice
production techniques (the latter hereon referred to as ‘control’) from a case study site in
Andhra Pradesh, India. Life Cycle Assessment (LCA) was used to determine the GHG
emissions based on the standards and criteria of ISO 14040, PAS 2050, and the ILCD
handbook (European Commission 2010; ISO 2006; BSI 2011). A mixture of primary and
secondary data was involved to construct the quantified analysis.
Primary data on farmers' practises and results were collected in the second half of 2012
for the crops of the preceding agricultural year (2011-2012). Data were collected using recall
methods via an extensive (31-page) survey of selected farm households. These data were
collected as part of a wider project, looking at how social, economic and environmental
criteria all interact within the rice production and supply chain. Secondary data included
inventory data from a range of sources, as detailed in the Annex.
Data collection took place in the Janagaon region of Warangal District, Andhra Pradesh,
SE India. This is a semi-arid area with average annual rainfall of 865 mm, concentrated in
the SW monsoon season, with 624 mm falling from June to September (Anon. 2013). The
altitude is approximately 380 m above sea level.
Page 8
8
Twenty 'SRI' farms were sampled along with 10 control farms in the area. While this
sample size is not large, due to the logistical limitations associated with the extensive data
collection required for the wider project as discussed in section 1.2 above, the results
reviewed in section 3.0 passed a number of statistical tests and are unlikely to be due to
chance. The control farms were ones using standard, intensive, flooded paddy production and
‘Green Revolution’ production methods. The key agronomic practices used in the two sets of
farmers are reviewed in sections 3.1 and 3.2 below.
The farms using SRI methods in our sample were not necessarily using the full set of SRI
practices or using them all as recommended, but there were demonstrable and significant
differences between the sets of practices being evaluated. Possibly the differences in results
reported here would have been greater or different if the evaluation of SRI methods had been
done more strictly, under strictly controlled conditions. But for this study, we wanted to
consider the results of actual practice, which is invariably imperfect. In philosophical terms,
what was evaluated was the ‘existence’ of SRI rather than its ‘essence.’
Individual farms for both control and SRI surveys were chosen using a semi-random
snowballing technique, the semi-random aspect including selection of farms aimed to ensure
that the distribution of farms sizes was representative of that in the area as reported in the
Agricultural Census. There proved to be no statistical difference between control and SRI
farms in key socio-economic and environmental attributes (farm size and water table), as seen
in section 3.2. Climate variables were not considered due to the close and overlapping
locations of the control and SRI farms.
2.1 Functional units
Page 9
9
This paper uses two approaches to understand the GHG impacts of SRI production
techniques – a bottom-up, land-based approach, and a top-down, product-based approach.
Bottom-up approaches are useful for measuring those environmental impacts that are most
relevant (directly or indirectly) on an area basis – for example, groundwater use, electricity
use, as well as impacts not measured in this study (water pollution, local air pollution, etc.).
Bottom-up, area-based measures are also the metrics most commonly used by farmers.
However, consumers do not buy areas of land; they buy the produce from the land. From
their perspective, environmental impact per unit of product (paddy rice) is a relevant metric.
Two functional units for analysis are thus used to reflect these bottom-up and top-down
approaches to evaluating rice production, respectively:
a. 1 hectare for one season of paddy production (area-based)
b. 1 kg of paddy at the farm gate (product-based).
2.2 System baselines and boundaries
Establishing an appropriate baseline (counter-factual) and boundaries is critical for
accurate, meaningful and representative results (Gathorne-Hardy 2013b). In this study, the
baseline to which SRI practices are compared is the Green Revolution paddy-farming system
by which most rice is produced in India today.
The boundaries included all inputs and processes necessary to grow paddy that make a
material difference to the final figures. We used 1% of the total as our criterion for a material
difference and did not consider any effect that was less than this. In this paper, inputs to post-
harvest processes that convert paddy into processed, polished rice were not included. These
are covered elsewhere (Gathorne-Hardy and Harriss-White 2013).
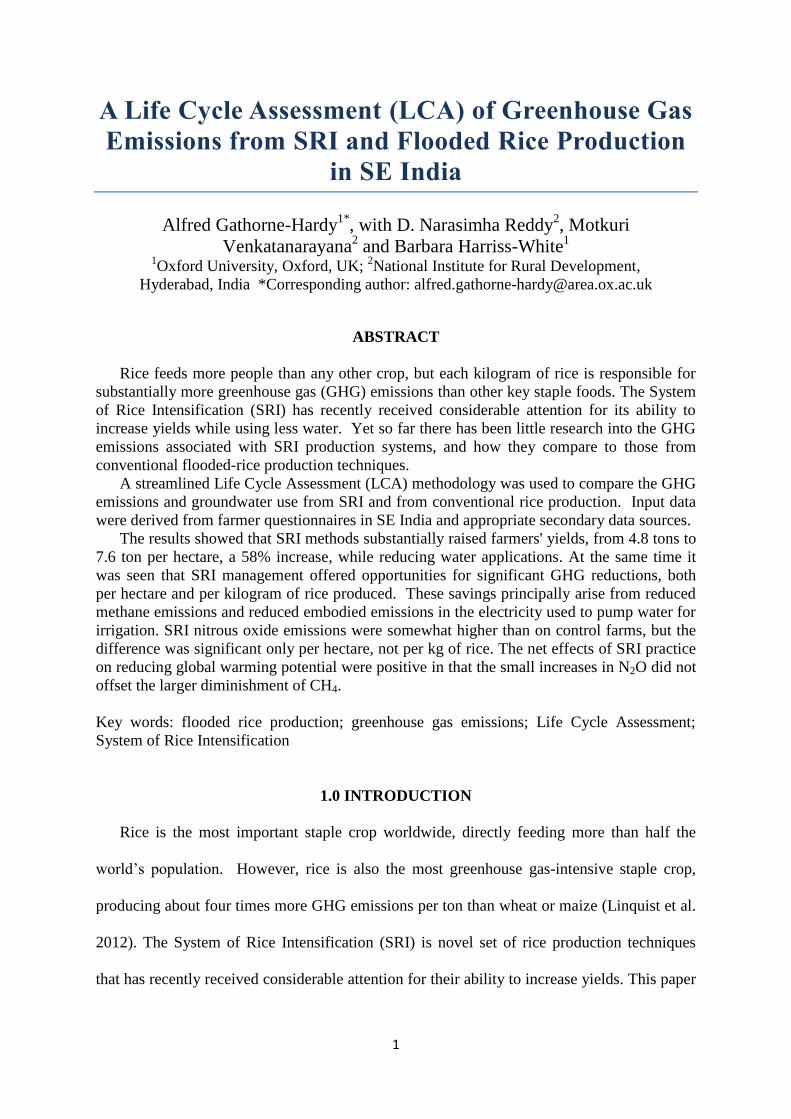
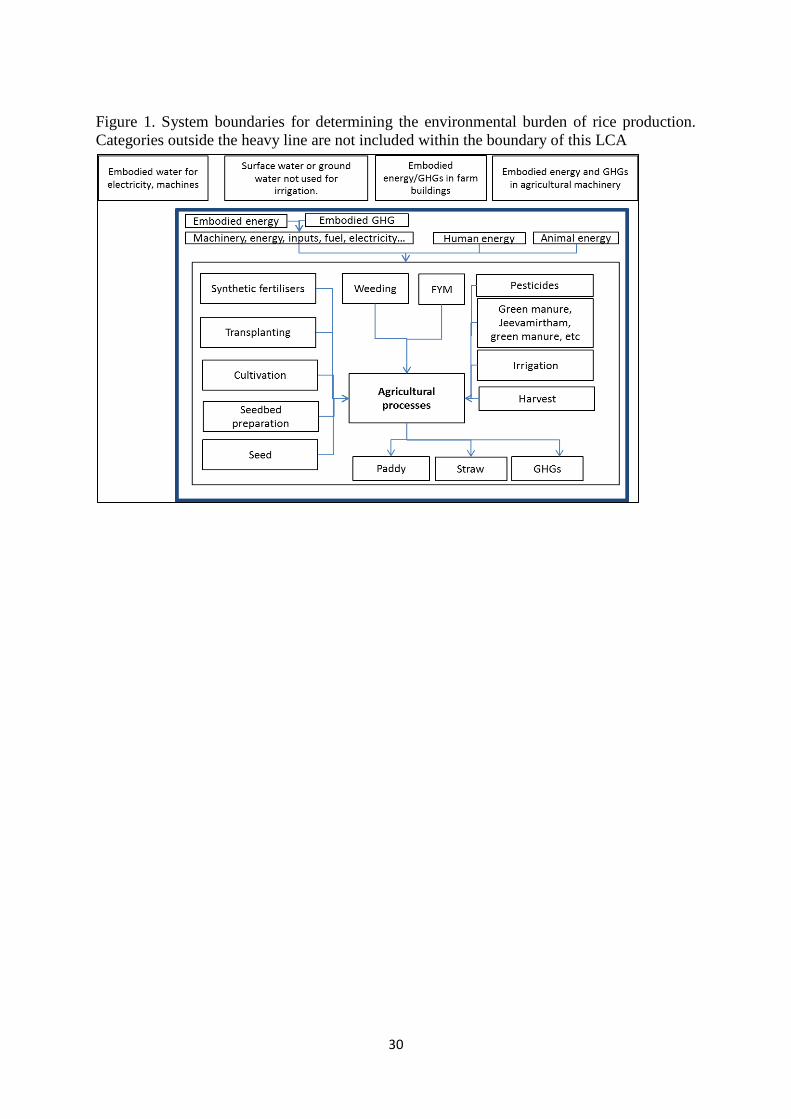
The boundaries to this study are shown in Error! Reference source not found.Error!
Reference source not found.. The central black box shows the processes for which we
Page 10
10
collected data. Everything within the blue box is included in the study. Outside this box are
four key elements that have not been included in the research reported here.
[Figure 1 about here]
Embodied water (the water used off-site for the production of goods/energy, for example,
tractors or electricity) was not included in the analysis due to lack of available data. Neither
was surface water included due to lack of ability to capture such data accurately using recall
surveys. However, this source of water contributes practically nothing to GWP, and no farms
in the sample irrigated with any other sources of water except groundwater and precipitation.
Embodied emissions associated with buildings were also not included because paddy is
normally stored – if stored at all – in the producer’s dwelling, and no other buildings were
deemed relevant to the production system for the field conditions observed. The main items
of machinery such as tractors and power tillers were included. Early analysis showed that the
combined embodied GHG emissions for other implements (weeders, trailers, levelling plates,
and ploughs) fell well below 1% inclusion criterion for material difference, so these were not
included in the analysis.
Allocation between co-products has been based on economic methods in this study.
Allocation to straw is made more difficult within this study for three reasons: (i) there is
rarely a market for the straw, (ii) few farmers know how much straw they harvest, and (iii)
straw that leaves the field sometimes, although not always, is returned to the field as manure.
The methods and measures that we have used to allocate GHG emissions to straw are detailed
in the next section.
Page 11
11
2.3 Inventory analysis and data sources
This section explains what information was collected, and what conversion factors were
used to generate the LCA model. This model aims to account for the amounts and sources of
GHG emissions that drive up global warming potentials, discussed below in some detail.
2.3.1 Assessment of global warming potentials
To calculate GHG equivalents, we used 100-year global warming potentials (GWP100) as
specified by IPCC 2007 (Forster et al. 2007). GWP is a measure of how much heat is retained
in the atmosphere for each gas, and the 100 indicates that the figures have been averaged to
assess the heat retained over a period of 100 years. GWPs are set up in reference to carbon
dioxide (CO2), which is given a value of 1.
The three main agricultural GHGs of concern are carbon dioxide (CO2), methane (CH4),
and nitrous oxide (N2O), which have GWPs, respectively, of 1, 25 and 298, meaning that
over 100 years, 1 kg of N2O released to the atmosphere will retain 298 times the amount of
heat retained by 1 kg of CO2 in the atmosphere. Using this metric, 1 kg of CO2 is 25 times
less carbon-polluting than releasing 1 kg of CH4. Levels of CH4 and N2O emissions for
flooded control irrigation paddy farm systems were taken directly from IPCC (2006).
Emissions for SRI rice production systems are not included in the IPCC report, so measured
emissions from controlled irrigation trials were used as a proxy, as described in the Annex.
The data sources and assumptions or coefficients used in calculation are given in the Annex.
2.3.2 Inputs not covered in the analysis
Jeevamirtham, a solution of water, manure, cattle urine, jaggery and various other
products, is used by organic and non-organic farmers as a fertiliser and pesticide. Typically it
is mixed and retained in a barrel for a few days before it is applied to the crop, often with the
Page 12
12
incoming water. The nutrient content of its ingredients is not substantial, but this mixture has
been reported to provide additional N for the soil and crop via N-fixing bacteria. This input
has not been included, but is not large.
Azospirillum, phosphobacteria, Pseudomonas, Azolla, and other microbial/biological
products used with SRI production have not been assigned embodied emissions in this
analysis. There are no data on which to base any assumptions about GHG emissions, and
when the authors inspected the facilities where they are produced, there was very little capital
infrastructure involved. Any embodied emissions in these products are likely to be minimal,
well below the 1% criterion.
2.3.3 Analysis
Analysis was carried out using a LCA model built in Excel, and statistics were tested with
SPSS software.
3.0 RESULTS AND DISCUSSION
3.1 SRI practices in the study site
The SRI principles as discussed in the introduction were not necessarily always precisely
followed on the ground. For example, the average age at transplanting was somewhat greater
than 15 days, although about half that of conventional practice; and typically more than 1
plant was transplanted per hill (Table 1). Yet with the exception of farm yard manure
applications, measures on the SRI farms studied were significantly different, and in the
expected direction, compared to those on control farms. The results reported are thus not for
the full use of recommended SRI practices. Such a pattern of partial and adaptive adoption of
new technology and practices is a widely observed phenomenon, characteristic of the early
stages of waves of most agricultural innovation (Richards 1985).
Page 13
13
[Table 1 about here]
3.2 SRI yield and GHG emissions compared to control farms
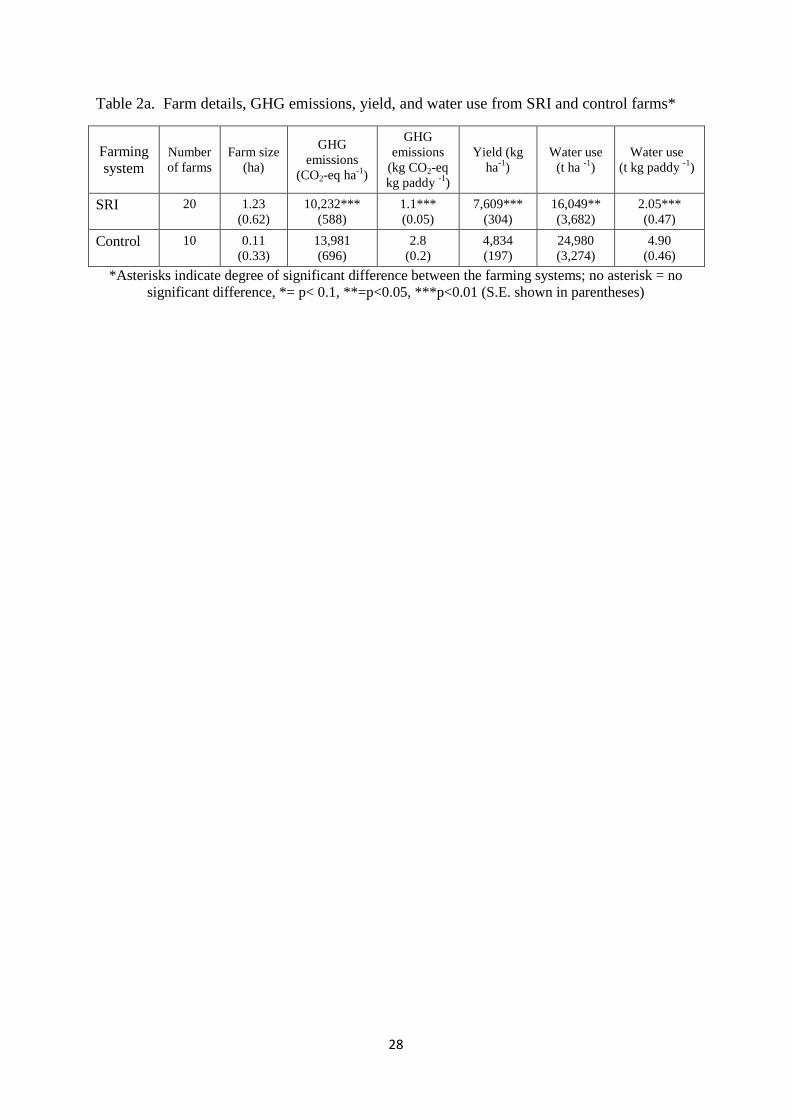
SRI management was found to increase grain yield by approximately 60% compared to
the control farms, 7.6 compared to 4.8 t ha-1
, respectively, p<0.001) (Table 2a). This is a
remarkable gain in yield when we consider that ambitious breeding programmes typically
provide yield gains of less than 1% yr-1
(Fischer and Edmeades 2010). With increasing
resource scarcity, including that of land, increasing yields from the same level of inputs is
likely to result in reduced adverse environmental impacts.
[Tables 2a and 2b about here]
Yet yield gains alone are not enough to guarantee environmental improvements; yield
gains from the increased use of certain inputs can be associated with local environmental
losses. However, in the case of SRI, the higher yield compared to the control farms was
associated with lower levels of inputs – significantly lower with respect to synthetic N, P and
K, and water (While significantly less methane is emitted per hectare with SRI compared to
the control farming systems, methane is still a major source of GHG from SRI production. It
is responsible for almost the same proportion of total GHG emissions in comparison to the
controls (47%), even though with SRI the soil is not consistently flooded. One reason for the
SRI methane emissions is the higher applications rates of organic amendments which serve as
feedstock for methanogens. This does not imply that soil amendments should be reduced in
SRI farms - they could be an important factor in increasing SRI yields. Research into
optimum feedstock application rates would be undertaken so that excessive rates are not used.
This is likely to become increasingly important with reduced livestock stocking densities in
rural areas reducing the availability of manure.
The modelled GHG emissions from SRI are highly sensitive to the assumed rate of
methane and nitrous oxide emissions compared to the default emission factors posted by
Page 14
14
IPCC 2006. At present, the emission factors are based on three pieces of research. As more
research is carried out specifically into the GHG emissions from SRI compared to control
production systems, the accuracy of comparative LCA models will increase.
The magnitude of the different results modelled above suggests that SRI will consistently
show GHG savings per kilogram of rice produced compared to conventional flooded
production systems. While an increase in N2O emissions could mitigate CH4 emission
savings on an area basis, we saw increased yield and reduced irrigation demand with SRI
management consistently reducing its GHG burden per kilogram of production.
b). The exception to this was a slightly higher application rate of FYM on the SRI farms
(18.7 compared to 17.0, p>0.1). This, however, resulted in no significant difference between
the total applications of N per hectare between the two production systems.
This strongly suggests that there is an inherent yield advantage in the SRI farming system
compared to the traditional wetland paddy system. To which aspect of SRI this may be
attributed is not yet clear – wider spacing, earlier transplanting, single plants per hill (all of
which contribute to increased tillering), or to the change in irrigation patterns. Ascertaining
this will require further factorial trials.
Table 2a shows the reduced GHG emissions per hectare-season with SRI management.
The emission savings are over 25% (13,981 to 10,232 kg CO2-eq ha-1
from the control and
SRI fields, respectively (p<0.01). The lower emissions from SRI are magnified when
evaluated in terms of GHG per kg of paddy, due to the higher yield from SRI. Thus, SRI is
responsible for less than half as much GHG emission per kilogram (p<0.001) as with
conventional rice production.
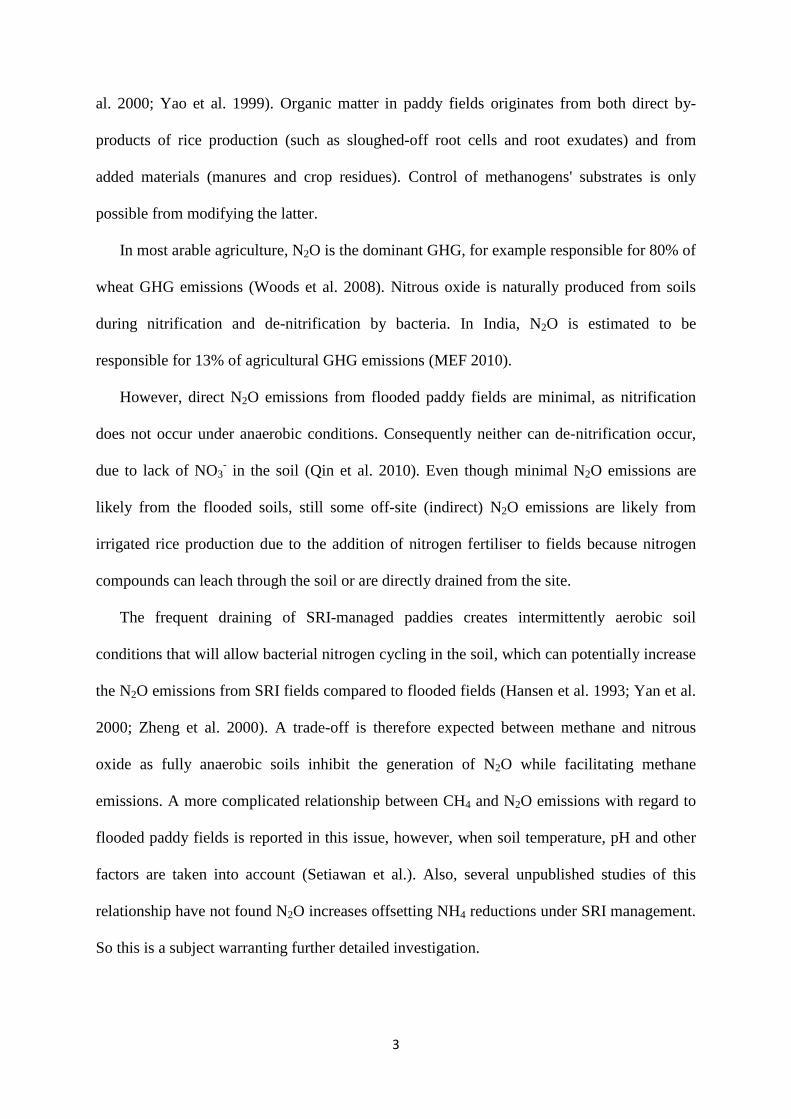
When emissions are analysed by farm operations, the pattern of emissions differs between
the two systems. SRI emissions’ per hectare are higher for both N2O (p<0.01) and transport
Page 15
15
of manure p>0.1), but they are lower for all other categories, including significantly lower
CH4 (p<0.01) and irrigation-based (p<0.01) emissions (Figure 2).
[Figure 2 about here]Error! Reference source not found.
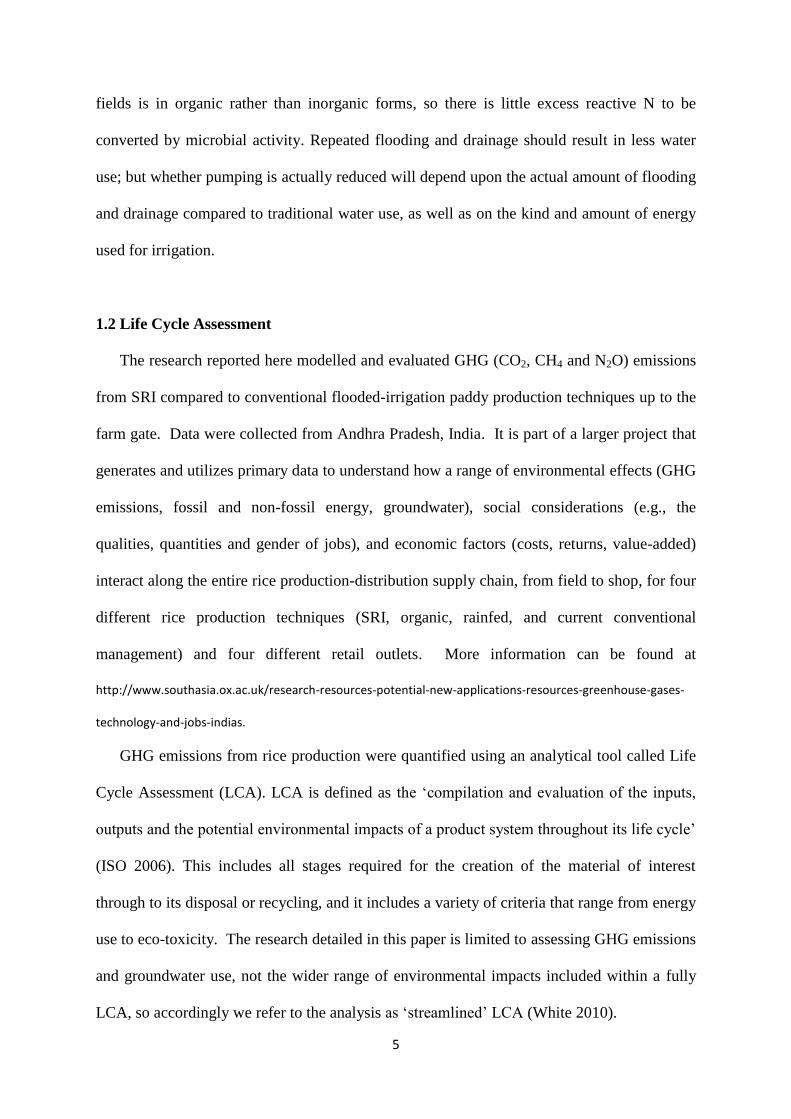
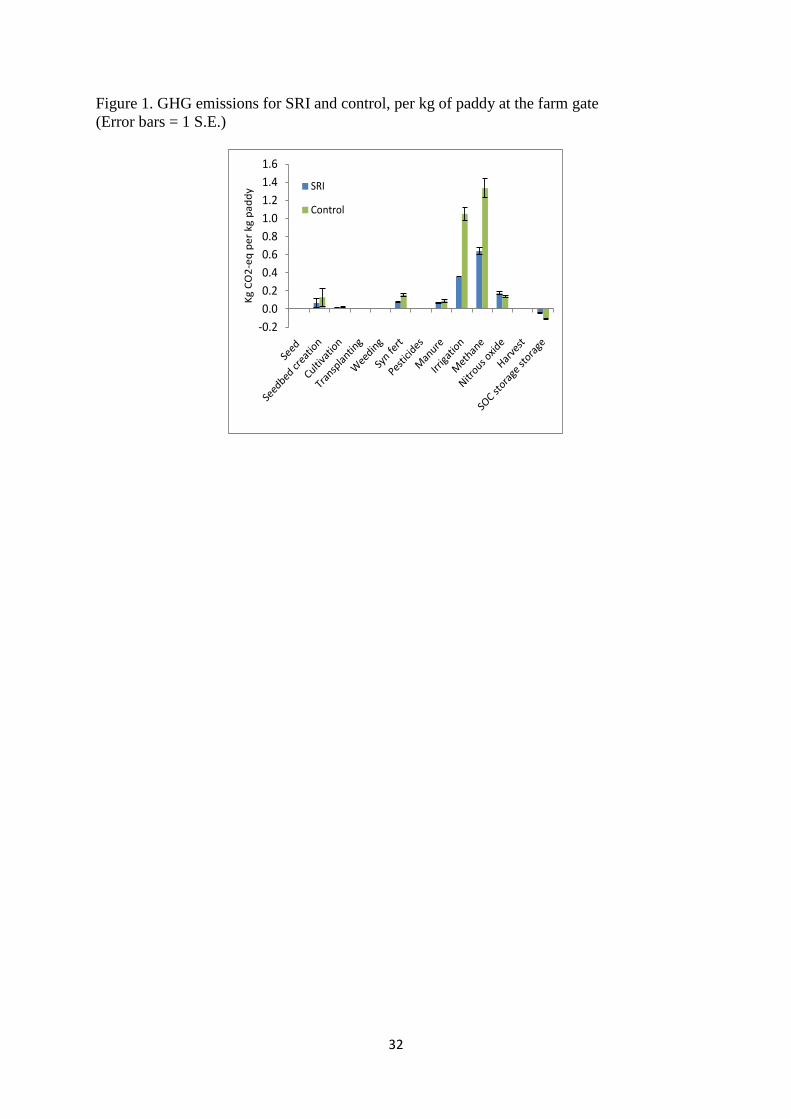
Overall GHG emissions per kg of paddy show a similar pattern as above, but due to the
higher yields with SRI management, N2O emissions per kg of SRI paddy rice were not
significantly different from the control N2O emissions per kilogram, while the differences
between SRI and control in terms of their CH4 and irrigation-based emissions per kg of paddy
increase (Figure 3).
[Figure 3 about here]
While significantly less methane is emitted per hectare with SRI compared to the control
farming systems, methane is still a major source of GHG from SRI production. It is
responsible for almost the same proportion of total GHG emissions in comparison to the
controls (47%), even though with SRI the soil is not consistently flooded. One reason for the
SRI methane emissions is the higher applications rates of organic amendments which serve as
feedstock for methanogens. This does not imply that soil amendments should be reduced in
SRI farms - they could be an important factor in increasing SRI yields. Research into
optimum feedstock application rates would be undertaken so that excessive rates are not used.
This is likely to become increasingly important with reduced livestock stocking densities in
rural areas reducing the availability of manure.
The modelled GHG emissions from SRI are highly sensitive to the assumed rate of
methane and nitrous oxide emissions compared to the default emission factors posted by
IPCC 2006. At present, the emission factors are based on three pieces of research. As more
research is carried out specifically into the GHG emissions from SRI compared to control
production systems, the accuracy of comparative LCA models will increase.
Page 16
16
The magnitude of the different results modelled above suggests that SRI will consistently
show GHG savings per kilogram of rice produced compared to conventional flooded
production systems. While an increase in N2O emissions could mitigate CH4 emission
savings on an area basis, we saw increased yield and reduced irrigation demand with SRI
management consistently reducing its GHG burden per kilogram of production.
Irrigation-based emissions are a substantial portion of the emissions from both production
systems, respectively, 26% and 37% of total emissions per kg of paddy for the SRI and the
control farms. We should note also that it is possible to irrigate farms with effectively no
irrigation-based emissions, for example, with gravity-fed systems, or with clean power
systems (local solar photovoltaic sources, or local wind-derived electricity). If we exclude
irrigation-based emissions, SRI still has significantly lower GHG emissions, measured both
per hectare and per kg of paddy produced (p<0.05).
The higher yields associated with SRI allow greater productivity from available
resources. Thus while there is no significant difference in the total N applied between to the
two farming systems, the SRI system allowed rice to make better use of the available N, and
to significantly increase (p<0.05) the estimated nitrogen use efficiency (While significantly
less methane is emitted per hectare with SRI compared to the control farming systems,
methane is still a major source of GHG from SRI production. It is responsible for almost the
same proportion of total GHG emissions in comparison to the controls (47%), even though
with SRI the soil is not consistently flooded. One reason for the SRI methane emissions is
the higher applications rates of organic amendments which serve as feedstock for
methanogens. This does not imply that soil amendments should be reduced in SRI farms -
they could be an important factor in increasing SRI yields. Research into optimum feedstock
application rates would be undertaken so that excessive rates are not used. This is likely to
Page 17
17
become increasingly important with reduced livestock stocking densities in rural areas
reducing the availability of manure.
The modelled GHG emissions from SRI are highly sensitive to the assumed rate of
methane and nitrous oxide emissions compared to the default emission factors posted by
IPCC 2006. At present, the emission factors are based on three pieces of research. As more
research is carried out specifically into the GHG emissions from SRI compared to control
production systems, the accuracy of comparative LCA models will increase.
The magnitude of the different results modelled above suggests that SRI will consistently
show GHG savings per kilogram of rice produced compared to conventional flooded
production systems. While an increase in N2O emissions could mitigate CH4 emission
savings on an area basis, we saw increased yield and reduced irrigation demand with SRI
management consistently reducing its GHG burden per kilogram of production.
b).
4.0 CONCLUSIONS
SRI significantly increased paddy yield from 4.8 to 7.6 tons per hectare, with generally
reduced or constant inputs. The only higher input with SRI compared to the control farms
was farm yard manure, and this difference was not statistically significant.
SRI management offers significant GHG savings both per hectare and per kilogram of
paddy produced. These savings principally arise from reduced methane emissions and
reduced embodied emissions in the electricity used for pumping irrigation water. While SRI
nitrous oxide emissions were somewhat higher than on control farms, the difference was only
significant on a per hectare basis, and it did not offset the gains of lower GWP from the
substantially-reduced emissions of methane.
Page 18
18
This paper has not explored various other aspects of GHG emissions, for example, the
role of indirect land use changes (ILUC) where yield gains can offer substantial GHG savings
resulting from changes in land use elsewhere. Nor does the analysis here cover the wider
social, economic and environmental indicators associated with SRI that are essential to fully
understand the diffusion potential and impact of SRI. These other and broader issues are
explored in more detail in papers listed at http://www.southasia.ox.ac.uk/resources-greenhouse-
gases-technology-and-jobs-indias-informal-economy-case-rice.
Page 19
19
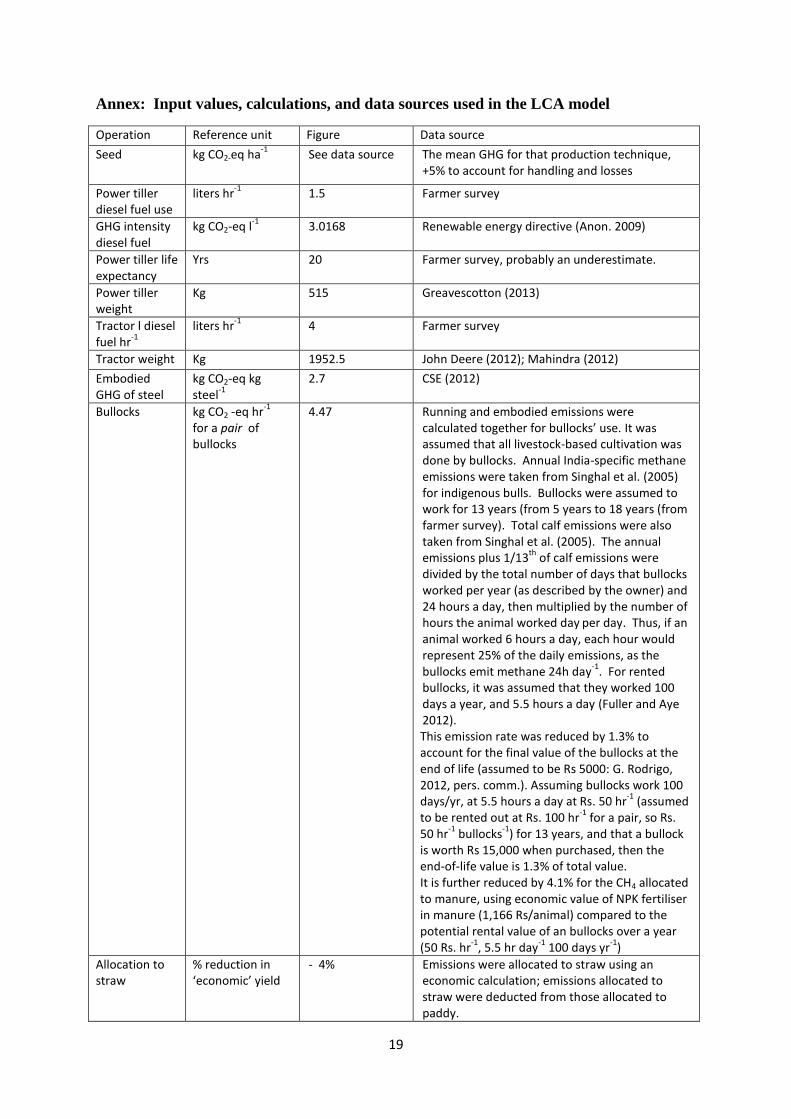
Annex: Input values, calculations, and data sources used in the LCA model
Operation Reference unit Figure Data source
Seed kg CO2-eq ha-1
See data source The mean GHG for that production technique, +5% to account for handling and losses
Power tiller diesel fuel use
liters hr-1
1.5 Farmer survey
GHG intensity diesel fuel
kg CO2-eq l-1
3.0168 Renewable energy directive (Anon. 2009)
Power tiller life expectancy
Yrs 20 Farmer survey, probably an underestimate.
Power tiller weight
Kg 515 Greavescotton (2013)
Tractor l diesel fuel hr
-1
liters hr-1
4 Farmer survey
Tractor weight Kg 1952.5 John Deere (2012); Mahindra (2012)
Embodied GHG of steel
kg CO2-eq kg steel
-1
2.7 CSE (2012)
Bullocks kg CO2 -eq hr-1
for a pair of bullocks
4.47 Running and embodied emissions were calculated together for bullocks’ use. It was assumed that all livestock-based cultivation was done by bullocks. Annual India-specific methane emissions were taken from Singhal et al. (2005) for indigenous bulls. Bullocks were assumed to work for 13 years (from 5 years to 18 years (from farmer survey). Total calf emissions were also taken from Singhal et al. (2005). The annual emissions plus 1/13
th of calf emissions were
divided by the total number of days that bullocks worked per year (as described by the owner) and 24 hours a day, then multiplied by the number of hours the animal worked day
per day. Thus, if an
animal worked 6 hours a day, each hour would represent 25% of the daily emissions, as the bullocks emit methane 24h day
-1. For rented
bullocks, it was assumed that they worked 100 days a year, and 5.5 hours a day (Fuller and Aye 2012). This emission rate was reduced by 1.3% to account for the final value of the bullocks at the end of life (assumed to be Rs 5000: G. Rodrigo, 2012, pers. comm.). Assuming bullocks work 100 days/yr, at 5.5 hours a day at Rs. 50 hr
-1 (assumed
to be rented out at Rs. 100 hr-1
for a pair, so Rs. 50 hr
-1 bullocks
-1) for 13 years, and that a bullock
is worth Rs 15,000 when purchased, then the end-of-life value is 1.3% of total value. It is further reduced by 4.1% for the CH4 allocated to manure, using economic value of NPK fertiliser in manure (1,166 Rs/animal) compared to the potential rental value of an bullocks over a year (50 Rs. hr
-1, 5.5 hr day
-1 100 days yr
-1)
Allocation to straw
% reduction in ‘economic’ yield
- 4% Emissions were allocated to straw using an economic calculation; emissions allocated to straw were deducted from those allocated to paddy.
Page 20
20
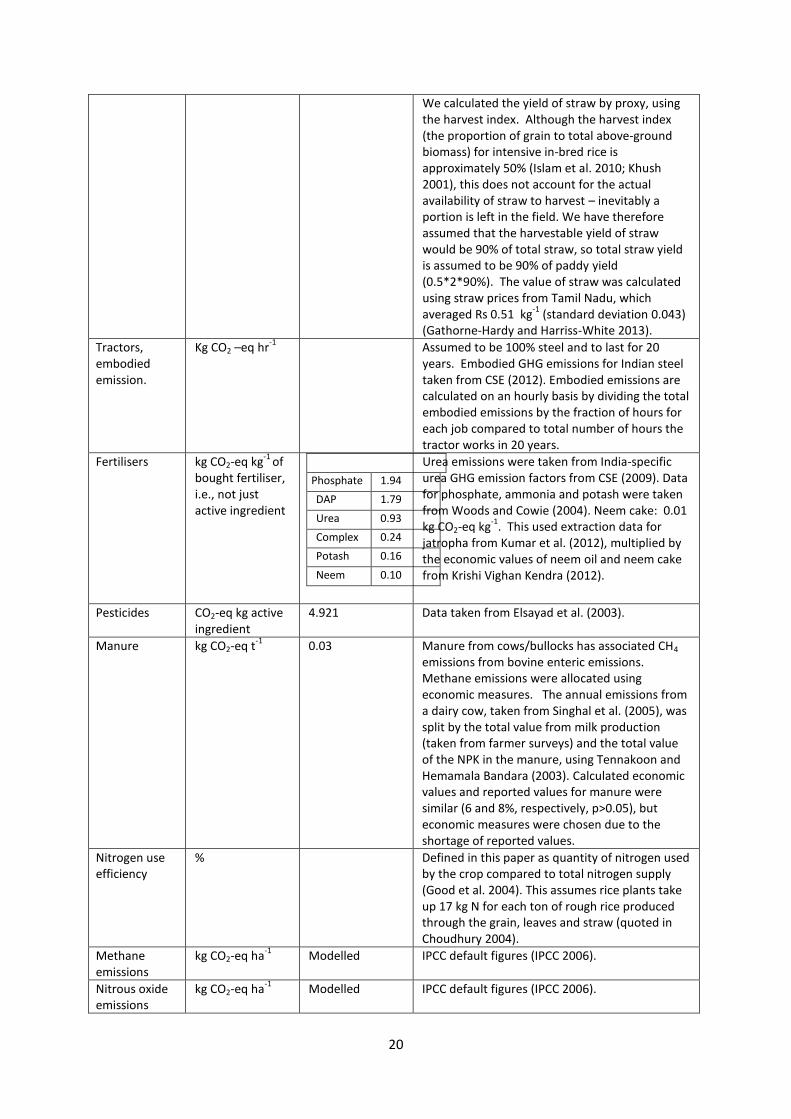
We calculated the yield of straw by proxy, using the harvest index. Although the harvest index (the proportion of grain to total above-ground biomass) for intensive in-bred rice is approximately 50% (Islam et al. 2010; Khush 2001), this does not account for the actual availability of straw to harvest – inevitably a portion is left in the field. We have therefore assumed that the harvestable yield of straw would be 90% of total straw, so total straw yield is assumed to be 90% of paddy yield (0.5*2*90%). The value of straw was calculated using straw prices from Tamil Nadu, which averaged Rs 0.51 kg
-1 (standard deviation 0.043)
(Gathorne-Hardy and Harriss-White 2013).
Tractors, embodied emission.
Kg CO2 –eq hr-1
Assumed to be 100% steel and to last for 20 years. Embodied GHG emissions for Indian steel taken from CSE (2012). Embodied emissions are calculated on an hourly basis by dividing the total embodied emissions by the fraction of hours for each job compared to total number of hours the tractor works in 20 years.
Fertilisers
kg CO2-eq kg-1
of bought fertiliser, i.e., not just active ingredient
Phosphate 1.94
DAP 1.79
Urea 0.93
Complex 0.24
Potash 0.16
Neem 0.10
Urea emissions were taken from India-specific urea GHG emission factors from CSE (2009). Data for phosphate, ammonia and potash were taken from Woods and Cowie (2004). Neem cake: 0.01 kg CO2-eq kg
-1. This used extraction data for
jatropha from Kumar et al. (2012), multiplied by the economic values of neem oil and neem cake from Krishi Vighan Kendra (2012).
Pesticides CO2-eq kg active ingredient
4.921 Data taken from Elsayad et al. (2003).
Manure kg CO2-eq t-1
0.03 Manure from cows/bullocks has associated CH4 emissions from bovine enteric emissions. Methane emissions were allocated using economic measures. The annual emissions from a dairy cow, taken from Singhal et al. (2005), was split by the total value from milk production (taken from farmer surveys) and the total value of the NPK in the manure, using Tennakoon and Hemamala Bandara (2003). Calculated economic values and reported values for manure were similar (6 and 8%, respectively, p>0.05), but economic measures were chosen due to the shortage of reported values.
Nitrogen use efficiency
% Defined in this paper as quantity of nitrogen used by the crop compared to total nitrogen supply (Good et al. 2004). This assumes rice plants take up 17 kg N for each ton of rough rice produced through the grain, leaves and straw (quoted in Choudhury 2004).
Methane emissions
kg CO2-eq ha-1
Modelled IPCC default figures (IPCC 2006).
Nitrous oxide emissions
kg CO2-eq ha-1
Modelled IPCC default figures (IPCC 2006).
Page 21
21
SRI CH4 and N2O emissions
kg CO2-eq ha-1
Modelled Calculating soil-based GHG emissions from SRI rice was more complicated due to lack of appropriate IPCC default figures. In principle, the methane emissions should be low due to the repeated drainage, and nitrous oxide emissions would be high due to the partially-flooded soil conditions, but the authors could find no published evidence to confirm this. While there are some SRI GHG emission data available, none that the author could find were adequate for our use (i.e., with detailed, replicated methodologies, suitable analysis). For this reason we have relied on papers looking at controlled irrigation as an isolated factor (for methane, we used Peng et al. (2011b), Hou et al. (2012) and Suryavanshi et al. (2013) resulting in methane emissions of 57.9% of control (conventional/intensive) production techniques; for nitrous oxide, we used Peng et al. (2011b), Hou et al. (2012) and Peng et al. (2011a), resulting in N2O emissions of 211.0% of control. This has some advantages, e.g., the data are not compounded by multiple factors which can be included in separate calculations (e.g., such as changes in levels of manure inputs), but it also has disadvantages since some specific SRI practices have no data relating to them at all (such as wider spacing between hills) and so this cannot be incorporated into the GHG calculations. This calculation is very close to the IPCC multiple-aeration figure of 52% for multiple aerations (IPCC 2006).
Electricity-based emissions from irrigation.
Calculating the amount of energy used for irrigation was difficult. Ideally we would have used meter readings, but no farmers had electricity meters. Instead we calculated the total amount of energy used through the size of the pump(s) and the number of hours they were used over the season. While pump horsepower was unambiguous, the hours of pump use were from daily estimates.
Embodied GHG emissions associated with electricity
kg CO2 eq KWh-1
1.1095 This was generated using CEA (2011) data of 0.81 at production multiplied by 27% T and E losses (Alagh 2010). Transmission losses are included, but not theft because stolen electricity presumably has some utility, so it should also take a share of overall emissions.
Harvest GHG emissions hr
-1
15.084 5 liters of diesel fuel hr-1
, taken from interview with combine harvester owner/operator.
Soil organic carbon
kg CO2-eq ha-1
Modelled Taken from IPCC (IPCC 2006).
Page 22
22
REFERENCES
Adhya, T.K., Bharati, K., Mohanty, S.R., Ramakrishnan, B., Rao, V.R., Sethunathan, N., and
Wassmann, R., "Methane emission from rice fields at Cuttack, India," Nutrient Cycling in
Agroecosystems, 58, 95-105, 2000.
Alagh, Y., Transmission and Distribution of Electricity in India Regulation, Investment and
Efficiency, Indian Institute of Rural Management, Anand, Gujarat, 2010.
Anon., "On the promotion of the use of energy from renewable sources and amending and
subsequently repealing Directives 2001/77/EC and 2003/30/EC," Official Journal of the
European Union, 2009. http://eur-lex.europa.eu/LexUriServ/LexUriServ.do?uri=Oj:L:2009: 140:0016:0062:en:PDF
Anon., "Climate," in: Statistics, Department of Environment, Andha Pradesh Government,
Hyderabad. http://www.ap.gov.in/Other%20Docs/CLIMATE.pdf
Blengini, G.A., and Busto, M., "The life cycle of rice: LCA of alternative agri-food chain
management systems in Vercelli (Italy)," Journal of Environmental Management, 90, 512-
522, 2009.
Bodelier, P.L.E., "Interactions between oxygen releasing roots and microbial processes in
flooded soils and sediments," in: de Kroon, H. and Visser, E.J.W., eds., Root Ecology.
Springer, Berlin, 2003.
Bouman, B.A.M., Lampayan, R.M. and Tuong, T.P., Water Management in Irrigated Rice:
Coping with Water Scarcity, International Rice Research Institute, Los Baños, Philippines,
2007.
CEA, CO2 Baseline Database for the Indian Power Sector, User Guide, version 6.0, Central
Electricity Authority, Ministry of Power, Sewa Bhawan, New Delhi, India, 2011.
CSE, Green Rating Project: Fertilizers, Centre for Science and Environment, New Delhi,
2009. http://www.cseindia.org/userfiles/79-90%20Fertilizer%281%29.pdf
CSE, Into the Furnace: Green rating project of Indian Iron and Steel Sector, Centre for
Science and Environment, Delhi, India, 2012.
Chanton, J.P., Whiting, G.J., Blair, N.E., Lindau, C.W. and Bollich, P.K., "Methane emission
from rice: Stable isotopes, diurnal variations, and CO2 exchange," Global Biogeochemical
Cycles, 11, 15-27, 1997.
BSI, Specification for the Assessment of the Life Cycle Greenhouse Gas Emissions of Goods
and Services: PAS 2050:2011, British Standards Institution, London, 2011.
Choudhury, A.T.M.A. and Kennedy, I.R., "Prospects and potentials for systems of biological
nitrogen fixation in sustainable rice production," Biology and Fertility of Soils, 39, 219-227,
2004.
Elsayed, M.A., Matthews, R., and Mortimer, N.D., Carbon and Energy Balances for a Range
of Biofuels Options, Project No. B/B6/00784/REP URN 03/836, carried out as part of the
DTI Sustainable Energy Programme, 2003. http://airburners.com/PUB/Sheffield-studie-mei2003.pdf
European Commission, International Reference Life Cycle Data System (ILCD) Handbook:
General Guide for Life Cycle Assessment, Joint Research Centre Institute for Environment
and Sustainability. Publications Office of the European Union, Luxembourg, 2010.
Page 23
23
Fischer, R.A. and Edmeades, G.O., "Breeding and cereal yield progress," Crop Science, 50,
85-98, 2010.
Forster, P., Ramaswamy, V., Artaxo, P., Berntsen, T., Betts, R., Fahey, D.W., Haywood, J.,
Lean, J., Lowe, D.C., Myhre, G., Nganga, J., Prinn, R., Raga, G., Schulz, M. and Van
Dorland, R., "Changes in atmospheric constituents and in radiative forcing," in: Climate
Change 2007: The Physical Science Basis, Contribution of Working Group I to the Fourth
Assessment Report of the Intergovernmental Panel on Climate Change, Solomon, S., Qin, D.,
Manning, M., Chen, Z., Marquis, M., Avery, K.B., Tignor, M., Miller, H.L. (eds.), 131-234.
Cambridge University Press, Cambridge, UK, 2007.
Fuller, R.J. and Aye, L., "Human and animal power – The forgotten renewables," Renewable
Energy, 48, 326-332, 2012.
Gathorne-Hardy, A., Greenhouse gas emissions from rice, Working paper for South Asia
Program, School of Interdisciplinary Area Studies, Oxford University, UK, 2013a. http://www.southasia.ox.ac.uk/sites/sias/files/documents/GHG%20emissions%20from%20rice%20-%20%20working%20paper.pdf
Gathorne-Hardy, A., On Life Cycle Analysis: Baselines and Boundaries, Internal discussion
document for School of Interdisciplinary Area Studies, Oxford University, UK, 2013b.
Gathorne-Hardy, A., and Harriss-White, B., Embodied emissions and dis-embodied jobs,
Symposium on Technology, Jobs and a Lower Carbon Future, 2013. http://www.southasia.ox.ac.uk/sites/sias/files/documents/Conference%20Book.pdf
Good, A.G., Shrawat, A.K. and Muench, D.G., "Can less yield more? Is reducing nutrient
input into the environment compatible with maintaining crop production?" Trends in Plant
Science, 9, 597-605, 2004.
Greavescotton, Greaves Power Tiller, Greavescotton, Mumbai, 2013.
http://www.greavescotton.com/Upload/AgroEquipFiles/powertiller.pdf.
Hansen, S., Mæhlum, J.E. and Bakken, L.R., "N2O and CH4 fluxes in soil influenced by
fertilization and tractor traffic," Soil Biology and Biochemistry, 25, 621-630, 1993.
Hokazono, S. and Hayashi, K., "Variability in environmental impacts during conversion from
conventional to organic farming: A comparison among three rice production systems in
Japan," Journal of Cleaner Production, 28, 101-112, 2012.
Hou, H., Peng, S., Xu, J., Yang, S. and Mao, Z.. "Seasonal variations of CH4 and N2O
emissions in response to water management of paddy fields located in Southeast China,"
Chemosphere, 89, 884-892, 2012.
IPCC, National Guidelines for Greenhouse Gas Inventories, Inter-governmental Panel on
Climate Change, Geneva, 2006. http://www.ipcc-nggip.iges.or.jp/public/2006gl/index.htm
IRRI, Rice Production and Processing, International Rice Research Institute, Los Baños,
Philippines, 2013. http://www.irri.org/index.php?option=com_k2&view=item&layout=item&id=9151&lang=en
Islam, M., Peng, S., Visperas, R., Bhuiya, M., Hossain, S. and Julfiquar, A., "Comparative
study on yield and yield attributes of hybrid, inbred, and NPT rice genotypes in a tropical
irrigated ecosystem," Bangladesh Journal of Agricultural Research, 35, 343-353, 2010.
ISO, Environment Management: Life Cycle Assessment-Principles and Framework, EN ISO
14040 2006, International Organization for Standardization, Geneva, 2006.
Page 24
24
John Deere, Tractor Specifications, Moline, IL, 2012. http://www.deere.com/en_IN/home_page/ag_home/products/5104_45HP/5104_45HP.html
Kassam, A., Stoop, W. Uphoff, N., "Review of SRI modifications in rice crop and water
management and research issues for making further improvements in agricultural and water
productivity," Paddy and Water Environment, 9, 163-180, 2011.
Khush, G.S., "Green Revolution: The way forward," Nature Reviews: Genetics, 2, 815-822,
2011.
Krishi Vighan Kendra, Vamban, Pudukottai, Tamil Nadu, India, 2012. http://kvkpudukkottai.com/front_line_demonstrations.html
Kumar, S., Singh, J., Nanoti, S.M. and Garg, M.O., "A comprehensive life cycle assessment
(LCA) of Jatropha biodiesel production in India," Bioresource Technology, 110, 723-729,
2012.
Linquist, B., van Groenigen, K.J., Adviento-Borbe, M.A., Pittelkow, C. and van Kessel, C.,
"An agronomic assessment of greenhouse gas emissions from major cereal crops," Global
Change Biology, 18, 194-209, 2012.
Mahindra, Tractor Specifications, Mumbai, India, 2012. http://www.mahindratractorworld.com/Bangladesh-en/Products-Tractors-MKM-NBP-SERIES-30-50HP/575-DI-MKM-NBP-45HP
MEF, "India: Greenhouse Gas Emissions 2007," in: Indian Network for Climate Change
Assessment, Ministry of Environment and Forests, Government of India, New Delhi, 2010.
Nelson, G.C., Robertson, R., Msangi, S., Zhu, T., Liao, X. and Jawajar, P., Greenhouse Gas
Mitigation. Issues for Indian Agriculture, IFPRI Discussion Paper, International Food Policy
Research Institute, Washington, DC, 2009.
Peng, S., Hou, H., Xu, J., Mao, Z., Abudu, S., and Luo, Y., "Nitrous oxide emissions from
paddy fields under different water managements in southeast China," Paddy and Water
Environment, 9, 403-411, 2011a.
Peng, S., Yang, S., Xu, J. and Gao, H., "Field experiments on greenhouse gas emissions and
nitrogen and phosphorus losses from rice paddy with efficient irrigation and drainage
management." Science China Technological Sciences, 54, 1581-1587, 2011b.
Qin, Y., Liu, S., Guo, Y., Liu, Q. and Zou, J., "Methane and nitrous oxide emissions from
organic and conventional rice cropping systems in Southeast China." Biology and Fertility of
Soils, 46, 825-834, 2010.
Reddy, D.N. and Mortkori, V., "SRI cultivation in Andhra Pradesh: Achievements, problems
and implications for GHGs and work," in: Harriss-White, B. (ed.), Technology, Jobs and A
Lower Carbon Future: Methods, Substance and Ideas for the Informal Economy (The Case of
Rice in India), 160-192, Delhi, 2013. http://www.southasia.ox.ac.uk/sites/sias/files/documents/Conference%20Book.pdf
Richards, P., Indigenous Agricultural Revolution: Ecology and Food Production in West
Africa, Hutchinson, London, 1985.
Singhal, K.K., Mohini, M., Jha, A.K. and Gupta, P.K., "Methane emission estimates from
enteric fermentation in Indian livestock: Dry matter intake approach," Current Science, 88,
119-127, 2005.
Sinha, S.K. and Talati, J., "Productivity impacts of the system of rice intensification (SRI): A
case study in West Bengal, India," Agricultural Water Management, 87, 55-60, 2007.
Page 25
25
Stoop, W.A., Uphoff, N. and Kassam, A., "A review of agricultural research issues raised by
the system of rice intensification (SRI) from Madagascar: Opportunities for improving
farming systems for resource-poor farmers," Agricultural Systems, 71, 249-274, 2002.
Sumberg, J., Andersson, J., Giller, K.E. and Thompson, J., "Response to ‘Combining
sustainable agricultural production with economic and environmental benefits’," The
Geographical Journal, 179, 183-185, 2013.
Suryavanshi, P., Singh, Y.V., Prasanna, R., Bhatia, A. and Shivay, Y.S., "Pattern of methane
emission and water productivity under different methods of rice crop establishment," Paddy
and Water Environment, 11, 321-329, 2013.
Tennakoon, N.A. and Hemamala Bandara, S.D., "Nutrient content of some locally available
organic materials and their potential as alternative sources of nutrients for coconut," COCOS,
15, 23-30, 2003.
Uphoff, N., "The System of Rice Intensification (SRI) as a System of Agricultural
Innovation," paper for Institute of Development Studies conference, Sussex, UK, 2009. http://repository.ipb.ac.id/handle/123456789/43778
Wang, M., Xia, X., Zhang, Q. and Liu, J., "Life cycle assessment of a rice production system
in Taihu region, China," International Journal of Sustainable Development and World
Ecology, 17, 157-161, 2010.
Wang, Z.Y., Xu, Y.C., Li, Z., Guo, Y.X., Wassmann, R., Neue, H.U., Lantin, R.S., Buendia,
L.V., Ding, Y.P. and Wang, Z.Z., "A four-year record of methane emissions from irrigated
rice fields in the Beijing Region of China," Nutrient Cycling in Agroecosystems, 58, 55-63,
2000.
White, R.M., "Carbon governance in UK liquid milk systems," Environmental Change
Institute, Oxford, Oxford, 2010.
Williams, A.G., Audsley, E. and Sandars, D.L., "Determining the environmental burdens and
resource use in the production of agricultural and horticultural commodities," Cranfield
University, Bedford, UK, 2006.
Wood S, and Cowie A., "A review of greenhouse gas emission factors for fertiliser
production," in: IEA Bioenergy Task 38 Report, Cooperative Research Centre for
Greenhouse Accounting, Research and Development Division, State Forests of New South
Wales, Beecroft, NSW, Australia, 2004. http://www.ieabioenergy-task38.org/publications/GHG_ Emission_Fertilizer%20Production_July2004.pdf
Woods, J., Brown, G., Gathorne-Hardy, A., Sylvester-Bradley, R., Kindred, D. and Mortimer,
N., Facilitating Carbon (GHG) Accreditation Schemes for Biofuels and Feedstock
Production. Report 435, Part 1, Home Grown Cereals Authority, London. http://www.hgca.com/document.aspx?fn=load&media_id=4567&publicationId=4623
WWF, More Rice with Less Water: SRI - System of Rice Intensification, WWF International,
Patancheru, Andhra Pradesh, India, 2007.
Yan, X., Shi, S., Du, L. and Xing, G., "Pathways of N2O emission from rice paddy soil," Soil
Biology and Biochemistry, 32, 437-440, 2000.
Yan, X., Yagi, K., Akiyama, H. and Akimoto, H., "Statistical analysis of the major variables
controlling methane emission from rice fields," Global Change Biology, 11: 1131-1141,
2005.
Page 26
26
Yao, H., Conrad, R., Wassmann, R. and Neue, H.U., "Effect of soil characteristics on
sequential reduction and methane production in sixteen rice paddy soils from China, the
Philippines, and Italy," Biogeochemistry, 47, 269-295, 1999.
Zheng, X., Wang, M., Wang, Y., Shen, R., Gou, J., Li, J., Jin, J. and Li, L., "Impacts of soil
moisture on nitrous oxide emission from croplands: A case study on the rice-based agro-
ecosystem in Southeast China," Chemosphere: Global Change Science, 2, 207-224, 2000.
Page 27
27
Table 1. Agronomic practices of SRI and control farmers (S.E. in parentheses)
Agronomic practices SRI Control (conventional Green
Revolution techniques)
Planting date (age of seedling,
in days)
18 (1.1) 32.5 (1.7)**
Number of plants per hill 1.8 (0.2) 5 (0)***
Distance between hills (cm) 25 (0) 12 (0)***
Number of days irrigation
(days/season)
71.8 (6.2) 118.8 (12.8)***
Quantity of manure (t ha-1
) 18.7 (4) 17.0 (2)
No asterisk = no sig difference, *= p< 0.1, **=p<0.05, ***p<0.01.
Page 28
28
Table 2a. Farm details, GHG emissions, yield, and water use from SRI and control farms*
Farming
system Number
of farms
Farm size
(ha)
GHG
emissions
(CO2-eq ha-1
)
GHG
emissions
(kg CO2-eq
kg paddy -1
)
Yield (kg
ha-1
) Water use
(t ha -1
) Water use
(t kg paddy -1
)
SRI 20 1.23
(0.62)
10,232***
(588) 1.1***
(0.05) 7,609***
(304)
16,049**
(3,682) 2.05***
(0.47)
Control 10 0.11
(0.33)
13,981
(696) 2.8
(0.2) 4,834
(197) 24,980
(3,274) 4.90
(0.46)
*Asterisks indicate degree of significant difference between the farming systems; no asterisk = no
significant difference, *= p< 0.1, **=p<0.05, ***p<0.01 (S.E. shown in parentheses)
Page 29
29
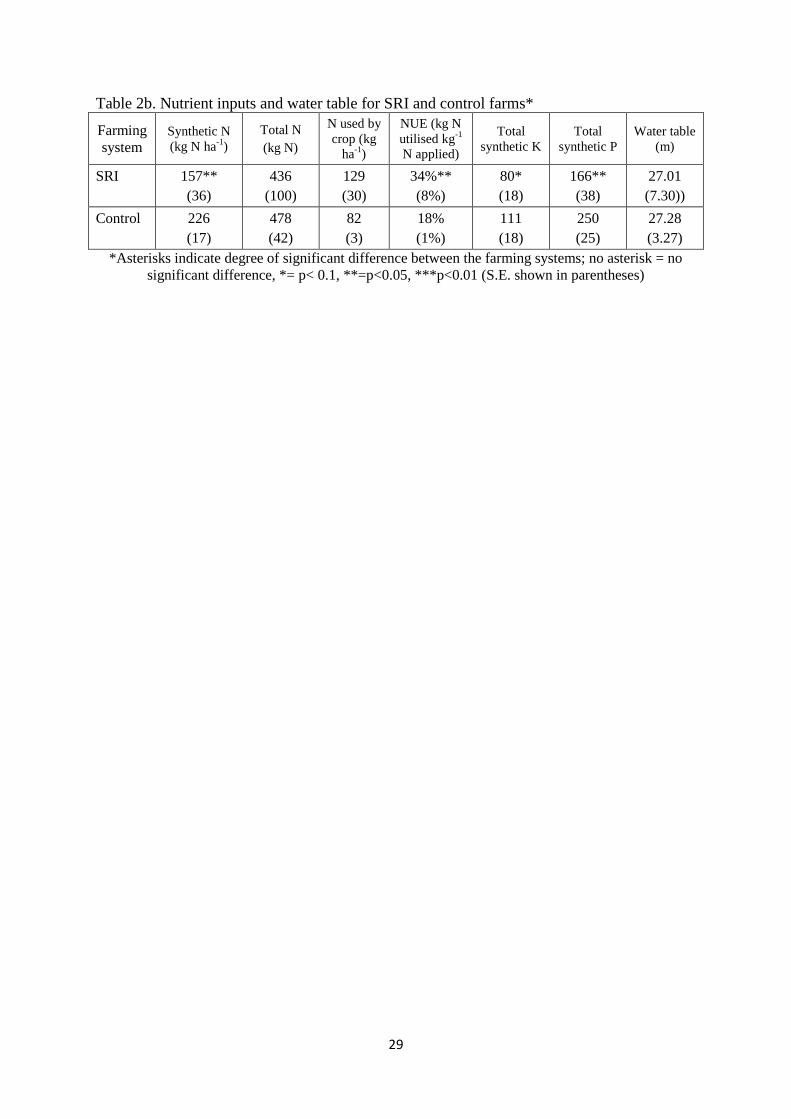
Table 2b. Nutrient inputs and water table for SRI and control farms*
Farming
system Synthetic N
(kg N ha-1
)
Total N
(kg N)
N used by
crop (kg
ha-1
)
NUE (kg N
utilised kg-1
N applied)
Total
synthetic K Total
synthetic P Water table
(m)
SRI 157**
(36)
436
(100)
129
(30)
34%**
(8%)
80*
(18)
166**
(38)
27.01
(7.30))
Control 226
(17)
478
(42)
82
(3)
18%
(1%)
111
(18)
250
(25)
27.28
(3.27)
*Asterisks indicate degree of significant difference between the farming systems; no asterisk = no
significant difference, *= p< 0.1, **=p<0.05, ***p<0.01 (S.E. shown in parentheses)
Page 30
30
Figure 1. System boundaries for determining the environmental burden of rice production.
Categories outside the heavy line are not included within the boundary of this LCA
Page 31
31
Figure 2. GHG emissions per hectare for SRI and control paddy production techniques
(Error bars = 1 S.E.)
-1000
0
1000
2000
3000
4000
5000
6000
7000
8000
Kg C
O2-
eq p
er h
ecta
re
SRI
Control
Page 32
32
Figure 1. GHG emissions for SRI and control, per kg of paddy at the farm gate
(Error bars = 1 S.E.)
-0.2
0.0
0.2
0.4
0.6
0.8
1.0
1.2
1.4
1.6
Kg
CO
2-e
q p
er
kg p
ad
dy SRI
Control