Journal of Network and Computer Applications 141 (2019) 59–72
Contents lists available at ScienceDirect
Journal of Network and Computer Applications
journal homepage: www.elsevier.com/locate/jnca
A light weight smartphone based human activity recognition system withhigh accuracy
Md Osman Gani a,∗, Taskina Fayezeen b, Richard J. Povinelli c, Roger O. Smith d,Muhammad Arif e, Ahmed J. Kattan e, Sheikh Iqbal Ahamed f
a Department of Computer Science and Software Engineering, Miami University, Oxford, OH, USAb IT Services, Miami University, Oxford, OH, USAc Department of Electrical and Computer Engineering, Marquette University, Milwaukee, WI, USAd University of Wisconsin-Milwaukee, Milwaukee, WI, USAe Department of Computer Science, Umm Al-Qura University, Makkah, Saudi Arabiaf Department of Mathematics, Statistics, and Computer Science, Marquette University, Milwaukee, WI, USA
With the pervasive use of smartphones, which contain numerous sensors, data for modeling human activityis readily available. Human activity recognition is an important area of research because it can be used incontext-aware applications. It has significant influence in many other research areas and applications includ-ing healthcare, assisted living, personal fitness, and entertainment. There has been a widespread use ofmachine learning techniques in wearable and smartphone based human activity recognition. Despite beingan active area of research for more than a decade, most of the existing approaches require extensive com-putation to extract feature, train model, and recognize activities. This study presents a computationally effi-cient smartphone based human activity recognizer, based on dynamical systems and chaos theory. A recon-structed phase space is formed from the accelerometer sensor data using time-delay embedding. A singleaccelerometer axis is used to reduce memory and computational complexity. A Gaussian mixture model islearned on the reconstructed phase space. A maximum likelihood classifier uses the Gaussian mixture modelto classify ten different human activities and a baseline. One public and one collected dataset were usedto validate the proposed approach. Data was collected from ten subjects. The public dataset contains datafrom 30 subjects. Out-of-sample experimental results show that the proposed approach is able to recognizehuman activities from smartphones’ one-axis raw accelerometer sensor data. The proposed approach achieved100% accuracy for individual models across all activities and datasets. The proposed research requires 3to 7 times less amount of data than the existing approaches to classify activities. It also requires 3 to 4times less amount of time to build reconstructed phase space compare to time and frequency domain fea-tures. A comparative evaluation is also presented to compare proposed approach with the state-of-the-artworks.
1. Introduction
With the proliferation of context-aware systems and applications,the human activity plays an important role along with the location(Gheid et al., 2017). Recognition of human activities has importancein many research areas such as pervasive computing (Satyanarayanan,2001), machine learning (Su et al., 2014), artificial intelligence, human
computer interaction, healthcare (Torres-Huitzil and Alvarez-Landero,2015), rehabilitation engineering (A et al., Fayezeen), assistive tech-nology (Albert et al., 2017), social networking, and the social sciences(Lara and Labrador, 2013), (Osmani et al., 2008). Substantial researchhas been conducted to recognize human activities. One of the most sig-nificant and challenging tasks for pervasive computing systems is tooffer correct and appropriate intelligence about peoples activities and
M.O. Gani et al. Journal of Network and Computer Applications 141 (2019) 59–72
Table 1Activities and smartphone placement.
Activity Phone Placement
Walking Pocket and WaistWalking Downstairs Pocket and WaistWalking Upstairs Pocket and WaistRunning Pocket and WaistStanding Pocket and WaistSitting Pocket and WaistLaying WaistElevator Down PocketElevator Up PocketDriving Pocket and Cup-holderBaseline Table
behaviors (Lara and Labrador, 2013). Activity recognition systems arebeing used in large number in monitoring elderly people with demen-tia and people in rehabilitation (lvarez Concepcin et al., 2014). Thefunctional status of a person is an important parameter in the areaof assisted living and elderly care (Gani et al., 2017). This status isdescribed mainly activities of daily living (ADL) (Hong et al., 2010).Also, it can be used to offer context-aware services to smartphone userslike suitable application selections and content recommendation (Leeand Cho, 2011).
We used smartphones to capture these activities. They offer a rangeof useful sensors such as accelerometers, gyroscopes, orientation sen-sors, magnetometers, barometers, GPS, Wi-Fi, fingerprint, and near fieldcommunication (NFC) (Yi et al., 2012). Smartphones also have substan-tial computational power. Hence, use of the smartphone in the humanactivity recognition system eliminates the cost of additional devices andsensors (Lane et al., 2010). Most smartphones have built in tri-axialaccelerometer sensors, which measure acceleration along the x, y andz-axes. The key challenge is to use the accelerometer sensors to modelfull body human motor activities. This paper presents a smartphonebased human activity recognition system using Gaussian mixture mod-els (GMM) of reconstructed phase spaces (RPS). Our approach uses rawaccelerometer sensor data from one single axis to recognize 11 differentactivities including walking, walking upstairs and downstairs, running,standing, and sitting. We investigated the use of dynamical system andchaos theory to capture and then recognize the underlying dynamics ofdifferent human activities.
We evaluated our proposed system using two datasets (a collecteddataset and a publicly available dataset) of acceleration measurementsof 11 activities (Table 1). We collected accelerometer data for 10 dif-ferent activities. The activities were performed by ten different partic-ipants carrying a smartphone in their pocket. We also used a datasetfrom the UCI Machine Learning repository (Anguita et al., 2013). Ithas accelerometer and gyroscope data for 6 activities performed by30 participants. Both datasets were divided into training and testingsets. The training dataset was only used to train the system, whiletest datasets were used to test the accuracy. The proposed approachachieved 100% accuracy for individual models across all activities anddatasets. It required 3 to 7 times less amount of data for the recog-nition than the existing approaches, such as Antos 2013 (Antos et al.,2014), Anguita et al., 2013 (Anguita et al., 2013), and Haq 2018 (ul Haqet al., 2018). Also, the time required to build the reconstructed phasespace from the raw accelerometer sensor data was 3–4 times faster com-pared to extracting time and frequency domain features (Panwar et al.,2017).
We implemented our system in two different case studies. One casestudy took place in a rehabilitation clinic for remote monitoring, wherethe patients daily activities were reported to a cloud server from theirsmartphone. Physicians could access and assess patients activities basedon the assigned task and daily routine. The second case study took placein the Hajj, the fifth pillar of Islam an annual pilgrimage of Muslims to
Makkah, Saudi Arabia (Clingingsmith et al., 2009). The purpose wasto track pilgrims’ location based on their activities when they get lost(Gani et al., 2016). We present the comparative analysis of the proposedapproach with the state-of-the-art works.
The summary of the contributions of this paper is:
• Use of time-delay embedding or reconstructed phase space to cap-ture underlying dynamics of human body motion for different activ-ities from smartphone accelerometer.
• Statistical learner that learns the underlying dynamics of humanactivities and maximum likelihood classifier to recognize thoseactivities.
• An alternative approach to widely used machine learning techniquesto recognize human activities from kinematics sensors (specificallyaccelerometer).
• Activity recognition system with a very good accuracy across 11activities.
• Computationally inexpensive approach to activity recognition byusing only one accelerometer axis.
• Evaluation of the approach using collected dataset and publiclyavailable human activity dataset.
• Deployment of the system in two different case studies: 1) Locationtracking of pilgrims using their activity information, and 2) Dailyactivity monitoring of patients in a rehabilitation clinic.
• Published collected human activity dataset in the public domain toenhance research in this area (http://ubicomp.mscs.mu.edu).
This research article is organized as follows. The related researchis discussed in section 2. The background is discussed in section 3.The data collection process is presented in section 4. The methodol-ogy is discussed in section 5. The details of the experiments includingtraining, testing, and results are discussed in section 6. The contribu-tions are discussed in section 7. Finally the conclusions are presented insection 8.
2. Related research
There is extensive research focused on automated machine recog-nition of human activity (Liao et al., 2005), (Aggarwal and Cai,1999), (Yan et al., 2012), (Yang, 2009), (Tapia et al., 2004), (Khanet al., 2015), (Wang et al., 2015). Use of computer vision has beenone approach (Aggarwal and Cai, 1999). Computer vision approachesimplement automatic human activity recognition from a sequence ofimages or videos where activities are performed by one or more per-sons (Saad Ali, 2007). Other research has used environmental sensorslike a sound sensor on a floor, a light sensor in a room, radio frequencyidentification (RFID) as a door tag or wearable kinematic sensors likethe accelerometer, and the gyroscope by placing them on different partsof the body (Maurer et al., 2006), (Tapia et al., 2004), (Bao and Intille,2004), (Ravi et al., 2005) (Siirtola et al., 2009). The wearable devicebased systems are very expensive. These systems lack applicability onmobile devices due to high computational cost and excessive energyconsumption. One of the disadvantages of the wearable activity recogni-tion system is that the users face discomfort using the wearable devices.Also there is a risk of losing and forgetting the devices (lvarez Concepcinet al., 2014). Therefore, there is a need for special attention to energyconsumption and computational cost when designing systems to rec-ognize human activities using mobile devices (lvarez Concepcin et al.,2014).
An alternative approach leverages the increasingly ubiquitoussmartphone. Compared to computer vision or wearable sensorapproaches, smartphones offer many advantages. Smartphones do notrequire additional infrastructure, are unobtrusive, and have goodand rapidly increasing computational power (Dernbach et al., 2012),(Brezmes et al., 2009), (Hache et al., 2010), (Zhang et al., 2010), (ulHaq et al., 2018). Most smartphone based approaches have focused onrecognizing simple human activities such as walking, running, stand-
M.O. Gani et al. Journal of Network and Computer Applications 141 (2019) 59–72
Fig. 1. Overview of the smartphone based human activity recognition system.
ing, walking up stairs, walking down stairs, sitting, and climbing. Someresearch has also considered recognition of more complex functionalactivities like brushing teeth, cleaning dishes, and vacuuming a floor(Lara and Labrador, 2013). The overview of smartphone based humanactivity recognition systems is shown in Fig. 1 (Su et al., 2014). Dif-ferent activity signals are collected from the smartphone sensors. Thesignals are then processed to train a human activity recognition systemand tested to recognize different activities. The approaches vary basedon data preprocessing, number and type of sensors, mathematical mod-els, and implementations. These systems output the classified humanactivities.
There has been a widespread use of machine learning techniquesin wearable and smartphone based human activity recognition. Oneof the most common approaches is to extract statistical and structuralfeatures (time-domain features: mean, standard deviation, maximum,minimum, correlation (Su et al., 2014), (lvarez de la Concepcin etal., 2014), (Kwapisz et al., 2010), frequency-domain features: Fouriertransform (Bao and Intille, 2004), Discrete Cosine transform (Altun andBarshan, 2010), and principal component analysis (PCA) (He and Jin,2009)) from raw sensor data and then to use classification algorithmslike logistic regression (Kwapisz et al., 2010), multilayer perceptron(Bayat et al., 2014), support vector machine (SVM) (He and Jin, 2009),(Jordan Frank et al., 2010), (ul Haq et al., 2018), decision tree (Jatobáet al., 2008), k-nearest neighbors (Maurer et al., 2006), naive Bayes(Tapia et al., 2007), hidden markov model (HMM) (Zhu and Sheng,2009) (Su et al., 2014), (Lara and Labrador, 2013) (Antos et al., 2014)(Ravi et al., 2005), and convolutional neural network (Panwar et al.,2017). Gaussian mixture models have also been used to model humanactivities (Srivastava, 2012), (Piyathilaka and Kodagoda, 2013). Mostof these approaches require extensive computation to extract feature,train model, and recognize activity class. They increase the power con-sumption on mobile and wearable devices, which limits the long-termactivity recognition (Yan et al., 2012). The memory and computationalcomplexity of the activity recognition system depends on the number ofsensors, sampling frequency, number of extracted features, size of theactivity cycle, and mathematical model (Lara and Labrador, 2013). Sunand Haq discussed different aspects of the activity recognition systemvarying mobile phone positions and orientations (Sun et al., 2010), (ulHaq et al., 2018). Yan discussed the effect of the sampling frequencyand classification features on energy consumption (Yan et al., 2012).We have discussed the number of sensors, sampling frequency, and sizeof the activity cycle used in different studies in the following subsec-tion.
The activity cycle is a set of time series observations (sensor data)that contains a complete execution of an activity pattern. The systemwon’t be able to determine the performed activity if the time seriesobservation does not contain a complete activity cycle (lvarez Con-cepcin et al., 2014). There are different strategies to select this win-dow or segment so that it contains necessary time series observation(Bao and Intille, 2004) (Dernbach et al., 2012). Kwapisz used a 10 swindow (comprised of 200 samples) from cell phone accelerometer ata sampling frequency of 20 Hz (Kwapisz et al., 2010). Authors arguedthat it was an adequate amount of time to capture several repetitions
of the performed activities. They performed experiments with 10 and20 s windows where 10 s segments produced better outcome. Reissused a 5 s window at a sampling frequency of 100 Hz from three bodymounted (mounted to the dominant arm, chest, and foot) sensors (Reisset al., 2011). Lee used a smartphone accelerometer signal window of5 s (60 samples) (Lee and Cho, 2011). There are some works wherethe activity window includes some percentage overlap of the immedi-ate neighboring activity window (Bao and Intille, 2004) (Hong et al.,2010) (Inoue et al., 2015). Bao used a window of 512 samples (6.7 sof data) with 50% overlap to extract time and frequency domain fea-tures from 5 body mounted bi-axial accelerometer sensors (Bao andIntille, 2004). Ravi used a single tri-axial accelerometer (worn nearthe pelvic region) to form an activity window of 256 samples (5.12 sof data) with 50% overlap at a sampling frequency of 50 Hz (Raviet al., 2005). Hong also extracted features from a 256 sample win-dow overlapped with 128 samples (50% overlap) (Hong et al., 2010).Inoue recognized real nursing activities for a whole day by extractingfeatures from a window of 5 s, overlapping every 2.5 s (Inoue et al.,2015).
Most of the existing research has focused on generalized activ-ity recognition model to recognize unseen activities (Kwapisz et al.,2010) (Brezmes et al., 2009). Lockharty and Weiss discussed the impactof personalized model and generalized model in smartphone-basedactivity recognition (Weiss and Lockhart, 2012). They also discussedthe benefits of the personalized or individualized activity recognitionmodels (Lockharty and Weiss, 2014). They showed that the person-alized models performed better than generalized models. The gen-eralized models were unable to classify activities with good accu-racy. They experimented with six activities (walk, jog, stair, sit, stand,and lie) using the widely used classification algorithms (decision tree,random forest, instance-based learning, neural networks, naive Bayesand logistic regression). The participant carried the android smart-phone in their pocket. The 3 axes accelerometer sensor data wereused to extract 43 statistical features. The personal model showedan average accuracy of 97% compared to the average accuracy ofthe hybrid model of 88%, whereas their combination provided evenlower average accuracy of 70%. They showed that in order to improvethe accuracy of the generalized models, it was better to get datafrom more users than to obtain more data from the same set ofusers.
There has been some work using dynamical system theory and chaostheory along with machine learning techniques (Saad Ali, 2007). Franket al. used a wearable device (Intel mobile sensing platform (MSP)(Choudhury et al., 2008)) which contained a tri-axial accelerometer anda biometric pressure sensor (Jordan Frank et al., 2010). The device wasclipped onto a belt at the side of the hip. They used three axes acceler-ation to form a single measure of magnitude. The series of accelerationmagnitude were used to reconstruct phase space. They used principlecomponent analysis (PCA) to extract features (9 largest eigenvalues)from the phase space. These 9 features along with gradient of biometricpressure were used to train and test a Support vector Machine (SVM)for 5 activities performed by 6 participants. They achieved an accu-racy of 85%. Kawsar developed an activity recognition system using
61
M.O. Gani et al. Journal of Network and Computer Applications 141 (2019) 59–72
accelerometer and gyroscope sensor data from the smartphone, andpressure sensor data from the shoe (Kawsar et al., 2015). They useddecision tree, Shapelet based classification (Ye and Keogh, 2009) andtime-delay embedding based classification. The experiments were per-formed using only 4 activities (running, walking, sitting, and stand-ing). They achieved 88.64% classification accuracy using the Shapeletbased classification with pressure sensor data from the left shoe, whichtook 3.3 s. This is a very expensive system with respect to time. Theyachieved 100% classification accuracy using the time-delay embeddingwith one pressure sensor data from the left shoe. They did not men-tion the number of subjects who participated in the study, which wouldhave significant impact on the classification accuracy. Also, they did notperform experiments with other widely tested activities, like walkingupstairs and walking downstairs. Most of the existing approaches havelower accuracy in differentiating between these two activities and thewalking activity (Huynh) (Bao and Intille, 2004) (Lara and Labrador,2013).
In our approach, we used only one-axis acceleration from smart-phone to capture underlying dynamics of the activities by reconstruct-ing the phase space. We learned Gaussian mixture models from under-lying dynamics to classify 11 activities performed by 40 participantsplacing the smartphone in two different body positions.
3. Background
A dynamical system is a model that describes the evolution of asystem over time. It describes the temporal evolution of a system tocapture the system’s dynamics. A phase space represents all possiblestates of the system that evolve over time. The dynamics is the mapthat describes how the system evolves. Theory of dynamical systemsattempts to understand and describe the temporal evolution of a system,which is defined in a phase space.
3.1. Reconstructed phase space
We use the representational capability of RPS to capture the under-lying dynamics of the system from time series observations (accelerom-eter sensor data). The RPS is topologically equivalent to the originalsystem (Takens, 1981). Given a time series x,
x = xn, n = 1…N (1)
where n is the index and N is the total number of observations. Weobserve a sequence of scalar measurements in a time series that dependson the state of the system. We convert these observations into statevectors. These vectors are formed according to Takens delay embeddingtheorem,
Xn = [xn, xn−𝜏 ,… , xn−(d−1)𝜏 ], (2)
where 𝜏 is the time delay and d is the embedding dimension (Takens,1981), (Whitney, 1936), (Sauer et al., 1991). This time-delay embed-ding reconstructs the state and dynamics of the unknown system fromthe observed measurements. This time delayed embedding of the timeseries is called the reconstructed phase space (Fang and Chan, 2013).The sine curve and the corresponding phase plot for different time lagsare shown in Fig. 2. Here the sine curve represents the time series obser-vation for the value of x from 0 to 4𝜋. This observation is then used todescribe the evolution of the system (sine series) over time using phasespace. The phase spaces are reconstructed using dimension d = 3 andtime lag 𝜏 = {3,5,7,9}. The respective phase spaces are shown in dif-ferent colors.
The reconstructed space is topologically equivalent to the originalsystem. It preserves the dynamics of the underlying dynamical systemif certain assumptions are made. The embedding dimension d needs tobe greater than twice the box counting dimension of the original system(Povinelli et al., 2004). For most of the system where d is unknown, d
Fig. 2. Sine curve and its phase plot.
is estimated using the false nearest-neighbor technique. The dimensionof the RPS can be reduced using appropriate selection of the time lag.Though embedding theorems say nothing about the time lag, one of thedata driven approaches to find a reasonable estimate of the time lagis to use the first minimum of the automutual information (Kantz andSchreiber, 2004).
3.2. Gaussian Mixture Models
We use Gaussian Mixture Models (GMM) to learn the underlyingdistribution of the dynamics represented by the RPS. We represent eachactivity class model using a GMM. The GMM is a parametric probabilitydensity function, which is a weighted sum of M Gaussian probabilitydensity function defined as (Reynolds, 2009),
p(𝜒, 𝜆) =M∑
i=1wipi(x) =
M∑
i=1wi (𝜒, 𝜇i,Σi) (3)
where M is the number of mixtures, (x;𝜇i,Σi) is a normal distributionwith mean 𝜇i and covariance matrix Σi, and wi is the mixture weightsatisfy the constraint that
∑Mi=1 wi = 1. The parameters of a complete
parameterized Gaussian mixture is denoted by 𝜆,
𝜆 = {wi, 𝜇i,Σi} i = 1,… ,M (4)
The parameters of the GMM are estimated using the Expectation-Maximization (EM) algorithm to maximize the likelihood of the data(Moon, 1996). The EM algorithm begins with an initial model 𝜆 andthen estimate a new model 𝜆 at each iteration, where p(X ∣ 𝜆) ≥ p(X ∣ 𝜆)for a sequence of training vectors, X = x1, x2,… , xT. Parameters areestimated using the following formulas:
62
M.O. Gani et al. Journal of Network and Computer Applications 141 (2019) 59–72
Fig. 3. Acceleration along three axes for walking activity.
𝜇′m =
∑Tt=1 pm(xt)xt∑Tt=1 pm(xt)
,
Σ′m =
∑Tt=1 pm(xt)(xt − 𝜇m)T(xt − 𝜇m)∑T
t=1 pm(xt),
w′m =
∑Tt=1 pm(xt)xt∑T
t=1∑M
m=1 pm(xi)
(5)
3.3. Maximum likelihood classifier
A Bayesian maximum likelihood classifier computes likelihoods oneach point xk, from each of the learned model, ai using the followinglikelihood function (Moon, 1996):
p(X ∣ ai) =T∏
k=1p(xk ∣ ai) (6)
Once all the likelihoods are computed then the maximum likelihoodclass, a (i.e. classification) is found using the following equation (7).
a = arg maxi
p(X ∣ ai) (7)
4. Experimental data acquisition
Wearable kinematic sensors, such as accelerometer and gyroscope,have been widely used in activity recognition systems. Smartphoneplatforms offer application frameworks and libraries to access the sen-sor data, such that it is easy to access and collect motion data fromsmartphones. Thus, smartphones provide a powerful mobile systemwith integrated sensors, inexpensive software development, and with-out the need for additional hardware. Practically, users are more com-fortable carrying a smartphone than wearing multiple sensors on theirbody. We have used two different datasets (one through data collectionand another publicly available human activity dataset) to perform the
experiment. Both datasets contain raw data from built-in accelerometersensor of the smartphone. The data were collected by placing the smart-phone in four different positions (pant pocket, waist, table, and besidecup-holder (inside car)). The activities performed and phone placementare shown in Table 1.
4.1. Data collection
We collected accelerometer sensor data for different activities usingUbiSen (Ubicomp Lab Sensor Application for Android). We used aGoogle Nexus 5 smartphone running Android OS 5.0. The participantsplaced the phone in their front pant pocket. They performed eight sim-ple activities: walking, walking upstairs, walking downstairs, running,sitting, standing, elevator up and elevator down. We also collected sen-sor data during driving and when the phone was placed at a fixed place,like a table. For the driving activity, the phone was placed inside thepocket and also in the vehicle cup-holder. The accelerometer sensordata along the three axes for the walking activity is shown in Fig. 3.Here three different axes have three different but repetitive patterns.The accelerometer sensor data along the y-axis for all the activities areshown in Fig. 4.
There were 10 participants (age ranges between 20–35, both maleand female) in the data collection event. Each participant performed 10activities in an uncontrolled environment. Each activity was performedfor a different time durations. Walking, running, standing, sitting, andphone placed at table (baseline) were performed for 2–3 min. Walk-ing upstairs, walking downstairs, elevator up, and elevator down wereperformed for 1–2 min. Driving data were collected for approximately10–15 min. In total we have 3 h 20 min of sensor data for 10 differentactivities performed by the participants.
4.2. Public dataset
We also used a dataset Human Activity Recognition Using SmartphoneData Set, from the UCI Machine Learning Repository. The data were
63
M.O. Gani et al. Journal of Network and Computer Applications 141 (2019) 59–72
Fig. 4. Accelerometer sensor data along the Y-axis for 10 different activities.
collected from a group of 30 participants aged 19–48 years. Each par-ticipant wore a smartphone (Samsung Galaxy S II) on the waist andperformed six activities: 1) walking, 2) walking upstairs, 3) walkingdownstairs, 4) sitting, 5) standing, and 6) laying down. The accelerom-eter and gyroscope sensor data were captured at a rate of 50 Hz. Thenoise filters were applied to preprocess the raw sensor data. The Butter-worth low-pass filter was used to separate gravity from the accelerationsignal. The dataset was partitioned randomly into training (70%) andtesting (30%) set.
5. Experimental setup
We briefly discuss the process of training and testing the humanactivities in the following subsections. The overview of both phases isshown in Fig. 5.
5.1. Training
The first step is to build RPS from accelerometer data for eachactivity using time lag and embedding dimension. We estimate the
time lag and embedding dimension using the techniques discussed insection III. The time lag is estimated for each activity signal usingthe first minimum of the automutual information. Once all the timelags are estimated for each activity, then a time lag is selected for theRPS using the mode of the histogram of all estimated time lags. Theglobal false nearest-technique is applied on each activity signal to cal-culate embedding dimension for RPS. Again, once embedding dimen-sions for all the signals are calculated, then an embedding dimen-sion is selected for the RPS as the mean of all calculated dimen-sions. The mode and mean are taken so that most of the activity sig-nals are able to unfold completely in the RPS. Once time lag andembedding dimension are selected, then we build RPS for each sig-nal.
Once the RPS is built, we learn a GMM probability distributionfor each activity signal class. Each GMM represents the correspondingmodel for the activity class. Thus, we have an array of models after thecompletion of the training phase. The size of this array is equal to thenumber of activity class.
64
M.O. Gani et al. Journal of Network and Computer Applications 141 (2019) 59–72
Fig. 5. Overview of training and testing phases of the proposed approach.
Fig. 6. Time lag estimation for walking activity.
5.2. Testing
To test activity signal, we create RPSs from the raw accelerometersensor data using the same time lag and embedding dimensions (esti-mated in the training phase). Then we test RPS against all the GMMs(created in the training phase). It gives us likelihood probability foreach activity model. Bayesian maximum likelihood classifier is used toclassify test signal as a classified or recognized activity. This is doneusing the activity model class with the highest likelihood. The systemoutputs test signal as one of the classified activities.
We evaluate our system with quantitative assessment. The k-foldcross validation helps us to evaluate accuracy where k is the numberof data partitions (Arlot and Celisse, 2010). It helps us to generalizethe statistical analysis and overcome problems like over fitting of thealgorithm on the training set. We also varied the system’s parametersto analyze its robustness.
6. Experimental evaluation
We evaluated our approach using both the collected and publiclyavailable datasets. We used individualized model to experiment withthe collected dataset and generalized model for the public dataset. Weused Matlab and Weka machine learning toolbox to perform the experi-ment. We tested our approach using both dataset and time-domain fea-
tures with classification algorithms using the first dataset. We discussthe experimental details and results in the following subsections.
6.1. Experiment with our approach
We analyzed accelerometer sensor data (3 axes) for all the activi-ties. We observed acceleration along different axes. We saw differentpatterns along these axes for different activities. Even when we lookedonly at the acceleration along the y-axis (as shown in Fig. 4), we alsosaw a uniquely distinguishable pattern for each of the different activi-ties. The challenge was to build the model to capture the dynamics ofthe activities from this acceleration along the y-axis and differentiateone from another. We discuss training and testing phases in the follow-ing subsections in detail.
We used the raw sensor data along the y-axis to build reconstructedphase space with appropriate time lag and embedding dimension. Wepartitioned data into different activity cycles (number of partitions,k = 40) each containing 300–600 samples. During the data collectionprocess we recorded videos of the footsteps. We selected the sam-ple size by comparing activity (walking, walking upstairs, walkingdownstairs, and running) cycles with synchronized video observationsfor each of the activities and the corresponding sensor values at thesame time. We selected the sample size to ensure that it containedmore samples than the largest activity cycle. We also analyzed the
65
M.O. Gani et al. Journal of Network and Computer Applications 141 (2019) 59–72
Fig. 7. Reconstructed phase spaces for time lag, 𝜏 = 5, and embedding dimension, d = 6.
effect of sample size on system’s performance. To build the RPS, wetook one subject from each of the different activity classes. Then wecomputed automutual information for different time lags. The firstminimum of the automutual information is used to estimate the timelag for each activity class. The graph in Fig. 6a shows the automutualinformation of “walking upstairs” activity for different time lags. Herethe first minimum of the automutual information is found for time lagvalue 5.
We computed the time lag for all the activity classes. The modeof these time lags was used to estimate time lag for RPS, as shownin Fig. 6b for all the activities. We found time lag 𝜏 = 5 in this pro-cess. Then we used this estimated time lag value to estimate embed-ding dimension. We computed percentage of false nearest-neighbors todetermine the embedding dimension for each activity class. We tookthe mean of all calculated embedding dimensions to select embeddingdimension for the RPS. We estimated the embedding dimension to bed = 6. We used these estimated values of time lag and embeddingdimension to build RPS for each activity class. The RPSs for walk-ing, walking downstairs, walking upstairs, running, sitting, and phoneplaced at table build with time lag, 𝜏 = 5 and embedding dimension,
d = 6 are shown in Fig. 7. The difference in underlying dynamicsbetween the activities is represented by these RPSs. We used RPSs foreach activity class to learn GMMs.
6.1.1. TestingWe evaluated all the subjects for each activity using each of the
activity models (GMMs). At first the RPSs were generated using thesame time lag and embedding dimension we used in the training phase.These RPSs were then tested against each of the activity class models.We estimated the likelihood of the RPSs against GMMs. We used m = 5mixtures for GMM. We also changed the number of mixtures to seeits effect on the systems performance. For each single subject of data,we computed all the likelihood probability (log probability) for eachactivity class model. Then we used a maximum likelihood classifier toidentify the corresponding subject as one of the human activities. Theclassifier takes all the likelihood probabilities and outputs the activityclass associated with the maximum probability. We used 10-fold crossvalidations to validate accuracy of the system. We took nine partitionsat a time to train the system. The other one along with the trainingpartitions were used to test the performance.
66
M.O. Gani et al. Journal of Network and Computer Applications 141 (2019) 59–72
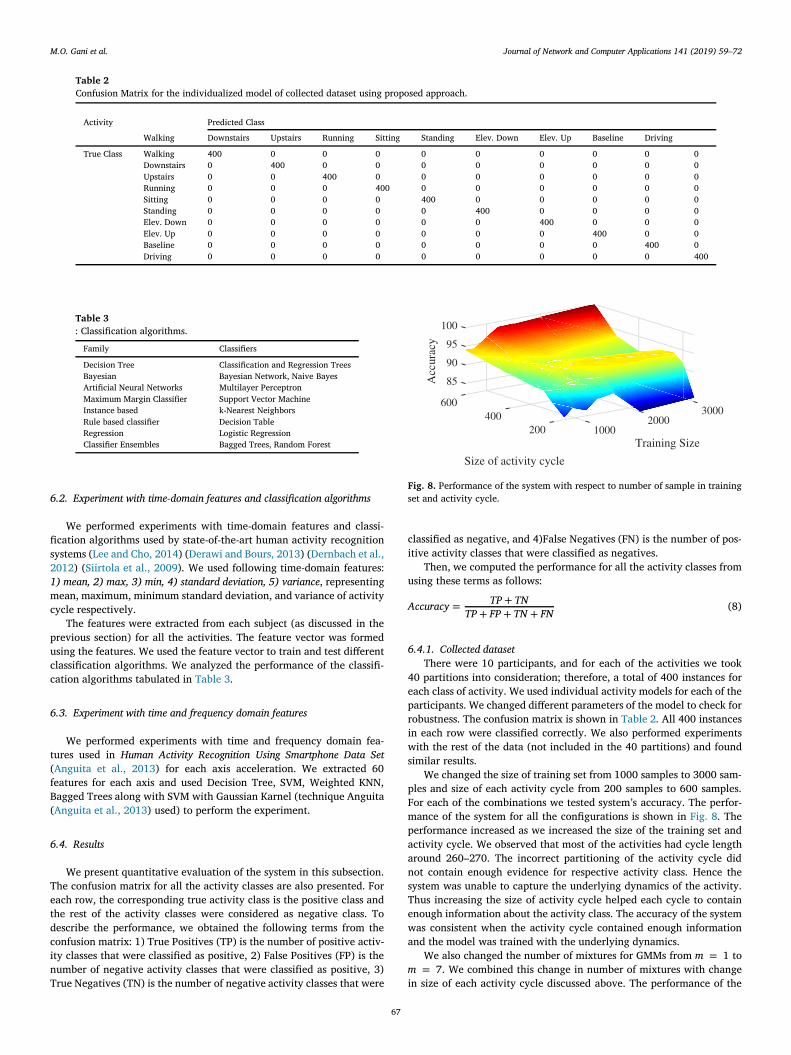
Table 2Confusion Matrix for the individualized model of collected dataset using proposed approach.
Activity Predicted Class
Walking Downstairs Upstairs Running Sitting Standing Elev. Down Elev. Up Baseline Driving
Decision Tree Classification and Regression TreesBayesian Bayesian Network, Naive BayesArtificial Neural Networks Multilayer PerceptronMaximum Margin Classifier Support Vector MachineInstance based k-Nearest NeighborsRule based classifier Decision TableRegression Logistic RegressionClassifier Ensembles Bagged Trees, Random Forest
6.2. Experiment with time-domain features and classification algorithms
We performed experiments with time-domain features and classi-fication algorithms used by state-of-the-art human activity recognitionsystems (Lee and Cho, 2014) (Derawi and Bours, 2013) (Dernbach et al.,2012) (Siirtola et al., 2009). We used following time-domain features:1) mean, 2) max, 3) min, 4) standard deviation, 5) variance, representingmean, maximum, minimum standard deviation, and variance of activitycycle respectively.
The features were extracted from each subject (as discussed in theprevious section) for all the activities. The feature vector was formedusing the features. We used the feature vector to train and test differentclassification algorithms. We analyzed the performance of the classifi-cation algorithms tabulated in Table 3.
6.3. Experiment with time and frequency domain features
We performed experiments with time and frequency domain fea-tures used in Human Activity Recognition Using Smartphone Data Set(Anguita et al., 2013) for each axis acceleration. We extracted 60features for each axis and used Decision Tree, SVM, Weighted KNN,Bagged Trees along with SVM with Gaussian Karnel (technique Anguita(Anguita et al., 2013) used) to perform the experiment.
6.4. Results
We present quantitative evaluation of the system in this subsection.The confusion matrix for all the activity classes are also presented. Foreach row, the corresponding true activity class is the positive class andthe rest of the activity classes were considered as negative class. Todescribe the performance, we obtained the following terms from theconfusion matrix: 1) True Positives (TP) is the number of positive activ-ity classes that were classified as positive, 2) False Positives (FP) is thenumber of negative activity classes that were classified as positive, 3)True Negatives (TN) is the number of negative activity classes that were
Fig. 8. Performance of the system with respect to number of sample in trainingset and activity cycle.
classified as negative, and 4)False Negatives (FN) is the number of pos-itive activity classes that were classified as negatives.
Then, we computed the performance for all the activity classes fromusing these terms as follows:
Accuracy = TP + TNTP + FP + TN + FN
(8)
6.4.1. Collected datasetThere were 10 participants, and for each of the activities we took
40 partitions into consideration; therefore, a total of 400 instances foreach class of activity. We used individual activity models for each of theparticipants. We changed different parameters of the model to check forrobustness. The confusion matrix is shown in Table 2. All 400 instancesin each row were classified correctly. We also performed experimentswith the rest of the data (not included in the 40 partitions) and foundsimilar results.
We changed the size of training set from 1000 samples to 3000 sam-ples and size of each activity cycle from 200 samples to 600 samples.For each of the combinations we tested system’s accuracy. The perfor-mance of the system for all the configurations is shown in Fig. 8. Theperformance increased as we increased the size of the training set andactivity cycle. We observed that most of the activities had cycle lengtharound 260–270. The incorrect partitioning of the activity cycle didnot contain enough evidence for respective activity class. Hence thesystem was unable to capture the underlying dynamics of the activity.Thus increasing the size of activity cycle helped each cycle to containenough information about the activity class. The accuracy of the systemwas consistent when the activity cycle contained enough informationand the model was trained with the underlying dynamics.
We also changed the number of mixtures for GMMs from m = 1 tom = 7. We combined this change in number of mixtures with changein size of each activity cycle discussed above. The performance of the
67
M.O. Gani et al. Journal of Network and Computer Applications 141 (2019) 59–72
Fig. 9. Performance of the system with respect to number of Gaussian mixturesand size of activity cycle.
Fig. 10. Precision and recall for each activity class (Public Dataset).
system for all the configurations is shown in Fig. 9. The performancewas stable with 100% accuracy for all the configuration having at leastactivity cycle size of 300 and 5 mixtures. We observed that the systemwas unable to classify activity cycle with number of mixtures less thanor equal to 3, even though activity cycle contained enough evidence(size = 300 to size = 600). Therefore the number of mixtures was notenough to maximize the likelihood of the RPS.
The performance of the classification algorithms using time-domainfeatures is shown in Fig. 11. The acronyms used in the figure are asfollows: a) Our: Our Approach, b) BT: Bagged Trees, c) LR: LogisticRegression, d) RF: Random Forest, e) DTb: Decision Table, f) W-KNN:Weighted K-Nearest Neighbor, g) SVM, h) Artificial Neural Network, i)NB: Naive Bayes, j) BN: Bayesian Network, and k) DT: Decision Tree.We tested 10 classification algorithms using 5 time-domain featuresfor each individual model. We achieved 90%–91% accuracy for BayesNetwork, Naive Bayes, Multilayer Perceptron, SVM, KNN, and BaggedTrees. We achieved accuracy of above 83% for other classification algo-rithms. In contrast to these approaches, our system achieved an accu-
Fig. 11. Algorithm Performances using 1-Axis Acceleration (Our Dataset).
racy of 100%. Our system is able to classify all the activities from y-axis acceleration with 100% accuracy. We have shown the models areable to capture the underlying dynamics when activity cycle containsenough information about activity. The classification algorithms are notvery successful with above mentioned extracted time-domain featuresfrom the same activity cycle. We present the precision and recall foreach activity class in Fig. 10 for the public dataset. We observed thatthe highest precision and recall are for the sitting and laying activitiesand lowest are for the walking and taking stairs.
6.4.2. Public datasetWe applied our approach on the public dataset. We used generalized
model of each activity for all the participants. The confusion matrix forthis experiment is shown in Table 4. The accuracy of the system forthe generalized model is 90%. For each row, the corresponding trueactivity class is the positive class and the rest of the activity classeswere considered as negative class. We also compared our work withAnguita (Anguita et al., 2013) using 60 time and frequency domain fea-tures, and present the results in Fig. 12. Our approach achieves highestaccuracy (90%) compared to other approaches (Decision Tree (Bao andIntille, 2004) (Ravi et al., 2005), Support Vector Machine (Derawi andBours, 2013) (Attal et al., 2015), K-Nearest Neighbors (Paul and George,2015) (Sani et al., 2017), and Bagged Trees (AK et al., 2017)) and theapproach used in Anguita (Anguita et al., 2013).
7. Discussion
We presented a human activity recognition system for smartphones.We leveraged the built-in accelerometer sensor to identify users’ currentactivity. For the first dataset of 10 participants, out of 10 activities, weachieved 100% accuracy for all the activities using our approach. Weused individualized models for each of the participants for. For the samedataset, we extracted 5 time-domain features and applied 10 classifica-tion algorithms. We achieved the largest accuracy of 91% using thesetechniques.
We also compared (Fig. 11) our work with Anguita (Anguita et al.,2013) using 60 time and frequency domain features. We present a com-
Table 4Confusion Matrix for the generalized model of public dataset using proposed approach.
M.O. Gani et al. Journal of Network and Computer Applications 141 (2019) 59–72
Fig. 12. Performance of algorithms using 1-axis acceleration (UCI Dataset)(Anguita et al., 2013).
parative analysis of our work with state-of-the-art techniques in Table 5.We compare activities, methodology, sensors, extracted features, num-ber of subjects, and performance for each of the works. Compared to theexisting approaches we achieved a very good accuracy for personalizedmodel even with a less amount of data. This gives us the opportunity toeasily create a high accuracy personalized activity recognition model.We also presented time required to build RPS (Povinelli et al., 2004)and extract time and frequency domain features from the accelerationsignal (Anguita et al., 2013) of sample size 128 and 600 in Fig. 13. Thetime required to extract features (7 features and 66 features respec-tively) is 3–4 times higher than building RPS. Also, the time to recog-nize activity class is fast, taking an approximate time of 0.0715 ms.
For the second dataset we applied our approach and used a gen-eralized model. However, the system was able to classify 6 differentactivities of 30 participants with an accuracy of 90%. We achieved 99%accuracy for sitting and laying activity, and 95% for standing. The over-all accuracy increases to 95% when we increased the number of samplesin the activity cycle. When we used individualized models, the systemwas able to classify the activities with an accuracy of 100%. Hence,our approach is able to recognize 11 different activities for 40 differentusers varying the smartphone placement between the pocket and waist.This is only using the observation from one single axis accelerometerdata for personalized models.
The walking, walking upstairs, and walking downstairs are classi-fied with an accuracy of 75%, 90%, and 85% respectively. It looks like
Fig. 13. Time required to extract features and build RPS.
the system is unable to fully capture dynamics for these three activi-ties. If we look at the misclassified instances, we see that all the mis-classified instances were classified between these three activities inter-changeably. Also by observing RPSs for these activities we saw that theyhad a similar dynamics. When we placed the smartphone on the waist,these three activities showed similar dynamics based on the accelera-tion along y-axis. We considered grouping these three activities as oneactivity, named, “walk”, and then classifying it. We then found that thesystem was able to classify the walk activity with 100% accuracy.
We think that the representational capabilities of time-delay embed-ding (RPS) captures the underlying dynamics well from the time seriesacceleration. The higher dimensional representations also helps GMMto learn well from RPS. Compared to existing approaches where thegoal is to extract time and frequency domain features to learn signalpatterns, this approach (RPS + GMM) focuses on understanding under-lying dynamics that describes the temporal evolution of the activitiesthat evolve over time. The better RPS understands underlying dynam-ics, the better GMM learns, leading to higher accuracy compared toexisting approaches.
In this paper, we investigated the performance and applicability ofthe dynamical systems and chaos theory in smartphone based humanactivity recognition system. We also used time-delay embedding orreconstructed phase space to capture underlying dynamics of humanbody motion for 11 different activities from smartphones’ accelerom-eter sensor. Most of the proposed and existing approaches used three
Table 5Comparison of representative past works on AR.
Work Activities Methodology Sensors System Features Subjects Accuracy
M.O. Gani et al. Journal of Network and Computer Applications 141 (2019) 59–72
axes acceleration along with other sensors (3-axes gyroscope, pressure,magnetometer) to recognize activities. In contrast to these approaches,we only used one axis acceleration to recognize activities. This reducesthe computational and memory complexity of the system by reducingthe size of data (from 3 to 7 time series to 1 time series) that needs to beprocessed. Moreover, most of the machine learning techniques requireextensive computation and occupy large memory because of the largenumber of attributes that are present in the feature vectors (Lara andLabrador, 2013). Building RPSs are less complex and less expensivethan these techniques. This is very helpful for implementation of thesystem on the smartphone. We also reduced computational and mem-ory complexity by considering a small sample size. We used a statisticallearner to train captured underlying dynamics in the RPSs and usedmaximum likelihood classifier to classify activities.
We implemented our system (as android application) in two differ-ent case studies: 1) a rehabilitation clinic, to track patients daily activ-ities and assess assigned task and daily routine, 2) the Hajj, to trackpilgrims’ location based on their activities. We used Android platformfor the implementation. We published our dataset on a public domainwebsite to enrich human activity dataset and accelerate research in thisarea.
8. Conclusion
We experimented with an alternative approach to extensively usedmachine learning techniques in human activity recognition from kine-matics sensors (accelerometer) and achieved a very good accuracy. Wealso investigated the performance of the proposed approach using col-lected and publicly available human activity recognition datasets. Wepresent a comparative study and an analysis. Application of the pro-posed system in wearable sensor based activity recognition can beresearched further. The analysis of the experiment and results fromthe case studies can be a future work. Investigation of the proposedapproach using 3-axes acceleration and other sensors can be researchedfurther.
The functional or complex activities comprise of a simple activityand a particular function. For example, when a person is reading abook, it is most likely that the person is sitting somewhere. Thus, simpleactivities provide influential information about complex activities. Wedeveloped this simple activity recognition system to progress our workon the complex activity recognition system, where this simple activitywill be considered as one of the inputs beside location and time to pre-dict functional activities (Gani et al., 2017). Also, a long-term monitor-ing of simple activities will facilitate estimation of composite activitiesand provide important parameters to evaluate quality of life.
Human activity recognition plays a very important role in manyresearch areas and applications. Therefore, a support system that willprovide information about current activity of a user by hiding all thecomplex details behind activity recognition is an in-demand service forthese areas. We have started to implement the proposed activity recog-nition system on the smartphones’ application framework as a service.The applications from the application layer and other services from theapplication framework will be able to access it to get the activity infor-mation. This service will make building HAR applications easier.
Acknowledgments
This project was partially funded by the Department of Education,National Institute on Disability and Rehabilitation Research, grant num-ber H133G100211; and National Plan for Science, Technology andInnovation (MAARIFAH) King Abdulaziz city for science and Technol-ogy, the Kingdom of Saudi Arabia, award number (12-INF2290-10).We would like to thank all the participants of this research study andmembers of the Ubicomp Lab, Marquette University for their help. Wewould also like to thank Mohammad Adibuzzaman, Purdue University,
and G M Tanimul Ahsan, Marquette University for their valuable helpand advice.
References
Aggarwal, J.K., Cai, Q., 1999. Human motion analysis: a review. Comput. Vis. ImageUnderstand. 73 (3), 428–440, https://doi.org/10.1006/cviu.1998.0744.
AK, C., D, T., V, C., SG, T., 2017. Ensemble methods for classification of physicalactivities from wrist accelerometry. 49 (9), 1965–1973, https://doi.org/10.1249/MSS.0000000000001291.
Albert, M.V., Azeze, Y., Courtois, M., 2017. A. Jayaraman, In-lab versus at-home activityrecognition in ambulatory subjects with incomplete spinal cord injury. J. NeuroEng.Rehabil. 14 (1), 10, https://doi.org/10.1186/s12984-017-0222-5. URL https://doi.org/10.1186/s12984-017-0222-5.
Altun, K., Barshan, B., 2010. Human activity recognition using inertial/magnetic sensorunits. Human Behavior Understanding 38–51.
Anguita, D., Ghio, A., Oneto, L., Parra, X., Reyes-Ortiz, J.L., 2013. A public domaindataset for human activity recognition using smartphones, European symposium onartificial neural networks. Computational Intelligence and Machine Learning 24–26.
Antos, S. a., Albert, M.V., Kording, K.P., 2014. Hand, belt, pocket or bag: practicalactivity tracking with mobile phones. J. Neurosci. Methods 231, 22–30, https://doi.org/10.1016/j.jneumeth.2013.09.015.
Arlot, S., Celisse, A., 2010. A survey of cross-validation procedures for model selection.Stat. Surv. 4, 40–79, https://doi.org/10.1214/09-SS054. URL https://doi.org/10.1214/09-SS054.
Attal, F., Mohammed, S., Dedabrishvili, M., Chamroukhi, F., Oukhellou, L., Amirat, Y.,2015. Physical human activity recognition using wearable sensors. Sensors 15 (12),31314–31338, https://doi.org/10.3390/s151229858. URL http://www.mdpi.com/1424-8220/15/12/29858.
Bao, L., Intille, S.S., 2004. Activity recognition from user-annotated acceleration data.In: Pervasive Computing. Springer, pp. 1–17, https://doi.org/10.1007/b96922.
Bayat, A., Pomplun, M., Tran, D.A., 2014. A study on human activity recognition usingaccelerometer data from smartphones. Procedia Computer Science 34, 450–457,https://doi.org/10.1016/j.procs.2014.07.009.
Brezmes, T., Gorricho, J.-L., Cotrina, J., 2009. Activity Recognition from AccelerometerData on a Mobile Phone, pp. 796–799, https://doi.org/10.1007/978-3-642-02481-8_120 URL https://doi.org/10.1007/978-3-642-02481-8_120.
Casale, P., Pujol, O., Radeva, P., 2011. Human Activity Recognition from AccelerometerData Using a Wearable Device. Springer Berlin Heidelberg, Berlin, Heidelberg, pp.289–296, https://doi.org/10.1007/978-3-642-21257-4_36. URL https://doi.org/10.1007/978-3-642-21257-4_36.
Choudhury, T., Borriello, G., Consolvo, S., et al., 2008. The mobile sensing platform: anembedded activity recognition system. IEEE Pervasive Computing 7 (2), 32–41,https://doi.org/10.1109/MPRV.2008.39.
Clingingsmith, D., Kremer, M., Clingingsmith, D., Khwaja, A.I., Kremer, M., 2009.Estimating the impact of the Hajj: religion and tolerance in islam’s global gathering.Q. J. Econ. 124 (3), 1133–1170.
Derawi, M., Bours, P., 2013. Gait and activity recognition using commercial phones.Comput. Secur. 39, 137–144, https://doi.org/10.1016/j.cose.2013.07.004. URLhttps://doi.org/10.1016/j.cose.2013.07.004.
Dernbach, S., Das, B., Krishnan, N.C., Thomas, B., Cook, D., 2012. Simple and complexactivity recognition through smart phones. In: International Conf. on IntelligentEnvironments, pp. 214–221, https://doi.org/10.1109/IE.2012.39.
Fang, S.-C., Chan, H.-L., 2013. Qrs detection-free electrocardiogram biometrics in thereconstructed phase space. Pattern Recogn. Lett. 34 (5), 595–602, https://doi.org/10.1016/j.patrec.2012.11.005.
Gani, Md Osman, Fayezeen, Taskina, Ahamed, Sheikh Iqbal, Tomashek, Dennis B.,Smith, Roger O., 2015. Simple activity recognition using smartphone technologiesfor in-home rehabilitation. In: RESNA Annual Conference. https://www.resna.org/sites/default/files/conference/2015/pdf_versions/other/151.pdf.
Gani, M.O., Ahsan, G.M.T., Do, D., Drew, W., Balfas, M., Ahamed, S.I., Arif, M., Kattan,A.J., 2016. An approach to localization in crowded area. In: 2016 IEEE 18thInternational Conference on e-Health Networking, Applications and Services(Healthcom), pp. 1–6, https://doi.org/10.1109/HealthCom.2016.7749446.
Gani, M.O., Saha, A.K., Ahsan, G.M., Ahamed, S.I., Smith, R.O., 2017. A novelframework to recognize complex human activity. In: 2017 IEEE 41st AnnualComputer Software and Applications Conference (COMPSAC), 01, pp. 948–956,https://doi.org/10.1109/COMPSAC.2017.27, doi.ieeecomputersociety.org/10.1109/COMPSAC.2017.27.
Gheid, Z., Challal, Y., Yi, X., Derhab, A., 2017. Efficient and privacy-aware multi-partyclassification protocol for human activity recognition. J. Netw. Comput. Appl. 98,84–96URL, https://doi.org/10.1016/j.jnca.2017.09.005, http://www.sciencedirect.com/science/article/pii/S1084804517303016.
Hache, G., Lemaire, E.D., Baddour, N., 2010. Mobility change-of-state detection using asmartphone-based approach. IEEE International Workshop on MedicalMeasurements and Applications 43–46, https://doi.org/10.1109/MEMEA.2010.5480206.
He, Z., Jin, L., 2009. Activity recognition from acceleration data based on discreteconsine transform and SVM. In: IEEE International Conference on Systems, Man andCybernetics, IEEE, pp. 5041–5044, https://doi.org/10.1109/ICSMC.2009.5346042.
Hong, Y.-J., Kim, I.-J., Ahn, S.C., Kim, H.-G., 2010. Mobile health monitoring systembased on activity recognition using accelerometer. Simulat. Model. Pract. Theor. 18(4), 446–455.
D. T. G. Huynh, Human activity recognition with wearable sensors, PhD Dissertation,TECHNISCHE UNIVERSIT DARMSTADT.
M.O. Gani et al. Journal of Network and Computer Applications 141 (2019) 59–72
Inoue, S., Ueda, N., Nohara, Y., Nakashima, N., 2015. Mobile activity recognition for awhole day: recognizing real nursing activities with big dataset. In: Proceedings of the2015 ACM International Joint Conference on Pervasive and Ubiquitous Computing,UbiComp 2015, ACM, New York, NY, USA, pp. 1269–1280, https://doi.org/10.1145/2750858.2807533 URL http://doi.acm.org/10.1145/2750858.2807533.
Jatob, L.C., Grossmann, U., Kunze, C., et al., 2008. Context-aware mobile healthmonitoring: evaluation of different pattern recognition methods for classification ofphysical activity. IEEE Engineering in Medicine and Biology Society 5250–5253,https://doi.org/10.1109/IEMBS.2008.4650398.
Jordan Frank, S.M.D.P., Frank, J., Mannor, S., Precup, D., 2010. Activity and Gaitrecognition with time-delay embeddings. In: AAAI Conference on ArtificialIntelligence, pp. 407–408.
Kantz, H., Schreiber, T., 2004. Nonlinear Time Series Analysis. vol. 47. Cambridge Univ.Press, p. 369, https://doi.org/10.1198/tech.2005.s306.
Kawsar, F., Hasan, M.K., Love, R., Ahamed, S.I., 2015. A novel activity detection systemusing plantar pressure sensors and smartphone. In: Computer Software andApplications Conference (COMPSAC), 2015 IEEE 39th Annual, vol. 1, pp. 44–49,https://doi.org/10.1109/COMPSAC.2015.201.
Khan, A., Mellor, S., Berlin, E., Thompson, R., McNaney, R., Olivier, P., Pltz, T., 2015.Beyond activity recognition: skill assessment from accelerometer data. In:Proceedings of the 2015 ACM International Joint Conference on Pervasive andUbiquitous Computing, UbiComp 15, ACM, New York, NY, USA, pp. 1155–1166,https://doi.org/10.1145/2750858.2807534 URL http://doi.acm.org/10.1145/2750858.2807534.
Kwapisz, J.R., Weiss, G.M., Moore, S.A., 2010. Activity recognition using cell phoneaccelerometers. In: Fourth International Workshop on Knowledge Discovery fromSensor Data, pp. 10–18.
Lane, N.D., Miluzzo, E., Lu, H., Peebles, D., Choudhury, T., Campbell, A.T., 2010. Asurvey of mobile phone sensing. IEEE Commun. Mag. 48 (9), 140–150, https://doi.org/10.1109/MCOM.2010.5560598.
Lara, O.D., Labrador, M. a., 2013. A survey on human activity recognition usingwearable sensors. IEEE Communications Surveys & Tutorials 15 (3), 1192–1209,https://doi.org/10.1109/SURV.2012.110112.00192.
Lee, Y.-S., Cho, S.-B., 2011. Hybrid artificial intelligent systems: 6th internationalconference, HAIS 2011, Wroclaw, Poland, may 23-25, 2011, proceedings, Part I. In:Activity Recognition Using Hierarchical Hidden Markov Models on a Smartphonewith 3D Accelerometer. Springer Berlin Heidelberg, Berlin, Heidelberg, pp.460–467, https://doi.org/10.1007/978-3-642-21219-2_58. Ch URL https://doi.org/10.1007/978-3-642-21219-2_58.
Lee, Y.-S., Cho, S.-B., 2014. Activity recognition with android phone usingmixture-of-experts co-trained with labeled and unlabeled data. Neurocomputing126, 106–115, https://doi.org/10.1016/j.neucom.2013.05.044. URL https://doi.org/10.1016/j.neucom.2013.05.044.
F. Li, K. Shirahama, M. A. Nisar, L. Kping, M. Grzegorzek, Comparison of featurelearning methods for human activity recognition using wearable sensors, Sensors 18(2). doi:10.3390/s18020679. URL http://www.mdpi.com/1424-8220/18/2/679
Liao, L., Fox, D., Kautz, H., 2005. Location-based activity recognition. In: InternationalJoint Conference on Artificial Intelligence (IJCAI).
Lockharty, J.W., Weiss, G.M., 2014. The benefits of personalized smartphone-basedactivity recognition models. In: 2014 SIAM International Conference on DataMining, p. 9, https://doi.org/10.1137/1.9781611973440.71 URL http://epubs.siam.org/doi/abs/10.1137/1.9781611973440.71.
lvarez Concepcin, M., Morillo, L.S., Gonzalez-Abril, L., Ramrez, J.O., 2014. Discretetechniques applied to low-energy mobile human activity recognition. a newapproach. Expert Syst. Appl. 41 (14), 6138–6146 09574174.
lvarez de la Concepcin, M., Morillo, L.S., Gonzalez-Abril, L., Ramrez, J.O., 2014. Discretetechniques applied to low-energy mobile human activity recognition. a newapproach. Expert Syst. Appl. 41 (14), 6138–6146.
Maurer, U., Smailagic, A., Siewiorek, D., Deisher, M., 2006. Activity recognition andmonitoring using multiple sensors on different body positions. In: InternationalWorkshop on Wearable and Implantable Body Sensor Networks (BSN06). IEEE, pp.113–116, https://doi.org/10.1109/BSN.2006.6.
Moon, T.K., 1996. The expectation-maximization algorithm. IEEE Signal Process. Mag.13, 47–60, https://doi.org/10.1109/79.543975.
Osmani, V., Balasubramaniam, S., Botvich, D., 2008. Hu man activity recognition inpervasive health-care: supporting efficient remote collaboration. J. Netw. Comput.Appl. 31 (4), 628–655 URL, https://doi.org/10.1016/j.jnca.2007.11.002, http://www.sciencedirect.com/science/article/pii/S1084804507000719.
Panwar, M., Dyuthi, S.R., Prakash, K.C., Biswas, D., Acharyya, A., Maharatna, K.,Gautam, A., Naik, G.R., 2017. Cnn based approach for activity recognition using awrist-worn accelerometer. In: 2017 39th Annual International Conference of theIEEE Engineering in Medicine and Biology Society (EMBC), pp. 2438–2441, https://doi.org/10.1109/EMBC.2017.8037349.
Paul, P., George, T., 2015. An effective approach for human activity recognition onsmartphone. In: 2015 IEEE International Conference on Engineering and Technology(ICETECH), pp. 1–3, https://doi.org/10.1109/ICETECH.2015.7275024.
Piyathilaka, L., Kodagoda, S., 2013. Gaussian mixture based HMM for human dailyactivity recognition using 3D skeleton features. In: IEEE Conf. on IndustrialElectronics and Applications, pp. 567–572, https://doi.org/10.1109/ICIEA.2013.6566433.
Povinelli, R.J., Johnson, M.T., Lindgren, A.C., Jinjin Ye, A.J.Y., 2004. Time seriesclassification using Gaussian mixture models of reconstructed phase spaces. IEEETrans. Knowl. Data Eng. 16 (6), 779–783.
Ravi, N., Dandekar, N., Mysore, P., Littman, M., 2005. Activity Recognition fromAccelerometer Data. In: 17th Conference on Innovative Applications of ArtificialIntelligence, pp. 1541–1546, https://doi.org/10.1007/978-3-642-02481-8_120.
Reiss, A., Weber, M., Stricker, D., 2011. Exploring and Extending the Boundaries ofPhysical Activity Recognition, pp. 46–50.
Reynolds, D., 2009. Gaussian mixture models. Encyclopedia of Biometrics 659–663.Rokni, S.A., Nourollahi, M., Ghasemzadeh, H., 2018. Personalized human activity
recognition using convolutional neural networks. In: AAAI.Saad Ali, M.S., 2007. Arslan Basharat, Chaotic invariants for human action recognition.
In: IEEE 11th International Conference on Computer Vision.Sani, S., Wiratunga, N., Massie, S., Cooper, K., 2017. Knn sampling for personalised
human activity recognition. In: Aha, D.W., Lieber, J. (Eds.), Case-Based ReasoningResearch and Development. Springer International Publishing, Cham, pp. 330–344.
Satyanarayanan, M., 2001. Pervasive computing: vision and challenges. IEEE PersonalCommunications 8 (4), 10–17, https://doi.org/10.1109/98.943998.
Sauer, T., Yorke, J.A., Casdagli, M., 1991. Embedology. J. Stat. Phys. 65 (34), 579–616,https://doi.org/10.1007/BF01053745.
Siirtola, P., Laurinen, P., Haapalainen, E., Roning, J., Kinnunen, H., 2009.Clustering-based activity classification with a wrist-worn accelerometer using basicfeatures. In: 2009 IEEE Symposium on Computational Intelligence and Data Mining,pp. 95–100, https://doi.org/10.1109/CIDM.2009.4938635.
Srivastava, P., 2012. Hierarchical human activity recognition using GMM. In: TheSecond International Conference on Ambient Computing, Applications, Services andTechnologies (c), pp. 32–37.
Su, X., Tong, H., Ji, P., 2014. Activity recognition with smartphone sensors. TsinghuaSci. Technol. 19 (3), 235–249, https://doi.org/10.1109/TST.2014.6838194.
Sun, L., Zhang, D., Li, B., Guo, B., Li, S., 2010. Ubiquitous intelligence and computing:7th international conference, UIC 2010, Xian, China, october 26-29, 2010.Proceedings. In: Activity Recognition on an Accelerometer Embedded Mobile Phonewith Varying Positions and Orientations. Springer Berlin Heidelberg, Berlin,Heidelberg, pp. 548–562, https://doi.org/10.1007/978-3-642-16355-5_42. Ch. URLhttps://doi.org/10.1007/978-3-642-16355-5_42.
Takens, F., 1981. Detecting strange attractors in turbulence, dynamical systems andturbulence. Lect. Notes Math. 898, 366–381, https://doi.org/10.1007/bfb0091924.
Takeuchi, S., Tamura, S., Hayamizu, S., 2009. Human action recognition usingacceleration information based on hidden markov model. In: Proceedings: APSIPAASC 2009: Asia-Pacific Signal and Information Processing Association, 2009 AnnualSummit and Conference, pp. 829–832.
Tapia, E.M., Intille, S.S., Larson, K., 2004. Activity recognition in the home using simpleand ubiquitous sensors. Pervasive Computing 3001, 158–175, https://doi.org/10.1007/b96922 arXiv:9780201398298.
Tapia, E.M., Intille, S.S., Haskell, W., Larson, K., Wright, J., et al., 2007. Real-timerecognition of physical activities and their intensities using wireless accelerometersand a heart rate monitor. In: IEEE International Symposium on WearableComputers, pp. 1–4, https://doi.org/10.1109/ISWC.2007.4373774.
Torres-Huitzil, C., Alvarez-Landero, A., 2015. Accelerometer-Based Human ActivityRecognition in Smartphones for Healthcare Services. Springer InternationalPublishing, Cham, pp. 147–169, https://doi.org/10.1007/978-3-319-12817-7_7.URL https://doi.org/10.1007/978-3-319-12817-7_7.
ul Haq, M.E., Azam, M.A., Naeem, U., Amin, Y., Loo, J., 2018. Co ntinuousauthentication of smartphone users based on activity pattern recognition usingpassive mobile sensing. J. Netw. Comput. Appl. 109, 24–35 URL, https://doi.org/10.1016/j.jnca.2018.02.020, http://www.sciencedirect.com/science/article/pii/S1084804518300717.
Wang, W., Liu, A.X., Shahzad, M., Ling, K., Lu, S., 2015. Understanding and modeling ofwifi signal based human activity recognition. In: Proceedings of the 21st AnnualInternational Conference on Mobile Computing and Networking, MobiCom 15,ACM, New York, NY, USA, pp. 65–76, https://doi.org/10.1145/2789168.2790093URL http://doi.acm.org/10.1145/2789168.2790093.
Weiss, G.M., Lockhart, J.W., 2012. The impact of personalization on smartphone-basedactivity recognition. In: AAAI Workshop on Activity Context Representation:Techniques and Languages, pp. 98–104 URL http://www.aaai.org/ocs/index.php/WS/AAAIW12/paper/download/5203/5564.
Yan, Z., Subbaraju, V., Chakraborty, D., Misra, A., Aberer, K., 2012. Energy-efficientcontinuous activity recognition on mobile phones: an activity-adaptive approach. In:Proceedings of the 2012 16th Annual International Symposium on WearableComputers (ISWC), ISWC 12. IEEE Computer Society, Washington, DC, USA, pp.17–24, https://doi.org/10.1109/ISWC.2012.23. URL https://doi.org/10.1109/ISWC.2012.23.
Yang, J., 2009. Toward physical activity diary: motion recognition using simpleacceleration features with mobile phones. Data Process. 1–9, https://doi.org/10.1145/1631040.1631042.
Ye, L., Keogh, E., 2009. Time series shapelets: a new primitive for data mining. In:Proceedings of the 15th ACM SIGKDD International Conference on KnowledgeDiscovery and Data Mining, KDD 09, ACM, New York, NY, USA, pp. 947–956,https://doi.org/10.1145/1557019.1557122 URL http://doi.acm.org/10.1145/1557019.1557122.
Yi, W.J., Jia, W., Saniie, J., 2012. Mobile sensor data collector using Androidsmartphone. Midwest Symposium on Circuits and Systems 956–959, https://doi.org/10.1109/MWSCAS.2012.6292180.
Zhang, S., McCullagh, P., Nugent, C., Zheng, H., 2010. Activity monitoring using a smartphone’s accelerometer with hierarchical classification. International Conf. onIntelligent Environments 158–163, https://doi.org/10.1109/IE.2010.36.
Zhu, C., Sheng, Weihua, 2009. Human daily activity recognition in robot-assisted livingusing multi-sensor fusion. In: IEEE International Conference on Robotics andAutomation, IEEE, pp. 2154–2159, https://doi.org/10.1109/ROBOT.2009.5152756.
M.O. Gani et al. Journal of Network and Computer Applications 141 (2019) 59–72
Md Osman Gani, born in Bangladesh, received the B.Sc.degree in computer science and engineering from the Mil-itary Institute of Science and Technology (MIST), Dhaka,Bangladesh, in 2008, and the M.Sc. degree in computationalsciences from Marquette University, Milwaukee, WI, USA, in2013. He did his PhD in computational sciences from Mar-quette University. He is currently serving as a Visiting Assis-tant Professor in the department of computer science and soft-ware engineering at Miami University. In 2009, he joined theDepartment of Computer Science and Engineering, MIST, as aLecturer and served there for two and a half year. He workedas a research and teaching assistant at Marquette University.His research centers in data science and machine learning withan interest in contributing to a deeper understanding of thecontext in big data ubiquitous computing environment. Hisresearch focuses on elegant modeling of problems of practicalinterest by understanding the dynamics using big data analy-sis. His research interests include data science, machine learn-ing, ubiquitous computing, indoor localization, and humanactivity recognition. He has authored and co-authored around20 publications in these areas. He has received best researchposter award at Marquette University.
Taskina Fayezeen, born in Chittagong, Bangladesh, receivedthe B.Sc. degree in computer science and engineering fromMilitary Institute of Science and Technology (MIST), Dhaka,Bangladesh, in 2012, and the M.Sc. degree in computing fromDepartment of MSCS, Marquette University, USA, in 2016. Sheis currently working as an application developer in the depart-ment of Information Technology Services at Miami University.Before joining Miami University, she worked in the App Brew-ery team at University of Wisconsin, Milwaukee for 1 year.In 2014, she joined the UbiComp Lab, Marquette University,as a Research Assistant and served there for two and a halfyear. Her current research interests include pervasive comput-ing and mHealth. She has received best research poster awardat Marquette University.
Richard J. Povinelli (S85M97SM01) received the B.S. degreein electrical engineering and B.A. degree in psychology fromthe University of Illinois, Champaign-Urbana, IL, USA, in1987, the M.S. degree in computer and systems engineer-ing from Rensselaer Polytechnic Institute, Troy, NY, USA, in1989, and the Ph.D. degree in electrical and computer engi-neering from Marquette University, Milwaukee, WI, USA, in1999. From 1987 to 1990, he was a Software Engineer withGeneral Electric (GE) Corporate Research and Development.From 1990 to 1994, he was with GE Medical Systems, wherehe served as a Program Manager and then as a Global ProjectLeader.From 1995 to 2006, he consecutively held the positionsof Lecturer, Adjunct Assistant Professor, and Assistant Profes-sor with the Department of Electrical and Computer Engineer-ing, Marquette University, Milwaukee, WI, USA, where, since2006, he has been an Associate Professor. His research inter-ests include signal processing, machine learning, and chaosand dynamical systems. He has authored and co-authored over70 publications in these areas.
Roger O. Smith, PhD, OT, FAOTA, RESNA Fellow, is a profes-sor of Occupational Science and Technology at University ofWisconsin Milwaukee, USA. He completed his Ph.D. in HumanFactors and Health Systems Engineering from the Departmentof Industrial Engineering, University of Wisconsin-Madisonin 2003. Roger O. Smith’s research focuses on measurementrelated to disability and the application of assistive technol-ogy and universal design. In measurement, Smith examinesassessments to determine their reliability and validity in use.He has created a software-based evaluation system that uses abranching question structure called TTSS (Trichotomous Tai-lored Sub-branching Scoring.) One component of Smith’s cur-rent research specifically investigates the utility of the TTSSmethodology as embedded in OTFACT software. Smith alsoinvestigates the effectiveness of assistive technology and uni-versal design interventions on the lives of people with disabili-ties. Currently, Smith directs several federally-funded projects.Smith has served as primary author and director for more than30 grant and contract awards of over $8 million of extramural-sponsored research and training programs. These projects havesupported many dozens of students in assistive technologytraining and in research support positions. Smith is the direc-tor of the R2D2 Center which provides an interdisciplinaryhome for basic research, applied research and development,as well as innovative instruction related to technology and dis-ability.
Sheikh Iqbal Ahamed is a professor of Computer Scienceand director of Ubicomp lab (www.mscs.mu.edu/∼ubicomp)at Marquette University, USA. He is a senior member of theIEEE, ACM, and the IEEE Computer Society. He completedhis Ph.D. in Computer Science from Arizona State Univer-sity, USA in 2003. His research interests include mHealth,security and privacy in pervasive computing, affective com-puting, middleware for ubiquitous/pervasive computing. Cur-rently, he has over 1 million dollar research grants in mHealtharea and mobile/pervasive computing area. He has a num-ber of collaborative mHealth projects with the researchers ofdifferent universities and non-profit organizations in USA. Hehas international mHealth projects in Bangladesh, Nepal, Tai-wan and China. He has published 100+ peer reviewed jour-nal, conference and workshop papers. He has received ninebest paper/posters awards in last five years. One of themwas selected the best from 325 submitted papers. Dr. Ahamedserves regularly on international conference program commit-tees in software engineering and pervasive computing such asCOMPSAC 13, COMPSAC 12, PERCOM 08, and SAC 08. He isthe Workshops Chair of COMPSAC 2009 and COMPSAC 2010.He has been serving as the Steering Chair of COPSAC 2016 andWan 2016. General Chair of COMPSAC 2015. He was the Pro-gram Chair of COMPSAC 2011. He was the Program Co-Chairof WPS 2009 and SPTSA 10. He is the Guest Editor of Com-puter Communications Journal, Elsevier. Here is a link of oneof his high impact mHealth projects: http://www.marquette.edu/research/documents/discover-2011-mobile-md.pdf. Dr.Ahamed can be contacted at [email protected];http://www.mscs.mu.edu/∼iq.