1 The 2 nd QbD Conference QbD in Large Molecules: Th A Mb td b th CMC Bi t h 1 The A-Mab case study by the CMC Biotech Working group Dan Kenett May 5 2010 Jerusalem Background: Therapeutic Monoclonal Antibodies Selected A-Mab chapters: OUTLINE Design of Molecule and Quality Attributes Assessment Upstream Manufacturing Process Development Control Strategy 2
Transcript
1
The 2nd QbD Conference
QbD in Large Molecules:
Th A M b t d b th CMC Bi t h
1
The A-Mab case study by the CMC Biotech Working groupDan Kenett
May 5 2010 Jerusalem
Background: Therapeutic Monoclonal Antibodies
Selected A-Mab chapters:
OUTLINE
Design of Molecule and Quality Attributes Assessment
Upstream Manufacturing Process Development
Control Strategy
2
2
OUTLINE
Background: Therapeutic Monoclonal Antibodies
Selected A-Mab chapters:
Design of Molecule and Quality Attributes Assessment
Upstream Manufacturing Process Development
Control Strategy
3
Therapeutic Monoclonal Antibodies
A total of 21 mAb products are approved in the US, with additional products marketed outside the US
mAb therapeutics are now being developed and marketed by most mAb therapeutics are now being developed and marketed by most major pharmaceutical firms
7 mAbs have global sales of over US$1 billion
In 2006 global market = US$20 billion ,
in 2010 expected to reach US$40 billion
over 200 mAb candidates are currently undergoing clinical study
4
Reichert J.M. Current Pharmaceutical Biotechnology 2008, 9, 423-430
3
Monoclonal antibody structure
5
Schiesti M. (Sandoz) PMDA symposium 2009
Possible natural modes of action of mAbs versus cells cells
6 Schiesti M. (Sandoz) PMDA symposium 2009
4
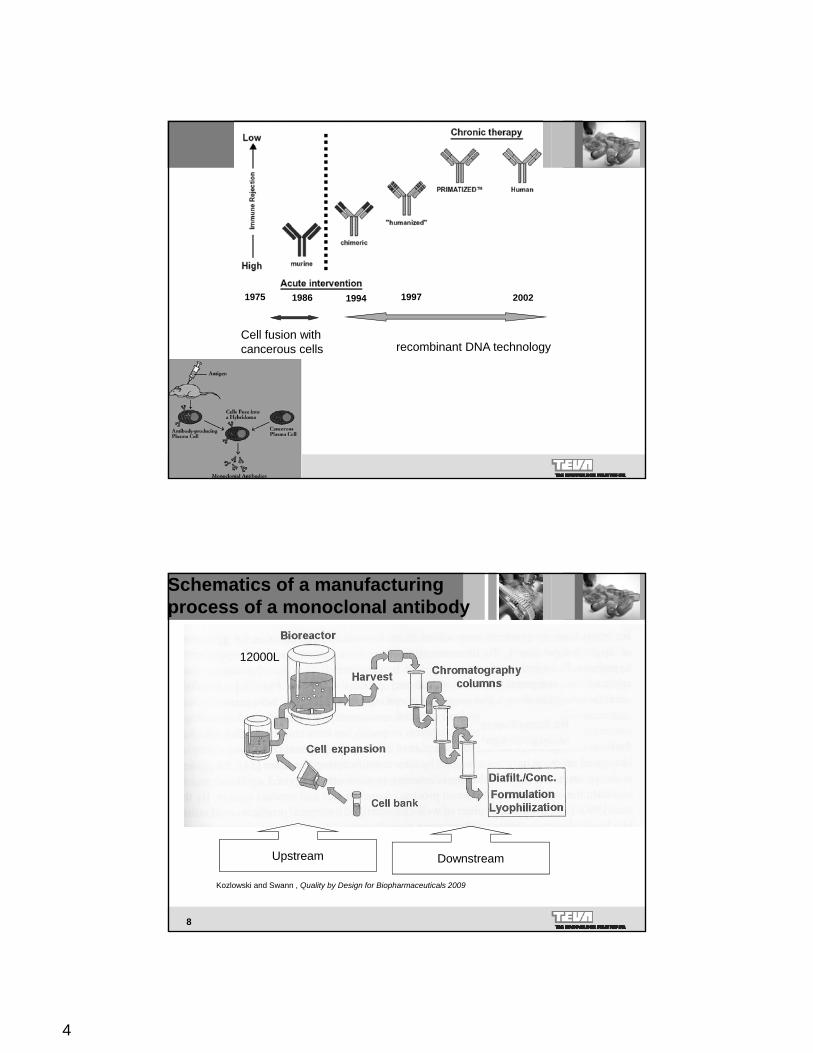
Cell fusion with cancerous cells recombinant DNA technology
1975 1986 1994 1997 2002
7
Schematics of a manufacturing process of a monoclonal antibody
12000L
8
Kozlowski and Swann , Quality by Design for Biopharmaceuticals 2009
2. Mockestuzumab (S2 and P2 module of CTD format) –2010 target
EFPIA
6
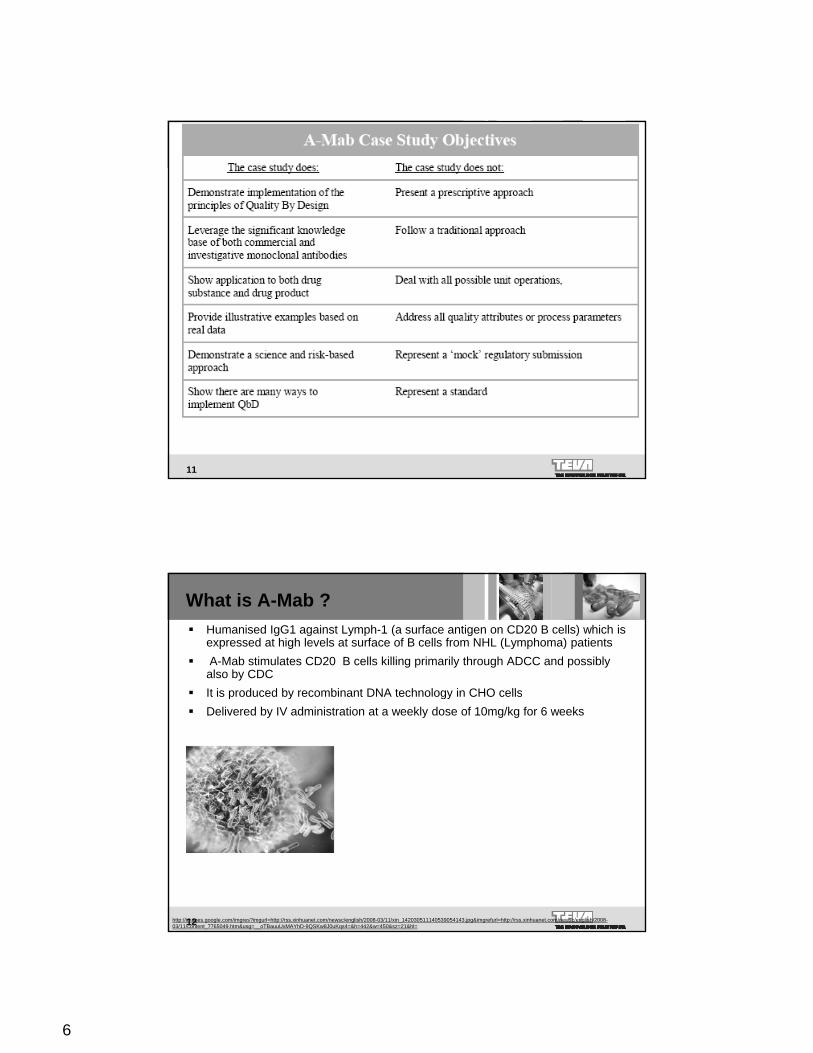
11
What is A-Mab ?
Humanised IgG1 against Lymph-1 (a surface antigen on CD20 B cells) which is expressed at high levels at surface of B cells from NHL (Lymphoma) patients
A-Mab stimulates CD20 B cells killing primarily through ADCC and possibly also by CDC
It is produced by recombinant DNA technology in CHO cells It is produced by recombinant DNA technology in CHO cells
Delivered by IV administration at a weekly dose of 10mg/kg for 6 weeks
1. Design of Molecule and Quality Attributes Assessment
2. Upstream Manufacturing Process Development
3. A-Mab Downstream Process Description and Characterization3. A Mab Downstream Process Description and Characterization
4. Drug Product
5. Control Strategy
6. Regulatory Section
13
OUTLINE
Background: Therapeutic Monoclonal Antibodies
Selected A-Mab chapters:
Design of Molecule and Quality Attributes Assessment
Upstream Manufacturing Process Development
Control Strategy
14
8
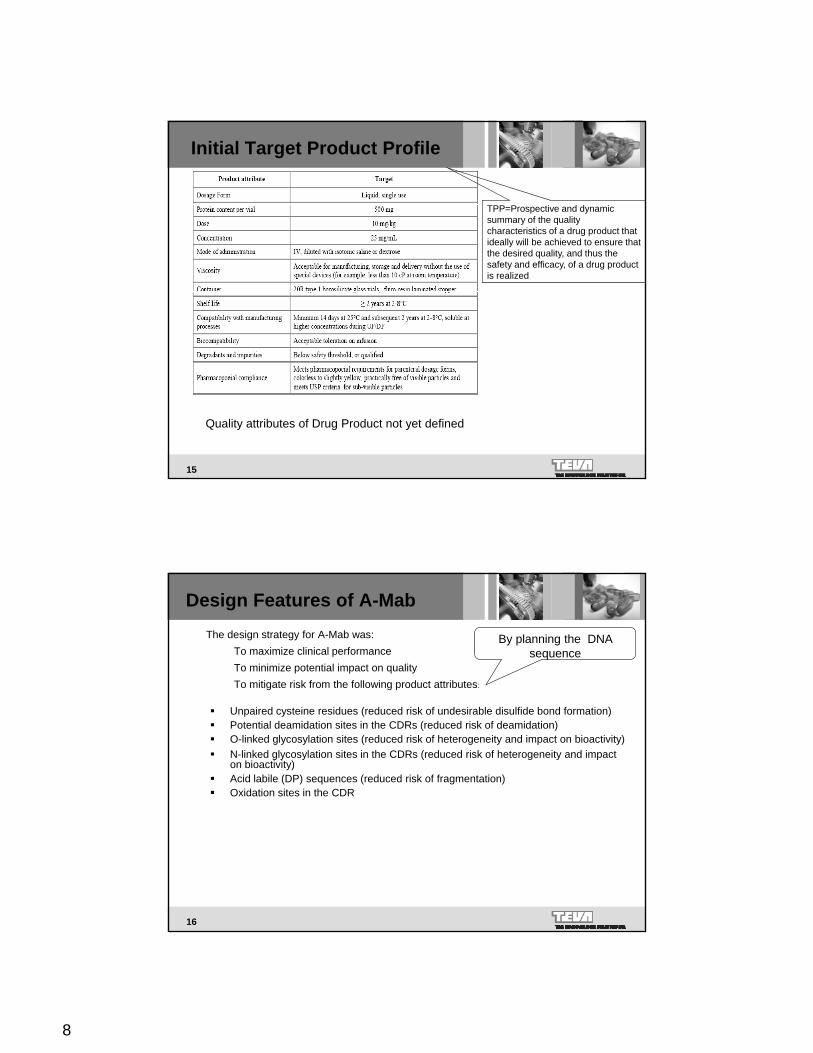
Initial Target Product Profile
TPP=Prospective and dynamic summary of the quality characteristics of a drug product that id ll ill b hi d t th tideally will be achieved to ensure that the desired quality, and thus the safety and efficacy, of a drug product is realized
15
Quality attributes of Drug Product not yet defined
Design Features of A-Mab
The design strategy for A-Mab was:
To maximize clinical performance
To minimize potential impact on quality
To mitigate risk from the following product attributes:
By planning the DNA sequence
Unpaired cysteine residues (reduced risk of undesirable disulfide bond formation) Potential deamidation sites in the CDRs (reduced risk of deamidation) O-linked glycosylation sites (reduced risk of heterogeneity and impact on bioactivity)
N-linked glycosylation sites in the CDRs (reduced risk of heterogeneity and impact on bioactivity)
Acid labile (DP) sequences (reduced risk of fragmentation) Oxidation sites in the CDR
16
9
Quality Attributes of monoclonal antibodies
Quality attributes that can vary quantitatively and qualitatively in a process
17
Systematic Identification of critical Quality Attributes
18
10
Overview of A-Mab Product Realization Process
19
Overview of A-Mab Product Realization Process
20
11
Platform Knowledge
21
Quality Attribute Risk Assessment Tools
Three types of tools for assessing criticality of quality attributes are presented as examples:
Risk ranking (Tool #1)
Criticality = Impact x uncertainty Criticality = Impact x uncertainty
Preliminary hazards analysis (PHA) (Tool #2)
Criticality = Severity (safety,efficacy) x Likelihood (probability of AE due to out of range)
A safety assessment decision tree for evaluating process-related impurities that do not have biological activity based on ISF(Tool #3)
The impurity safety factor (ISF) = LD50 ÷ Level in Product Dose
22
p y y ( )
12
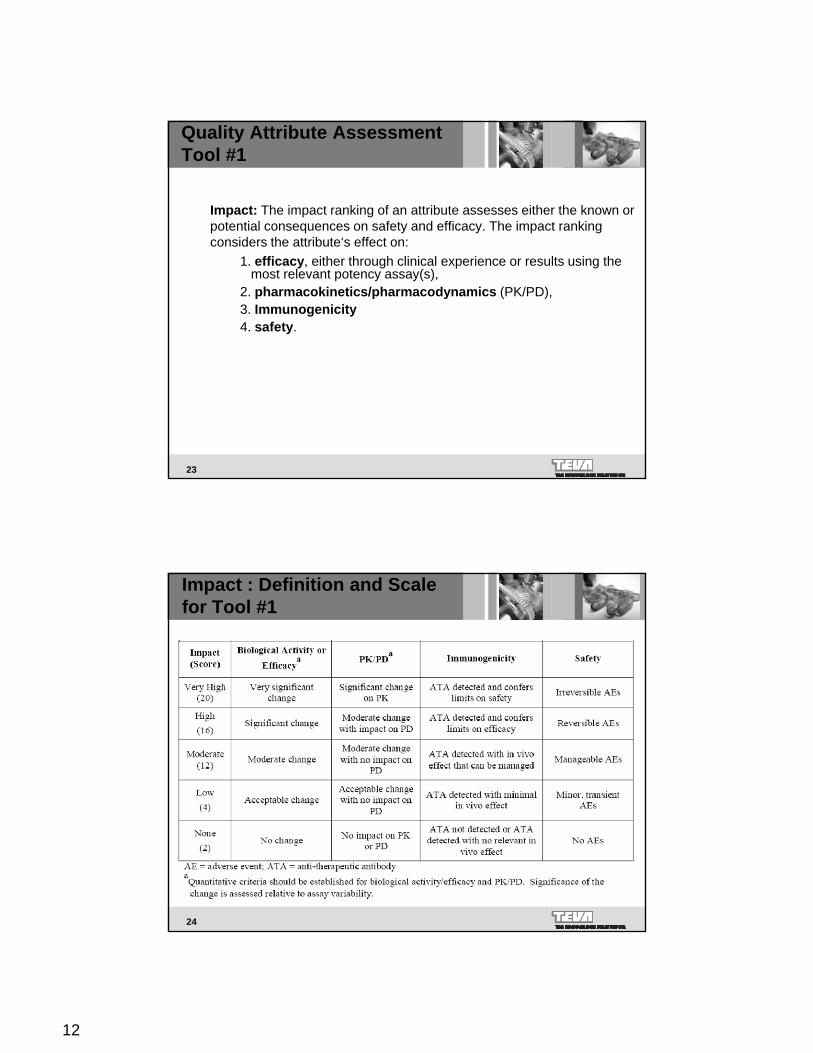
Quality Attribute Assessment Tool #1
Impact: The impact ranking of an attribute assesses either the known or potential consequences on safety and efficacy. The impact ranking considers the attribute‘s effect on:considers the attribute s effect on:
1. efficacy, either through clinical experience or results using the most relevant potency assay(s),
All quality attributes are assigned a degree of criticality (criticality continuum) based on their respective risk score. Risk scores range between a low of 2 to a high of 140.
26
14
Examples of Quality Attribute Risk Assessment with Tool#1
27
(WHO)
A-Mab examples of Tool #1
Aggregation
DNAModerate high
28
The individual impact category with the highest ranking determines
the overall impact ranking for an attribute
None Moderate
15
Summary of Quality attribute Risk assessments
Vary according to mode of action
29
Critical quality attribute includes H and VH
Critical Quality attributes and target ranges
8 Q
ualit
y A
ttrib
utes
30
8
16
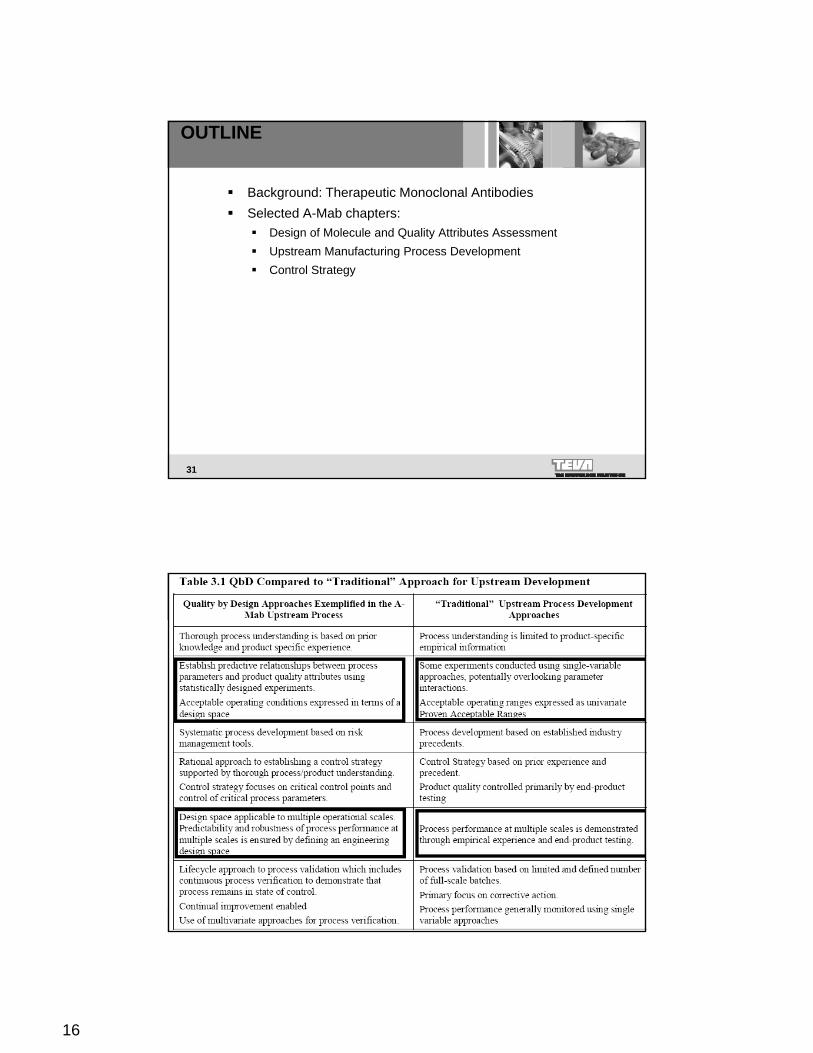
OUTLINE
Background: Therapeutic Monoclonal Antibodies
Selected A-Mab chapters:
Design of Molecule and Quality Attributes Assessment
Upstream Manufacturing Process Development
Control Strategy
31
32
17
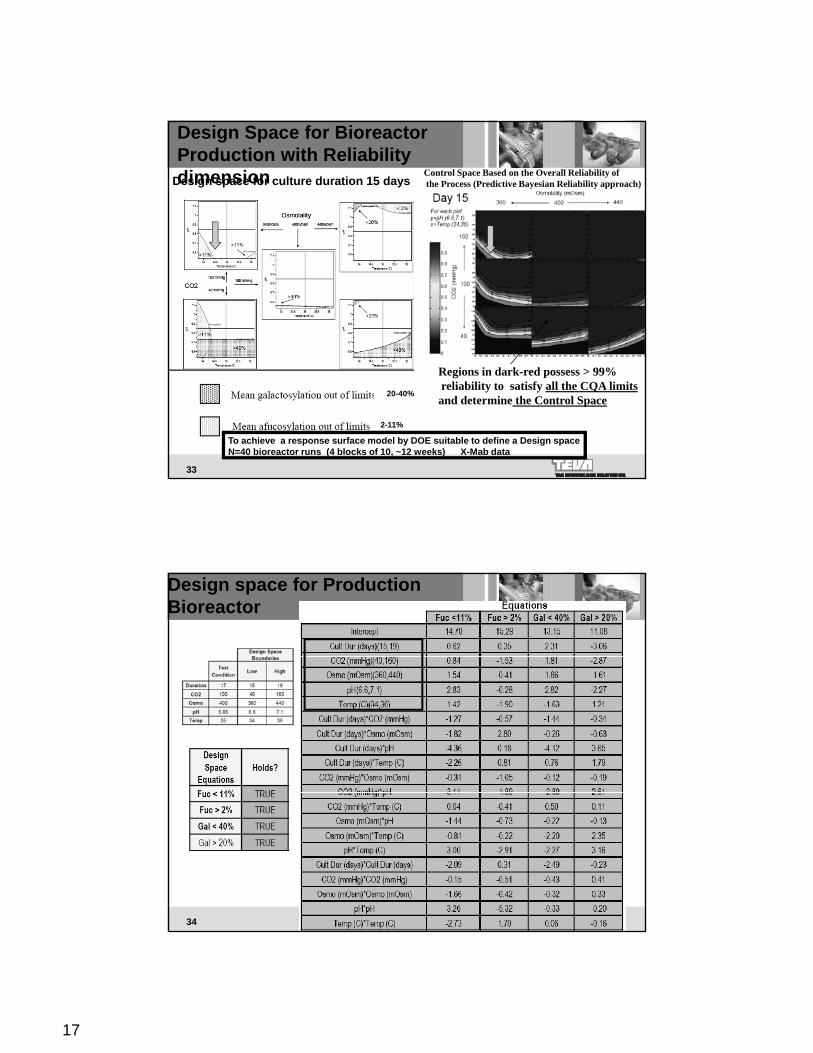
Design Space for Bioreactor Production with Reliability dimension Control Space Based on the Overall Reliability of
the Process (Predictive Bayesian Reliability approach)Design space for culture duration 15 days
33
Regions in dark-red possess > 99%reliability to satisfy all the CQA limitsand determine the Control Space
To achieve a response surface model by DOE suitable to define a Design spaceN=40 bioreactor runs (4 blocks of 10, ~12 weeks) X-Mab data
2-11%
20-40%
Design space for Production Bioreactor
34
18
Design space examples in A-Mab
Upstream production bioreactor
Low pH viral inactivation
Drug product compounding
Drug product sterile filtration
Bioreactor engineering
35
OUTLINE
Background: Therapeutic Monoclonal Antibodies
Selected A-Mab chapters:
Design of Molecule and Quality Attributes Assessment
Upstream Manufacturing Process Development
Control Strategy
36
19
QbD vs Traditional approach for the Control Strategy
37
Risk Assessment Approach used through Development Lifecycle and for setting Control Strategy
38
Prior knowledge and early development experience used to identify parameters and attributes that must be considered for process characterization studies
20
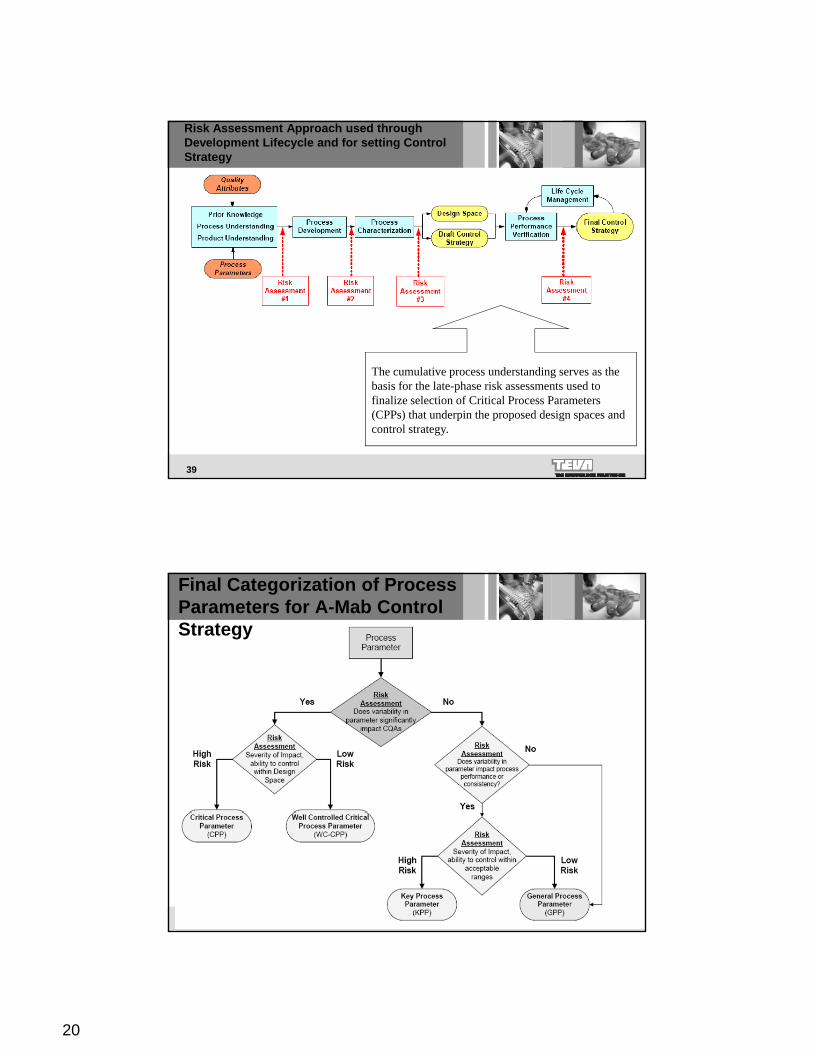
Risk Assessment Approach used through Development Lifecycle and for setting Control Strategy
39
The cumulative process understanding serves as the basis for the late-phase risk assessments used to finalize selection of Critical Process Parameters (CPPs) that underpin the proposed design spaces and control strategy.
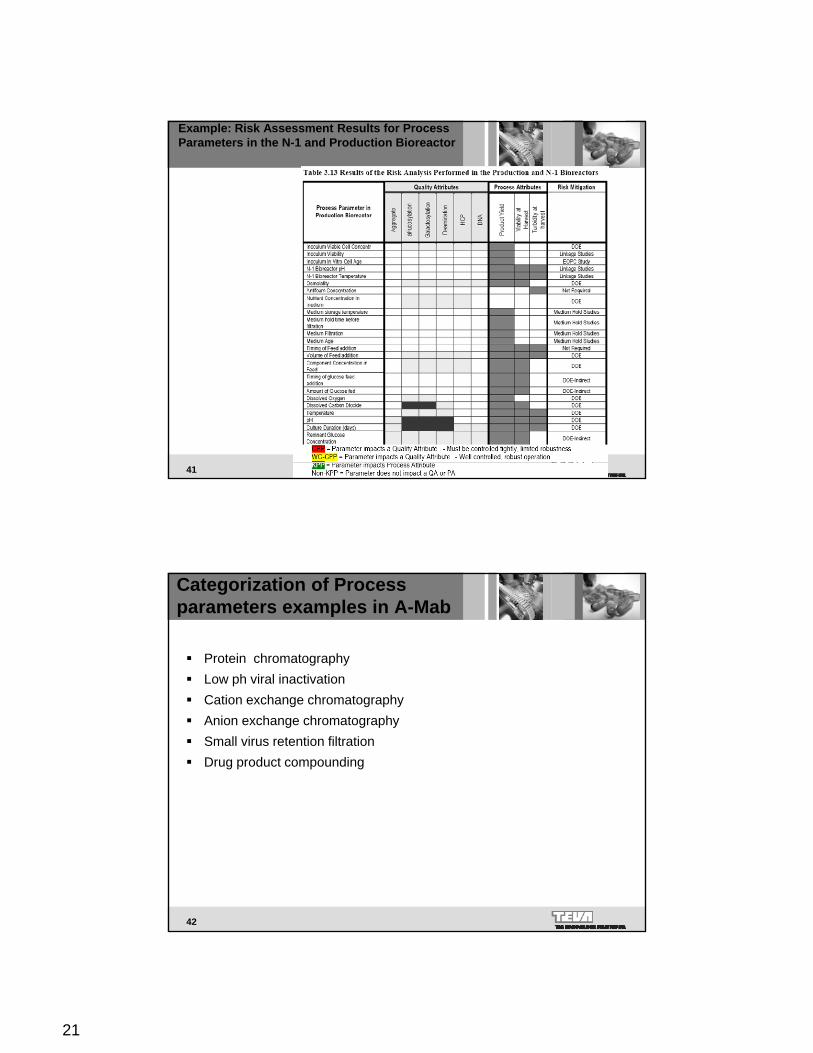
Final Categorization of Process Parameters for A-Mab Control Strategy
40
21
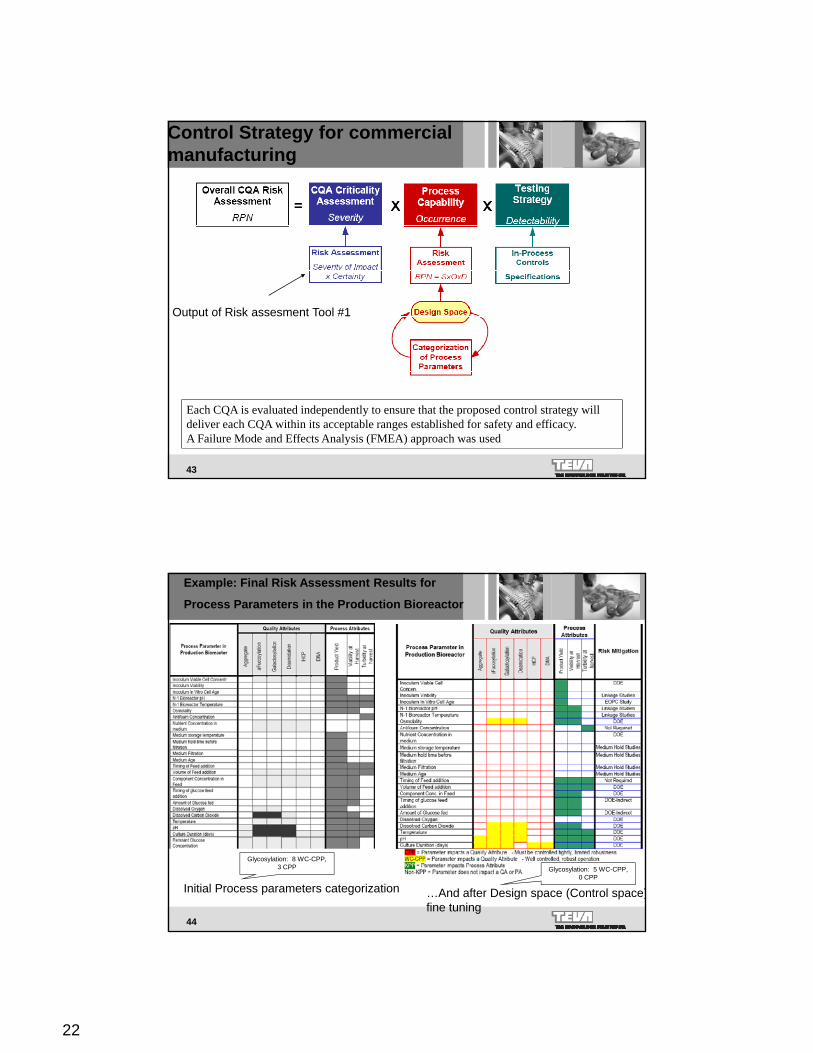
Example: Risk Assessment Results for Process Parameters in the N-1 and Production Bioreactor
41
Categorization of Process parameters examples in A-Mab
Protein chromatography
Low ph viral inactivation
Cation exchange chromatography
Anion exchange chromatography
Small virus retention filtration
Drug product compounding
42
22
Control Strategy for commercial manufacturing
Output of Risk assesment Tool #1
43
Each CQA is evaluated independently to ensure that the proposed control strategy will deliver each CQA within its acceptable ranges established for safety and efficacy. A Failure Mode and Effects Analysis (FMEA) approach was used
Example: Final Risk Assessment Results for
Process Parameters in the Production Bioreactor
44
Initial Process parameters categorization …And after Design space (Control space)fine tuning
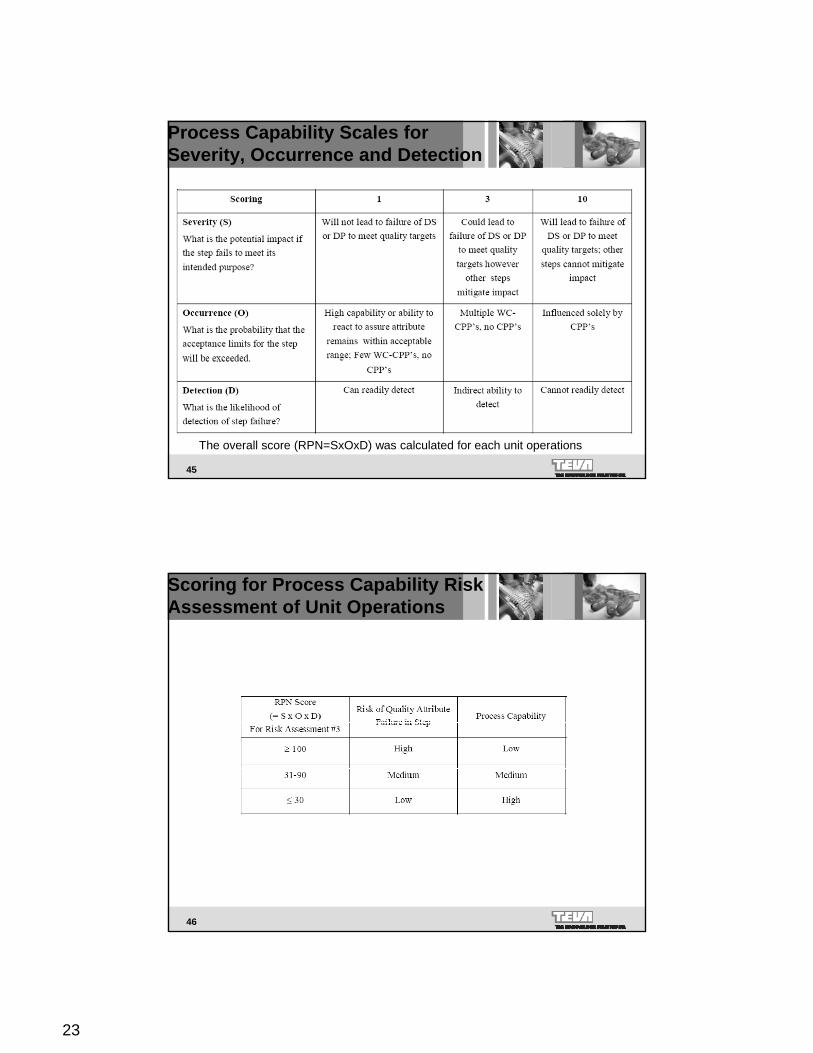
Process Capability Scales for Severity, Occurrence and Detection
45
The overall score (RPN=SxOxD) was calculated for each unit operations
Scoring for Process Capability Risk Assessment of Unit Operations
46
24
Examples of Process Capability Risk Assessment
(Risk assessment #3)
47
A-Mab Control Strategy
Control Strategy
48
Product Understanding
25
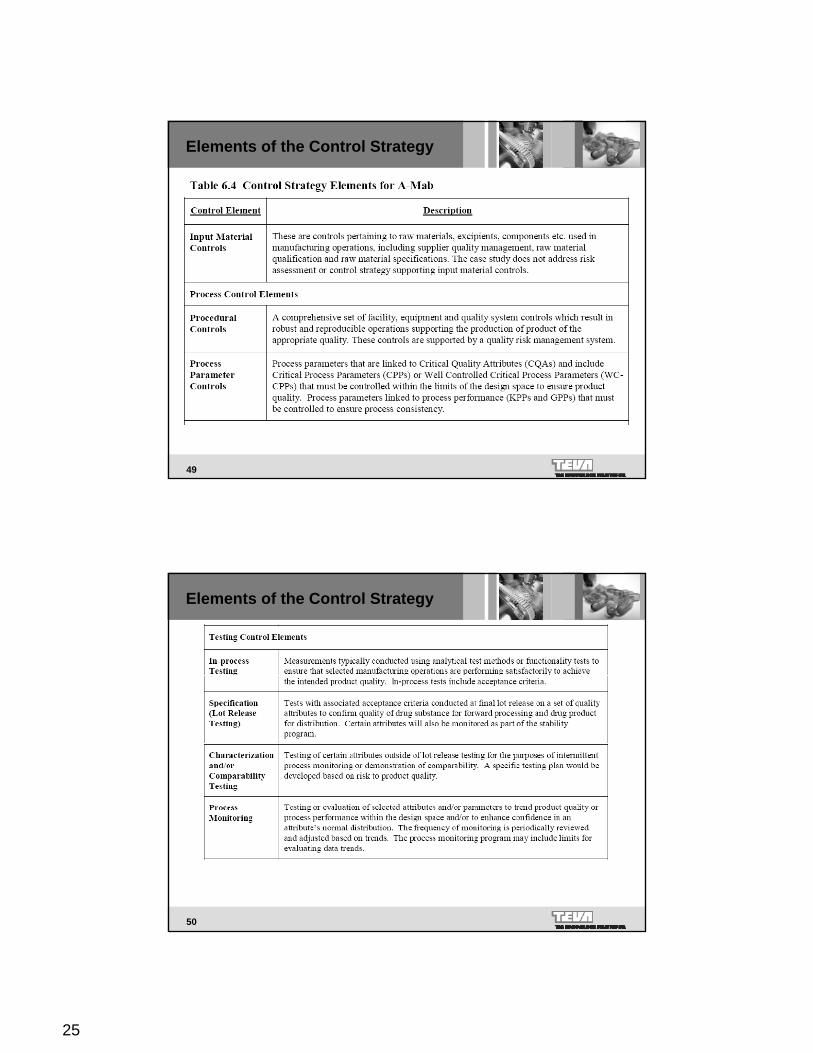
Elements of the Control Strategy
49
Elements of the Control Strategy
50
26
Specifications Tests
Based on the enhanced product and process understanding, specification tests are significantly reducedcompared to traditional approaches.
Some specification testing has been moved to in-processtests (including PAT) while other tests were eliminated because operation within the process design space provides a high degree of assurance that the process will deliver consistent product quality
51
deliver consistent product quality
52
27
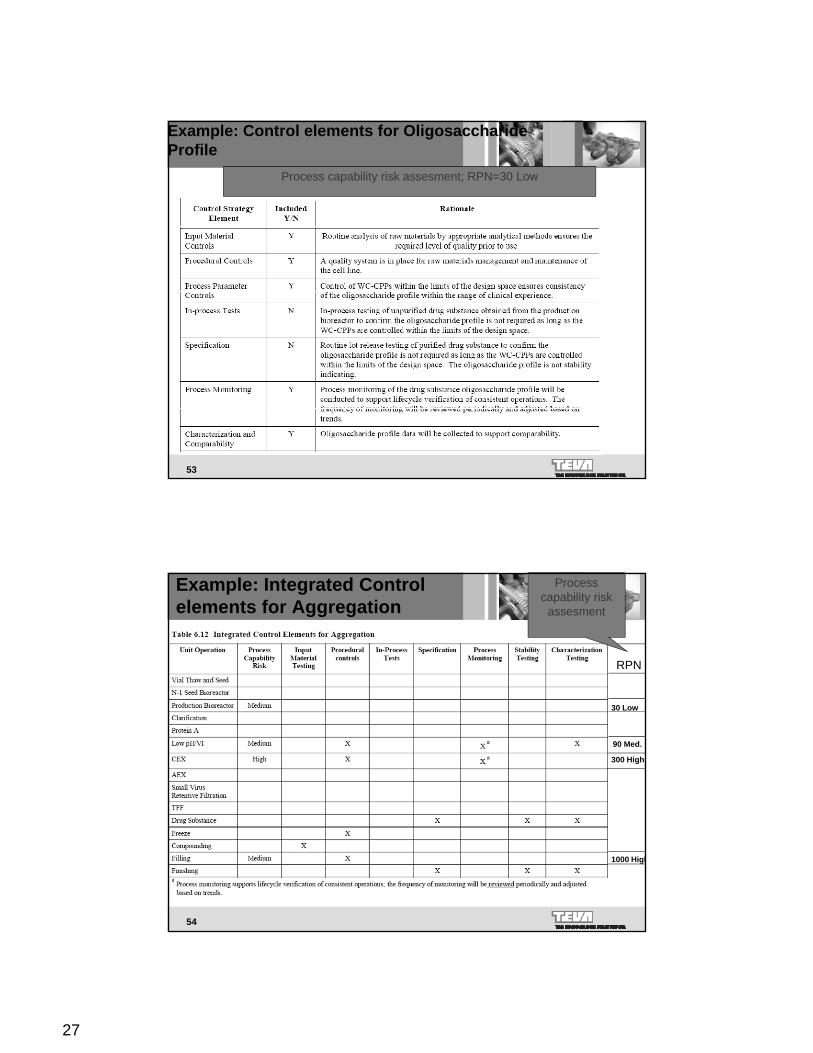
Example: Control elements for Oligosaccharide Profile
Process capability risk assesment; RPN=30 Low
53
Example: Integrated Control elements for Aggregation
RPN
Process capability risk
assesment
30 Low
90 Med.
300 High
54
1000 High
28
Control elements for Aggregate1 and Oligosaccharide2 profile in A-Mab
CQA Process capability Risk
Input material Testing
Procedural control
Process parameter control
In-process tests
Specification Process Monitoring
Stability Testing
Characterization Testing
Aggregate High Y Y N N Y Y Y Y
Oligosaccharide profile
Low Y Y Y N N Y N Y
1 summary of control elements assigned to various downstream process steps
2 control elements assigned to bioreactor production
55
Arrow indicates differences
Control strategy examples in A-Mab
Upstream
Downstream
Drug product compounding
Drug product sterile filtration
Drug product filling, stopping, capping
56
29
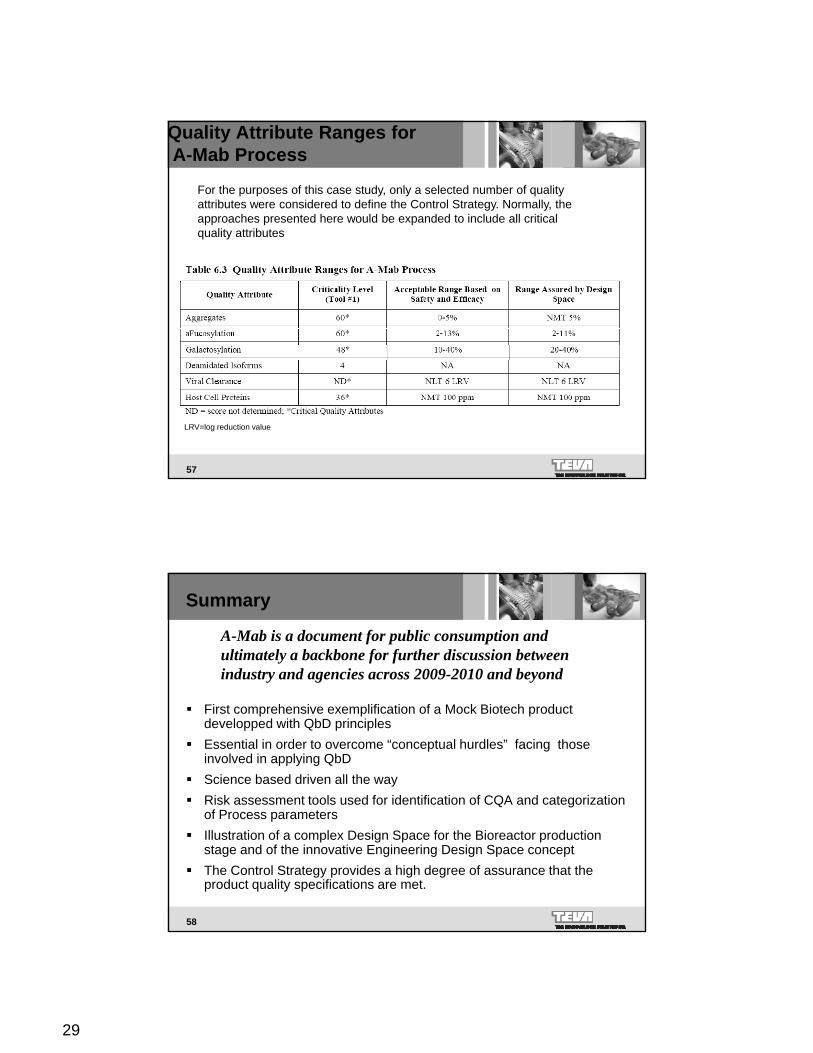
For the purposes of this case study, only a selected number of quality attributes were considered to define the Control Strategy. Normally, the approaches presented here would be expanded to include all critical quality attributes
Quality Attribute Ranges forA-Mab Process
57
LRV=log reduction value
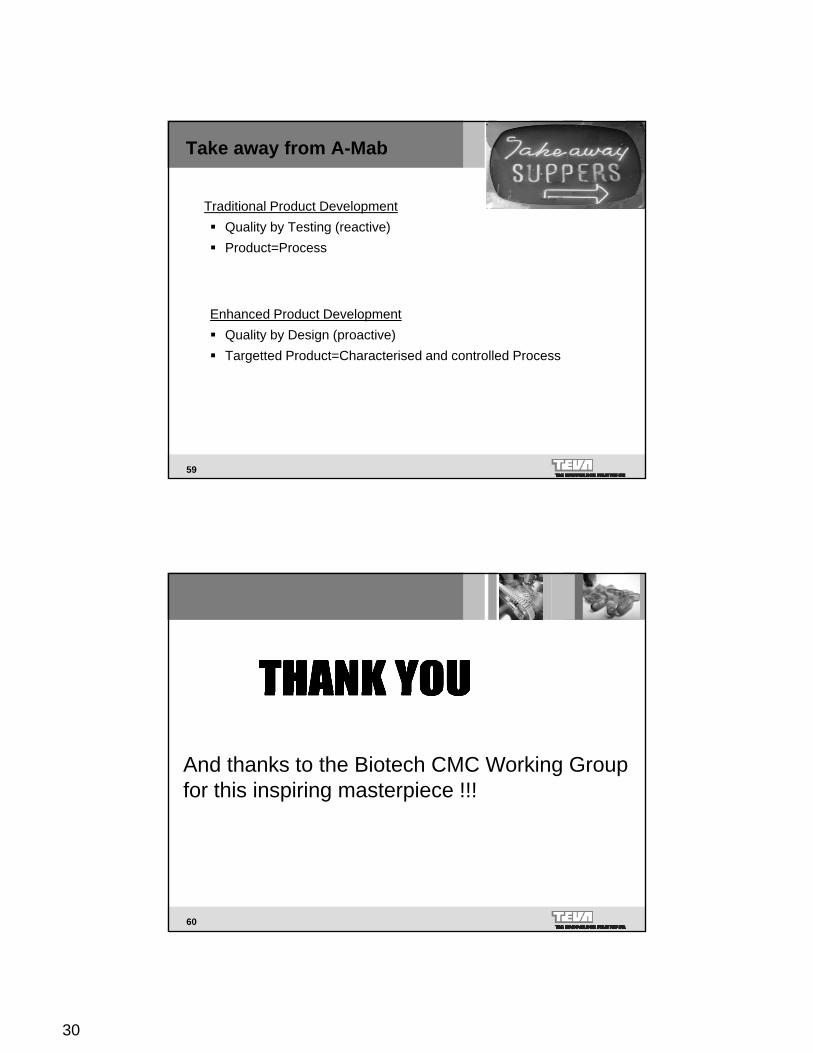
Summary
A-Mab is a document for public consumption and ultimately a backbone for further discussion between industry and agencies across 2009-2010 and beyond
First comprehensive exemplification of a Mock Biotech product developped with QbD principles
Essential in order to overcome “conceptual hurdles” facing those involved in applying QbD
Science based driven all the way
Risk assessment tools used for identification of CQA and categorization of Process parameters
58
of Process parameters
Illustration of a complex Design Space for the Bioreactor production stage and of the innovative Engineering Design Space concept
The Control Strategy provides a high degree of assurance that the product quality specifications are met.
30
Take away from A-Mab
Traditional Product Development
Quality by Testing (reactive)
Product=Process
Enhanced Product Development
Quality by Design (proactive)
Targetted Product=Characterised and controlled Process
59
Targetted Product Characterised and controlled Process
And thanks to the Biotech CMC Working Group for this inspiring masterpiece !!!