A MANUAL OF STANDARDIZED TERMINOLOGY, TECHNIQUES AND SCORING SYSTEM FOR SLEEP STAGES OF HIHMN SUBJECTS HCU 'Mi Wratiu Smnot N Itanlotlul Mmtfn Nwvl O.L OCNITMCVr OF HEALTH, EDUCATION, AND WELFARE
Transcript
A MANUAL OF STANDARDIZED TERMINOLOGY, TECHNIQUES
AND SCORING SYSTEM FOR SLEEP STAGES OF HIHMN SUBJECTS
HCU 'Mi Wratiu Smnot
N Itanlotlul Mmtfn Nwvl
O.L OCNITMCVr OF HEALTH, EDUCATION, AND WELFARE
A MANUAL OF STANDARDIZED TERMINOLOGY, TECHNIQUES
AND SCORING SYSTEM FOR SLEEP STAGES OF HUMAN SUBJECTS
Allan Rechtschaffen and Anthony Kales, Editors
U.S. Department of Health, Education, and Welfare
Public Health Service - National Institutes of Health
National Institute of Neurological Diseases and Blindness
Neurological Information Network
Bethesda, Maryland 20014
1968
BRAIN INFORMATION S HR VICE
The National Institute of Neurological Diseases and Blindness, in an effort
to reinforce and extend means of disseminating findings and concepts in the
basic neurological sciences, recently provided the means for the establishment
of a Brain Information Service at the University of California, Los Angeles,
under Contract DREW PH-43-66-59. It is charged with the task of encouraging
the preparation of authoritative summaries of the state of knowledge in various
aspects of the basic neurological sciences. One method of attaining this end is
to bring together a group of leading investigators in a specific research field
in the hope that out of their discussions some degree of agreement may emerge,
which can then be made known to the scientific public. The present Manual
originated in such a meeting, the planning and conduct of which we owe
principally to Drs. Rechtschaffen and Kales. We wish to acknowledge also
the assistance of Carol Frumkes and Juliette Vance in the arrangement of the
conference and in the preparation of this manuscript.
Victor E. Hall
Professor of Physiology and
Principal. Brain Information
Service
Citation form: Rechtschaffen, A. and Kales, A. (Eds.), Berger, R.J., Dement, W.C., Jacobson, A., Johnson, L.C., Jouvet, M., Monroe, L.J., Oswald, I., Roffwarg, K.P., Roth, B. and Walter, R.D. A .'-kzKual of Standardized demir.olcgu, Zeohr.iques sr:d Scoring Sgszerr. for Sleep Stages of Human Subfeazs. Public Health Service, U.S. Government Printing Office, Washington, D.C., 1968.
National Institutes of Health Publication No. 204
Foreword
The Inaugural Meeting of the Association for the Psychophysiological
Study of Sleep (APSS) was convened in I960 for the purpose of adopting a
standard scoring system for stages of sleep. The opportunity to discuss
experimental results diverted these charter members from their original
purpose and. instead, they decided to meet annually thereafter to communi¬
cate their latest research findings.
The need for a standard scoring system was reemphasized by Monroe's
study (1967) which revealed serious unreliability in the scoring of certain
sleep stages. Concern over this unreliability led to the inclusion of a special session on scoring at the Seventh Annual Meeting of APSS held that year.
Subsequently, an ad hoc committee of investigators was formed under the
auspices of the UCLA Brain Information Service to develop a terminology and
scoring system that might be used universally by sleep researchers. The
Committee members met on several separate occasions and corresponded
extensively in the intervening periods. The Committee was composed of the
following members, all of whom had considerable experience in scoring sleep
records:
Ralph J. Berger, Ph.D., Department of Psychology, Crown College,
University of California, Santa Cruz, California.
William C. Dement, M.D., Department of Psychiatry, Stanford
University School of Medicine, Palo Alto, California.
Allan Jacobson, M.D., Department of Anatomy, University of
California School of Medicine, Los Angeles, California.
Laveme C. Johnson, Ph.D., Navy Medical Neuropsychiatric
Research Unit, U.S. Naval Hospital, San Diego, California.
Lawrence J. Monroe, Ph.D., Department of Psychology, University
of Illinois College of Medicine, Chicago, Illinois.
Ian Oswald, M.D., Department of Psychiatry, University of
Edinburgh, Edinburgh, Scotland.
Allan Rechtschaffcn, Ph.D., Departments of Psychiatry and
Psychology, University of Chicago, Chicago, Illinois.
Howard P. Roffwarg, M.D., Albert Einstein Medical Center,
Montcflore Hospital, The Bronx, New York.
Bed rich Roth, M.D. , Department of Neurology, Charles University
Medical Faculty, Prague, Czechoslovakia.
Richard D. Walter, M.D., Division of Neurology, Department of
Medicine, University of California School of Medicine, Los
Angeles, California.
This proposal was prepared by the Committee with the expectation that
the standardization of recording techniques and scoring criteria would be
widely used and would markedly increase the comparability of results
reported by different investigators. An evaluation of how much such
standardization contributes to reliability of scoring will have to await the
development of experience with the system and empirical testing.
Allan Rechtschaffen and
Anthony Kales, Co-Chairmen
Michel Jouvet, M.D., Laboratoire de Medecine Experimental,
Faculte de Medecine, Lyon, France.
Anthony Kales, M.D., Department of Psychiatry, University of
California School of Medicine, Los Angeles, California.
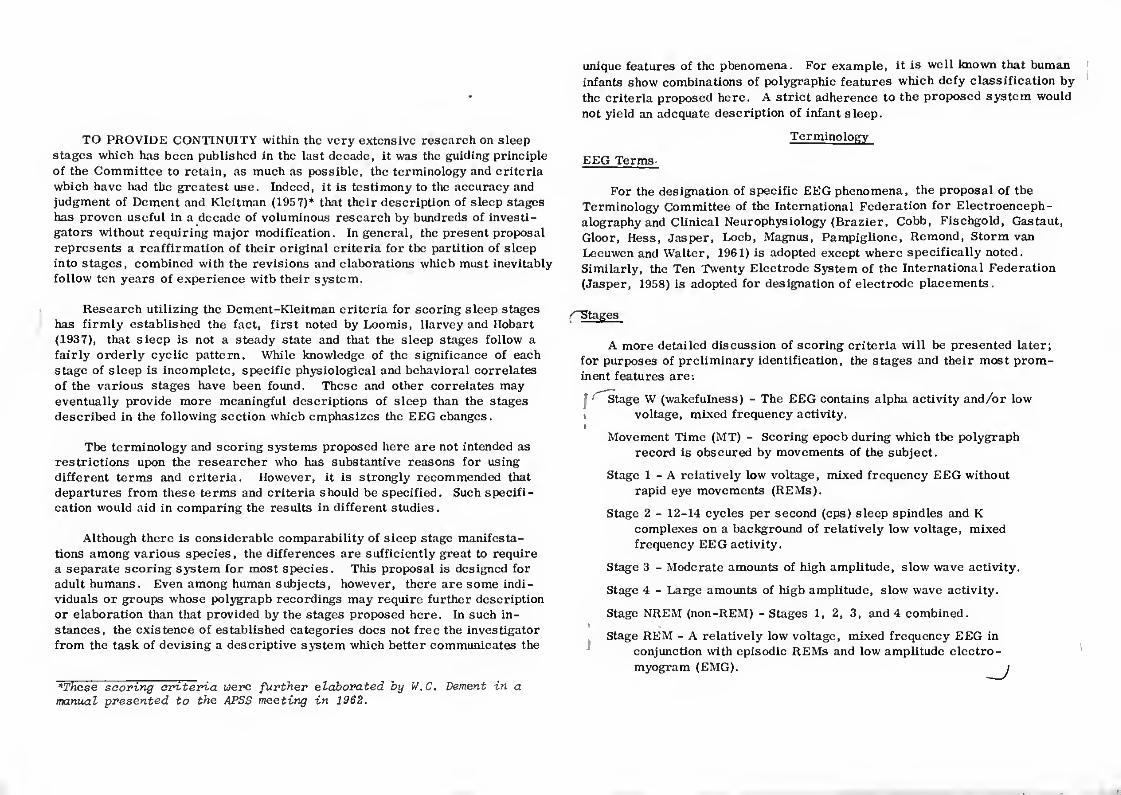
TO PROVIDE CONTINUITY within the very extensive research on sleep
stages which has been published in the last decade, it was the guiding principle
of the Committee to retain, as much as possible, the terminology and criteria
which have had the greatest use. Indeed, it is testimony to the accuracy and
judgment of Dement and Kleitman (1957)* that their description of sleep stages
has proven useful in a decade of voluminous research by hundreds of investi¬
gators without requiring major modification. In general, the present proposal
represents a reaffirmation of their original criteria for the partition of sleep
into stages, combined with the revisions and elaborations which must inevitably
follow ten years of experience with their system.
Research utilizing the Dement-Kleitman criteria for scoring sleep stages
has firmly established the fact, first noted by Loomis, Harvey and Hobart
(1937), that sleep is not a steady state and that the sleep stages follow a
fairly orderly cyclic pattern. While knowledge of the significance of each
stage of sleep is incomplete, specific physiological and behavioral correlates
of the various stages have been found. These and other correlates may
eventually provide more meaningful descriptions of sleep than the stages
described in the following section which emphasizes the EEG changes.
The terminology and scoring systems proposed here are not intended as
restrictions upon the researcher who has substantive reasons for using
different terms and criteria. However, it is strongly recommended that
departures from these terms and criteria should be specified. Such specifi¬
cation would aid in comparing the results in different studies.
Although there is considerable comparability of sleep stage manifesta¬
tions among various species, the differences are sufficiently great to require
a separate scoring system for most species. This proposal is designed for
adult humans. Even among human subjects, however, there are some indi¬
viduals or groups whose polygraph recordings may require further description
or elaboration than that provided by the stages proposed here. In such in¬
stances, the existence of established categories does not free the investigator
from the task of devising a descriptive system which better communicates the
*These scoring criteria were further elaborated by W.C. Dement in a manual presented to the APSS meeting in 1962.
unique features of the phenomena. For example, it is well known that human
infants show combinations of polygraphic features which defy classification by
the criteria proposed here. A strict adherence to the proposed system would
not yield an adequate description of infant sleep.
Terminoloe
EEG Terms
For the designation of specific EEG phenomena, the proposal of the
Terminology Committee of the International Federation for Electroenceph¬
alography and Clinical Neurophysiology (Brazier, Cobb, Fischgold, Gastaut,
Gloor, Hess, Jasper, Loeb, Magnus, Pampiglione, Remond, Storm van
Leeuwen and Walter, 1961) is adopted except where specifically noted.
Similarly, the Ten Twenty Electrode System of the International Federation
(Jasper, 1958) is adopted for designation of electrode placements.
''“Stages
A more detailed discussion of scoring criteria will be presented later;
for purposes of preliminary identification, the stages and their most prom¬
inent features are:
Stage W (wakefulness) - The EEG contains alpha activity and/or low
» voltage, mixed frequency activity. i
Movement Time (MT) - Scoring epoch during which the polygraph
record is obscured by movements of the subject.
Stage 1 - A relatively low voltage, mixed frequency EEG without
rapid eye movements (REMs).
Stage 2 - 12-14 cycles per second (cps) sleep spindles and K
complexes on a background of relatively low voltage, mixed
frequency EEG activity.
Stage 3 - Moderate amounts of high amplitude, slow wave activity.
Stage 4 - Large amounts of high amplitude, slow wave activity.
Although the physiological correlates of behavioral sleep remain a con¬
tinuing research issue, generally, sleep has been polygraphically defined by Stages 1, 2, 3, 4, and REM. The same working definition is used here.
Techniques
As the quality and characteristics of a polygraph tracing depend upon the
techniques used, the designation of criteria for scoring stages of sleep and
wakefulness would be useless without some standardization of technique.
I EEG Recording
A minimum paper speed of 10 mm/sec is recommended as the slowest which will permit clear visual resolution of alpha and sleep spindle frequency.
Time constants shorter than 0.3 sec should not be used. Selective filtering
below 20 cps should be reported. A minimal pen deflection of 7.5-10 mm for
50 microvolts (pV) is recommended; otherwise low amplitude sleep spindles
may escape detection. Electrode resistances should not exceed 10K ohms at
the beginning of the recording.
EEG patterns, and therefore the scoring of stages, may vary according
to placement and derivation. Ideally, a standard array might include a large
number of placements which would yield comprehensive regional information.
However, regional differences are not critical for the scoring of sleep stages,
except insofar as certain critical types of activity, i.e., alpha, vertex
sharp waves, sleep spindles, K complexes, and delta waves are adequately
registered. Further, the wide use of eight channel electroencephalographs
and a desire to maximize data acquisition by running two subjects on each
machine often limits the channels of information from each subject to four.
For reasons to be elaborated in a later section, two eye movement channels
and one EMG channel are considered minimal; EEG information would
accordingly be limited to one channel. It is therefore necessary to specify
the single optimal EEG derivation which can be confidently recommended
for scoring sleep stages unless there are compelling reasons for doing
otherwise.
When EEG information is limited to one derivation, the recommended
derivation is C4/A1 or C3/A2 (Fig. 1). Either the right or left side may be
used, since the EEG patterns from homologous areas are generally synchro¬ nous .
Sleep spindles, K complexes, and vertex sharp waves are clearly
recorded from the C3 or C4 placements, and high voltage slow waves show
maximal or nearly maximal amplitude if the referent maximizes interelec¬
trode distance. Although alpha rhythm is better recorded from occipital
areas, there is adequate registration at C3 or C4 to permit a precise eval¬
uation of sleep onset according to EEG criteria.
The opposite ear or mastoid (Al, A2) is preferred over scalp referents
because the ear or mastoid placement is also used as the recommended
reference for electrodes that record eye movement potentials. In addition,
use of the ear or mastoid reference maximizes interelectrode distance and
avoids mixing activity from two different scalp areas.
The advantages of standardization are obvious. In the collective exper¬
ience of the Committee, sleep stages may be adequately scored using EEG
information obtained from the recommended derivation. If multiple channels
of EEG information can be recorded, and special studies make additional
derivations desirable, the results from the additional placements should be
compared with the results from C3/A2 (or C4/A1) and substantial differences
reported if they exist. There is no problem regarding interlaboratory compa
rability in scoring when multiple EEG channels are available, since C4/A1
(or C3/A2) will always be included in the array. However, when only one
channel is recorded, presumed advantages of other placements must be
carefully weighed against the obvious advantages of a standard EEG technique
3
which maximizes comparability and replicability.* THE EEG CRITERIA
FOR SCORING SLEEP STAGES SHOULD ALWAYS BE BASED ON TRACINGS
OBTAINED FROM C4/A1 OR C3/A2. A schematic illustration of these elec¬ trode placements is given in Fig. 1.
Eye Movement Recording
To eliminate confusion between eye movement potentials and other
signals which resemble them, at least two channels are necessary for re¬
cording eye movements. The recommended procedure is to record on one
channel the potentials from an electrode approximately 1 cm above and
slightly lateral to the outer canthus of one eye and a reference electrode on
either the homolateral ear lobe or mastoid. On the second eye movement
channel are recorded the potentials from an electrode 1 cm below and
slightly lateral to the outer canthus of the other eye referred to the contra¬
lateral ear or mastoid, i.e., both eyes are referred to the same ear or
mastoid electrode. This arrangement is shown in Fig. 1.
Because eye movements in Stage REM and wakefulness are binocularly
synchronous, the suggested arrangement produces out-of-phase deflections
on the two channels for almost all eye movements. Apparatus artifacts
usually register as in-phase deflections or deflections on one channel only;
artifacts from one of the outer canthus electrodes register as deflections on
only one channel; artifacts from the referent electrode register as in-phase
deflections on the two channels. Thus, the out-of-phase deflections produced by eye movements are easily distinguished from artifacts.
The above array for detecting eye movements has some disadvantages. Certain oblique eye movements can result in relatively flat tracings, as when
a potential from the horizontal component of the eye movement is cancelled by an opposite potential from the vertical component. Also, convergent eye
movements generate in-phase deflections with this arrangement. However, both of these situations are of minor importance because abundant out-of¬
phase deflections are usually present at the same time. Further, the above array does not permit any differentiation of horizontal and vertical eye
*Because the standard derivation is so important, it is advisable to prepare the subject with both CS and C4 electrodes and A1 and A2 elec¬ trodes, even though only one pair of these may be recorded. This prior precaution would enable the investigator to change from one electrode pair to another in the event that artifact develops, and thus preserve
movements. Such differentiation can be accomplished with the use of a
supranasion reference, which produces in-phase deflections on the two
recording channels for vertical eye movements. However, these vertical
eye movements could be confused with artifacts. Also, the use of a supra¬
nasion reference could result in the introduction of considerable EEG signal
in the eye movement tracings. These arrays with AC recordings do not
yield precise information about the direction, size and speed of eye move¬
ments, e.g., large pen deflections could result from large horizontal eye
movements or from a summation of the horizontally and vertically induced
potentials in certain smaller oblique eye movements . The recommended
array is intended to provide an economical arrangement to survey eye
movements per se for the scoring of Stage REM. Measurements of the
precise characteristics of these eye movements can only be accomplished
with other techniques.
Where specific information about direction and size of eye movements
is required, a four channel arrangement is suggested where electrodes hori¬
zontal to the outer canthi as well as infraorbital and supraorbital electrodes
are each paired with the same ear or mastoid electrode and accorded a
separate channel. Where specific information about eye position is required,
DC recording must be introduced.
A minimum gain of 7.5 mm for 50 pV is recommended for eye movement
recordings. Because the detection of slow eye movements is helpful in the
analysis of a record, time constants faster than 0.3 sec should not be used.
EMG Recording
The recording of EMG from muscle areas on and beneath the chin
(mental, submental) is strongly recommended because of its importance in
the scoring of Stage REM which will be discussed later.
Because tonic EMG activity during sleep may be at a relatively low level, high gains should be used, preferably 20 pV/cm or higher. A mini¬
mum of high frequency filtering should be used, although at very high gains
it is occasionally necessary to filter out.AC artifacts. Time constants of
a standard record. This "spare" could also be used as a reference electrode for EOG recordings. The use of only a single ear lobe or mastoid reference electrode is suggested in contrast to one clinical practice in which reference electrodes are joined in parallel.
4
0.1 or faster should be used to eliminate slow potentials from other sources,
which at the recommended gains, may cause amplifier blocking. The type of
electrodes, their position and firm contact with the skin are critical factors
in obtaining good EMG recordings. One method is described by Jacobson,
Kales, Lehmann and Hoedemaker (1964). More recently EMG recordings
with very little AC artifact have been obtained from large (1 in. diameter)
flexible lead or stainless steel mesh electrodes which are curved around the
jawbone on both sides of the chin and secured with large strips of adhesive
tape (Rechtschaffen, 1968). See Figs. 1 and 22.
Scoring Criteria
Scoring by Epochs
An epoch-by-epoch approach is strongly recommended in all scoring
procedures. Specifically, a convenient time interval should be selected
which is not so short as to make scoring prohibitively cumbersome, nor so
long as to do violence to the scoring of short-lived stage changes. A con¬
venient interval for most investigators would be one page of record, which
is 300 mm in the most commonly used paper sizes. This interval would
result in epoch durations of 30 and 20 sec respectively for the recommended paper speeds of 10 and 15 mm/sec. Because the use of much longer epochs
could produce a bias against the scoring of short-lived stage changes, it is
suggested that, when epoch lengths greater than 30 sec are used, the investi¬
gator report them specifically.
The epoch-by-epoch approach recommended here does not imply that each
epoch is considered in isolation. There are many instances, which will be
discussed in later sections, where the score assigned to a particular epoch
depends in part on the polygraphic features of preceding and succeeding
epochs. The main features of the epoch system recommended here are that the polygraph record is divided into consecutive segments of equal size and
each segment is assigned a single score. Once an epoch duration is selected
it should be maintained for the duration of the recording. For example, if a
30 sec epoch is selected, the chart is divided into consecutive 30 sec periods
from the start of the recording to the end. Each epoch is assigned a single
stage score; portions of two epochs may not be combined to create a new
epoch. Where more than one stage is present in an epoch, the one which
takes up the greatest portion of the epoch should be scored as the stage of
that epoch.
Stage W
Stage W corresponds to the waking state. It is characterized by alpha
activity and/or a low voltage, mixed frequency EEG.
Certain subjects (alpha producers) may have a virtually continuous
alpha record; other subjects may show little or no alpha activity in the
waking record. This stage is usually, but not necessarily, accompanied
by a relatively high tonic EMG, and often REMs and eye blinks are present
in the EOG tracing.
Movement Time (MT), Body Movements, and Movement Arousal
The score "MT" is assigned to epochs which immediately precede or
follow sleep stages, but in which the EEG and EOG tracings are obscured
in more than half the epoch by muscle tension and/or amplifier blocking
artifacts associated with movement of the subject. Where the EEG and EOG
record can be seen in more than half the epoch in spite of the artifacts, the
record is scored according to the prevailing EEG and EOG pattern. MT is
not counted with either sleep or wake time but scored as a separate category
unless the investigator specifies otherwise. Not enough is known about the
behavioral correlates of MT to classify it unambiguously as either sleep or
wakefulness. Where an epoch is obscured by muscle tension and/or ampli¬
fier blocking artifacts but is immediately preceded and followed by Stage W,
the epoch is scored Stage W rather than MT.
MT should not be confused with the scoring of discrete body movements
which may be of relatively short duration. Body movements can be detected
by so many devices, and they can be defined in such a large variety of ways
according to the investigator's interest, that it is left to each investigator to
designate his own criteria (e.g., Rechtschaffen, Wolpert, Dement, Mitchell
and Fisher, 1963). Body movements are not to be considered epoch scores
in the same sense as MT. Body movements should be considered specific
physiological events which can occur during MT or during stages.
Both MT and body movements are to be distinguished from movement
arousals. which will assume some importance in the scoring of stages to be
discussed later. A movement arousal will be defined as any increase in
EMG on any channel, which is accompanied by a change in pattern on any
additional channel. For EMG channels, the change in pattern may consist
of either an increase in amplitude of the EMG signal or an amplifier blocking
5
artifact. For EOG channels, the change of pattern may consist of either the
occurrence of EMG activity, amplifier blocking artifacts, or blink artifacts.
For EEG channels, the change of pattern may consist of either a decrease
in amplitude, an increase in alpha activity, a paroxysmal burst of high volt¬
age activity, the presence of EMG activity, or amplifier blocking artifacts.
Movement arousals are not used as epoch scores, nor need they be tallied
and reported. The major purpose in defining movement arousal is to aid in
the scoring of stages by signalling the possibility of stage changes. For
example, the interpretation of a short interval of relatively low voltage,
mixed frequency EEG which follows Stage 2 will depend on whether the
interval follows a movement arousal. Where there is a movement arousal,
there is greater confidence that the subsequent interval represents a partial
"arousal" to Stage 1 rather than a simple transient lapse of spindles.
In summary, a score of MT is used to account for epochs which are
mostly obscured by movement artifacts. Body movements are not con¬
sidered epoch scores; they are considered discrete physiological events
which occur during epochs. The criteria for defining body movements are
left entirely to the individual investigator. Movement arousal, which is
explicitly defined in this proposal, is not used as an epoch score as is MT,
nor is it intended primarily as a measure of body displacement as is body
movement. Movement arousal is intended primarily as an aid in the
scoring of stages inasmuch as an increase in muscle activity during sleep
raises the possibility that the continuity of the prevailing sleep stage has
been disturbed in some way.
Because MT involves more than half an epoch of movement artifact,
and hence relatively large movements in most cases, the criteria for
scoring MT will usually satisfy the criteria for body movements and
*The term "relatively low voltage, mixed frequency EEG" is preferred over other terms previously used to describe the EEG pattern which is characteristic of Stage 1 and Stage REM. The term "Stage 1 EEG" is to be avoided, because the pattern also occurs in Stage REM and it could cause confusion to speak about "a Stage 1 EEG in Stage REM". The term "low voltage record" should not be used, because it does not accurately describe the EEG of Stage 1 or REM. According to the term¬ inology of the International Federation, this term denotes a record with "No rhythmic activity above 10 \iV, no activity above 20 \iV". Many of the vertex sharp waves of Stage 1 and many of the saw-tooth waves of Stage REM exceed 20 yy.
movement arousals. Similarly, the criteria for body movements will usually
satisfy the rather minimal requirements for movement arousal. However,
the converse of these statements need not be true. Body movements may be
of relatively short duration and fall far short of the criteria for MT. Move¬
ment arousal need indicate only some increase in muscle activity and does
not necessarily involve the substantial spatial displacement of the body which
is implied by body movement. Movement arousal could result from an
isolated small muscle contraction, a vigorous blink, or a facial grimace.
| Stage 1
Stage 1 is defined by a relatively low voltage, mixed frequency EEG
with a prominence of activity in the 2-7 cps range.* The faster frequencies
are mostly of lower voltage than the 2-7 cps activity. Stage 1 occurs most
often in the transition from wakefulness to the other sleep stages or follow¬
ing body movements during sleep. During nocturnal sleep, Stage 1 tends to
be relatively short, ranging from about 1 to 7 min. The highest voltage 2-7
cps activity (about 50-75 yV) tends to occur in irregularly spaced bursts
mostly during the latter portions of the stage. Also during the latter portions of the stage, vertex sharp waves may appear, often in conjunction with the
high amplitude 2-7 cps activity. The amplitude of the vertex sharp wave is
occasionally as high as 200 yV. Scoring of Stage 1 requires an absolute
absence of clearly defined K complexes and sleep spindles. Traces of low
voltage activity at 12-14 cps may begin to appear as the transition to Stage
2 approaches, but this activity is not to be defined as sleep spindles until the
rhythmic bursts are clearly visible for at least 0.5 sec, at which time they
define the presence of Stage 2 (see below). Stage 1, especially following
wakefulness, is characterized by the presence of slow eye movements, each
of several seconds duration, which are usually most prominent during the
The term "low voltage fast record" is rejected, not only because it is rejected by the International Federation, but also because the EEG of Stages 1 and REM contains a considerable amount of activity in the 2-7 cps band. The most popular term heretofore used to describe the EEG of Stages 1 and REM has been "low voltage, random". This term is now rejected because, according to the terminology of the International Federation, "random" means "recurring at inconstant time intervals", rather than denoting a mixture of frequencies.
6
early portions of the stage. Rapid eye movements are absent. Tonic EMG
levels are usually below those of relaxed wakefulness.1
The transition from a low voltage waking record to Stage 1 is charac¬
terized by a generalized slowing of the EEG. The transition from an alpha
record to Stage 1 is characterized by a decrease in the amount, amplitude,
and frequency of alpha activity. When the amount of record characterized
by alpha activity combined with low voltage activity drops to less than 50%
of the epoch and is replaced by relatively low voltage, mixed frequency
activity, the epoch is scored as Stage 1.
Stage 2
This stage is defined by the presence of sleep spindles and/or K com¬
plexes and the absence of sufficient high amplitude, slow activity to define
the presence of Stages 3 and 4 (see below).
The presence of a sleep spindle should not be defined unless it is of at
least 0.5 sec duration, i.e., one should be able to count 6 or 7 distinct
waves within the half-second period.2
K complexes are defined as EEG wave forms having a well delineated
negative sharp wave which is immediately followed by a positive component.
The total duration of the complex should exceed 0.5 sec. Waves of 12-14
cps may or may not constitute a part of the complex. 3 The K complex is
generally maximal over vertex regions. K complexes can occur as a res¬
ponse to sudden stimuli, but they also frequently occur in the absence of any
detectable stimuli (Johnson and Karpam, 1968). Other polyphasic high
*For a more detailed, differentiated description of EEG changes in the transition from wakefulness to sleep, the reader is referred to Roth (1961).
2 Because the term "sleep spindles" has been widely used in sleep
research, this term will be retained. The term should be used only to describe activity between 12 and 14 cps.
3 This definition of K complex is at variance with the definition of the Terminology Committee of the International Federation which is as follows: "Combination of vertex sharp waves and sigma paroxysm, occurring spontaneously and especially in response to sudden stimuli during sleep. "
voltage slow waves occurring paroxysmally which do not have the precise
morphology of the K complex are also frequently seen during Stage 2.
Because sleep spindles and K complexes are transient phenomena,
relatively long periods may intervene between these events without the
occurrence of a stage change. If less than 3 min of record which would
ordinarily meet the requirements for Stage 1 intervene between sleep
spindles and/or K complexes, these intervening epochs are to be scored
Stage 2 if there is no indication of movement arousal or pronounced increase
in muscle tone during the interval in question. 4 If the interval without sleep
spindles or K complexes lasts 3 min or longer, the interval is scored as
Stage 1, even if it contains no movement arousal. If movement arousals or
increases in muscle tone do occur during the interval in question, the por¬
tion of the record prior to them should be scored as Stage 2. The portion
of the record which follows should be scored as Stage 1 until the next sleep
spindle or K complex occurs, provided, of course, that the epoch require¬
ments and criteria for Stage 1 are otherwise met.
Stage 3
Stage 3 is defined by an EEG record in which at least 20% but not more
than 50% of the epoch consists of waves of 2 cps or slower which have amp¬
litudes greater than 75 yV from peak to peak (the difference between the most negative and positive points of the wave). The figures "20%" and "50%M
refer specifically to the time occupied by the high amplitude, slow waves and
do not include intervals of higher frequency and lower amplitude activity between these waves.5 In actual scoring practice, it will be necessary to
make wave by wave measurements only for epochs with borderline amounts
The selection of a 3 min interval was arbitrary. It was based upon our judgment that inter-spindle intervals of that length might occur without a stage change although such occasions would be rare.
^In determining the percentage of an epoch which contains waves of 0.5 sec or slower and greater than 75 \xV, a certain amount of un¬ reliability will be introduced because it is sometimes difficult to define a wave by visual inspection. For example, it is not always clear whether two contiguous potentials of the same polarity repre¬ sent a single slow wave with a small wave of opposite polarity superimposed, or whether they represent two separate faster waves. To estimate the unreliability introduced by such amgibuities, three members of the Committee scored 28 selected epochs of 30 sec
7
of high amplitude, slow wave activity, i.e., about 20% and 50%. For most
epochs, judgments about Stages 3 and 4 can be made by comparison with the
tracings shown in Figs. 2-5. Figs. 2 and 4 present EEG tracings which are
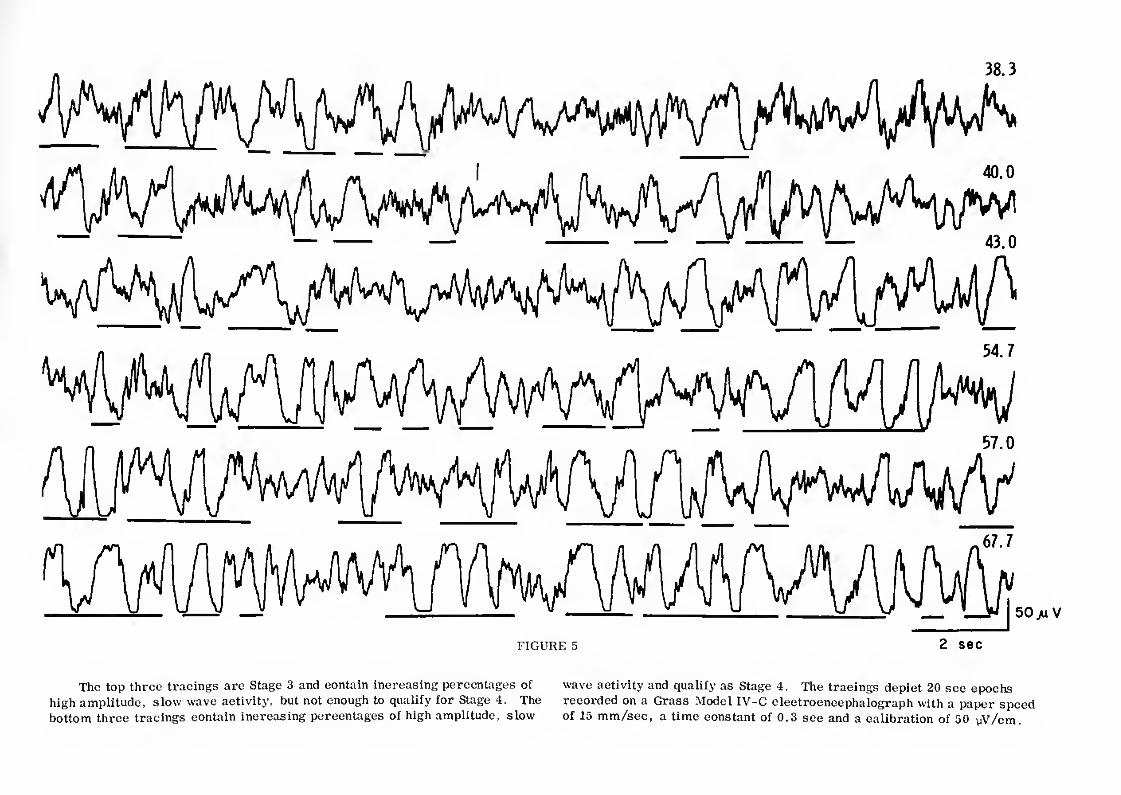
just below and just above the threshold for differentiating Stages 2 and 3.
Figs. 3 and 5 present EEG tracings which are just below and just above the threshold for differentiating Stages 3 and 4.
As noted in the original Dement-Kleitman criteria, an attempt should be
made to distinguish between spontaneous K complexes and delta waves, al¬
though this distinction is not always easy. Sleep spindles may or may not be present in Stage 3.
Stage 4
Stage 4 is defined by an EEG record in which more than 50% of the epoch
consists of waves of 2 cps or slower which have amplitudes greater than 75
Footnote _continued_from page 6_
duration each for a percentage of the epoch which contained "acceptable" slow waves. In the test sample used, these percentages ranged from about 35% to 80%j about two-thirds of the epochs fell in the narrower range between 40% and 60%, i.e., the range in which reliable differen¬ tiation of Stages 3 and 4 is most difficult. The rank order correlations between pairs of scorers on amount of high amplitude slow activity were .94, .94, and .91. Apparently, the ambiguities involved in the measure¬ ment of EEG waves are not so great or prevalent as to interfere with reliable scoring of the amount of an epoch which contains the specified slow wave activity. The above reliability coefficients, however, should not be confused with the reliability of scoring Stages 3 and 4. In actual practice, a failure to score wave by wave in doubtful cases could result in lower reliabilities for stage scoring. On the other hand, actual records of continuous sleep may not be so heavily biased as the test samples with epochs of about 50% "acceptable" slow wave activity, and the reliability of scoring Stages 3 and 4 could be higher than the coefficients cited above, depending on the care and precision of the scorers.
*There was considerable discussion in the Committee about the wisdom of applying an amplitude criterion in addition to a frequency criterion for the scoring of Stages 3 and 4. Amplitude is influenced by several variables apart from cerebral activity. These include: electrode resistance, time constants, electrode placement, and interelectrode
UV peak to peak. Although only slightly more than half of an epoch may
actually contain high amplitude, slow waves which meet the above specifi¬
cations, most Stage 4 epochs have the appearance of being completely
dominated by this activity. Intervals of lower amplitude, faster activity
rarely persist for more than a few seconds in Stage 4, but are usually prom¬
inent in Stage 3 epochs.
Sleep spindles may or may not be present in Stage 4.*
Stage REM
Stage REM is defined by the concomitant appearance of relatively low
voltage, mixed frequency EEG activity and episodic REMs. The EEG pattern
resembles the one described for Stage 1, except that vertex sharp waves
are not prominent in Stage REM. Also, in Stage REM distinctive "saw¬
tooth" waves (Berger, Olley and Oswald, 1S62) frequently, but not always,
distance. The variance introduced in the amount of Stages 3 and 4 by these factors will be minimized by standardization.
Other potential determinants of EEG amplitude such as skin resistance and individual differences in slow wave foci are difficult to evaluate. However, some implicit amplitude criteria are always involved in the visual discrimination of specific EEG activity. When the wave form is complex and highly characteristic, as in the sleep spindle, amplitude per se contributes little to the detection process, i.e., signal to novse ratio. In the case of slow wave activity where wave form is secondary, the major factor for easy detection, aside from frequency, is amplitude. Thus, for purposes of scoring and particularly for reliability of scoring, detection and rating of slow wave activity must require an explicit amplitude criterion. Therefore, the question of specifying the precise scoring parameters of Stages 3 and 4 is the major problem, and a number of factors entered into the decision of the Committee.
With regard to the amplitude criterion, there was no question that, al¬ though the results of measures of slow wave activity which stress the amplitude parameter and those which minimize it are highly correlated, there are some differences which made a choice more than academic.
The following summarizes the reasoning of the Committee ’s choice to utilize a relatively high amplitude criterion for delta activity in the scoring of Stages 3 and 4.
8
appear in vertex and frontal regions in conjunction with bursts of REM.
Alpha activity is usually somewhat more prominent during Stage REM than
during Stage 1, and the frequency is generally 1-2 cps slower than during
wakefulness (Johnson, Nute, Austin and Lubin, 1967). As with the EEG of
Stage 1, there is an absolute absence of sleep spindles and K complexes.
Stage REM should not be scored in the presence of a relatively elevated
tonic mental-submental EMG (Berger, 1961; Jacobson, Kales, Lehmann and
Hoedemaker, 1964). The term "relatively elevated" requires explanation.
At the high gains used for EMG recording during sleep, using surface elec¬
trodes it is difficult to define the absence of tonic EMG activity; even when
the EMG tracing is of very low amplitude, there is almost always some
residual fast activity which could represent either EMG activity or noise.
Neither is it possible to define absolute EMG amplitude in a useful way,
because amplitude varies considerably from subject to subject and with
electrode position. However, for any given recording session with any
given subject, tonic EMG will show considerable variation about which it
is useful to make some relative statements. Specifically, during Stage
REM the tonic mental-submental EMG tracing is not higher than the level
during the preceding sleep stage. It almost always reaches its lowest
levels during Stage REM. These low' levels may or may not be reached
during the other sleep stages, but they are reached during unambiguous
REM periods. Therefore, a low amplitude EMG contributes little to the
scoring of sleep stages, but the presence of a "relatively elevated*' tonic
EMG contributes to scoring information by precluding the scoring of Stage
REM. There are infrequent occasions during Stage REM, especially in
association with vigorous bursts of REMs, when the EMG tracing may show
a slight transient increase in tonic activity or bursts of phasic activity for
^oo^o^e_aon^inued_from_ page 7_
a) Although some extra-cerebral determinants of amplitude stand as potential sources of variance in measures which emphasize amplitude9 as abundant research has showny this variance is not so great as to preclude relationships between such measures and other empirical variables.
b) A large majority of the Committee felt that the sleep EEG would not be adequately described by a scoring system which did not attend to the marked amplitude variations which are one of its most prominent features.
c) Most published EEG sleep research has utilized an amplitude criterion in the scoring of Stages 3 and 4; retention of such a criterion provides some continuity with this research.
several seconds. For purposes of stage scoring, these transient changes
may be disregarded.
Mixtures of Stage REM and sleep spindles
There are occasions, mostly during the first REM period of the night,
when sleep spindles are interspersed with REMs and the EMG remains at
the Stage REM level throughout. The scoring in these situations is based
upon the following two principles.
1. Any section of record contiguous with Stage REM in which the
EEG shows relatively low voltage, mixed frequency is scored
Stage REM regardless of whether REMs are present, providing
EMG is at the Stage REM level and there are no intervening
movement arousals. (Situations which involve movement
arousals will be discussed later.)
2. An interval of relatively low voltage, mixed frequency EEG
record between two sleep spindles or K complexes is con¬
sidered Stage 2 regardless of EMG level, if there are no
REMs or movement arousals during the interval and if the
interval is less than 3 min long. (This is simply a reitera¬
tion of the rules for scoring Stage 2.)
Examples of application of these rules are given below and illustrated
schematically in Fig. 6. The letter designations of the illustrations corres¬
pond to the letter designations of the text.
A. A single sleep spindle* occurs in an epoch during which EMG
is at the Stage REM level. The preceding and succeeding
Nevertheless, it is recognized that measures of slow wave activity which minimize amplitude might yield the same empirical relationships as the measure chosen by the Committee. Alsoy it is possible that alternative measures of slow wave activity might have a usefulness and empirical significance not enjoyed by the measure chosen. Thereforey the selection of the Committee should not deter investigators from using measures of slow wave activity other than the one suggested here. Howevery it is recommended that departures from the criteria specified here be reported in detail.
*K complexes can be substituted for sleep spindles in all of these illustrations.
9
epochs are Stage REM and contain no sleep spindles. The epoch
containing the sleep spindle is scored Stage REM because all of
the epoch preceding and following the sleep spindle is considered Stage REM under rule #1 above.
B. In a 30 sec epoch, sleep spindles occur at the 10th and 20th
seconds. The preceding and succeeding epochs were Stage REM.
The first and last 10 sec of the epoch containing the sleep
spindles are considered Stage REM under rule #1. The middle
10 sec is considered Stage 2 under rule #2. Because two-thirds
(more than half) of the epoch is Stage REM, the epoch is scored
as Stage REM (Fig. 6, illustration Bj). If, in the above situation,
the sleep spindles had occurred at the 5th and 25th seconds, then
two-thirds of the epoch would be considered Stage 2, and the
epoch would be scored Stage 2 (Fig. 6, illustration B ). (L
C. There are three successive epochs during which the EMG is at
the Stage REM level; except for the sleep spindles to be noted
below, the EEG is relatively low voltage, mixed frequency.
REMs occur during the first 5 sec of the first epoch and during
the last 5 sec of the third epoch. Sleep spindles occur at the
20th sec of the first epoch and during the 20th sec of the third
epoch. There are no REMs or sleep spindles in the middle
epoch.
The first epoch is scored Stage REM because the first 20 sec of the epoch, i.e., until the sleep spindle, is con¬
sidered Stage REM under rule #1.
The middle epoch is scored Stage 2, even though it
contains no sleep spindles, because under rule #2 all of
the record between the two sleep spindles is considered
Stage 2.
The third epoch is scored Stage 2 because the first
20 sec of the epoch is considered Stage 2 under rule #2.
Start and End of Stage REM
The major problem in scoring Stage REM is the determination of the
precise points at which REM periods begin and end. This problem arises
primarily from the fact that three indicators, EEG, EOG, and EMG activity,
which are used to define Stage REM may or may not change simultaneously.
To aid in the determination of Stage REM onset and termination in instances
where the three indicators do not change simultaneously, the following
scoring problems are presented together with the scoring recommendations.
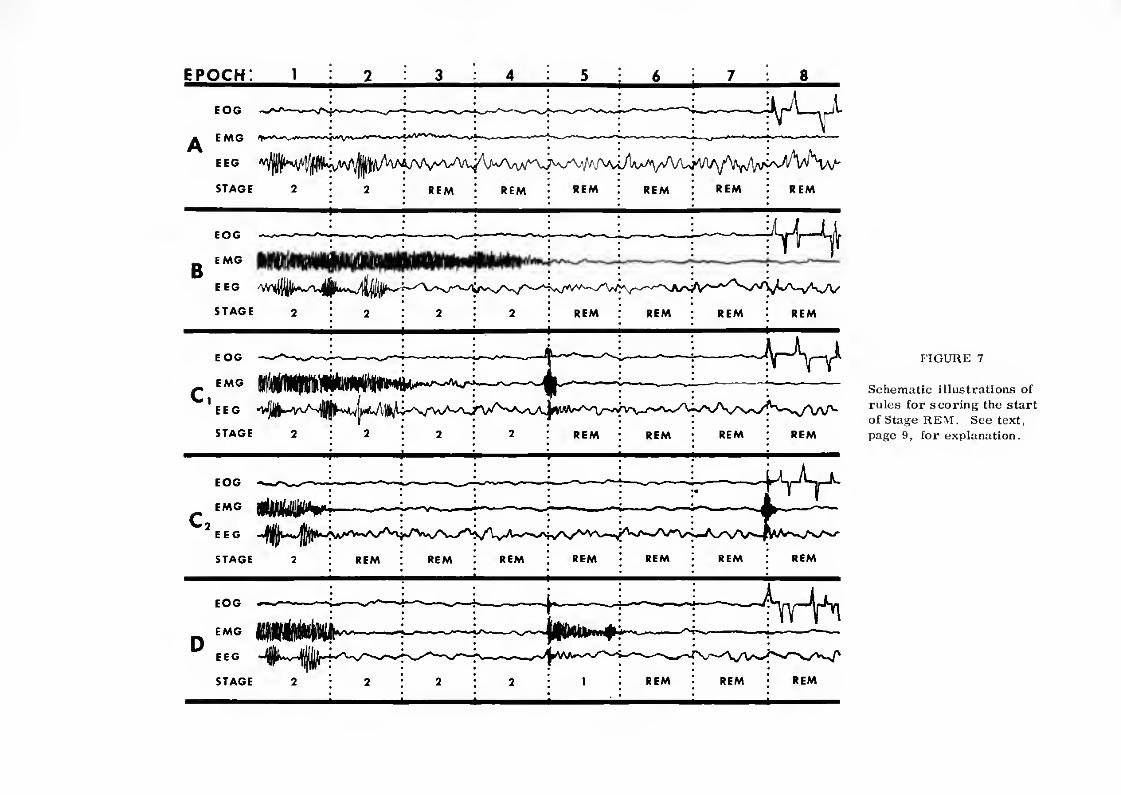
1. Start of Stage REM
Schematic illustrations of the rules for starting Stage REM
are presented in Fig. 7. The letter designations of the illustra¬
tions correspond to the letter designations of the text below.
A. Sleep spindles and K complexes stop and the EEG changes
to relatively low voltage, mixed frequency for one or more
epochs before REMs start. Score all the record from the
last sleep spindle or K complex as Stage REM if the EMG
during the epochs before REMs is at the same level as
after REMs and if there has been no intervening move¬
ment arousal. Score the record up to the last sleep
spindle or K complex as Stage 2 irrespective of EMG
level. In rare instances where there is a progression
from Stage 3 or 4 to Stage REM, a parallel rule applies,
except that slow wave activity is substituted for sleep
spindles and K complexes.
B. Sleep spindles and K complexes stop and the EEG changes to relatively low voltage, mixed frequency for an interval
of one or more epochs before REMs start; EMG remains
at a relatively high level for some portion of this interval
before it drops to the Stage REM level. Score Stage REM
from the point where the EMG amplitude dropped, providing
REMs occur before any additional sleep spindles or K complexes appear. The portion of the record following
the last sleep spindle or K complex and prior to the EMG
drop is considered as part of the preceding stage (usually
Stage 2) unless it is 3 min or longer, in which case it is scored Stage 1.
C. Sleep spindles and K complexes stop and the EEG changes
to relatively low voltage, mixed frequency for one or more epochs before REMs start; during these epochs there is a
movement arousal. Score Stage REM at the point following
the movement arousal at which the EMG tracing is reduced
to the Stage REM level providing there is no indication of
a change to Stage 1 (see discussion under End of Stage
REM, section C, page 11). If the interval between the
cessation of sleep spindles and K complexes and the
movement arousal is less than 3 min, it is scored
Stage 2 (Fig. 7, illustration C^). If the interval is 3
min or longer, it is scored Stage REM (Fig. 7, illus¬
tration C ).
D. Sleep spindles and K complexes stop and the EEG changes
to relatively low voltage, mixed frequency for an interval
of one or more epochs before REMs start. During this
interval, there is a movement arousal, and tonic EMG
remains elevated for one or more epochs following the
movement arousal before dropping to Stage REM level.
Score Stage 1 for those epochs following the movement
arousal during which EMG is relatively elevated. Score
Stage REM when the EMG drops to the Stage REM level
following the movement arousal. The epochs of relatively low voltage, mixed frequency EEG which precede the
movement arousal are scored Stage 2 or Stage REM
according to the 3 min rule cited under MC" (above).
End of Stage REM
Schematic illustrations of the rules for ending Stage REM
are presented in Fig. 8. The letter designations of the illustra¬ tions correspond to the letter designations of the text below.
A. A period of relatively low voltage, mixed frequency
EEG, but without eye movements follows contiguously
from an unambiguous Stage REM. Score as Stage
REM, regardless of duration, providing the EMG
tracing remains at the Stage REM level and there are
no intervening sleep spindles, K complexes, or move¬
ment arousals.
B. An interval of relatively low voltage, mixed frequency
EEG, but without REMs, follows contiguously (no
intervening sleep spindles, K complexes, or movement
arousals) from an unambiguous State REM. Tonic EMG
is initially at the Stage REM level but becomes elevated
later in the interval. Score Stage REM up to the point of
EMG augmentation. Score Stage 1 from the point of EMG
augmentation until there is some subsequent indication of
a stage change, which is usually either a resumption of
REMs (Fig. 8, illustration or the occurrence of sleep
spindles and/or K complexes (Fig. 8, illustration B^).
C. A special case frequently arises where a movement arousal
interrupts the continuity of Stage REM, the mental-submental
EMG quickly reverts to the Stage REM level following the
movement arousal, the EEG remains relatively low voltage,
mixed frequency, and there is a resumption of REMs or
change to Stage 2 one or more epochs following the move¬
ment arousal. The problem is whether to score the
interval following the movement arousal and the resumption
of REMs or change to Stage 2 as Stage 1 or Stage REM.
There is argument for Stage 1 inasmuch as a change to a relatively low voltage, mixed frequency pattern regularly
follows many movement arousals which interrupt Stages 2, 3, and 4; there is no reason to assume that interruptions
of Stage REM would be immune to such changes to Stage 1.
On the other hand, the general principle remains that a
relatively low voltage, mixed frequency EEG contiguous
with Stage REM is to be scored as Stage REM. Although
the decision is difficult, there are differences between
Stage 1 and Stage REM, apart from the presence or ab¬
sence of REMs, which can be used to make a discrimination
between the two. The Committee thought it best to list
general guidelines for distinguishing between Stage 1 and
Stage REM and leave it to the scorer to apply these guide¬
lines judgmentally.
In general, the scoring of Stage 1 is favored in
proportion to the size and duration of the movement
arousal. This is based on the fact that, when movement
arousals interrupt other stages, the duration of the
post-movement Stage 1 is generally proportional to the magnitude of the movement.
A most important indication of Stage 1 is the
presence of slow eye movements . Although slow
eye movements are sometimes present during Stage
End of Stage REM
C. (Continued)
REM, they do not approach the abundance, magnitude,
and pendular pattern of the slow eye movements during
Stage 1. As long as there are prominent slow eye
movements following the movement arousal, the investi¬
gator can feel confident about scoring Stage 1.
Although the EEG of Stage 1 and Stage REM are
very similar, there are some differences which may
be usefully noted. Stage 1 scoring is favored in pro¬
portion to the amount of alpha activity immediately
following the movement arousal; this guide is in accord
with a general conception of the post-movement Stage
1 as a transition back to unambiguous sleep following a
change in state which approached wakefulness. The
presence of well formed vertex spikes favors the
scoring of Stage 1, whereas the appearance of well
formed saw-tooth waves indicates Stage REM.
Incipient signs of sleep spindles and K complexes
may also be useful in making the difficult discrimina¬
tion between Stage 1 and Stage REM following movement
arousals. The point here is best indicated by consider¬
ing the typical transition from Stage 1 to Stage 2 at the
beginning of sleep. Just before well formed sleep
spindles and K complexes appear in the record, one
can usually detect incipient signs of this activity. For
example, there may be traces of very low voltage 12-14
cps activity scattered in the record which do not persist
for the full half second required to meet the definition
of a sleep spindle; there may be wave forms which begin
to approach the morphology of the K complex, but do not
fulfill the requirement. When such "incipient" sleep
spindles and K complexes appear in a relatively low
voltage, mixed frequency record which follows a Stage
REM interrupting movement arousal, they may be taken
as supporting evidence that the interval between the
arousal and the incipient sign has been Stage 1.
If the epoch following the arousal is scored as
Stage 1 then the remainder of the record is scored
as Stage 1 until the reappearance of RE Ms (Fig. 8,
illustration C ) or until the appearance of the first
sleep spindle or K complex (Fig. 8, illustration C2)
D. Given the above situation, but without any or with only
very minimal signs of Stage 1 following the movement
Jacobson, A., Kales, A., Lehmann, D., and Hoedemaker, F.S. Muscle
tonus in human subjects during sleep and dreaming. Exp, Neurol.,
10: 418-424, 1964.
Jasper, H. H. (Committee Chairman). The ten twenty electrode system of
the International Federation. Electroenceph. clin. Neurophysiol.,
10: 371-375, 1958.
Johnson, L.C. and Karpam, W. E. Autonomic correlates of the spontaneous K-complex. Psychophysiol., 4: 386, 1968. (Abstract. Article in press.)
Johnson, L.C., Nute, C., Austin, M.T. and Lubin, A. Spectral analysis of
the EEG during waking and sleeping. Electroenceph. clin. Neuro-
physiol., 23: 80, 1967.
Loomis, A.L., Harvey, E.N., and Hobart, G.A. Cerebral states during
sleep as studied by human brain potentials. J. Exp. Psychol.,
21: 127-144. 1937.
Monroe, L.J. Inter-rater reliability of scoring EEG sleep records . Paper
read at the Association for Psychophysiological Study of Sleep
Meeting, Santa Monica, California, April, 1967. Abstract in
Psychophysiol. , 4:370-371, 1968.
Rechtschaffen, A. Personal communication, 1968.
Rechtschaffen, A., Hauri, P., and Zeitlin, M. Auditory awakening thres -
holds in REM and NREM sleep stages . Percept. Motor Skills, 22:
927-942, 1966.
Rechtschaffen, A., Wolpert, E.A., Dement, W. C., Mitchell, S.A., and
Fisher, C. Nocturnal sleep of narcoleptics. Electroenceph.
clin. Neurophysiol., 15: 599-609, 1963.
Roth, B. The clinical and theoretical importance of EEG rhythms
corresponding to states of lowered vigilance. Electroenceph.
clin. Neurophysiol. , 13: 395-399, 1961.
ILLUSTRATIONS
FIGURE 1. Placement of EEG, EMG and EOG electrodes.
FIGURE 2. Comparison of EEG tracings in Stages 2 and 3.
FIGURE 3. Comparison of EEG tracings in Stages 3 and 4.
FIGURE 4. Comparison of EEG tracings in Stages 2 and 3.
FIGURE 5. Comparison of EEG tracings in Stages 3 and 4.
FIGURE 6. Schematic illustrations of rules for scoring Stage
REM mixed with sleep spindles.
FIGURE 7. Schematic illustrations of rules for scoring the
start of Stage REM.
FIGURE 8. Schematic illustrations of rules for scoring the
end of Stage REM.
FIGURES 9-22. Epochs from various stages of a 19 year old, normal,
male subject.
FIGURES 23-32. Epochs from various stages of a 21 year old, normal,
male subject.
FIGURES 33-40. Epochs from various stages of a 25 year old, normal,
male subject.
\i ci V) c4 iA1
FIGURE 1
Upper drawing illustrates the placement of El, E2, Al, and A2 electrodes stages. (See text, pages 2-4). This epoch illustrates the onset of Stage
for detection of eye movements and also shows two methods for recording tonic REM. Note relatively low voltage mixed frequency EEG, REMs and EMG from mental and submental muscle areas. Lower drawing illustrates the sharp decrease in the tonic EMG.
placement of C3, C4, Al, and A2 electrodes for EEG recording of sleep
I sec
FIGURE 2
Comparison of EEG tracings (C3, A2 derivations) in Stages 2 and 3.
Tracings from different portions of a sleep record were selected as an aid
in the discrimination of the two stages. The four tracings on this page are
Stage 2. They were deliberately selected because the percentage of high
amplitude, slow wave activity was almost, but not quite enough, to qualify
as Stage 3. The percentage of acceptable, high amplitude, slow wave activity in each tracing is listed on the right hand side of the recordings.
21.3
FIGURE 2 (Continued)
The four tracings on this page were selected because they show just enough high amplitude, slow wave activity, i.e., 2 cps or slower and greater
high amplitude, slow wave activity to qualify for Stage 3. In borderline than 75 UV peak to peak. These illustrations depict 30 sec epochs recorded
instances where there is a question of whether to score Stage 2 or Stage 3, on a Beckman Type R Dynograph with a paper speed of 10 mm/sec, a time
a comparison of the record in question with these tracings may facilitate a constant of 0.3 sec and a calibration of 50 yV/cm. (For Figs. 2-5,' see text decision. The underlined portions of each tracing were considered "acceptable" pages 6-7.)
FIGURE 3
Comparison of EEG tracings (C3, A2 derivations) in Stages 3 and 4. Stage 3. They were deliberately selected because the amount of high amp
Tracings from different portions of a sleep record were selected as an aid litude, slow wave activity was almost, but not quite enough, to qualify as
in the discrimination of the two stages. The four tracings on this page are Stage 4.
FIGURE 3 (Continued)
The four tracings on this page were selected because they show just enough "acceptable" high amplitude, slow wave activity, i.e., 2 cps or slower and
high amplitude slow wave activity to qualify for Stage 4. In borderline greater than 75 yV peak to peak. These illustrations depict 30 sec epochs
instances where there is a question of whether to score Stage 3 or Stage 4, recorded on a Beckman Type R Dynograph with a paper speed of 10 mm/sec,
a comparison of the record in question with these tracings may facilitate a time constant of 0.3 sec and a calibration of 50 yV/cm.
a decision. The underlined portions of each tracing were considered
1 ’ JN' I 1 50juV
FIGURE 4 2 sec
The top three tracings are Stage 2 and contain increasing percentages of wave activity and qualify as Stage 3. The tracings depict 20 sec epochs
high amplitude, slow wave activity but not enough to qualify for Stage 3. The recorded on a Grass Model IV-C electroencephalograph with a paper speed
bottom three tracings contain increasing percentages of high amplitude, slow of 15 mm/sec, a time constant of 0.3 sec and a calibration of 50 uV/cm
FIGURE 5 2 sec
The top three tracings are Stage 3 and contain increasing percentages of wave activity and qualify as Stage 4. The tracings depict 20 sec epochs high amplitude, slow wave activity, but not enough to qualify for Stage 4. The recorded on a Grass Model IV-C electroencephalograph with a paper speed bottom three tracings contain increasing percentages of high amplitude, slow of 15 mm/sec, a time constant of 0.3 sec and a calibration of 50 yV/cm.
Schematic illustrations of rules for scoring Stage REM mixed with sleep
spindles. See text, page 8, for explanation.
(Tiia
,
FIGURE 7
Schematic illustrations of
rules for scoring the start
of Stage REM. See text,
page 9, for explanation.
EOG
EMG
E EG
STAGE
-r :r^,m i -- ’
REM REM 2
FIGURE 8
Schematic illustrations of rules for scoring the end of Stage REM.
See text, page 10, for explanation.
F
FIGURE 8 (Continued)
K'a4/vv^^
Stage W.
FIGURE 9
This epoch illustrates an unambiguous Stage W. Note
the relatively continuous alpha activity and the REMs.
50jU.V
sec
FIGURES 9-22
Epochs from the various stages of subject 1 are presented. The subject
was a 19 year old, normal, male college student. All the tracings are from
the same night and were recorded on a Beckman Type R Dynograph. Each
tracing represents a 30 sec epoch recorded at a paper speed of 10 mm/sec.
For the eye movement and EEG channels calibration was 50 yV/cm. Time
constant was 0.3 sec. For the EMG channel, the time constant was 0.03 sec.
In Figs. 9-13, the calibration for the EMG channel was only 50 yV/cm in order
to minimize ink splattering. In Figs. 14-22, the EMG calibration was 10 yV/cm.
LIFT EYE-A2
Stage 1. This illustrates the transition from Stage W to Stage 1 within a
single epoch; RE Ms and alpha activity at the start of the epoch are followed by
slow eye movements and the typical relatively low voltage, mixed frequency
EEC of Stage 1 (much activity at 3-4 cps) later in the epoch. There are no
vertex sharp waves, which is typical of the early minutes of Stage 1. At the
end of the epoch, a REM and a burst of alpha activity signal a return to Stage
W, but slightly more than half the epoch is Stage 1, and the epoch is scored
accordingly. The relatively elevated EMG is maintained in the transition from
Stage W to Stage 1.
EMG
C3 - A2
FIGURE 11
Stage l. This epoch is typical of the early portion of Stage 1. There are
slow eye movements and a relatively low voltage, mixed frequency
EEG throughout the epoch. Tonic EMG is maintained. There is only one possible vertex sharp wave (underlined).
FIGURE 12
This epoch illustrates a later portion of Stage 1 with very
prorflinent vertex sharp waves (more prominent than in most
subjects).
LEFT EYE - A2
RIGHT EYE - A2
EMG
i^^^S^*****"1 »*^ <■ w*^»A V*^» * fW*
FIGURE 13 I Sec
Stage 1. This epoch illustrates the beginning of transition from Stage 1
to Stage 2. As is often the case in later portions of Stage 1, slow eye move¬
ments stop. Vertex sharp waves are very prominent (more so in this subject
than in most subjects). In the middle of the epoch, there is a burst of activity
in the 12-14 cps range (underlined), but it does not last for a full half second,
and therefore cannot qualify as a sleep spindle for purposes of scoring the
epoch. However, the scorer would now be prepared for unambiguous sleep
spindles which will follow shortly in subsequent epochs. In such transition
records, the differentiation between vertex sharp waves and K complexes
may be difficult; conservatism in the interpretation of K complexes is
suggested at this point, because sharp wave activity is so obviously present, and unambiguous Stage 2 has not yet appeared.
^A^sAa/va^ 50/iV
sec
FIGURE 14
This illustrates Stage 2 with relatively elevated tonic
EMG. The presence of sleep spindles is unambiguous.
RIGHT EYE-A2
LEFT EYE - A2
EMG
C3 - A2
FIGURE 15
Stage 2. This illustrates Stage 2 with tonic EMG at the lowest
level attained during the recording session.
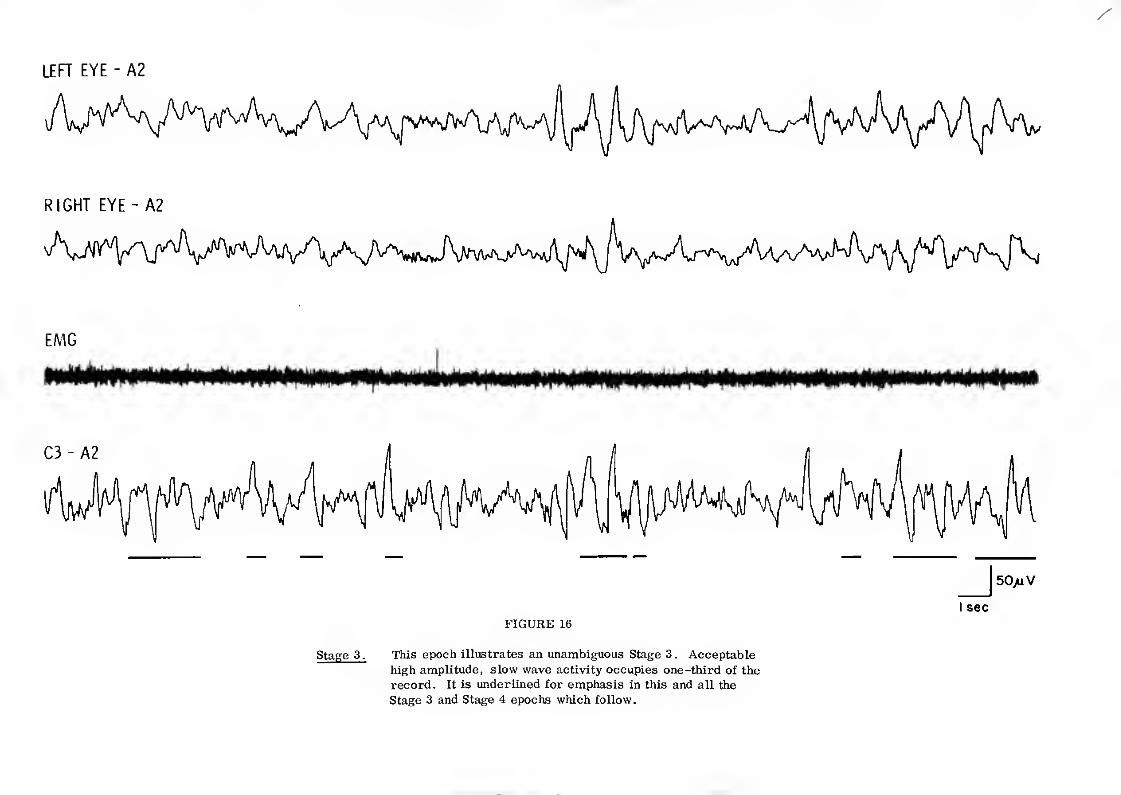
FIGURE 16
This epoch illustrates an unambiguous Stage 3. Acceptable
high amplitude, slow wave activity occupies one-third of the
record. It is underlined for emphasis in this and all the
Stage 3 and Stage 4 epochs which follow.
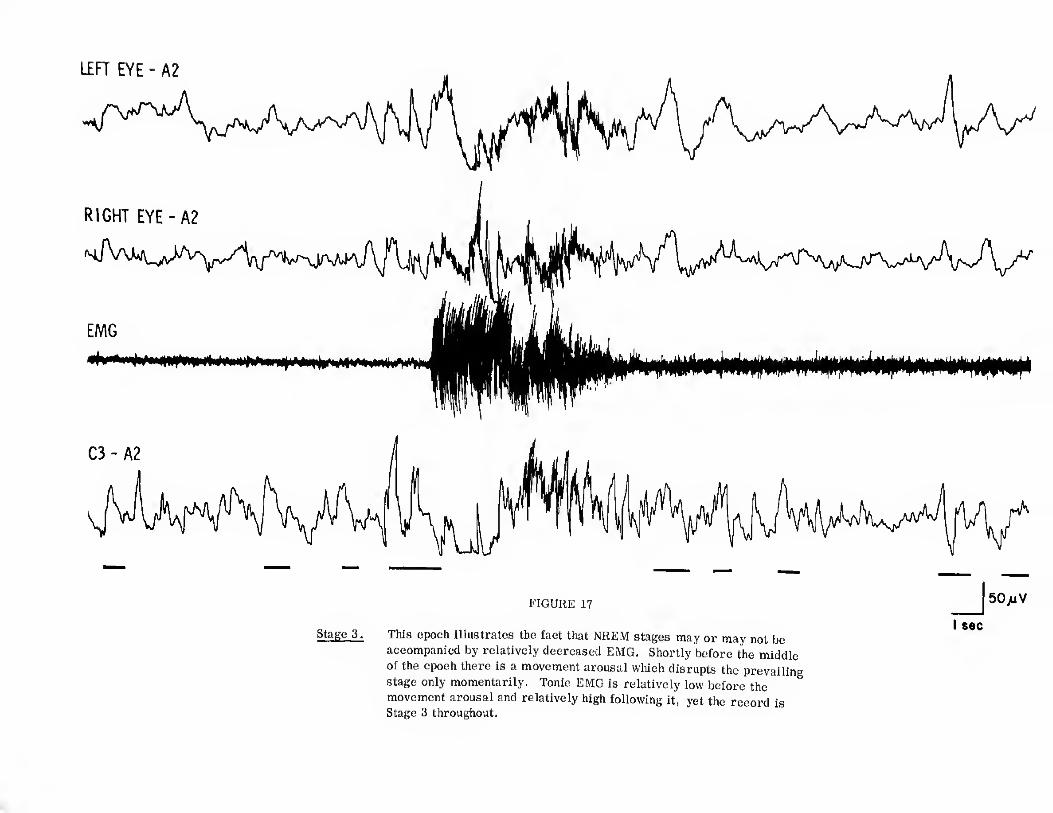
FIGURE 17
This epoch illustrates the fact that NREM stages may or may not be
accompanied by relatively decreased EMG. Shortly before the middle
of the epoch there is a movement arousal which disrupts the prevailing
stage only momentarily. Tonic EMG is relatively low before the
movement arousal and relatively high following it, yet the record is Stage 3 throughout.
RIGHT EYE - A2
EMG
FIGURE 18
Stage 4. This represents a typical Stage 4 epoch. Note that sleep spindles may be present in Stage 4.
FIGURE 19
Stage REM. This epoch illustrates a transition between Stage 2 and Stage that not all the saw-tooth waves have the distinctive notched appearance.)
REM. The record had been Stage 2 for some time prior to this epoch. Just Stage REM is considered to have begun immediately after the end of the K
before the midpoint of the epoch, there is a clear sleep spindle followed by a complex, and to continue for the remainder of the epoch. The interval of
K complex. Following the K complex are clear saw-tooth waves (underlined), Stage REM occupies just over 50% of the epoch; hence the entire epoch is
which herald the appearance of REMs during the last third of the epoch. (Note considered Stage REM. EMG is at the lowest level of the recording session.
I sec
50/iV
FIGURE 20
Stage REM. This is an unambiguous Stage REM with relatively
low voltage, mixed frequency EEG, REMs, and EMG
at the lowest level of the recording session. Note that
saw-tooth waves may or may not accompany REMs.
f 11. 4
[ill C3-A2
w,' :-W ^ 1... f uiwyju * u' n
• . • • FIGURE 21
MT. Although there is clear high amplitude, slow wave activity
near the end of the epoch, the greatest portion of the epoch
is obscured by the movement artifact and is therefore scored as MT rather than as any stage.
LEFT EYE - A2
RIGHT EYE-A2
22
were used. The EMG recording was made at a gain of 10 yV/cm and a
time constant of 0.03 sec. There was no filtering of the EMG record
(on the Beckman Type R, the coupler filter position was #1, and the
amplifiers were run with the highs in). On initial electrode application,
the inter-electrode resistance for the EMG electrodes was 500 ohms. proper electrode attachment is used. Large (1 in. diameter) lead electrodes
FIGURE
This epoch illustrates a test for 60 cycle artifact. During the latter portion
of the epoch, the paper speed is changed from 10 mm/sec to 100 mm/sec. At
the latter paper speed, 60 cps artifact would show up as 6 very regular sinusoidal
waves per cm; such activity is virtually absent in the record. This illustrates
that mental-submental EMG can be recorded at high gains without artifact if
FIGURE 23
Stage W. This is an unambiguous Stage W with relatively continuous
alpha, muscle tension artifacts, andREMs.
FIGURES 23 - 32
Epochs from the various stages of subject 2 are presented. The subject For the eye movement and EEG channels calibration was 50 vV/cm and the
was a 21 year old, normal, male college student. All the tracings are from time constant was 0.3 sec. For the EMG channel, the time constant was
the same night and were recorded on a Beckman Type R Dynograph. Each 0.03 sec. In Figs. 23-27 the calibration for the EMG channel was 50 yV/cm
tracing represents a 30 sec epoch recorded at a paper speed of 10 mm/sec. In Figs. 28-32, the EMG calibration was 10 yV/cm.
50 >uV
I sec
FIGURE 24
Stage W. The record is clearly Stage W in that more than half the epoch
is occupied by alpha activity. However, the occurrence of slow, pendular eye
movements in the second half of the epoch heralds the impending appearance
of Stage 1. The slow eye movements typically appear several seconds to a
few minutes before the development of unambiguous Stage 1. This epoch
constitutes the first of a series of 3 consecutive epochs which compactly
illustrate the typical transition from Stage W to Stage 1.
C3 - A2
A*!
50>iV
I sec
FIGURE 25
Sray 1 This epoch further illustrates the transition from Stage W (the
preceding epoch) to Stage 1. Although alpha activity is still abundant, it
accounts for only about one-third of the epoch (underlined). The intervals
between the alpha activity show relatively low voltage, mixed frequency
activity. Note how the slow eye movements tend to be associated with the disappearance of alpha activity.
FIGURE 26
Stage 1. Stage 1 is now firmly established and alpha activity
is almost absent. Vertex sharp waves appear near the end of the epoch.
FIGURE 27
Stage 2. In Stage 2 epochs which follow soon after Stage 1, as this one does, and by their monophasic appearance. The emergence of high amplitude,
vertex sharp waves may be very abundant. These vertex sharp waves should not slow wave activity is usually accompanied by an overall increase in back-
be confused with the high amplitude activity of Stage 3. The sharp waves can ground amplitude. Also note that most of the high amplitude activity in
usually be distinguished with ease by their faster frequency, their prominence this sample is not slow enough to meet the 2 cps criterion for acceptable
at the vertex (not possible here because only one channel of EEG was recorded), high amplitude activity in the scoring of Stages 3 and 4. The prominent
by the fact that they stand out against a background of much lower voltage activity, slow eye movements persist from the preceding Stage 1.
I sec
FIGURE 28
This epoch is almost borderline between Stages 2 and 3;
approximately 15% of the epoch is occupied by acceptable
high amplitude, slow wave activity.
FIGURE 30
This is an unambiguous Stage 4 epoch.
LEFT EYE - A2
RIGHT EYE-A2
EMG
I sec
FIGURE 31
Stage 2. This epoch illustrates a clear transition between Stage 2 and Stage followed by rudimentary saw-tooth waves and a single REM. The part of
REM. The sleep spindles and K complexes shortly following the middle of the the epoch which would satisfy the requirements of Stage REM begins at the
epoch indicate Stage 2. (The preceding epoch was also Stage 2.) Toward the end point of the EMG decrease. Inasmuch as this constitutes less than one-half
of the epoch there is a clear decrease of EMG, which then reaches the lowest the epoch, the entire epoch is scored Stage 2.
level attained during the recording session. The EMG decrease is shortly
C3-A2
FIGURE 32
Stage REM. This is an unambiguous Stage REM. The fluctuations
of the EMG baseline probably represent jaw movements associated with respiration.
C4 -A1 50
JUV
F4 - A1
02 - A1
Stage W
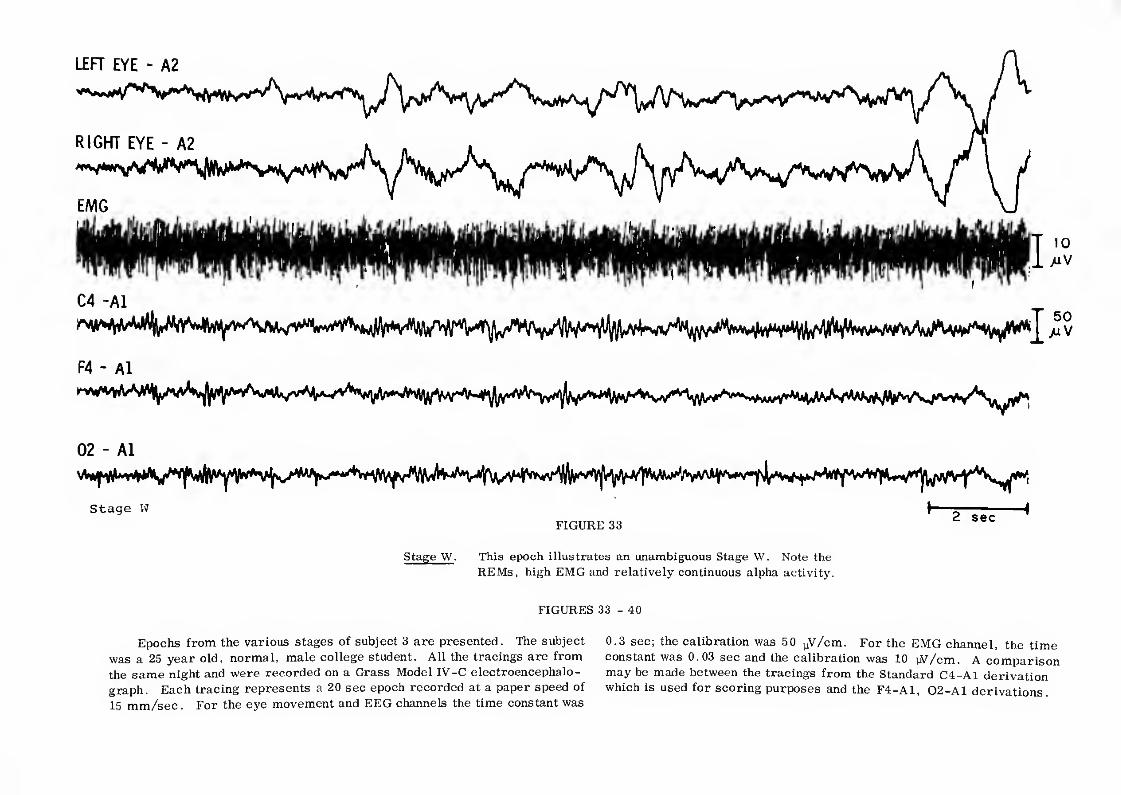
FIGURE 33 2 sec
Stage W. This epoch illustrates an unambiguous Stage W. Note the
REMs, high EMG and relatively continuous alpha activity.
FIGURES 33 - 40
Epochs from the various stages of subject 3 are presented. The subject
was a 25 year old, normal, male college student. All the tracings are from
the same night and were recorded on a Grass Model IV-C electroencephalo¬
graph. Each tracing represents a 20 sec epoch recorded at a paper speed of
15 mm/sec. For the eye movement and EEG channels the time constant was
0.3 sec; the calibration was 50 uV/cm. For the EMG channel, the time
constant was 0.03 sec and the calibration was 10 tW/cm. A comparison
may be made between the tracings from the Standard C4-A1 derivation
which is used for scoring purposes and the F4-A1, Q2-A1 derivations.
LEFT EYE - A2
FIGURE 34
Stage 1. This epoch illustrates the transition from Stage W to Stage 1. movements are present and a high EMG is maintained throughout. A repetitive
Note the continuous alpha at the beginning of the epoch, then slower fre- artifact is present in the F4-A1 derivation,
quencies appear with associated relatively low voltage activity. Slow eye
02 - A1
Stage 1 2 sec
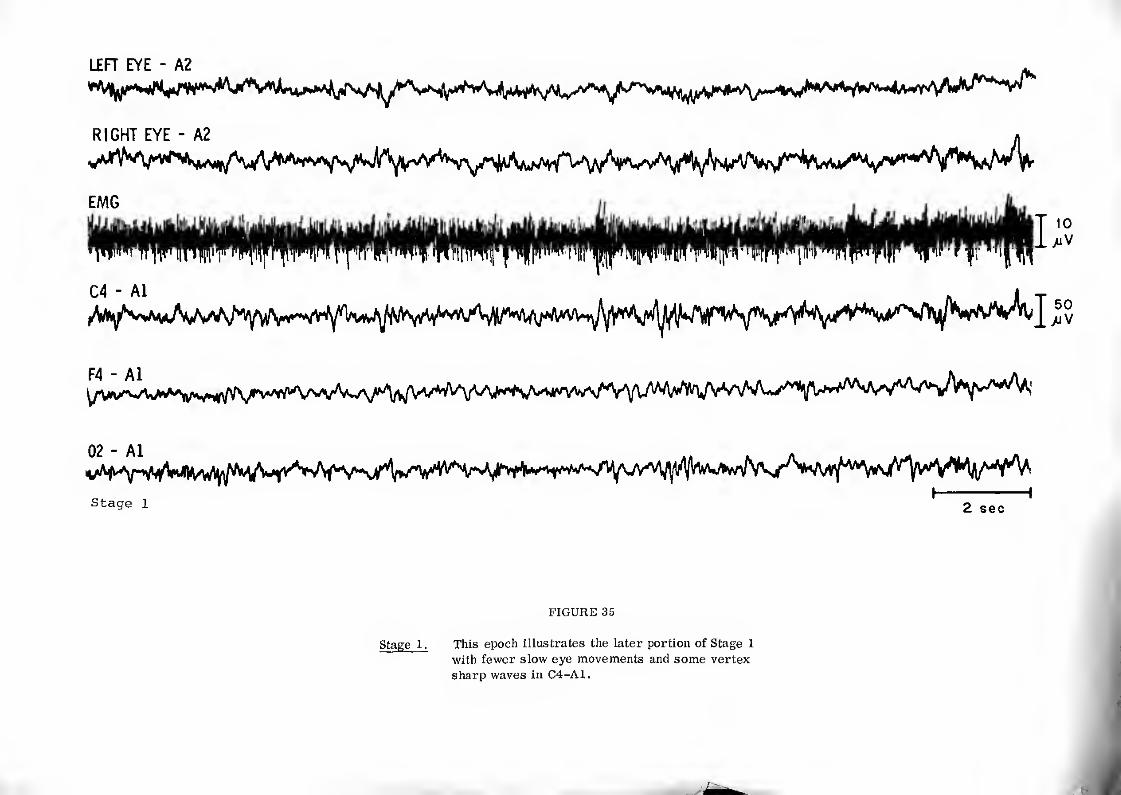
FIGURE 35
Stage 1. This epoch illustrates the later portion of Stage 1
with fewer slow eye movements and some vertex
sharp waves in C4-A1.
RIGHT EYE - A2
EMG
02 - A1
Stage 2 2 sec
FIGURE 36
Stage 2. This epoch illustrates an unambiguous Stage 2.
2 sec
FIGURE 37
Stage 3. This epoch illustrates a Stage 3 record with approximately
28% acceptable, high amplitude, slow wave activity.
LEFT EYE - A2
FIGURE 38
Stage 4. This epoch illustrates an unambiguous Stage 4.
RIGHT EYE - A2
Stage REM
2 sec
FIGURE 39
Stage REM. This epoch depicts the transition from Stage 2 to
Stage REM with saw-tooth waves (underlined), REMs
and decrease in tonic EMG. REMs are also recorded
on F4-A1 derivation. (Sleep spindles were present just prior to this epoch.)
LEFT EYE - A2
02 - A1
Stage REM 2 sec
FIGURE 40
Stage REM. Note phasic twitching in the EMG as well as REMs,
low tonic EMG and relatively low voltage EEG. » u. S. GOVERNMENT PHINTINC OFFICE : mi O - IM'«M