22
April 2016 A market approach for valuing solar PV farm assets Global results

April 2016
A market approach for valuing solar PV farm assetsGlobal results
Table of contents
1. Introduction
2. Executive summary
3. Methodology
4. Solar PV farm transaction analysis
Appendix A – summary of transactions in the solar PV farm industry
Appendix B – regression output – solar PV farm analysis
Appendix C – regression output adjusted for outliers – solar PV farm analysis
Appendix D – regression output adjusted for outliers (2014-2016) – solar PV farm analysis
Order form for geographical analysis and transaction details
About Financial Advisory
Deloitte contacts
Terms and conditions:• This article and all of its content are property of Deloitte Statsautoriseret Revisionspartnerselskab (“Deloitte”) and protected by DK and International property
rights and laws. You may not publish, distribute or otherwise disclose the article or any of its content to any third party or use for commercial purposes any material or results therein.
• Deloitte has not verified the information referred to in the article (or the information gathered with connection to those transactions included in the datasets and models).
• While every care has been taken in the compilation of the article and the analyses and results therein and every attempt has been made to present up-to-date and accurate information, we cannot guarantee that inaccuracies do not occur.
• Deloitte takes no responsibility for any direct or indirect losses, damages, costs or expenses which arise from or in any connection with the use of the article, including but not limited to investment decisions and financial decisions based on the article.
• Deloitte Statsautoriseret Revisionspartnerselskab is a member of the DTTL network which refers to Deloitte Touche Tohmatsu Limited, a UK private company limited by guarantee, and its network of member firms and their affiliates, predecessors, successors and representatives as well as partners, managements, members, owners, directors, managers, employees, subcontractors and agents of all such entities operating under the names of “Deloitte”, “Deloitte Touche”, “Deloitte Touche Tohmatsu” or other related names. The member firms are legally separate and independent entities and have no liability for each other’s acts or omissions.
3468
14151617181921
3A market approach for valuing solar PV farm assets
1. Introduction
In recent years investors all over the world have paid increasing attention to the renewable energy industry.
This trend has translated into rapid renewable energy commercialisation and considerable industry expansion, of which the solar photovoltaic (PV) industry is a good example. According to Bloomberg Business, new wind and solar power accounted for about half of all new generation last year. Around 64 GW of new wind power and 57 GW of new photovoltaics was added, representing an increase of 30 % from 20141.
The increase in annual installed solar PV capacity may be explained by the past years’ reduction in panel costs. The cost reduction is mainly due to technology improvements and the entry of low-cost production lines in China and Chinese Taipei, which now accounts for almost 70% of global PV panel production2.
The international Energy Agency (IEA) estimates that solar PV energy’s share of global energy generation will increase significantly up to 2040. Solar PV alone is expected to generate more than 10% of total energy, whereas wind energy is expected to generate 13%. This reflects an expected total capacity of solar PV assets of 1,066 GW in 20402.
Since the solar PV market has grown at high speed and since growth is expected to continue, we find it interesting to examine the market values of solar PV farm assets.
1 Bloomberg Business, “As Oil Crashed,Renewables Attract Record $329 Billion, 14 January 2016”
2 International Energy Agency, “World Energy Outlook 2015”
4
We have performed a similar analysis of wind farm assets and we refer to “A market approach for valuing wind farm assets” for that analysis.
Since the release of the 7th edition of this analysis in April 2015, we have added transactions that are suitable for our analysis of solar PV assets. Our analysis now includes 240 solar PV farm transactions. The additional transactions in the solar analysis have enabled us to perform more comprehensive analyses of time effects on installed capacity.
In this year’s edition we once more see a noticeable downward change in the preliminary installed capacity multiple. We estimate a value of EUR 2.2m per installed MW.
However, due to large improvements in cost-competitive ness within the last few years, a time regression on data from January 2014 until the beginning of 2016 is executed to obtain a more reliable estimate
2. Executive summary
In the past few years focus on renewable energy has led to high growth in investments in renewable energy assets. Especially wind and solar farm assets have been exposed to great interest from investors, and markets expect high growth rates in investments in these assets in the coming decades. Due to expectations for these markets, we find it interesting to identify the structure of assets held by solar PV farm investors and to find suitable methods to value such assets.
This paper addresses how and why multiple regression analyses are a good supplement to more comprehensive cash flow models when valuing solar PV farm assets. Our analysis has been performed on the basis of transactions in the solar PV industry. Through our analyses of transactions in the solar PV industry we find that installed capacity, construction capacity and capacity in development pipeline affect the enterprise value of solar PV assets significantly.
5A market approach for valuing solar PV farm assets
1.5
Development Construction Installed MWs
EURm/MW Assets in operation
Approved & ready for construction
EV/MW EUR 1.7m
EUR 1.4m
EUR 1.0m
EUR 0.3m
EUR 0.0m
EUR 0.4m
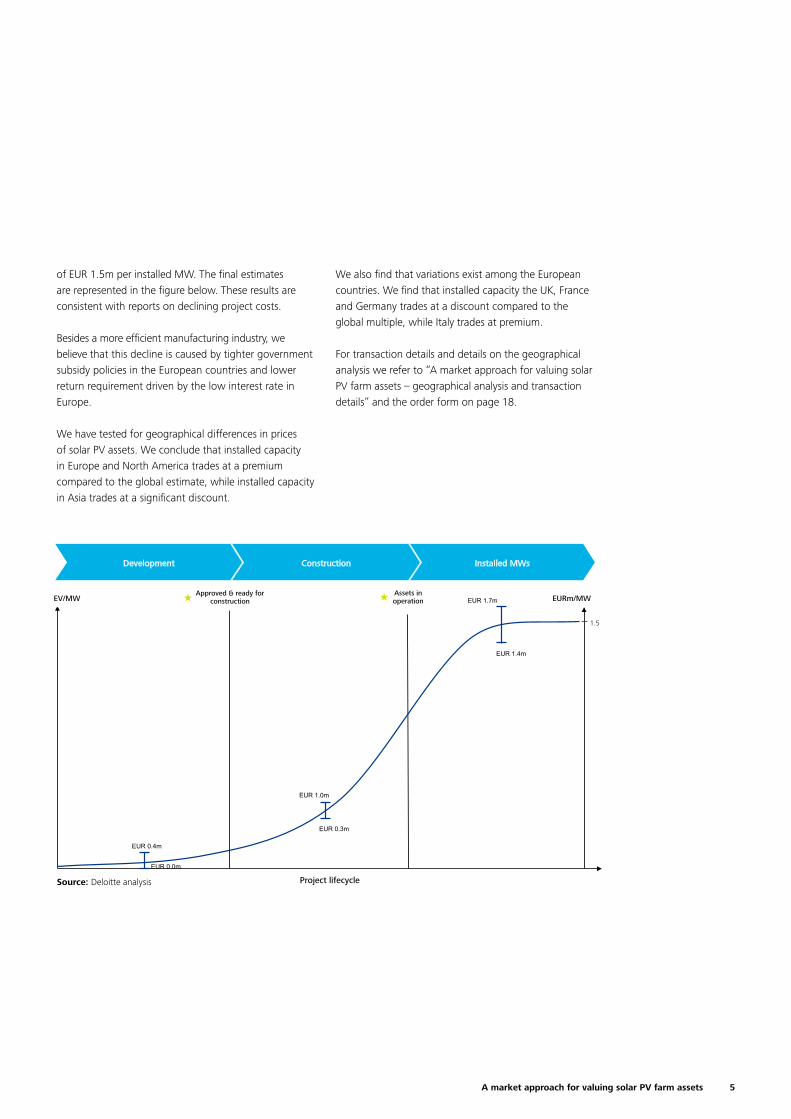
of EUR 1.5m per installed MW. The final estimates are represented in the figure below. These results are consistent with reports on declining project costs.
Besides a more efficient manufacturing industry, we believe that this decline is caused by tighter government subsidy policies in the European countries and lower return requirement driven by the low interest rate in Europe.
We have tested for geographical differences in prices of solar PV assets. We conclude that installed capacity in Europe and North America trades at a premium compared to the global estimate, while installed capacity in Asia trades at a significant discount.
We also find that variations exist among the European countries. We find that installed capacity the UK, France and Germany trades at a discount compared to the global multiple, while Italy trades at premium.
For transaction details and details on the geographical analysis we refer to “A market approach for valuing solar PV farm assets – geographical analysis and transaction details” and the order form on page 18.
Source: Deloitte analysis
1.7
Project lifecycle
Early stage Non-installed Installed MWs
EURm/MW Assets in operation
Approved & ready for construction
EV/MW EUR 2.0m
EUR 1.5m
EUR 0.3m
EUR 0.2m
EUR 0.0m
EUR 0.1m
6
• Operation & Maintenance • Technical & Commercial
management
• Investment evaluation
• Repowering or decommissioning
• Detailed solar study • Detailed design
• Procurement and reservation contracts
• Updated business case analysis
• Final consent
• FID**
• Project design • Environmental
impact assessment
• Community engagement
• Updated business case analysis
• Project rights • Geological study
• Cable topography
• Solar energy study
• Preliminary business case analysis
• Landowner agreements
• Building permit application
• Grid connection application
• Potential consent appeal
• Updated business case analysis
Development Construction Installed
Solar farm development for analysis purposes
Source: Deloitte analysis
All permits required for construction are granted
Project development Maturation Construction
FID**
• Construction • Commissioning
• Updated business case analysis
Feasibility studies Design and EIA*
Agreements and applications
Operation
COD***
Solar farm development
Note: * Environment Impact Assessment, ** Final Investment Decision, *** Commissioning Date
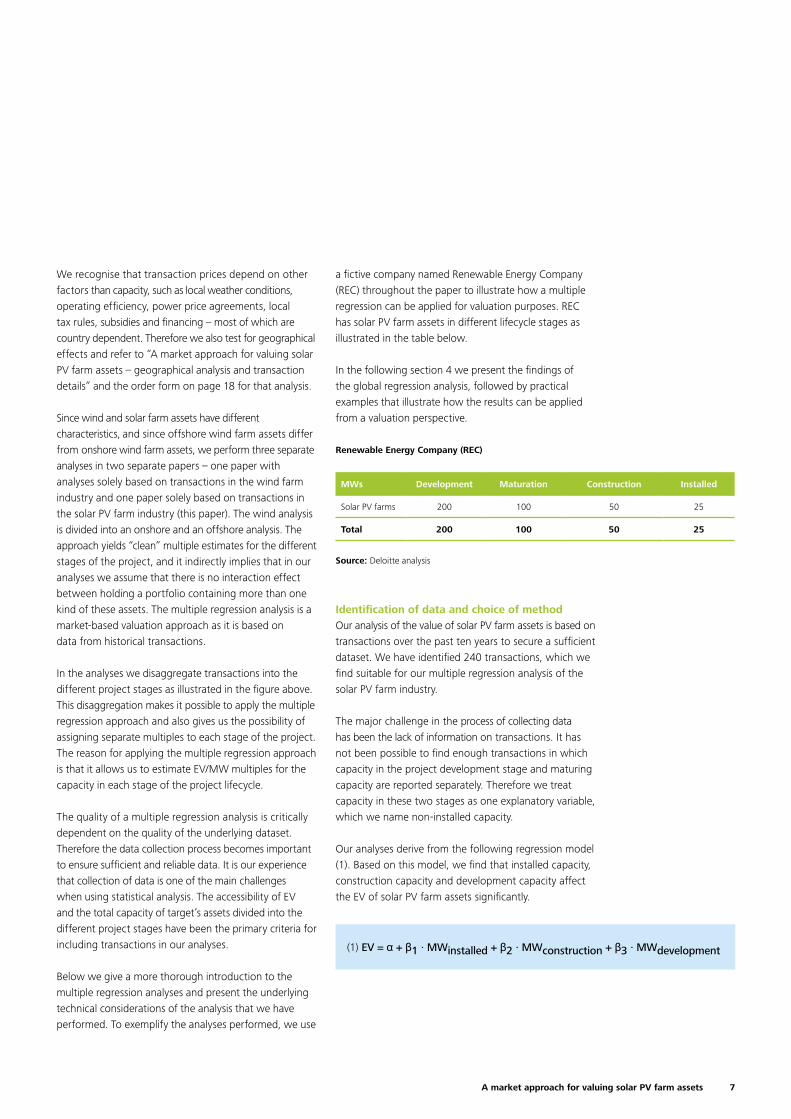
Introduction This paper addresses how multiple regression analysis of transaction multiples can be used as a benchmarking tool to support a more comprehensive valuation based on a cash flow model. We present the technical considerations underlying the analysis followed by practical examples that illustrate how the results can be applied from a valuation perspective.
From our point of view, one of the main challenges is the determination of the market value of solar assets in different stages of the solar PV farm lifecycle. We define this lifecycle as illustrated in the figure below.
3. Methodology
Project lifecycle of solar PV farm assets
Note: * Environment Impact Assessment, ** Final Investment Decision, *** Commissioning DateSource: Deloitte analysis
7A market approach for valuing solar PV farm assets
Renewable Energy Company (REC)
Source: Deloitte analysis
MWs Development Maturation Construction Installed
Solar PV farms 200 100 50 25
Total 200 100 50 25
We recognise that transaction prices depend on other factors than capacity, such as local weather conditions, operating efficiency, power price agreements, local tax rules, subsidies and financing – most of which are country dependent. Therefore we also test for geographical effects and refer to “A market approach for valuing solar PV farm assets – geographical analysis and transaction details” and the order form on page 18 for that analysis.
Since wind and solar farm assets have different characteristics, and since offshore wind farm assets differ from onshore wind farm assets, we perform three separate analyses in two separate papers – one paper with analyses solely based on transactions in the wind farm industry and one paper solely based on transactions in the solar PV farm industry (this paper). The wind analysis is divided into an onshore and an offshore analysis. The approach yields “clean” multiple estimates for the different stages of the project, and it indirectly implies that in our analyses we assume that there is no interaction effect between holding a portfolio containing more than one kind of these assets. The multiple regression analysis is a market-based valuation approach as it is based on data from historical transactions.
In the analyses we disaggregate transactions into the different project stages as illustrated in the figure above. This disaggregation makes it possible to apply the multiple regression approach and also gives us the possibility of assigning separate multiples to each stage of the project. The reason for applying the multiple regression approach is that it allows us to estimate EV/MW multiples for the capacity in each stage of the project lifecycle.
The quality of a multiple regression analysis is critically dependent on the quality of the underlying dataset. Therefore the data collection process becomes important to ensure sufficient and reliable data. It is our experience that collection of data is one of the main challenges when using statistical analysis. The accessibility of EV and the total capacity of target’s assets divided into the different project stages have been the primary criteria for including transactions in our analyses.
Below we give a more thorough introduction to the multiple regression analyses and present the underlying technical considerations of the analysis that we have performed. To exemplify the analyses performed, we use
a fictive company named Renewable Energy Company (REC) throughout the paper to illustrate how a multiple regression can be applied for valuation purposes. REC has solar PV farm assets in different lifecycle stages as illustrated in the table below.
In the following section 4 we present the findings of the global regression analysis, followed by practical examples that illustrate how the results can be applied from a valuation perspective.
Identification of data and choice of methodOur analysis of the value of solar PV farm assets is based on transactions over the past ten years to secure a sufficient dataset. We have identified 240 transactions, which we find suitable for our multiple regression analysis of the solar PV farm industry.
The major challenge in the process of collecting data has been the lack of information on transactions. It has not been possible to find enough transactions in which capacity in the project development stage and maturing capacity are reported separately. Therefore we treat capacity in these two stages as one explana tory variable, which we name non-installed capacity.
Our analyses derive from the following regression model (1). Based on this model, we find that installed capacity, construction capacity and development capacity affect the EV of solar PV farm assets significantly.
(1) EV = α + β1 · MWinstalled + β2 · MWconstruction + β3 · MWdevelopment
8
4. Solar PV farm transaction analysis
Regression and valuation of solar PV farms
EURm Development Construction Installed
EV/MW coefficient1 0.1x 0.1x 2.2x
Significance (p-value) 0.0 0.0 0.0
Upper 95% 0.2x 0.2x 2.3x
Lower 95% 0.1x 0.0x 2.1x
1 Transactions (n): 240, R-square: 0.87Source: Deloitte analysis
Our analysis consists of two preliminary analyses and a more detailed time analysis leading to our final estimate of the capacity multiples of solar farms.
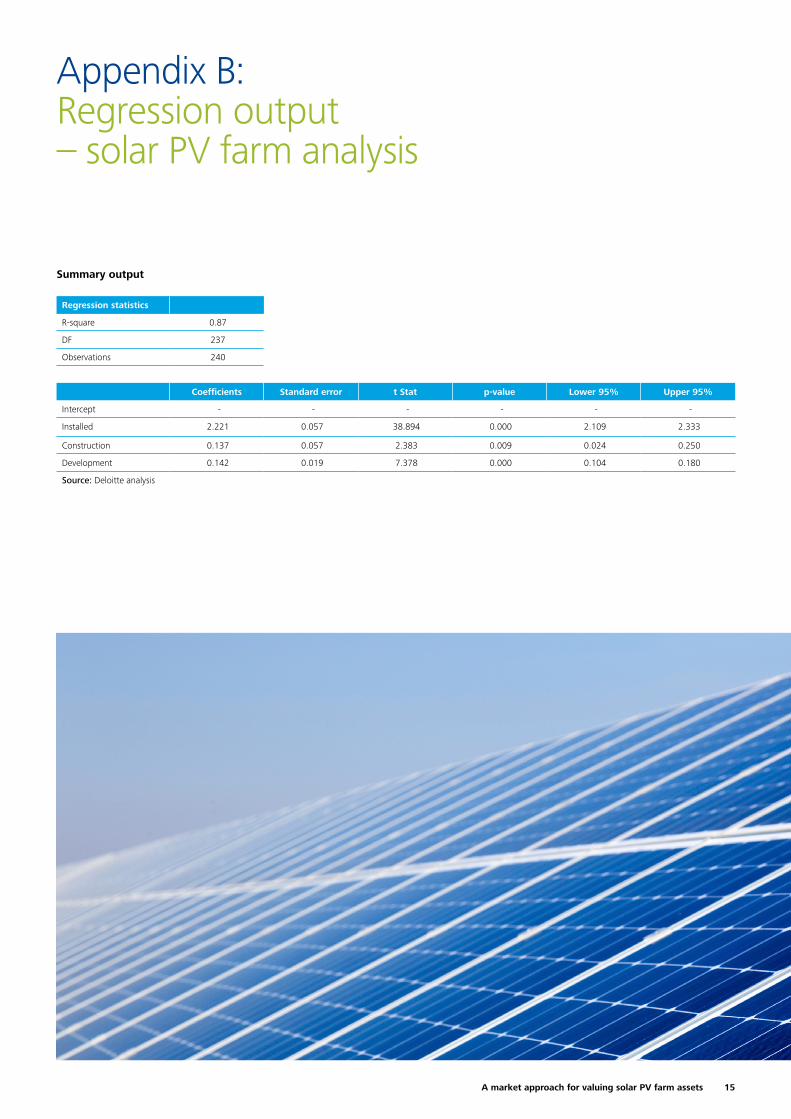
Based on model (1), the preliminary EV/MW multiple estimates for installed, construction and development capacity are EUR 2.2m, EUR 0.1m and EUR 0.1m. The analysis has a coefficient of determination of 0.87, which means that 87 % of the variation in transaction prices can be explained by model (1).
9A market approach for valuing solar PV farm assets
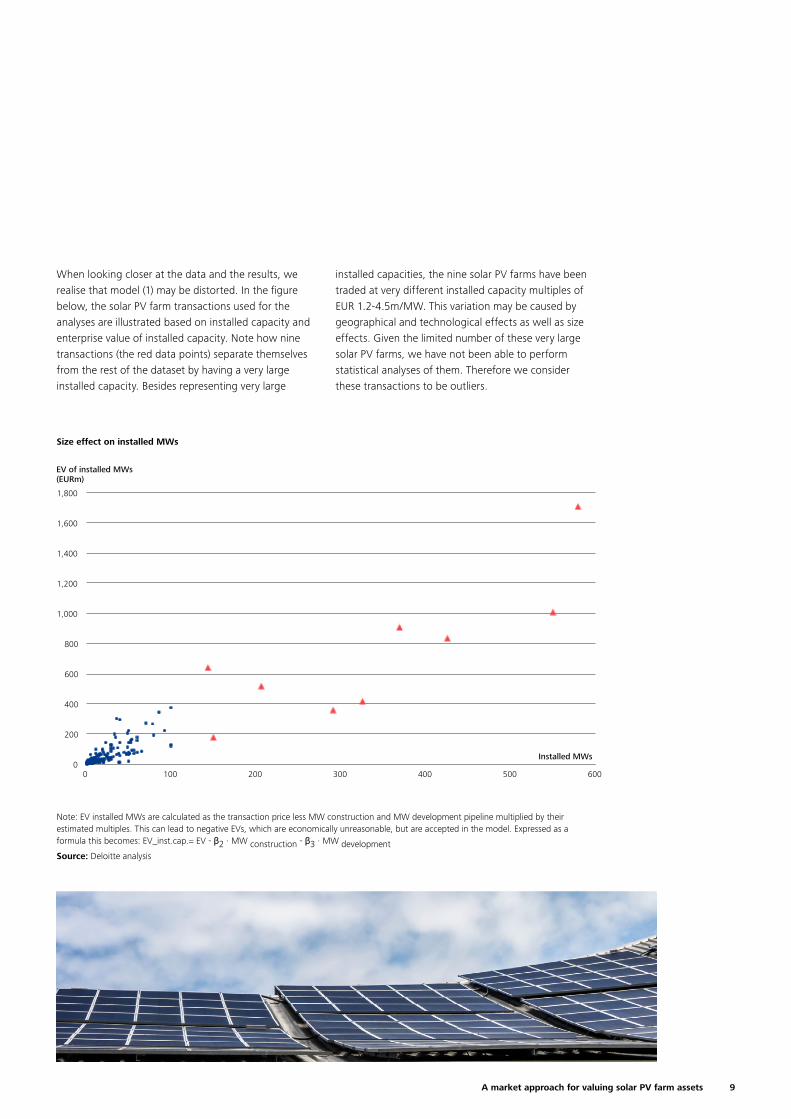
When looking closer at the data and the results, we realise that model (1) may be distorted. In the figure below, the solar PV farm transactions used for the analyses are illustrated based on installed capacity and enterprise value of installed capacity. Note how nine transactions (the red data points) separate themselves from the rest of the dataset by having a very large installed capacity. Besides representing very large
installed capacities, the nine solar PV farms have been traded at very different installed capacity multiples of EUR 1.2-4.5m/MW. This variation may be caused by geographical and technological effects as well as size effects. Given the limited number of these very large solar PV farms, we have not been able to perform statistical analyses of them. Therefore we consider these transactions to be outliers.
Note: EV installed MWs are calculated as the transaction price less MW construction and MW development pipeline multiplied by their estimated multiples. This can lead to negative EVs, which are economically unreasonable, but are accepted in the model. Expressed as a formula this becomes: EV_inst.cap.= EV - β2 ∙ MW construction - β3 ∙ MW developmentSource: Deloitte analysis
Size effect on installed MWs
0
200
400
600
800
1,000
1,200
1,400
1,600
1,800
0 100 200 300 400 500 600
EV of installed MWs (EURm)
Installed MWs
10
Modified regression adjusted for outliers
EURm Development Construction Installed
EV/MW coefficient1 0.1x 0.1x 2.4x
Significance (p-value) 0.0 0.0 0.0
Upper 95% 0.2x 0.2x 2.6x
Lower 95% 0.1x 0.1x 2.2x
1 Transactions (n): 231, R-square: 0.71Source: Deloitte analysis
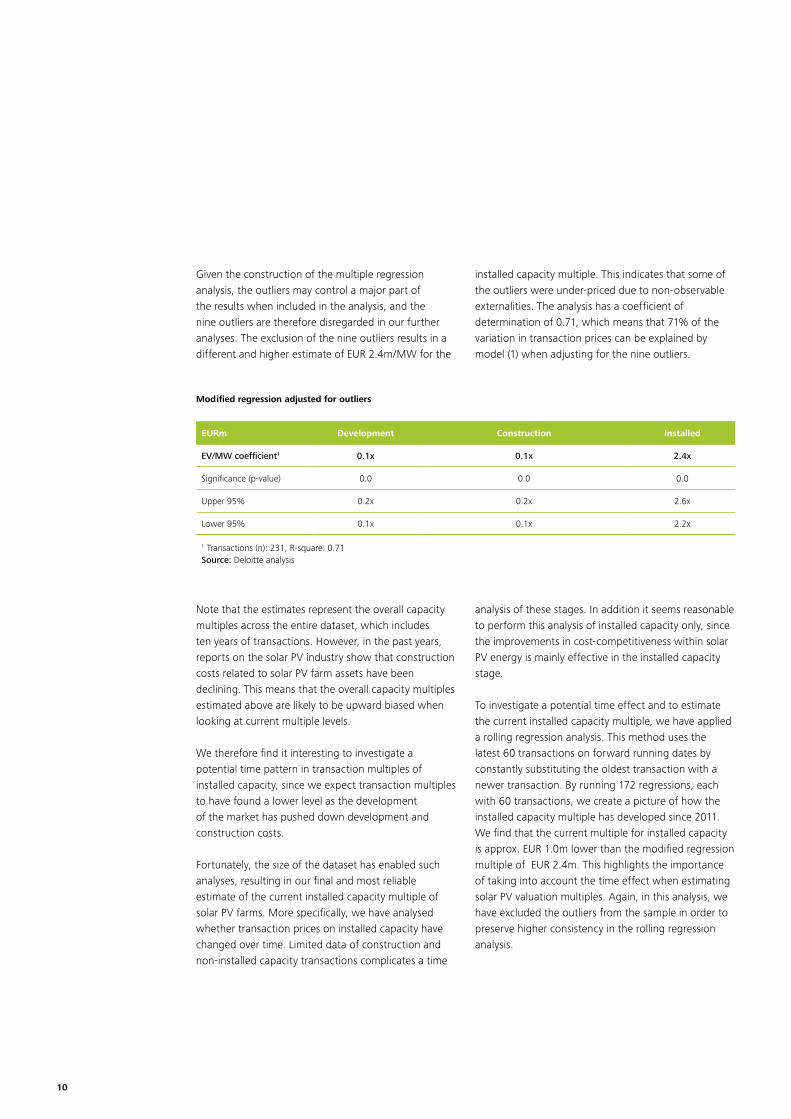
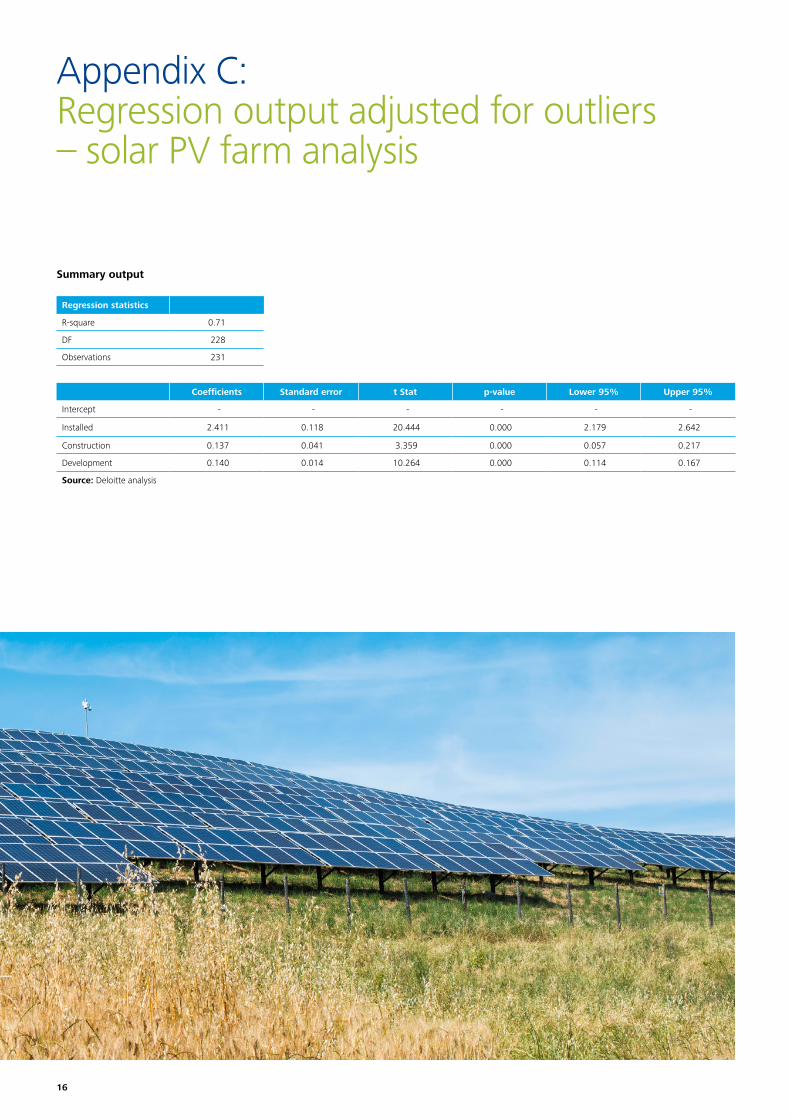
Given the construction of the multiple regression analysis, the outliers may control a major part of the results when included in the analysis, and the nine outliers are therefore disregarded in our further analyses. The exclusion of the nine outliers results in a different and higher estimate of EUR 2.4m/MW for the
Note that the estimates represent the overall capacity multiples across the entire dataset, which includes ten years of transactions. However, in the past years, reports on the solar PV industry show that construction costs related to solar PV farm assets have been declining. This means that the overall capacity multiples estimated above are likely to be upward biased when looking at current multiple levels.
We therefore find it interesting to investigate a potential time pattern in transaction multiples of installed capacity, since we expect transaction multiples to have found a lower level as the development of the market has pushed down development and construction costs.
Fortunately, the size of the dataset has enabled such analyses, resulting in our final and most reliable estimate of the current installed capacity multiple of solar PV farms. More specifically, we have analysed whether transaction prices on installed capacity have changed over time. Limited data of construction and non-installed capacity transactions complicates a time
installed capacity multiple. This indicates that some of the outliers were under-priced due to non-observable externalities. The analysis has a coefficient of determination of 0.71, which means that 71% of the variation in transaction prices can be explained by model (1) when adjusting for the nine outliers.
analysis of these stages. In addition it seems reasonable to perform this analysis of installed capacity only, since the improvements in cost-competitiveness within solar PV energy is mainly effective in the installed capacity stage.
To investigate a potential time effect and to estimate the current installed capacity multiple, we have applied a rolling regression analysis. This method uses the latest 60 transactions on forward running dates by constantly substituting the oldest transaction with a newer transaction. By running 172 regressions, each with 60 transactions, we create a picture of how the installed capacity multiple has developed since 2011. We find that the current multiple for installed capacity is approx. EUR 1.0m lower than the modified regression multiple of EUR 2.4m. This highlights the importance of taking into account the time effect when estimating solar PV valuation multiples. Again, in this analysis, we have excluded the outliers from the sample in order to preserve higher consistency in the rolling regression analysis.
11A market approach for valuing solar PV farm assets
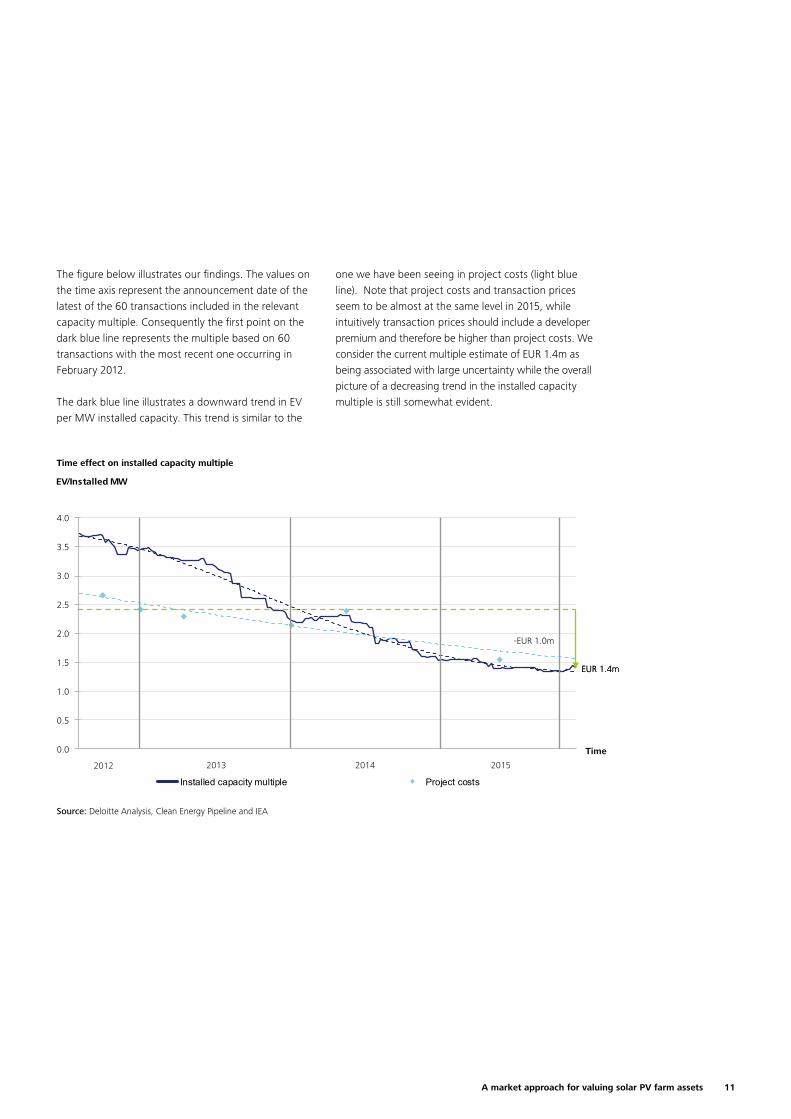
The figure below illustrates our findings. The values on the time axis represent the announcement date of the latest of the 60 transactions included in the relevant capacity multiple. Consequently the first point on the dark blue line represents the multiple based on 60 transactions with the most recent one occurring in February 2012.
The dark blue line illustrates a downward trend in EV per MW installed capacity. This trend is similar to the
one we have been seeing in project costs (light blue line). Note that project costs and transaction prices seem to be almost at the same level in 2015, while intuitively transaction prices should include a developer premium and therefore be higher than project costs. We consider the current multiple estimate of EUR 1.4m as being associated with large uncertainty while the overall picture of a decreasing trend in the installed capacity multiple is still somewhat evident.
Time effect on installed capacity multiple
Source: Deloitte Analysis, Clean Energy Pipeline and IEA
0,0
0,5
1,0
1,5
2,0
2,5
3,0
3,5
4,0
4,5
EV/Installed MW
Installed capacity multiple Project costs Time regression average (2014-2016)
Time
(2.3)
2012 2013 2014 2015
Discussion paper
0.0
0.5
1.0
1.5
2.0
2.5
3.0
3.5
4.0
EV/Installed MW
Installed capacity multiple Project costs
Time
2012 2013 2014 2015
EEUURR 11..44mm
-EUR 1.0m
12
EURm Development Construction Installed
EV/MW coefficient1 0.1x 0.7x 1.5x
Significance (p-value) 0.1 0.0 0.0
Upper 95% 0.4x 1.0x 1.8x
Lower 95% 0.0x 0.3x 1.3x
1 Transactions (n): 98, R-square: 0.65Source: Deloitte analysis
Modified regression adjusted for outliers (2014-2016)
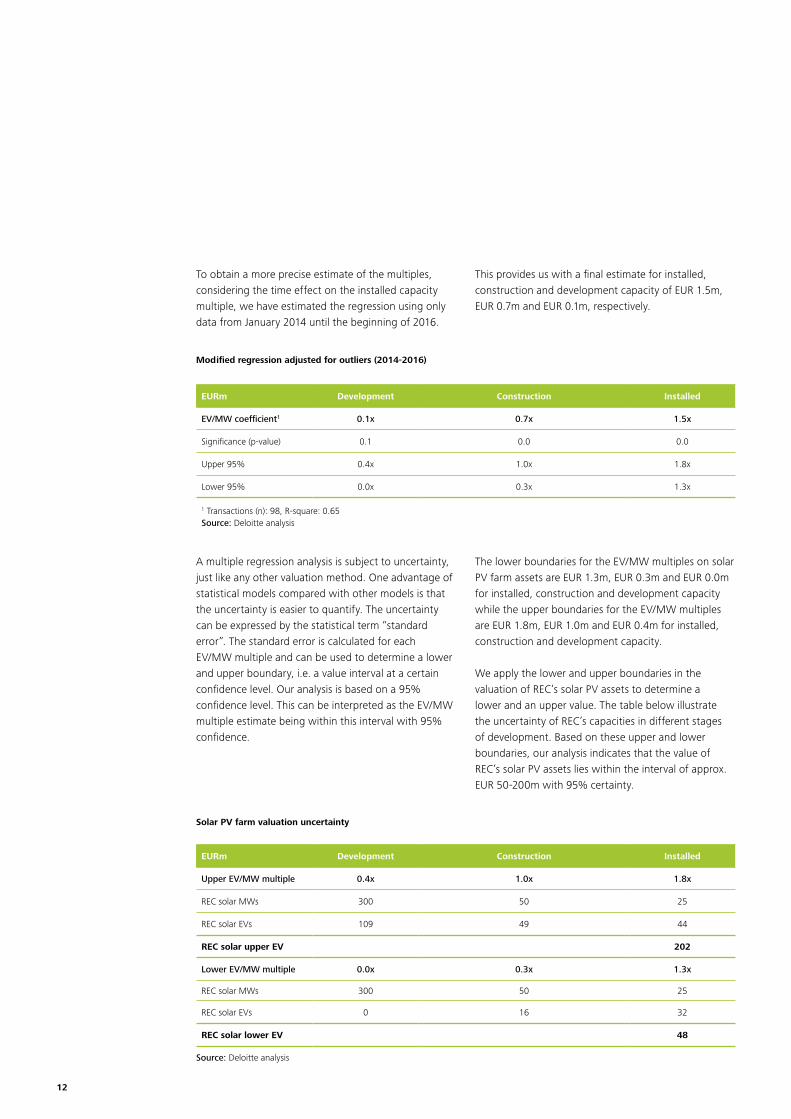
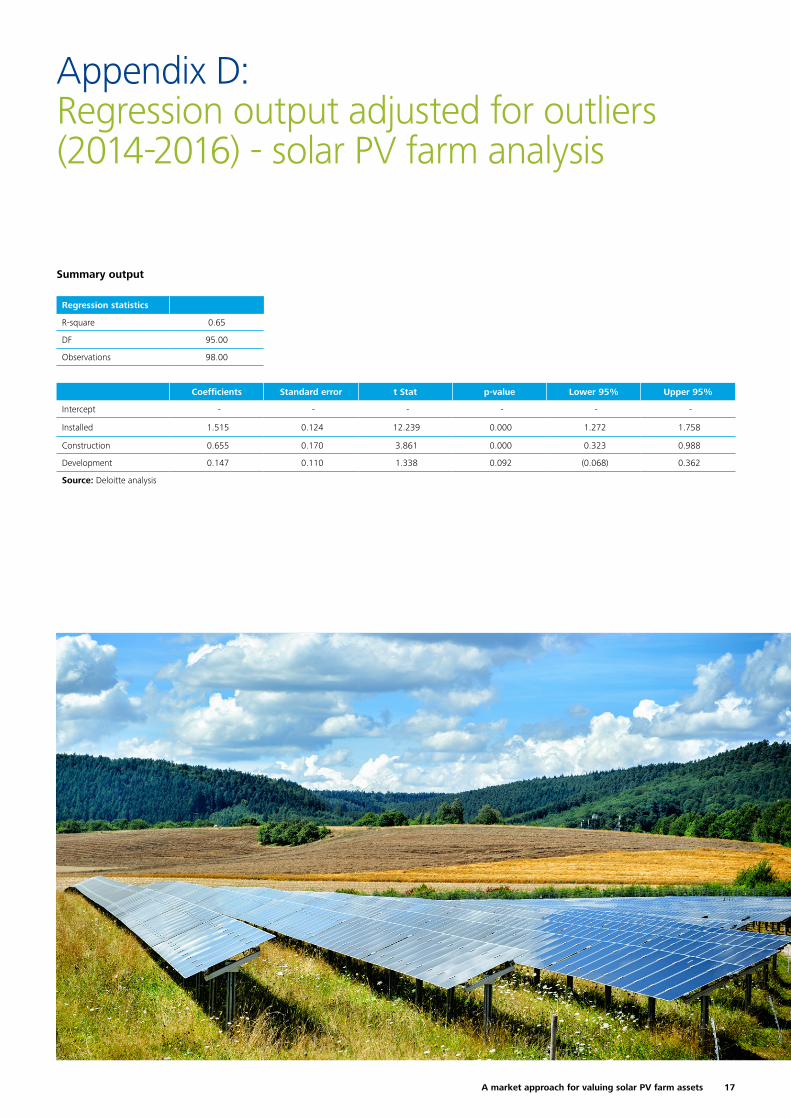
To obtain a more precise estimate of the multiples, considering the time effect on the installed capacity multiple, we have estimated the regression using only data from January 2014 until the beginning of 2016.
This provides us with a final estimate for installed, construction and development capacity of EUR 1.5m, EUR 0.7m and EUR 0.1m, respectively.
Solar PV farm valuation uncertainty
Source: Deloitte analysis
EURm Development Construction Installed
Upper EV/MW multiple 0.4x 1.0x 1.8x
REC solar MWs 300 50 25
REC solar EVs 109 49 44
REC solar upper EV 202
Lower EV/MW multiple 0.0x 0.3x 1.3x
REC solar MWs 300 50 25
REC solar EVs 0 16 32
REC solar lower EV 48
A multiple regression analysis is subject to uncertainty, just like any other valuation method. One advantage of statistical models compared with other models is that the uncertainty is easier to quantify. The uncertainty can be expressed by the statistical term “standard error”. The standard error is calculated for each EV/MW multiple and can be used to determine a lower and upper boundary, i.e. a value interval at a certain confidence level. Our analysis is based on a 95% confidence level. This can be interpreted as the EV/MW multiple estimate being within this interval with 95% confidence.
The lower boundaries for the EV/MW multiples on solar PV farm assets are EUR 1.3m, EUR 0.3m and EUR 0.0m for installed, construction and development capacity while the upper boundaries for the EV/MW multiples are EUR 1.8m, EUR 1.0m and EUR 0.4m for installed, construction and development capacity.
We apply the lower and upper boundaries in the valuation of REC’s solar PV assets to determine a lower and an upper value. The table below illustrate the uncertainty of REC’s capacities in different stages of development. Based on these upper and lower boundaries, our analysis indicates that the value of REC’s solar PV assets lies within the interval of approx. EUR 50-200m with 95% certainty.

13A market approach for valuing solar PV farm assets
14
1955
25
16
14
92
2
1
2
1
61
1
24
1
1
2
1
1
1
Appendix A: Summary of transactions in the solar PV farm industry
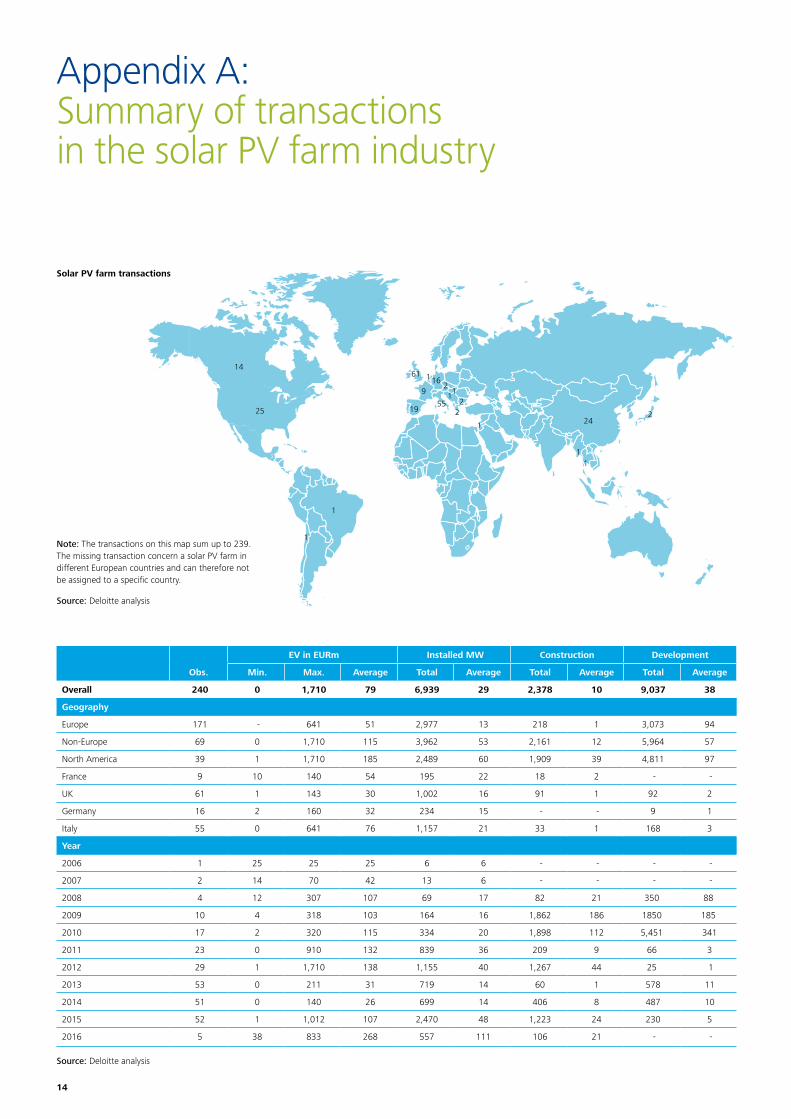
Solar PV farm transactions
Source: Deloitte analysis
Note: The transactions on this map sum up to 239. The missing transaction concern a solar PV farm in different European countries and can therefore not be assigned to a specific country.
Obs.
EV in EURm Installed MW Construction Development
Min. Max. Average Total Average Total Average Total Average
Overall 240 0 1,710 79 6,939 29 2,378 10 9,037 38
Geography
Europe 171 - 641 51 2,977 13 218 1 3,073 94
Non-Europe 69 0 1,710 115 3,962 53 2,161 12 5,964 57
North America 39 1 1,710 185 2,489 60 1,909 39 4,811 97
France 9 10 140 54 195 22 18 2 - -
UK 61 1 143 30 1,002 16 91 1 92 2
Germany 16 2 160 32 234 15 - - 9 1
Italy 55 0 641 76 1,157 21 33 1 168 3
Year
2006 1 25 25 25 6 6 - - - -
2007 2 14 70 42 13 6 - - - -
2008 4 12 307 107 69 17 82 21 350 88
2009 10 4 318 103 164 16 1,862 186 1850 185
2010 17 2 320 115 334 20 1,898 112 5,451 341
2011 23 0 910 132 839 36 209 9 66 3
2012 29 1 1,710 138 1,155 40 1,267 44 25 1
2013 53 0 211 31 719 14 60 1 578 11
2014 51 0 140 26 699 14 406 8 487 10
2015 52 1 1,012 107 2,470 48 1,223 24 230 5
2016 5 38 833 268 557 111 106 21 - -
Source: Deloitte analysis
15A market approach for valuing solar PV farm assets
Appendix B: Regression output – solar PV farm analysis
Regression statistics
R-square 0.87
DF 237
Observations 240
Coefficients Standard error t Stat p-value Lower 95% Upper 95%
Intercept - - - - - -
Installed 2.221 0.057 38.894 0.000 2.109 2.333
Construction 0.137 0.057 2.383 0.009 0.024 0.250
Development 0.142 0.019 7.378 0.000 0.104 0.180
Source: Deloitte analysis
Summary output
16
Appendix C: Regression output adjusted for outliers – solar PV farm analysis
Regression statistics
R-square 0.71
DF 228
Observations 231
Coefficients Standard error t Stat p-value Lower 95% Upper 95%
Intercept - - - - - -
Installed 2.411 0.118 20.444 0.000 2.179 2.642
Construction 0.137 0.041 3.359 0.000 0.057 0.217
Development 0.140 0.014 10.264 0.000 0.114 0.167
Source: Deloitte analysis
Summary output
17A market approach for valuing solar PV farm assets
Appendix D: Regression output adjusted for outliers (2014-2016) - solar PV farm analysis
Regression statistics
R-square 0.65
DF 95.00
Observations 98.00
Coefficients Standard error t Stat p-value Lower 95% Upper 95%
Intercept - - - - - -
Installed 1.515 0.124 12.239 0.000 1.272 1.758
Construction 0.655 0.170 3.861 0.000 0.323 0.988
Development 0.147 0.110 1.338 0.092 (0.068) 0.362
Source: Deloitte analysis
Summary output
18
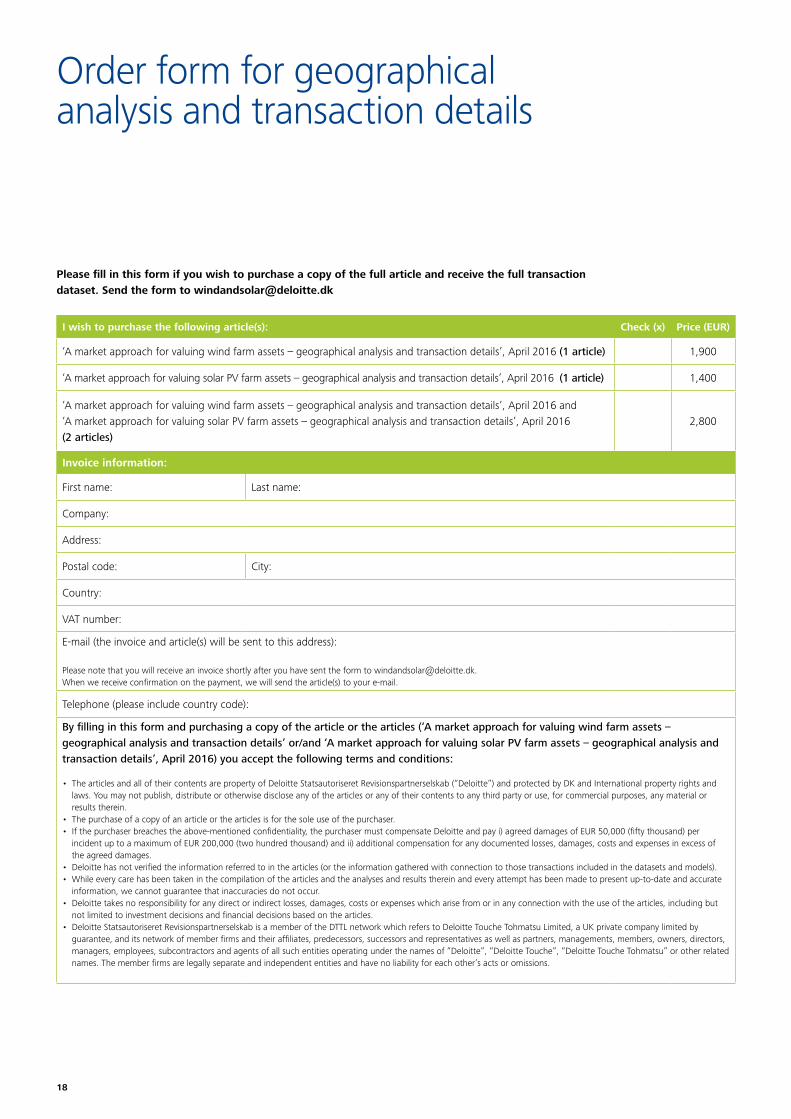
Order form for geographical analysis and transaction details
Please fill in this form if you wish to purchase a copy of the full article and receive the full transaction dataset. Send the form to [email protected]
I wish to purchase the following article(s): Check (x) Price (EUR)
‘A market approach for valuing wind farm assets – geographical analysis and transaction details’, April 2016 (1 article) 1,900
‘A market approach for valuing solar PV farm assets – geographical analysis and transaction details’, April 2016 (1 article) 1,400
‘A market approach for valuing wind farm assets – geographical analysis and transaction details’, April 2016 and ‘A market approach for valuing solar PV farm assets – geographical analysis and transaction details’, April 2016 (2 articles)
2,800
Invoice information:
First name: Last name:
Company:
Address:
Postal code: City:
Country:
VAT number:
E-mail (the invoice and article(s) will be sent to this address):
Please note that you will receive an invoice shortly after you have sent the form to [email protected]. When we receive confirmation on the payment, we will send the article(s) to your e-mail.
Telephone (please include country code):
By filling in this form and purchasing a copy of the article or the articles (‘A market approach for valuing wind farm assets – geographical analysis and transaction details’ or/and ‘A market approach for valuing solar PV farm assets – geographical analysis and transaction details’, April 2016) you accept the following terms and conditions:
• The articles and all of their contents are property of Deloitte Statsautoriseret Revisionspartnerselskab (“Deloitte”) and protected by DK and International property rights and laws. You may not publish, distribute or otherwise disclose any of the articles or any of their contents to any third party or use, for commercial purposes, any material or results therein.
• The purchase of a copy of an article or the articles is for the sole use of the purchaser.• If the purchaser breaches the above-mentioned confidentiality, the purchaser must compensate Deloitte and pay i) agreed damages of EUR 50,000 (fifty thousand) per
incident up to a maximum of EUR 200,000 (two hundred thousand) and ii) additional compensation for any documented losses, damages, costs and expenses in excess of the agreed damages.
• Deloitte has not verified the information referred to in the articles (or the information gathered with connection to those transactions included in the datasets and models).• While every care has been taken in the compilation of the articles and the analyses and results therein and every attempt has been made to present up-to-date and accurate
information, we cannot guarantee that inaccuracies do not occur.• Deloitte takes no responsibility for any direct or indirect losses, damages, costs or expenses which arise from or in any connection with the use of the articles, including but
not limited to investment decisions and financial decisions based on the articles.• Deloitte Statsautoriseret Revisionspartnerselskab is a member of the DTTL network which refers to Deloitte Touche Tohmatsu Limited, a UK private company limited by
guarantee, and its network of member firms and their affiliates, predecessors, successors and representatives as well as partners, managements, members, owners, directors, managers, employees, subcontractors and agents of all such entities operating under the names of “Deloitte”, “Deloitte Touche”, “Deloitte Touche Tohmatsu” or other related names. The member firms are legally separate and independent entities and have no liability for each other’s acts or omissions.
19A market approach for valuing solar PV farm assets
About Financial Advisory
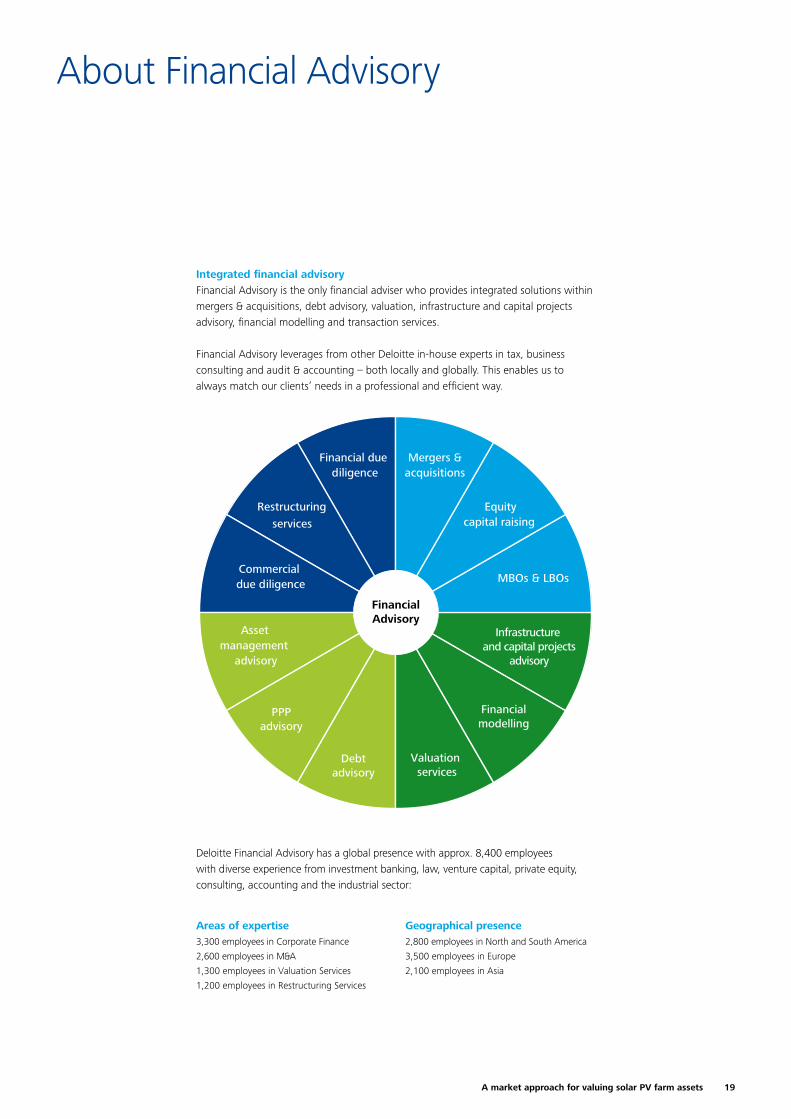
Integrated financial advisoryFinancial Advisory is the only financial adviser who provides integrated solutions within mergers & acquisitions, debt advisory, valuation, infrastructure and capital projects advisory, financial modelling and transaction services.
Financial Advisory leverages from other Deloitte in-house experts in tax, business consulting and audit & accounting – both locally and globally. This enables us to always match our clients’ needs in a professional and efficient way.
Financial due diligence
Mergers &acquisitions
Equitycapital raising
FinancialAdvisory
Restructuring
services
Commercial due diligence MBOs & LBOs
Infrastructure and capital projects
advisory
PPPadvisory
Asset management
advisory
Debtadvisory
Financialmodelling
Valuation services
Deloitte Financial Advisory has a global presence with approx. 8,400 employees with diverse experience from investment banking, law, venture capital, private equity, consulting, accounting and the industrial sector:
3,300 employees in Corporate Finance
2,600 employees in M&A
1,300 employees in Valuation Services
1,200 employees in Restructuring Services
2,800 employees in North and South America
3,500 employees in Europe
2,100 employees in Asia
Areas of expertise Geographical presence

21A market approach for valuing solar PV farm assets
Tinus B. ChristensenPartnerValuation ServicesTel. +45 36 10 31 [email protected]
Thomas BertelsenAssistant DirectorDebt & Capital AdvisoryTel. +45 30 93 53 [email protected]
Jonas F. Johansen Associate Financial ModellingTel. +45 30 56 50 [email protected]
Deloitte contacts
Troels E. LorentzenDirectorFinancial ModellingTel. +45 30 93 56 [email protected]
Steffen LückAssistant DirectorFinancial ModellingTel. +45 23 20 50 [email protected]
Katrine Zacho DahlAssociateFinancial ModellingTel. +45 42 52 82 [email protected]
CopenhagenWeidekampsgade 62300 Copenhagen STel. +45 36 10 20 [email protected]

22
About DeloitteDeloitte provides audit, tax, consulting, and financial advisory services to public and private clients spanning multiple industries. With a globally connected network of member firms in more than 150 countries, Deloitte brings world-class capabilities and high-quality service to clients, delivering the insights they need to address their most complex business challenges. Deloitte has in the region of 200,000 professionals, all committed to becoming the standard of excellence.
Deloitte Touche Tohmatsu LimitedDeloitte refers to one or more of Deloitte Touche Tohmatsu Limited, a UK private company limited by guarantee, and its network of member firms, each of which is a legally separate and independent entity. Please see www.deloitte.com/about for a detailed description of the legal structure of Deloitte Touche Tohmatsu Limited and its member firms.
© 2016 Deloitte Statsautoriseret Revisionspartnerselskab. Member of Deloitte Touche Tohmatsu Limited


