Title A Mass Spectrometric-Derived Cell Surface Protein Atlas Author(s) Bausch-Fluck, D; Hofmann, A; Bock, T; Frei, AP; Cerciello, F; Jacobs, A; Moest, H; Omasits, U; Gundry, RL; Yoon, C; Schiess, R; Schmidt, A; Mirkowska, P; Härtlová, A; Van Eyk, JE; Bourquin, JP; Aebersold, R; Boheler, KR; Zandstra, P; Wollscheid, B Citation Plos One, 2015, v. 10 n. 4, p. e0121314 Issued Date 2015 URL http://hdl.handle.net/10722/227011 Rights This work is licensed under a Creative Commons Attribution- NonCommercial-NoDerivatives 4.0 International License.
Transcript
Title A Mass Spectrometric-Derived Cell Surface Protein Atlas
Rights This work is licensed under a Creative Commons Attribution-NonCommercial-NoDerivatives 4.0 International License.
RESEARCH ARTICLE
A Mass Spectrometric-Derived Cell SurfaceProtein AtlasDamaris Bausch-Fluck1,12, Andreas Hofmann1¤a, Thomas Bock1¤b, Andreas P. Frei1¤c,Ferdinando Cerciello1,2¤d, Andrea Jacobs1¤e, Hansjoerg Moest1¤a, Ulrich Omasits1,12,Rebekah L. Gundry3, Charles Yoon4, Ralph Schiess1¤f, Alexander Schmidt1¤g,Paulina Mirkowska1,5, Anetta Härtlová6¤h, Jennifer E. Van Eyk7¤i, Jean-Pierre Bourquin5,Ruedi Aebersold1,8,9, Kenneth R. Boheler10,11, Peter Zandstra4, BerndWollscheid1,12*
1 Institute of Molecular Systems Biology, ETH Zurich, Zurich, Switzerland, 2 Laboratory of MolecularOncology, University Hospital Zurich, Zurich, Switzerland, 3 Department of Biochemistry, Medical College ofWisconsin, Wisconsin, Milwaukee, United States of America, 4 Institute for Biomaterials & BiomedicalEngineering, University of Toronto, Toronto, Canada, 5 Oncology Research Laboratory, University ChildrenHospital Zurich, Zurich, Switzerland, 6 Centre of Advanced Studies, Faculty of Military Health Sciences,University of Defense, Hradec Kralove, Czech Republic, 7 Department of Medicine, Biological Chemistryand Biomedical Engineering, Johns Hopkins University School of Medicine, Baltimore, Maryland, UnitedStates of America, 8 Center for Systems Physiology and Metabolic Diseases, Zurich, Switzerland, 9 Facultyof Science, University of Zurich, Zurich, Switzerland, 10 SCRMC, LKS Faculty of Medicine, Hong KongUniversity, Hong Kong, Hong Kong SAR, 11 Division of Cardiology, Johns Hopkins University School ofMedicine, Baltimore, Maryland, United States of America, 12 Department of Health Sciences andTechnology, BMPP, ETH Zurich, Zurich, Switzerland
¤a Current Address: Novartis Institute of Biomedical Research, Novartis, Basel, Switzerland¤b Current Address: European Molecular Biology Laboratory, Heidelberg, Germany¤c Current Address: Department of Microbiology and Immunology, Stanford School of Medicine, Stanford,California, United States of America¤d Current Address: James Thoracic Center, James Cancer Center, The Ohio State University MedicalCenter, Columbus, Ohio, United States of America¤e Current Address: Institute of Molecular Life Sciences, University of Zurich, Zurich, Switzerland¤f Current Address: ProteoMediX AG, Schlieren, Switzerland¤g Current Address: Proteomics Core Facility, Biozentrum, University of Basel, Basel, Switzerland¤h Current Address: College of Life Sciences, University of Dundee, Dundee, United Kingdom¤i Current Address: Cedars-Sinai, Clinical Biosystem Research Institute, Los Angeles, California, UnitedStates of America* [email protected]
AbstractCell surface proteins are major targets of biomedical research due to their utility as cellular
markers and their extracellular accessibility for pharmacological intervention. However, in-
formation about the cell surface protein repertoire (the surfaceome) of individual cells is only
sparsely available. Here, we applied the Cell Surface Capture (CSC) technology to 41
human and 31 mouse cell types to generate a mass-spectrometry derived Cell Surface Pro-
tein Atlas (CSPA) providing cellular surfaceome snapshots at high resolution. The CSPA is
presented in form of an easy-to-navigate interactive database, a downloadable data matrix
and with tools for targeted surfaceome rediscovery (http://wlab.ethz.ch/cspa). The cellular
surfaceome snapshots of different cell types, including cancer cells, resulted in a combined
dataset of 1492 human and 1296 mouse cell surface glycoproteins, providing experimental
evidence for their cell surface expression on different cell types, including 136 G-protein
coupled receptors and 75 membrane receptor tyrosine-protein kinases. Integrated analysis
PLOS ONE | DOI:10.1371/journal.pone.0121314 April 20, 2015 1 / 22
OPEN ACCESS
Citation: Bausch-Fluck D, Hofmann A, Bock T, FreiAP, Cerciello F, Jacobs A, et al. (2015) A MassSpectrometric-Derived Cell Surface Protein Atlas.PLoS ONE 10(4): e0121314. doi:10.1371/journal.pone.0121314
Academic Editor: Hong Wanjin, Institute ofMolecular and Cell Biology, UNITED STATES
Received: November 22, 2014
Accepted: January 30, 2015
Published: April 20, 2015
Copyright: This is an open access article, free of allcopyright, and may be freely reproduced, distributed,transmitted, modified, built upon, or otherwise usedby anyone for any lawful purpose. The work is madeavailable under the Creative Commons CC0 publicdomain dedication.
Data Availability Statement: The MS-basedproteomics data have been deposited to theProteomeXchange Consortium (http://www.boldsystems.org/index.php/Public_SearchTerms?query=DS-RONPING) via the PRIDE partnerrepository with the dataset identifier PXD000589.
Funding: This study was supported by the NationalCenter of Competence in Research Neural Plasticityand Repair of the Swiss National ScienceFoundation, Center for Proteomics, http://www.nccr-neuro.uzh.ch (BW); InfectX and BIP project within theSwiss Initiative in Systems Biology, http://www.systemsx.ch/projects/research-technology-and-
of the CSPA reveals that the concerted biological function of individual cell types is mainly
guided by quantitative rather than qualitative surfaceome differences. The CSPA will be
useful for the evaluation of drug targets, for the improved classification of cell types and for
a better understanding of the surfaceome and its concerted biological functions in complex
signaling microenvironments.
IntroductionAccording to traditional phenotypic classification systems, the human body contains approxi-mately 210 functionally distinct cell types [1,2]. Although knowledge about molecular featuresof these cell types is gathered at ever increasing speed, detailed information about the expressedcell surface protein repertoire of individual cell types is sparse due to technological limitations[3,4]. However, such information is a prerequisite to understand concerted biological functionsof cell types in complex signaling environments. The surfaceome represents the subgroup ofproteins at the plasma membrane with exposed domains towards the extracellular space in-cluding for example G-protein coupled receptors, receptor tyrosine kinases and integrins. Thissubgroup of proteins are of particular interest for basic and applied research due to theirunique signaling functions, enabling, limiting and orchestrating cellular communication andinteractions [5]. It is predicted, that the qualitative and quantitative cellular surfaceomes aremore variable than other protein groups within the cell [6].
Genomic and transcriptomic technologies can provide informative hints about proteins ex-pressed, but ultimately protein abundance, location and protein isoforms, including posttrans-lational modifications, must be directly measured and quantified in the cell surface location inorder to deduce actual signaling capacities and in turn, functional consequences [7,8]. GlobalmRNA and protein quantification studes were already valuable in this respect, but have shownthat correlation between mRNA levels and protein abundance is specifically low in relation tocell surface proteins [6].
Antibodies against cell surface proteins provided initial information and enabled the con-struction of limited surfaceome maps. The Cluster of Differentiation (CD) antigen panels [9],consisting mainly of antibodies that recognize cell surface proteins, led to the initial definitionand partial characterization of various cell types of the hematopoietic system. This concept ofdefining and using cell surface protein markers for cell sorting and enrichment is beneficial formany research areas, as in the stem cell community [10–12] and in oncology. New cell surfacemarkers for cancer detection, histological diagnosis and prognosis, as well as therapeutic inter-vention has been one of the key focus areas for academic, as well as industrial research for thelast three decades. These combined efforts led to the discovery of over a dozen therapeutic anti-bodies. Rituximab, targeting CD20 [13], and Herceptin [14], targeting the epidermal growthfactor receptor 2, are two prime examples. Multiplexed detection of cell surface proteins withantibodies in the form of serial antibody detection, parallel antibody arrays, bead-based for-mats, and most recently and noticeably mass cytometry have emerged as powerful tools tostudy the concerted co-expression of cell surface proteins [15–18]. Information gathered fromsuch antibody-based technologies have been made easily accessible in databases such as Uni-Prot (www.uniprot.org) [19], neXtProt (www.nextprot.org), Human Proteinpedia [20], andthe Human Protein Atlas [17], in the latter already with tissue-specific resolution. However,antibody-based exploration of cell surface proteins is hampered by the availability of suitableantibodies to probe specific proteins.
The Cell Surface Protein Atlas
PLOS ONE | DOI:10.1371/journal.pone.0121314 April 20, 2015 2 / 22
development-projects/completed-rtd-projects/infectx-2010-201 (BW); Mueller Fellowship from the Ph.D.Program in Molecular Life Sciences in Zurich (AH);Neuroscience Center Zurich Fellowship, http://www.neuroscience.ethz.ch/education/grant_applications(TB); Interdisciplinary PhD Project of SystemsX.ch,the Swiss Initiative of Systems Biology, Project 22009, http://www.systemsx.ch/projects/interdisciplinary-phd-projects/iphd-projects-2009/(HM); MD-PhD fellowship of the Swiss NationalScience Foundation, http://www.snf.ch/en/funding/careers/md-phd-programme/Pages/default.aspx(FC); Advanced European Research Council grant#233226, http://erc.europa.eu/funding-and-grants(RA); Swiss National Science Foundation (grant #3100A0-107679), http://www.snf.ch/en/funding/ (RA);National Institutes of Health (NIH Grant #U01CA152813), http://grants.nih.gov/grants/oer.htm(RA). The funders had no role in study design, datacollection and analysis, decision to publish, orpreparation of the manuscript.
Competing Interests: The authors have declaredthat no competing interests exist.
Technological advancements in mass spectrometry (MS)-based proteomic technologieshave enabled, in principle, the broad measurement of proteomes of individual cell types andwhole organisms [21–23]. However, cell surface proteins are often underrepresented in thesestudies due to their low abundance and biochemical properties, such as the hydrophobicity oftheir transmembrane domains. Several biochemical technologies for enriching and analyzingmembrane proteins by MS have been developed that typically employ initial density centrifu-gation [24,25], affinity enrichment by lectins [26], chemical tagging reagents [27,28], metaboliclabeling [29] or even in situ labeling [30,31]. A complementary approach for the enrichment ofplasma membranes is the employment of colloidal silica-beads [32,33]. Several reviews coverthe technical challenges of analyzing plasma membrane proteomes [3,34] or in particular cellsurface proteins [35] and the benefit thereof for biomedical research [36].
We previously developed the chemoproteomic Cell Surface Capture (CSC) technology [37],which enables the unbiased and selective discovery-driven assessment of the surfaceome,through a chemical tagging approach on viable cells. The CSC technology utilizes the fact thatmost cell surface proteins are predicted to be glycosylated. With the affinity enrichment of sole-ly N-glycosylated hydrophilic glycopeptides it circumvents the biochemical difficulty of han-dling proteins containing hydrophobic transmembrane. This approach results in qualitativeand quantitative information of the cellular surfaceome, which proved to be valuable in thecontext of biomedical applications [38–43].
Here, we used the CSC technology to generate surfaceome snapshots of 78 different humanand murine cellular species and to build a Cell Surface Protein Atlas (CSPA) presented in theform of an easy-to-navigate interactive database and downloadable data matrices (http://wlab.ethz.ch/cspa). The CSPA provides experimental evidence on the protein level that quantitativesurfaceome differences prevail over qualitative differences. Furthermore, we provide an associ-ated toolbox, which expands and enables the targeted rediscovery of the identified surfaceometo nearly 1500 human and 1300 mouse cell surface proteins.
Results
The Cell Surface Protein Atlas at cellular resolutionThe application of the CSC technology across community-defined cell types enabled us to mea-sure surfaceome snapshots and to build the first Cell Surface Protein Atlas (CSPA) with cellularresolution. The CSC technology is based on tagging oxidized extracellular exposed glycanswith a bifunctional cross linker for subsequent affinity enrichment and MS-based identificationof formerly N-glycosylated peptides and their corresponding proteins. The enriched and for-merly N-glycosylated peptides can be identified in the MS since the CSC protocol leads to amodification of the mass of the asparagine (N). The used panel of 47 human and 31 mouse cel-lular species (S1 Table) consists of cells derived from the three primary germ layers, endoderm(3 human, 1 murine cell lines), mesoderm (34 human, 16 murine cell lines) and ectoderm (10human, 5 murine cell lines), as well as embryonic and adult stem cells with various degrees oflineage commitment. We collected surfaceome snapshots from various cell lines broadly usedin research (e.g. A431, HeLa, HEK-293, and Jurkat T cells) as well as cell types used in morespecialized research areas (e.g. primary natural killer (NK) cells and induced pluripotent stem(iPS) cells). Furthermore, cancer cell lines, including those derived from renal carcinoma, ade-nocarcinoma, sarcoma, melanoma and glioblastoma were analyzed. Three tissues samples werealso included in the analysis (brain tumor, lymphoma and spleenocytes). The complete list ofanalyzed cellular species, descriptions, and references can be found in S1 Table.
The MS-based identification of cell surface exposed glycoproteins was done in two steps(Fig 1). First, probability scored peptide identifications were derived by using the classical
The Cell Surface Protein Atlas
PLOS ONE | DOI:10.1371/journal.pone.0121314 April 20, 2015 3 / 22
protein database (UniProt) search algorithm SEQUEST, which matches the acquired peptidefragmentation pattern to theoretically derived spectra [44,45]. Second, spectra derived fromidentified peptides above a high confidence probability score (0.9) were used to build a spectrallibrary [46]. This spectral library contains high quality annotated experimental spectra derivedfrom cell surface glycopeptides. We used the SpectraST pattern matching and scoring algo-rithm to search the generated mass spectra against the high quality spectral library, which ledto the assignment of additional peptide identifications of previously low scored peptide spectra,resulting in an average increase of protein identifications of 19% per cell type compared to clas-sical protein identification strategies (Table D in S1 File). The CSPA spectral library is a new re-search tool, which enables the efficient scoring and rediscovery of cell surface glycopeptidesand proteins by using the SpectraST peptide search engine.
The CSC technology and spectral library-based strategy revealed glycoproteins in the formof surfaceome snapshots with cellular resolution. On average, we detected 284 surfaceome-spe-cific glycoproteins (277 in human and 294 in mouse samples) per CSC-analyzed cellular spe-cies (Fig 2 and Table D in S1 File). A subgroup of surfaceome members of special interest arethe well-characterized CD antigens [9]. We detected on average 60 human and 90 mouse CDantigens per cell type. Notably, the majority of detected proteins were non-CD annotated pro-teins, surfaceome members invisible to most research strategies using affinity-based probes.Even though individual cellular species were profiled with different depth, the number of bio-logical and technical replicates did not directly correlate with the detected surfaceome size(Fig 2), suggesting that either cellular species differ in their susceptibility for CSC analysis orvary substantially in the number and abundance of cell surface exposed proteins.
The analysis of CSPA surfaceome snapshots further reveals a high degree of common pro-teins across all 47 human and 31 mouse cell types, with approximately 85% of the glycoproteinsidentified being present on more than one of the tested cell types (Fig 3 and Table B andTable C in S1 File). However, the remaining 15% (roughly 200 proteins) were not evenly dis-tributed over the different cell types, thus not for every cell type there were specific proteins de-tected. Most of the proteins seen on one cell type were detected on one of those cell lines with
Fig 1. Workflow for building the CSPAwith cellular resolution. Cell types of various origins wereanalyzed using the CSC technology. LC-MS/MS analyses and sequence database searches wereperformed. The resulting peptide-spectrummatches were used to build a spectral library, against whichspectra from all the LC-MS/MS runs were matched. The identified N-glycoproteins were subjected to label-free relative quantification. The quality filtered protein list for N-glycoproteins from the sequence databaseand spectral library search was incorporated into the Cell Surface Protein Atlas, enriched with relativeprotein abundances.
doi:10.1371/journal.pone.0121314.g001
The Cell Surface Protein Atlas
PLOS ONE | DOI:10.1371/journal.pone.0121314 April 20, 2015 4 / 22
the largest detected surfaceomes (like U-251 MG or HEK). This result provides further evi-dence that cell types usually cannot be inferred based on a single glycoprotein identification.Importantly, we did not observe major differences in functional annotation between proteinsdetected on a few cell types compared with proteins detected on more than 20 different celltypes. As expected, most cell surface glycoproteins have functions associated with cell surfacelocalization (e.g. receptors or transporters), indicating reliable protein identifications, even forproteins only detected on one cellular species (Fig 3).
The surfaceome snapshots at cellular resolution provided here are accessible in tab-delim-ited flat files (Table A, B and C in S1 File) and in an annotated form within the in-house devel-oped and easy-to-navigate interactive Laboratory information management system (LIMS),termed SISYPHUS (http://wlab.ethz.ch/cspa). The SISYPHUS-CSPA enables the interrogationof the generated surfaceome snapshots in the context of MS and selected biological annotations(UniProt, Gene Ontology, STRING, PROTTER [47] and predictions (TMHMM, SignalP). The
Fig 2. Cell-specific surfaceome sizes in relation to biological and technical replicates. The individualcell types investigated are listed with their surfaceome sizes (blue and purple bars from the left, blue = CDproteins, purple = other surface proteins). Adherent cells are labeled with dark green bars, soluble cells arelabeled with light green bars, and cells with other growth properties (e.g. spheres) are not labeled. The barsfrom the right represent the number of LC-MS/MS runs performed. The color-code symbolizes the numbers ofindependent CSC experiments performed for that cell type (yellow = 1, orange = 2, red = 3).
doi:10.1371/journal.pone.0121314.g002
The Cell Surface Protein Atlas
PLOS ONE | DOI:10.1371/journal.pone.0121314 April 20, 2015 5 / 22
SISYPHUS-CSPA enables non-expert users to query the provided information apart from thedownloadable list format on the cellular, protein, and peptide level (Fig 4). As an example, it isimmediately visible whether a protein of interest has also been identified in any other surfa-ceome provided in the CSPA, enabling for example, informed selection of other cell types forantibody testing.
Relative quantitative cell type specific surfaceome mapsQualitative protein panels containing multiple protein markers, i.e. CD panels, have beenshown to be useful as cell-type classifiers [9]. Accordingly, quantitative protein abundance in-formation on a broader range of cell surface proteins could aid in the refinement of cell surfaceprotein panels for the discrimination of functionally different cellular species. Therefore, label-free quantification based on acquired peptide ion signals (peak area) from all detected formerlyN-glycosylated peptides was used to determine abundance levels of 1438 human and 1259 mu-rine proteins. The CSC-detectable surfaceome abundance range was up to 5 orders of magni-tude (Table E and F in S1 File). The subset of 232 quantified human CD proteins is depicted inFig 5, reflecting the abundance range of the whole dataset. CD63 and CD148 are highly abun-dant on certain cell types including the glioblastoma cell lines LN229 and T98G, and CD29(even though detected on nearly every cell type) and CD142 are generally found at the lowerend of the detected abundance range. None of the quantified CD proteins were highly express-ed on all evaluated cell types. Protein-type specific quantitative variability across cell lines wasin fact detected for essentially all proteins, suggesting that cell-type specific differences stemlargely from quantitative differences within the set of membrane proteins, rather than fromprotein identities. Nevertheless, cell specific protein markers were also detected (Fig 5,highlighted), including immunoglobulin-like receptors CD158b2, CD158f1, CD158h, CD158i,CD159a and CD161 [48] only found on NK cells, as expected. CD30 is known as a characteris-tic Hodgkin lymphoma antigen [49], and even though we detected it also on other cell types,CD30 was expressed at the highest level on the Hodgkin lymphoma cell lines (HLDM2,KMH2, L428, L540). Similarly, CD172a (SIRPA) was found on the majority of cellular speciesbut was most highly expressed on glioblastoma cells, reflecting published data that showed
Fig 3. Distribution of protein occurrences over different cellular species. Proteins were classified into different bins (counts) based on the number ofdifferent cellular species on which they were detected (different observations). Since only 31 mouse cell types were investigated, the purple bar covers 1 to31 observations. Human proteins with 1 or 2 observations and proteins with more than 20 observations are shown in two pie charts. The most prominentmolecular functions found in both groups were binding, catalytic activity, receptor and transporter. Molecular functions were annotated by Gene Ontology.
doi:10.1371/journal.pone.0121314.g003
The Cell Surface Protein Atlas
PLOS ONE | DOI:10.1371/journal.pone.0121314 April 20, 2015 6 / 22
high expression of CD172a in brain [50]. CD172a was recently identified as a marker for cardi-omyocytes derived from human pluripotent stem cells [51] and we compared CD172a expres-sion amongst the mouse cell types within the CSPA (Table F in S1 File). CD172a was presenton most murine cell types with expression levels rising from embryonic body (159–2_EB,R1_EB) to precursor cells (159–2_NP, R1_definitiveNCS) and with very high expression levelson induced pluripotent stem cells (2D4-iPS, TTF-1-iPS). The expression levels on embryonicstem cells reveal a diverse picture, as we did not detect CD172a on 159–2_ES cells, observedlow expression levels on D3 cells, and found medium to high expression levels on E14Tg2a andon R1 cells. In summary, our analyses demonstrate that the CSPA is a valuable biological re-source, which provides concerted protein expression information in the form of surfaceomemaps of 78 human and mouse cell types. The quantitative expression matrix allows for bothcomparative analyses of detected cell surface proteins and categorization of cell surface proteinsbased on relative quantitative abundance levels.
Fig 4. SISYPHUS screenshot of CD54 protein card. The protein card view is displayed for CD54 detected on HBL-1 cells. Annotations from various datasources (UniProt ID, UniProt Accession, ENTREZ gene, CD), UniProt keywords, subcellular locations, functions, molecular features, and tissue specificitiesare displayed (if known). The peptides identified from CD54 are listed on the bottom, together with the respective peptide probabilities, charge states, andfurther peptide-specific information. On the right, GO annotations are displayed, and by using the button on the top (“This protein was identified in 40 Exps”) anew window can be opened, displaying other cellular species on which CD54 was found.
doi:10.1371/journal.pone.0121314.g004
The Cell Surface Protein Atlas
PLOS ONE | DOI:10.1371/journal.pone.0121314 April 20, 2015 7 / 22
Fig 5. Expressionmatrix of human CD proteins. The 239 quantified CD proteins are listed according to their annotated number and their computedexpression values in 47 human cell lines. Color code indicates expression level (blue = highest expression, yellow = lowest expression, light yellow = notdetected). The cells are grouped according to their germ line origin (green = endoderm, blue = mesoderm, red = ectoderm) and functional groups. The mostdistinct cellular groups are annotated.
doi:10.1371/journal.pone.0121314.g005
The Cell Surface Protein Atlas
PLOS ONE | DOI:10.1371/journal.pone.0121314 April 20, 2015 8 / 22
Defining the surfaceomeWe combined the surfaceomes of the individual cell types to derive a composite surfaceomedataset, resulting in 1492 human and 1296 mouse experimentally verified proteins (Table Aand B in S2 File). This experimentally derived and curated dataset was generated by filtering allthe measured data according to the technical specifications of peptides observable by CSC.Since UniProt is currently the best curated proteomics database also providing subcellular lo-calization information, we used these annotations for the comparative classification of our ex-perimentally derived composite surfaceome. Proteins with UniProt keywords Cell junction,Cell membrane, Secreted, (Signal peptide AND GPI-anchor) or (Signal peptide AND Transmem-brane) were regarded as high-confidence surfaceome proteins (1039 human and 881 mouseproteins, Table A and B in S2 File). 247 human and 242 mouse proteins from the remainingpool have predicted transmembrane domains (but none of the above keywords assigned) andare therefore regarded as putative surfaceome proteins. The functional classification of theseproteins and the empirical data of this study provide a basis to refine the annotation of the sur-faceome. A remaining set of 206 human and 173 mouse proteins were classified as unspecific.These unspecific proteins were co-purified mainly due to their high abundance in the biologicalsamples. In contrast to affinity enriched N-glycosites, chemical deamidation of asparagines isknown to occur in solution. Among these co-purified peptides are nevertheless proteins linkedto extracellular matrix (as procollagen transferases) and cytoskeletal protein (as tubulin),which could very well be associated with or present at the cell surface. Overall, the compositesurfaceome contains 240/197 CD proteins, 346/315 receptors; of which 69/67 are G-proteincoupled receptors and 39/36 receptor tyrosine kinases, and 184/207 transporters (human/mouse).
Topology prediction of cell surface proteinsSince the CSC technology is based on the enrichment of N-glycopeptides exposed to the extra-cellular space, the N-glycopeptides within the CSPA could deliver cues and restraints for confir-mation of predicted or known protein topology, or in turn for protein topology correction. Wecompared the identified peptides of the CSPA proteins with predicted topology by using thePHOBIUS transmembrane prediction algorithm (http://www.ebi.ac.uk/Tools/pfa/phobius/,[52]) and found several experimentally observed N-glycopeptides located on predicted intracel-lular domains, thus conflicting with the empirical data. By using the identified N-glycosites asconstraints for the topology, we were able to propose refined topology models for 51 humanand 39 mouse proteins (S3 File). In the majority of cases, simply flipping the protein within themembrane layer yielded topologies in concordance with the CSC-identified N-glycopeptides.Furthermore, our data suggests that the topology prediction often fails for proteins with many(>10) TM domains (e.g. Q9HD45 in S3 File). This might be caused by the difficulty in definingthe exact length of TM helices, which are known to range from 10 to 40 amino acids [53]. Verylong TM helices could therefore be wrongly predicted as two short TM helices and vice versa,highlighting the need for experimental validation and the value of the CSPA and the CSC tech-nology for experimental topology confirmation and possibly correction.
The CSPA toolbox for surfaceome rediscoveryThe surfaceome snapshots provided within the CSPA are of direct interest as a clinical resourcefor prioritizing cell surface-accessible biomarker candidates or targets for therapeutic anti-body-drug conjugates. Therefore, the CSPA surfaceome snapshots provide the basis for simpli-fied directed and targeted discovery and quantification of the previously detected surfaceomein other cells of interest. To facilitate fast MS-based detection and rediscovery of low abundant
The Cell Surface Protein Atlas
PLOS ONE | DOI:10.1371/journal.pone.0121314 April 20, 2015 9 / 22
N-glycosylated cell surface proteins in future surfaceome experiments, we generated three dif-ferent toolboxes. First, human and murine spectral libraries created with SpectraST (S4 and S5Files) [46] are provided. Spectral library searching can be beneficial compared to classical se-quence databases searching in terms of speed, number of identifications, and handling of noise[46]. The libraries contain decoy spectra in order to allow for estimation of the false discoveryrate. We provide the spectral cell surface libraries in two flavors, one with those asparagineswithin N-glycosylation consensus motif (N-X-S/T) deamidated (Folder A in S4 File and in S5File) and one completely unmodified version, where glycopeptides can be searched with vari-able modifications on asparagine residues (Folder B in S4 File and in S5 File).
A second toolset derived from our CSPA project includes MS coordinates for directed andtargeted quantitative workflows [54]. In contrast to discovery-driven shotgun proteomic exper-iments, directed and targeted workflows allow for the instruction of the MS to selectively ana-lyze only peptides pre-selected based on prior information. Based on the observed data withinthe CSPA, N-glycopeptides from proteins of interest can now be selected and specifically ana-lyzed in any sample by using the instrument-specific inclusion list mode (Table A and B in S6File).
CSPA also incorporates a third toolset, selected reaction monitoring (SRM) assays for theselective and multiplexed targeting of surfaceome members [55,56]. Based on the observed sur-faceome-derived peptides, their fragmentation patterns, and consensus spectra, we extractedthe most intense ions. This list of transitions provides an advanced starting point for the sensi-tive analysis and accurate quantification of the surfaceome in future experiments (Table C inS6 File). Together with spiked-in reference peptides, the CSPA observed N-glycopeptides couldbe analyzed in an absolute quantitative manner.
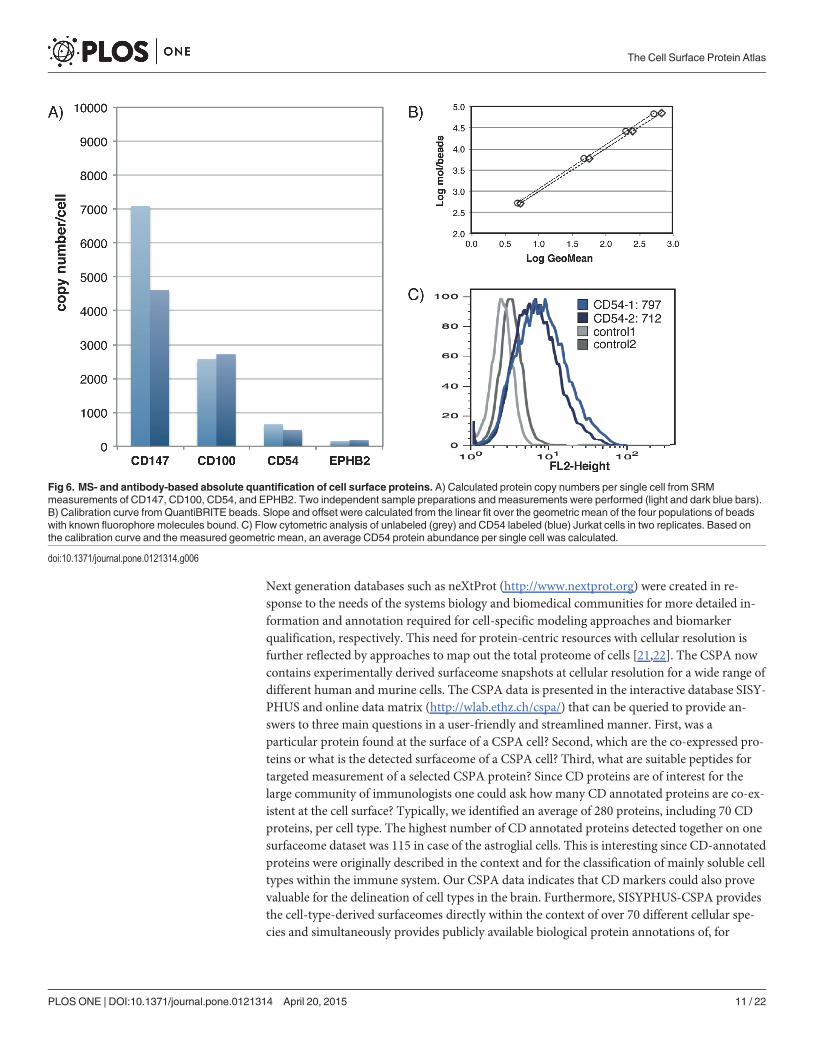
To exemplify the applicability of such SRM workflows based on CSPA data, we chose fourcell surface proteins, basigin (CD147), ephrin type-B receptor 2 (EPHB2), intercellular adhe-sion molecule 1 (CD54), and semaphorin-4D (CD100), and quantified their expression on Jur-kat T cells by SRM. Except for CD147, where only one observed N-glycosite could be used, twopreviously observed N-glycosites per protein were chosen for quantification and measuredwith three transitions (MS1-MS2 mass/charge pairs) each (Table D in S6 File). To absolutelyquantify the proteins of interest, we spiked the isotopically labeled analogs of previously ob-served peptides into the CSC samples in a known concentration. After MS analysis, this inter-nal standard enabled the estimation of absolute protein copy numbers (Fig 6A). The yield forglycoprotein isolation and capturing through the CSC protocol was estimated by monitoringthe abundance of a control glycoprotein (transferrin). The accuracy of these SRMmeasure-ments was assessed by quantitative flow cytometry (QuantiBRITE) for the cell surface expres-sion of CD54. Unfortunately, there were no assays available at the time for the other proteins.The SRMmeasurements revealed approximately 550 CD54 molecules per cell (Fig 6A), whichcorrelated well with the 750 molecules per cell obtained from the QuantiBRITE measurements(Fig 6B & 6C). This experiment demonstrated the applicability of the proposed strategy for sys-tematic, targeted measurements of cell surface protein panels in order to obtain reliable quanti-fication of selected cell surface proteins across many samples.
Discussion
CSPA as a resource for systems biologyBiologists in the “omics” fields rely on publicly available database information in order to turnthe ever-increasing quantities of data into applicable knowledge. Although protein-centric da-tabases, such as UniProt, contain valuable general information about proteins and their pro-teins, they do lack information about co-expression of protein pools in the context of cell types.
The Cell Surface Protein Atlas
PLOS ONE | DOI:10.1371/journal.pone.0121314 April 20, 2015 10 / 22
Next generation databases such as neXtProt (http://www.nextprot.org) were created in re-sponse to the needs of the systems biology and biomedical communities for more detailed in-formation and annotation required for cell-specific modeling approaches and biomarkerqualification, respectively. This need for protein-centric resources with cellular resolution isfurther reflected by approaches to map out the total proteome of cells [21,22]. The CSPA nowcontains experimentally derived surfaceome snapshots at cellular resolution for a wide range ofdifferent human and murine cells. The CSPA data is presented in the interactive database SISY-PHUS and online data matrix (http://wlab.ethz.ch/cspa/) that can be queried to provide an-swers to three main questions in a user-friendly and streamlined manner. First, was aparticular protein found at the surface of a CSPA cell? Second, which are the co-expressed pro-teins or what is the detected surfaceome of a CSPA cell? Third, what are suitable peptides fortargeted measurement of a selected CSPA protein? Since CD proteins are of interest for thelarge community of immunologists one could ask how many CD annotated proteins are co-ex-istent at the cell surface? Typically, we identified an average of 280 proteins, including 70 CDproteins, per cell type. The highest number of CD annotated proteins detected together on onesurfaceome dataset was 115 in case of the astroglial cells. This is interesting since CD-annotatedproteins were originally described in the context and for the classification of mainly soluble celltypes within the immune system. Our CSPA data indicates that CD markers could also provevaluable for the delineation of cell types in the brain. Furthermore, SISYPHUS-CSPA providesthe cell-type-derived surfaceomes directly within the context of over 70 different cellular spe-cies and simultaneously provides publicly available biological protein annotations of, for
Fig 6. MS- and antibody-based absolute quantification of cell surface proteins. A) Calculated protein copy numbers per single cell from SRMmeasurements of CD147, CD100, CD54, and EPHB2. Two independent sample preparations and measurements were performed (light and dark blue bars).B) Calibration curve from QuantiBRITE beads. Slope and offset were calculated from the linear fit over the geometric mean of the four populations of beadswith known fluorophore molecules bound. C) Flow cytometric analysis of unlabeled (grey) and CD54 labeled (blue) Jurkat cells in two replicates. Based onthe calibration curve and the measured geometric mean, an average CD54 protein abundance per single cell was calculated.
doi:10.1371/journal.pone.0121314.g006
The Cell Surface Protein Atlas
PLOS ONE | DOI:10.1371/journal.pone.0121314 April 20, 2015 11 / 22
example, gene ontology categories or known protein isoforms. The CSPA database providedhere is unique, and complementary to the aforementioned resources in respect to the experi-mental focus on solely cell surface exposed proteins and not the total membranome or prote-ome, irrespective of specific protein localization. Therefore, the CSPA contains valuableinformation about concerted protein expression and abundances in the surfaceome location,which is critical for understanding complex cellular communication at the molecular level.
Tools for the rediscovery of cell surface proteinsThe CSPA expands our detection ability to nearly 1500 human and 1300 mouse cell surfaceproteins. Up until now, a lack of suitable tools for detection, in particular antibodies, most sur-faceome members identified by our study could not easily be detected otherwise. Additionally,the lack of applicable parallel detection technologies has led to the characterization of only asmall subset of proteins on the cell surface. About 370 antibodies against CD-annotated pro-teins have been used for flow cytometry-based on DotScan [15] testing. These antibodies couldtheoretically be used in batches up to twelve (flow cytometry) or sixty antibodies (DotScan) inparallel to scan cell lines in a serial fashion. However, CD annotated proteins account for lessthan 20% of the composite surfaceome and the specificity of most CD antibodies is actually notknown. To alleviate this issue, we also provide a toolbox including spectral libraries and transi-tion lists, enabling the selective and targeted detection of cell surface proteins. The surfaceometargeting workflows are based on state-of-the-art MS technologies, such as AIMS, SRM, andSWATH technology, which allows for reproducible and/or absolute quantitative assessment ofcell surface protein expression. Limited independent validation of absolute quantitative cellsurface protein estimations indicated the usefulness of the MS assay protocols provided as partof CSPA (Fig 6). The MS coordinates allow for systematic profiling of the surfaceome: For ex-ample, one could evaluate tumor model cell lines to establish pharmaceutically relevant tumorfingerprints. Thus, the CSPA not only provides detailed information for the ‘omics’ communi-ty, but its associated tools also enable the future quantitative interrogation of the surfaceomedata space for biological and pharmaceutical applications.
Towards the characterization of the complete surfaceomeAlthough the CSPA represents the most extensive experimentally-derived surfaceome databaseso far, the provided surfaceome maps are not complete. The issue of incompleteness is alsofaced by other discovery-driven and non-targeted databases such as PHOSIDA [57], Phospho-Pep [58], and PhosphoSitePlus [59]. The reasons for this incompleteness are manyfold and aremainly due to a lack of sensitivity of currently available MS instrumentation, limitations of ourworkflow (like N-glycosylation) in combination with biological peculiarities (like other unan-ticipated modifications). The non-detection of a particular peptide does not rule out the ab-sence of a particular glycoprotein and similar to other strategies, its absence needs to beindependently verified. Nevertheless, comparisons of the CSPA in its current form to otherdatasets in the public domain is informative. Comparisons with the quantified proteome of thehuman cell line U2-OS [23] reveals that the proteins within the CSPA on the same cells spanthe entire abundance range with a bias towards lower abundance proteins. Specifically, the pro-teins classified in our analysis as “high confidence” are predominantly located in the lowerabundance range of the Beck et al. dataset, whereas contaminant proteins are clearly of higherabundance. Also the limited SRM analysis of the four cell surface proteins presented here, sup-ports this finding. This implies three conclusions: First, contaminant proteins are present inthe CSPA mainly due to their high abundance. Second, specifically enriched glycoproteins
The Cell Surface Protein Atlas
PLOS ONE | DOI:10.1371/journal.pone.0121314 April 20, 2015 12 / 22
from the cell surface are generally lower abundant. Third, the proteins that are informative of acell type tend to be present in lower abundance.
Quantification of cell surface proteins increases discriminatory powerbetween cellular speciesSignificant research efforts have been made to define specific cell surface markers for variousapplications and resarch areas, for examples for stem cell at various differentation stages, formarkers allowing for better sorting and enrichment of new functional cellular subsets in cell bi-ology and for targets for antibody drug conjugates in pharmaceutical research. However, find-ing an appropriate marker from a long list of identified cell surface proteins is a daunting task.The depth and breadth of the CSPA overcomes this limitation, by providing comparative infor-mation about the “uniqueness” of potential candidates. As an example of this utility, we recent-ly demonstrated how the list of 502 putative positive selection markers for human pluripotentstem cells (hPSC) could be narrowed down to 206 restricted glycoproteins after comparisonwith the CSPA [60]. Furthermore, the CSPA enabled the proposition of 15 negative selectionmarkers for hPSC. Although qualitative surfaceome comparisons can be informative, the inte-grated CSPA reveals that obtaining quantitative surfaceome maps are the crucial next step insurfaceome research. Our relative abundance estimates of cell surface proteins confirm currentknowledge about several cell type-specific markers and provide a rich source for user-specificinquiries. Comparison of cell surface protein expression levels can be made between differentcellular species and allows ranking of proteins by their estimated relative abundance. Notably,the quantified data within the CSPA suggests that surfaceome differences emerge largely on aquantitative level within cell surface protein expression rather than on a qualitative level (pro-tein identities). Since biomarker candidate lists are often highly enriched for cell surface pro-teins, the CSPA quantitative matrix could aid in prioritizing candidates based on theirabundance level for follow-up screens and could therefore help to reduce cost and time in bio-marker development. The CSPA toolbox then allows for specific and sensitive measurement ofselected prequalified cell surface proteins.
Material and Methods
Cell cultureCell lines were cultured according to guidelines from the American Type Culture Collection(ATCC) or from published cell culture conditions. The cell types were annotated and classifiedthrough information provided by ATCC or the academic laboratory that provided the cells.ATCC catalog numbers and literature references for each cell type are listed in S1 Table. Gener-ally, soluble cells were grown to a density of 0.1 to 1 million cells per ml and adherent cells werepassaged at 80% confluence. For each CSC experiment, either 1 x 10⁸ soluble cells were har-vested, or 5 x 15 cm dishes with adherent cells at 80% confluence. Tissues were harvested withminimal disturbance of cellular integrity and dissociated mechanically or when necessary withprotease mixtures (collagenase, dispase); 200 mg to 1 g tissue was used per CSC experiment.
Tissues and animal cellsHuman and mouse adipocytes were kindly provided by Prof. Christian Wolfrum (Schwerzen-bach, Switzerland) and the use thereof approved as stated in [61]. Astroglial cells were kindlyprovided by Prof. Dr. Burkhardt Becher (Zurich, Switzerland) and the use thereof approved asstated in [62]. B-ALL cells were kindly provided by Prof. Dr. med. Jean-Pierre Bourquin (Zu-rich, Switzerland) and the use thereof was approved as stated in [42]. The brain tumor sample
The Cell Surface Protein Atlas
PLOS ONE | DOI:10.1371/journal.pone.0121314 April 20, 2015 13 / 22
and the primary glioblastoma cells, which were expanded ex vivo, were kindly provided byProf. Dr. med. Karl Frei (Zurich, Switzerland) and the use thereof was in accordance with theDeclaration of Helsinki and approved by the ethics committee of the Canton Zurich.
The lymphoma sample were kindly provided by PD Dr. med. Marianne Tinguely (Zurich,Switzerland) in accordance with the Helsinki declaration and Swiss laws and was approved bythe official authorities of the ethical committee of the Canton Zurich (StV2-2007). The melano-ma cells and the neural stem cells from the forebrain were kindly provided by Prof. Dr. LukasSommer (Zurich, Switzerland) and the use thereof was in accordance with the Swiss federaland cantonal laws on animal protection and approved by the ethics committee of canton Zu-rich. Neural stem cells of the spinal cord and the subventricular zone was kindly provided byDr. Michaela Thallmair (Zurich, Switzerland) and the use thereof approved as stated in [63].The study of natural killer cells was approved as stated in [64]. The study of spleenocytes wasapproved as stated in [37]. The T-cell subsets TH-0, TH-1 and TH-17 were kindly provided byProf. Dr. Manfred Kopf (Zurich, Switzerland) and the use thereof was in accordance with Swissfederal legislation and has been approved by the local overseeing body GesundheitsdirektionKanton Zürich, Veterinaeramt (permission 148/2005).
Cell Surface CaptureFor each CSC experiment, either 1x10⁸ suspension cells, 5 x 15cm dished with adherent cellsat 80% confluence or 200 mg to 1 g of tissue were used. CSC was performed as describedpreviously [37]. In detail, cells were treated for 15 min at 4°C in the dark with 2 mM sodiummeta-periodate (Pierce) in PBS, pH 6.5 and were then incubated with 6.5 mM biocytin hydra-zide (Biotium) in PBS, pH 6.5 for 60 min. Homogenization was done in hypotonic lysis buffer(10 mM Tris, pH 7.5, 0.5 mMMgCl2, and 10 mM iodoacetamide) using a Dounce homogeniz-er. Cell debris and nuclei were removed by centrifugation at 1,700 g for 10 min and the super-natant was centrifuged again in an ultracentrifuge at ~150,000 g for 1 h. The solubilizedmembrane pellet was reduced (5 mM TCEP, 30 min), alkylated (10 mM iodoacetamide,30 min) and digested overnight with trypsin. Trypsin was inactivated for 10min at 95°C andbiotinylated glycopeptides were bound to Streptavidin Plus UltraLink Resin (SA beads; Pierce).After extensive washing, N-linked glycopeptides were enzymatically released from the SAbeads overnight by PNGase F (New England Biolabs). Peptides were desalted on Ultra Micro-TIP Columns (The Nest Group) according to the manufacturer’s instructions and dried in aSpeedVac concentrator. Finally, peptides were solubilized in LC-MS grade water containing0.1% formic acid and 5% acetonitrile.
For the following cell lines: B-ALL, HBL-1, HDLM-2, HL-60, KM-H2, L428, L540, MedB-1,NB4, SU4, SUDHL-6, U2932 (all human) and TH0, TH1, TH17 (all mouse) a slightly adaptedCSC protocol was applied in which proteins were not reduced and alkylated before digestion.Instead, after enriching for N-linked glycopeptides, peptides bound via di-sulfide bridges to N-linked glycopeptides were released by reduction in a first elution step. N-linked glycopeptideswere thereafter released by PNGase F. For the CSPA, only results from the N-glycopeptide frac-tion were included.
Reverse-phase chromatography and mass spectrometryPeptide samples were analyzed either on a Tempo Nano 1D+ HPLC system (Applied Biosys-tems/MDS Sciex) connected to a 7 tesla Finnigan LTQ-FT-ICR instrument (Thermo Scientific)or on an Eksigent Nano LC System (Eksigent Technologies) connected to a hybrid LTQ Orbi-trap XL (Thermo Scientific). Both systems were equipped with a nanoelectrospray ion source(Thermo Scientific). In total, 385 LC-MS/MS runs were performed. In the following, generic
The Cell Surface Protein Atlas
PLOS ONE | DOI:10.1371/journal.pone.0121314 April 20, 2015 14 / 22
methods for the LTQ-FT and LTQ Orbitrap XL are described. Some samples were analyzedwith slightly different settings.
On the LTQ-FT-ICR system, peptides were separated on a RP-HPLC column (75 μm x15 cm) packed in-house with C18 resin (Magic C18 AQ 3 μm, 200 Å; Michrom BioResources)using a linear gradient from 96% solvent A (0.15% formic acid) and 4% solvent B (98% acetoni-trile, 2% water, 0.15% formic acid) to 35% solvent B over 60 or 90 minutes at a flow rate of0.3 μl/min. Each MS1 scan (acquired in the ICR cell) was followed by collision-induced dissoci-ation (CID, acquired in the LTQ) of the five most abundant precursor ions with dynamic ex-clusion for 30 seconds. Only MS1 signals exceeding 150 counts were allowed to trigger MS2scans with wideband activation disabled. Total cycle time was approximately 1 to 1.5 s. ForMS1 scans, 3x10⁶ ions were accumulated in the ICR cell over a maximum time of 500 ms andscanned at a resolution of 100,000 FWHM (at 400 m/z). MS2 spectra were acquired using thenormal scan mode, a target setting of 104 ions, and an accumulation time of 100 ms. The nor-malized collision energy was set to 32%, and one microscan was acquired for each spectrum.
On the LTQ Orbitrap XL system, chromatographic separation of peptides was carried outon a RP-HPLC column (75 μm x 10.5 cm) packed in-house with C18 resin (Magic C18 AQ3 μm, 200 Å; Michrom BioResources) using a linear gradient from 95% solvent A (0.15% for-mic acid) and 5% solvent B to 35% solvent B (98% acetonitrile, 2% water, 0.1% formic acid)over 60 min at a flow rate of 0.3 μl/min. The data acquisition mode was set to acquire one high-resolution MS scan in the Orbitrap followed by five CID MS/MS scans in the linear ion trap.One microscan was acquired per MS/MS scan. For a high-resolution MS scan, 2 x 10⁶ ionswere accumulated over a maximum time of 400 ms and the FWHW resolution was set to60,000 (at m/z 300). Only MS signals exceeding 250 ion counts triggered a MS/MS attempt, fol-lowed by dynamic exclusion for 30 seconds, and 104 ions were acquired for a MS/MS scan overa maximum time of 200 ms. The normalized collision energy was set to 35%. Singly chargedions and ions with unassigned charge states were excluded from triggering MS/MS scans inboth systems.
Database searchingProteins were identified by searching MS and MS/MS data of peptides with the SEQUESTsearch engine [44] against the UniProt/SwissProt Protein Knowledgebase (version 57.15 of ei-ther Homo sapiens orMus musculus taxonomy) concatenated to the reversed sequences of allproteins and common contaminants (40521 entries human, 32455 entries mouse), with a pre-cursor mass tolerance of 0.2 Dalton. Other search parameters were at least one tryptic termi-nus, two maximal internal cleavage sites, carbamidomethylation of cysteines as fixedmodification (add 57.021464 Da), deamidation of asparagines (add 0.984016 Da) and oxida-tion of methionines (add 15.9949 Da) as variable modifications. Probability scoring was per-formed by PeptideProphet and ProteinProphet within the Trans-Proteomic Pipeline TPPv4.3.1 [45]. The ProteinProphet probability score was set individually for each cell type to afalse discovery rate (FDR) of 1%.
The MS-based proteomics data have been deposited to the ProteomeXchange Consortium(http://proteomecentral.proteomexchange.org) via the PRIDE partner repository [65] with thedataset identifier PXD000589.
Spectral library generation and searchingSpectral libraries were built and searched with SpectraST 4.0. Peptides with a higher peptideprobability than 0.9 were extracted and used to create consensus spectra. Consensus spectrawere filtered with the SpectraST quality filter level 2. All asparagines in the motif N-X-[ST]
The Cell Surface Protein Atlas
PLOS ONE | DOI:10.1371/journal.pone.0121314 April 20, 2015 15 / 22
(wherein N stands for asparagine) were set as deamidated and all other asparagines were set asunmodified. An equal number of decoy spectra were appended to the spectral libraries. Theoriginal mzXML files were searched against the created spectral libraries with SpectraST withcarbamidomethylation as a fixed modification. Probability scoring was performed by Peptide-Prophet and ProteinProphet using the non-parametric model based on decoy-estimated FDR[45]. The probability cutoff was set individually for each cell type to reach an estimated FDR of1%.
CSPA assemblyFor all cell types in the CSPA, at least two technical replicates (replicate LC-MS/MS analyses ofthe sample sample) were acquired. All samples in the CSPA were required to display specificityfor N-glycopeptides of over 50%. The average specificity for N-glycopeptides was over 75%. Amaximum of three independent CSC experiments per cell type and three LC-MS/MS runs perexperiment were integrated in the CSPA. The identified proteins were filtered for the presenceof at least one peptide with a deamidated asparagine (N[115]), measured with at least two inde-pendent scan events. We also included peptides with deamidated asparagines outside the N-glycosylation motif for two reasons: First, depending on the fragment ions identified,SEQUEST has problems assigning the modification to the correct amino acid when more thanone asparagine is present in the peptide sequence. Second, N-linked glycosylation outside theconsensus motif has recently been shown to occur in rare cases [66]. Search results from theclassical database search and the spectral search were combined to create a non-redundant sur-faceome list; members were classified based on UniProt predicted subcellular locations.
SISYPHUS-CSPASISYPHUS is a Filemaker based MAC/PC compatible database, developed in-house (http://wlab.ethz.ch/cspa/). It processes output files from the trans-proteomic pipeline, assigns biologi-cally relevant context information derived from various online databases (e.g., UniProt, GeneOntology), and presents the data in a user-friendly, browsable format. We provide SISYPHUSpopulated with the datasets from the spectral searches.
Label-free quantification and further processingPeptide precursor intensities were extracted by the label-free option of the XPressPeptidePar-ser, which is an integral part of the TPP [67]. Resulting raw intensities were logarithmized andquantile normalized per LC-MS/MS run. Proteins were quantified by MSstats [68], which ap-plies fixed ANOVA models for each individual protein. No imputation was performed. Forproteins only detected in one cell type, the average abundance of all detected featureswas calculated.
Transmembrane domains were predicted by Phobius, version 1.01 [52]. Gene ontology en-richment was obtained from the PANTHER webserver [69]. Further processing and visualiza-tion of the data was performed in R, TIBCO Spotfire Professional 3.1.0 (TIBCO Software Inc.),Protter [47] or by Perl scripts and an in-house database software.
Selected reaction monitoringCSC samples from Jurkat cells were produced as described above, except that 100 μg of biotiny-lated transferrin was spiked into the solubilized microsomal pellet. Holo-transferrin (200 μg,98% purity, Sigma Aldrich) was biotinylated in a 20-min oxidation with 10 mM sodium meta-periodate (Pierce) in PBS, pH 6.5, cleaned over a C18 column (Sep-Pack Vac C18 cartridge 100
The Cell Surface Protein Atlas
PLOS ONE | DOI:10.1371/journal.pone.0121314 April 20, 2015 16 / 22
mg, Waters), followed by a 1.5 hour incubation with 500 μg biocytin hydrazide (Biotium) andcleaned again with a C18 column. Transferrin was monitored by SRM together with four cellsurface proteins (CD147, CD100, CD54, EPHB2) in order to determine protein loss during theprocedure. Table D in S6 File contains the measured peptides with the respective transitions.SRMmeasurements were done on a 6460 Triple Quadrupole instrument (Agilent Technolo-gies) equipped with an HPLC-Chip cube and connected to an Agilent 1200 series nano-LC sys-tem. Peptide samples were loaded first to the 160-nl C18 enrichment column embedded in theHPLC chip (large capacity chip, 150 mm 300 Å C18 with 160 nl trap column, Agilent Technol-ogies) and subsequently separated chromatographically over a 60 min gradient from 97% sol-vent A (0.2% formic acid) to 35% solvent B (97% acetonitrile, 0.2% formic acid) with a flowrate of 0.3 μl/min. Collision energy was calculated by the formula (([precursor mass/charge] �
3.6)/100–4.8), and fragmenter voltage was set to 130 V. The transitions were measured with adwell time of 20 ms and a MS1 and MS2 resolution of 0.7 FWHW. Further processing of theraw SRM data was performed in Skyline v0.6 [70].
Flow cytometryCD54 levels on Jurkat cells were analyzed by direct immunofluorescence. Briefly, 1 x 10⁶ cellswere washed with PBS, 0.1% fetal bovine serum (FBS) and then incubated for 30 min at 4°Cwith anti-CD54-PE (BD Biosciences) in a 1:50 dilution. Cells were washed again with PBS,0.1% FBS and analyzed on a FACSCalibur System (BD Biosciences). Ten thousand events weremeasured per analysis and subsequently exported to FlowJo7 (Tree Star). QuantiBRITE refer-ence beads (BD Biosciences) were resuspended in 500 μl PBS, 0.1% FBS and measured on aFACSCalibur System (BD Biosciences).
Supporting InformationS1 Table. Annotation of cell types. Description and origin of all cell types and tissues used forthe CSPA.(XLS)
S1 File. Matrix of all proteins and their detection in the different cell types. Excel file con-taining 6 tables organized in different sheets. A. List of all proteins identified within the differ-ent cell types. B. Matrix of 1492 human proteins against 47 human cell types. C. Matrix of 1296human proteins against 31 human cell types. D. Table containing the number of identified pro-teins of each cell type. E. Matrix with human surfaceome proteins and cells and their estimatedrelative quantities in log2 scale. F. Matrix with mouse surfaceome proteins and cells and theirestimated relative quantities in log2 scale.(XLSX)
S2 File. CSPA validated surfaceome proteins. Excel file containing all human and mouse sur-faceome proteins in two tables and an additional table with all identified N-glycopeptides. A.List of 1492 human surfaceome proteins and their annotation. B. List of 1296 mouse surfa-ceome proteins and their annotation. C. List of 13942 mouse and human derived N-glycopep-tides, including identified modified form.(XLSX)
S3 File. Corrected topologies. PDF files with original and based on N-glycopeptide identifica-tion corrected topology pictures of 51 human proteins and 39 mouse proteins. The pictureswere created with PROTTER and identified N-glycopeptides were marked yellow.(PDF)
The Cell Surface Protein Atlas
PLOS ONE | DOI:10.1371/journal.pone.0121314 April 20, 2015 17 / 22
S4 File. CSPA based spectral libraries for human proteins. ZIP file, containing a README.txt file and two subfolders with the respective spectral libraries. A. The .pepidx, .spidx and .splib file of the human spectral library for proteins within the CSPA. The sequence motifN-X-S/T has been modified to D-X-S/T, which corresponds to a deamidated asparagine (N).Methionines are variable modified by oxidation and a decoy spectral library is appended. B.The. pepidx,. spidx and. splib file of the human spectral library for proteins within the CSPA.Asparagines and methionines can be searched with variable modifications of deamidation andoxidation, respectively and a decoy spectral library is appended.(ZIP)
S5 File. CSPA based spectral libraries for mouse proteins. ZIP file, containing a README.txt file and two subfolders with the respective spectral libraries. A. The .pepidx, .spidx and.splib file of the mouse spectral library for proteins within the CSPA. The sequence motifN-X-S/T has been modified to D-X-S/T, which corresponds to a deamidated asparagine (N).Methionines are variable modified by oxidation and a decoy spectral library is appended. B.The .pepidx, .spidx and .splib file of the mouse spectral library for proteins within the CSPA.Asparagines and methionines can be searched with variable modifications of deamidation andoxidation, respectively and a decoy spectral library is appended.(ZIP)
S6 File. CSPA toolbox. Excel file containing tables for generating inclusion lists and transitionlist of surfaceome proteins within the CSPA. A. Human inclusion list. B. Mouse inclusion list.C. Transition list. D. Measured transitions of Fig 6.(XLSX)
AcknowledgmentsWe could like to thank our various collaborators for providing cell lines and assistance in carry-ing out the CSC experiments: from the IMSB at ETH Zurich: Lydia Bänziger (SMA560), Wald-traud Mair (HeLa), Dr. Manuel Bauer (A431), Prof. Dr. Lukas Pelkmans (A431), and Prof. Dr.Christian Wolfrum (adipocytes); from the Microbiology at ETH Zurich: Dr. med. BenjaminMisselwitz (HeLa) and Prof. Dr. Wolf-Dietrich Hard (HeLa); from the Institute of Biomedicineat ETH Zurich: Dr. Alex Heer (Th0, Th1, Th17) and Prof. Dr. Manfred Kopf (Th0, Th1, Th17);from the Institute of Cell Biology at ETH Zurich: Reto Baumann (MSC80), Dr. João Betten-court Relvas (MSC80), and Prof. Dr. Ulrich Suter (MSC80); from the Institute of Anatomy atthe University of Zurich: Dr. Gianluca Civenni (melanoma), Dr. Sven Falk (embryonic neuralstem cells), and Prof. Dr. Lukas Sommer (melanoma and embryonic neural stem cells); fromthe Brain Research Institute at the University of Zurich: Dr. Franz Obermair (adult neural stemcells), Dr. Michaela Thallmair (adult neural stem cells), and Prof. Dr. Martin Schwab (adultneural stem cells, U87MG); from the Institute of Experimental Immunology at the Universityof Zurich: Dr. Johannes vom Berg (SMA560, GL261, Astroglia) and Prof. Dr. Burkhardt Becher(SMA560, GL261, astroglia); from the University Hospital in Zurich: Dr. Gunther Boysen(786-O), PD Dr. Peter Schraml (786-O), Prof. Dr. med. Holger Moch (786-O, lymphoma), PDDr. med. Marianne Tinguely (lymphoma), Prof. Dr. phil. II Karl Frei (LN18, Ln229, T98G,glioblastoma ex vivo, brain tumor), Guenter Eisele (LN-T-229), Prof. Dr. med. Michael Weller(LN-T-229), Dr. Annemarie Ziegler (CaLu3, ZL55), Colette Bigosch (CaLu3, ZL55), PD Dr.phil. Emanuela Felley-Bosco (CaLu3, ZL55, SDM4, SDM5, SDM34, SDM104, HCC4012), andProf. Dr. med. Rolf Stahel (CaLu3, ZL55, SDM4, SDM5, SDM34, SDM104, HCC4012); fromthe Children University Hospital in Zurich: Dagmar Walter (RD, Rh28, RH4, Ruch-2), ProfDr. Beat Schäfer (RD, Rh28, RH4, Ruch-2), Jeanette Boutter (hMSC), and Dr. Beat Bornhauser
The Cell Surface Protein Atlas
PLOS ONE | DOI:10.1371/journal.pone.0121314 April 20, 2015 18 / 22
(hMSC); from the Biozentrum in Basel: Chantal Rencurel (J1, R1) and Prof Dr. Yves-AlainBarde (J1, R1); from Novartis in Basel: Dr. Miriam Bibel (159–2); from the CCBR in Toronto:Dr. Brian DeVeale (R1) and Prof Dr. Derek van der Kooy (R1); from the ISB in Seattle: Kath-leen Kennedy (BM-derived Macrophages), Katie Strobe (BM-derived macrophages), and Dr.Alan Aderem (BM-derived macrophages); from the KTH in Stockholm: Dr. Emma Lundberg(U251) and Prof Dr. Mathias Uhlen; from the PMFHZ in Hradec Kralove: Pavel Bostik.
Author ContributionsConceived and designed the experiments: DBF BW KRB PZ RA. Performed the experiments:DBF AH TB APF FC AJ HM RLG CY RS AS PM AH. Analyzed the data: DBF UO. Contribut-ed reagents/materials/analysis tools: AS APF FC TB BW. Wrote the paper: DBF BW. Super-vised experiments: JVE JPB.
References1. Freitas RA Jr (2005) What is nanomedicine? Nanomedicine: nanotechnology, biology, and medicine 1:
2–9.
2. Schwartz SM (1999) The definition of cell type. Circ Res 84: 1234–1235. PMID: 10347098
3. Elschenbroich S, Kim Y, Medin JA, Kislinger T (2010) Isolation of cell surface proteins for mass spec-trometry-based proteomics. Expert review of proteomics 7: 141–154. doi: 10.1586/epr.09.97 PMID:20121483
4. Savas JN, Stein BD, Wu CC, Yates JR 3rd (2011) Mass spectrometry accelerates membrane proteinanalysis. Trends in biochemical sciences.
5. da Cunha JP, Galante PA, de Souza JE, de Souza RF, Carvalho PM, et al. (2009) Bioinformatics con-struction of the human cell surfaceome. Proc Natl Acad Sci U S A 106: 16752–16757. doi: 10.1073/pnas.0907939106 PMID: 19805368
6. Schwanhausser B, Busse D, Li N, Dittmar G, Schuchhardt J, et al. (2011) Global quantification of mam-malian gene expression control. Nature 473: 337–342. doi: 10.1038/nature10098 PMID: 21593866
7. Siuti N, Kelleher NL (2007) Decoding protein modifications using top-downmass spectrometry. Naturemethods 4: 817–821. PMID: 17901871
8. Sun Y, Gallagher-Jones M, Barker C, Wright GJ (2012) A benchmarked protein microarray-based plat-form for the identification of novel low-affinity extracellular protein interactions. Analytical biochemistry424: 45–53. doi: 10.1016/j.ab.2012.01.034 PMID: 22342946
9. Zola H (2006) Medical applications of leukocyte surface molecules—the CDmolecules. Mol Med 12:312–316. PMID: 17380197
10. Solter D, Knowles BB (1978) Monoclonal antibody defining a stage-specific mouse embryonic antigen(SSEA-1). Proceedings of the National Academy of Sciences of the United States of America 75:5565–5569. PMID: 281705
11. Gundry RL, Boheler KR, Van Eyk JE, Wollscheid B (2008) A novel role for proteomics in the discoveryof cell-surface markers on stem cells: Scratching the surface. Proteomics Clinical applications 2: 892–903. PMID: 19526049
13. Scott SD (1998) Rituximab: a new therapeutic monoclonal antibody for non-Hodgkin's lymphoma. Can-cer practice 6: 195–197. PMID: 9652253
14. Baselga J, Tripathy D, Mendelsohn J, Baughman S, Benz CC, et al. (1999) Phase II study of weekly in-travenous trastuzumab (Herceptin) in patients with HER2/neu-overexpressing metastatic breast can-cer. Seminars in oncology 26: 78–83. PMID: 10482197
15. Belov L, de la Vega O, dos Remedios CG, Mulligan SP, Christopherson RI (2001) Immunophenotypingof leukemias using a cluster of differentiation antibody microarray. Cancer research 61: 4483–4489.PMID: 11389079
16. Bandura DR, Baranov VI, Ornatsky OI, Antonov A, Kinach R, et al. (2009) Mass cytometry: techniquefor real time single cell multitarget immunoassay based on inductively coupled plasma time-of-flightmass spectrometry. Analytical Chemistry 81: 6813–6822. doi: 10.1021/ac901049w PMID: 19601617
17. Uhlen M, Oksvold P, Fagerberg L, Lundberg E, Jonasson K, et al. (2010) Towards a knowledge-basedHuman Protein Atlas. Nat Biotechnol 28: 1248–1250. doi: 10.1038/nbt1210-1248 PMID: 21139605
The Cell Surface Protein Atlas
PLOS ONE | DOI:10.1371/journal.pone.0121314 April 20, 2015 19 / 22
18. Andersson O, Kozlowski M, Garachtchenko T, Nikoloff C, Lew N, et al. (2005) Determination of relativeprotein abundance by internally normalized ratio algorithm with antibody arrays. Journal of proteome re-search 4: 758–767. PMID: 15952723
19. Apweiler R, Bairoch A, Wu CH, Barker WC, Boeckmann B, et al. (2004) UniProt: the Universal Proteinknowledgebase. Nucleic acids research 32: D115–119. PMID: 14681372
20. Kandasamy K, Keerthikumar S, Goel R, Mathivanan S, Patankar N, et al. (2009) Human Proteinpedia:a unified discovery resource for proteomics research. Nucleic Acids Res 37: D773–781. doi: 10.1093/nar/gkn701 PMID: 18948298
21. WilhelmM, Schlegl J, Hahne H, Moghaddas Gholami A, Lieberenz M, et al. (2014) Mass-spectrometry-based draft of the human proteome. Nature 509: 582–587. doi: 10.1038/nature13319 PMID: 24870543
22. Kim MS, Pinto SM, Getnet D, Nirujogi RS, Manda SS, et al. (2014) A draft map of the human proteome.Nature 509: 575–581. doi: 10.1038/nature13302 PMID: 24870542
23. Beck M, Schmidt A, Malmstroem J, Claassen M, Ori A, et al. (2011) The quantitative proteome of ahuman cell line. Molecular systems biology 7: 549. doi: 10.1038/msb.2011.82 PMID: 22068332
24. Dormeyer W, van Hoof D, Braam SR, Heck AJ, Mummery CL, et al. (2008) Plasmamembrane proteo-mics of human embryonic stem cells and human embryonal carcinoma cells. Journal of proteome re-search 7: 2936–2951. doi: 10.1021/pr800056j PMID: 18489135
25. Lewandrowski U, Wortelkamp S, Lohrig K, Zahedi RP, Wolters DA, et al. (2009) Platelet membraneproteomics: a novel repository for functional research. Blood 114: e10–19. doi: 10.1182/blood-2009-02-203828 PMID: 19436052
26. Deeb SJ, Cox J, Schmidt-Supprian M, Mann M (2014) N-linked glycosylation enrichment for in-depthcell surface proteomics of diffuse large B-cell lymphoma subtypes. Mol Cell Proteomics 13: 240–251.doi: 10.1074/mcp.M113.033977 PMID: 24190977
29. Autelitano F, Loyaux D, Roudieres S, Deon C, Guette F, et al. (2014) Identification of novel tumor-asso-ciated cell surface sialoglycoproteins in human glioblastoma tumors using quantitative proteomics.PLoS One 9: e110316. doi: 10.1371/journal.pone.0110316 PMID: 25360666
30. Rugg-Gunn PJ, Cox BJ, Lanner F, Sharma P, Ignatchenko V, et al. (2012) Cell-surface proteomicsidentifies lineage-specific markers of embryo-derived stem cells. Dev Cell 22: 887–901. doi: 10.1016/j.devcel.2012.01.005 PMID: 22424930
31. Roesli C, Neri D, Rybak JN (2006) In vivo protein biotinylation and sample preparation for the proteomicidentification of organ- and disease-specific antigens accessible from the vasculature. Nat Protoc 1:192–199. PMID: 17406232
32. Prior MJ, Larance M, Lawrence RT, Soul J, Humphrey S, et al. (2011) Quantitative proteomic analysisof the adipocyte plasmamembrane. J Proteome Res 10: 4970–4982. doi: 10.1021/pr200446r PMID:21928809
33. Kim Y, Elschenbroich S, Sharma P, Sepiashvili L, Gramolini AO, et al. (2011) Use of colloidal silica-beads for the isolation of cell-surface proteins for mass spectrometry-based proteomics. Methods MolBiol 748: 227–241. doi: 10.1007/978-1-61779-139-0_16 PMID: 21701978
35. Bock T, Bausch-Fluck D, Hofmann A, Wollscheid B (2011) CD proteome and beyond—technologies fortargeting the immune cell surfaceome. Frontiers in Bioscience accepted.
36. Leth-Larsen R, Lund RR, Ditzel HJ (2010) Plasmamembrane proteomics and its application in clinicalcancer biomarker discovery. Molecular & cellular proteomics: MCP 9: 1369–1382. doi: 10.1074/mcp.R900006-MCP200 PMID: 20382631
37. Wollscheid B, Bausch-Fluck D, Henderson C, O'Brien R, Bibel M, et al. (2009) Mass-spectrometricidentification and relative quantification of N-linked cell surface glycoproteins. Nat Biotechnol 27: 378–386. doi: 10.1038/nbt.1532 PMID: 19349973
38. Hofmann A, Gerrits B, Schmidt A, Bock T, Bausch-Fluck D, et al. (2010) Proteomic cell surface pheno-typing of differentiating acute myeloid leukemia cells. Blood 116: e26–34. doi: 10.1182/blood-2010-02-271270 PMID: 20570859
39. Gundry RL, Raginski K, Tarasova Y, Tchernyshyov I, Bausch-Fluck D, et al. (2009) The mouse C2C12myoblast cell surface N-linked glycoproteome: identification, glycosite occupancy, and membrane ori-entation. Mol Cell Proteomics 8: 2555–2569. doi: 10.1074/mcp.M900195-MCP200 PMID: 19656770
The Cell Surface Protein Atlas
PLOS ONE | DOI:10.1371/journal.pone.0121314 April 20, 2015 20 / 22
40. Ziegler A, Cerciello F, Bigosch C, Bausch-Fluck D, Felley-Bosco E, et al. (2011) Proteomic SurfaceomeAnalysis of Mesothelioma. Lung Cancer accepted.
41. Bock T, Moest H, Omasits U, Dolski S, Lundberg E, et al. (2012) Proteomic analysis reveals drug ac-cessible cell surface N-glycoproteins of primary and established glioblastoma cell lines. Journal of pro-teome research 11: 4885–4893. doi: 10.1021/pr300360a PMID: 22909291
42. Mirkowska P, Hofmann A, Sedek L, Slamova L, Mejstrikova E, et al. (2013) Leukemia surfaceome anal-ysis reveals new disease-associated features. Blood 121: e149–159. doi: 10.1182/blood-2012-11-468702 PMID: 23649467
43. Boysen G, Bausch-Fluck D, Thoma CR, Nowicka AM, Stiehl DP, et al. (2012) Identification and func-tional characterization of pVHL-dependent cell surface proteins in renal cell carcinoma. Neoplasia 14:535–546. PMID: 22806541
44. Eng JK, McCormack AL, Yates JR (1994) An approach to correlate tandemmass spectral data of pep-tides with amino acid sequences in a protein database. Journal of the American Society for Mass Spec-trometry 5: 976–989. doi: 10.1016/1044-0305(94)80016-2 PMID: 24226387
45. Deutsch EW, Mendoza L, Shteynberg D, Farrah T, Lam H, et al. (2010) A guided tour of the Trans-Proteomic Pipeline. Proteomics 10: 1150–1159. doi: 10.1002/pmic.200900375 PMID: 20101611
46. Lam H, Deutsch EW, Eddes JS, Eng JK, Stein SE, et al. (2008) Building consensus spectral librariesfor peptide identification in proteomics. Nat Methods 5: 873–875. doi: 10.1038/nmeth.1254 PMID:18806791
47. Omasits U, C HA, Muller S, Wollscheid B (2013) Protter: interactive protein feature visualization and in-tegration with experimental proteomic data. Bioinformatics.
48. Colonna M, Samaridis J (1995) Cloning of immunoglobulin-superfamily members associated with HLA-C and HLA-B recognition by human natural killer cells. Science 268: 405–408. PMID: 7716543
49. Schwab U, Stein H, Gerdes J, Lemke H, Kirchner H, et al. (1982) Production of a monoclonal antibodyspecific for Hodgkin and Sternberg-Reed cells of Hodgkin's disease and a subset of normal lymphoidcells. Nature 299: 65–67. PMID: 7110326
50. ChuangW, Lagenaur CF (1990) Central nervous system antigen P84 can serve as a substrate for neur-ite outgrowth. Developmental biology 137: 219–232. PMID: 2303162
51. Dubois NC, Craft AM, Sharma P, Elliott DA, Stanley EG, et al. (2011) SIRPA is a specific cell-surfacemarker for isolating cardiomyocytes derived from human pluripotent stem cells. Nature biotechnology29: 1011–1018. doi: 10.1038/nbt.2005 PMID: 22020386
52. Kall L, Krogh A, Sonnhammer EL (2004) A combined transmembrane topology and signal peptide pre-diction method. J Mol Biol 338: 1027–1036. PMID: 15111065
53. Ikeda M, Arai M, Lao DM, Shimizu T (2002) Transmembrane topology prediction methods: a re-assess-ment and improvement by a consensus method using a dataset of experimentally-characterized trans-membrane topologies. In silico biology 2: 19–33. PMID: 11808871
54. Schmidt A, Gehlenborg N, Bodenmiller B, Mueller LN, Campbell D, et al. (2008) An integrated, directedmass spectrometric approach for in-depth characterization of complex peptide mixtures. Molecular &cellular proteomics: MCP 7: 2138–2150.
55. Stahl-Zeng J, Lange V, Ossola R, Eckhardt K, KrekW, et al. (2007) High sensitivity detection of plasmaproteins by multiple reaction monitoring of N-glycosites. Mol Cell Proteomics 6: 1809–1817. PMID:17644760
56. Picotti P, Rinner O, Stallmach R, Dautel F, Farrah T, et al. (2010) High-throughput generation of select-ed reaction-monitoring assays for proteins and proteomes. Nature methods 7: 43–46. doi: 10.1038/nmeth.1408 PMID: 19966807
57. Gnad F, Ren S, Cox J, Olsen JV, Macek B, et al. (2007) PHOSIDA (phosphorylation site database):management, structural and evolutionary investigation, and prediction of phosphosites. Genome biolo-gy 8: R250. PMID: 18039369
58. Bodenmiller B, Campbell D, Gerrits B, Lam H, Jovanovic M, et al. (2008) PhosphoPep—a database ofprotein phosphorylation sites in model organisms. Nature biotechnology 26: 1339–1340. doi: 10.1038/nbt1208-1339 PMID: 19060867
59. Hornbeck PV, Chabra I, Kornhauser JM, Skrzypek E, Zhang B (2004) PhosphoSite: A bioinformaticsresource dedicated to physiological protein phosphorylation. Proteomics 4: 1551–1561. PMID:15174125
60. Boheler KR, Bhattacharya S, Kropp EM, Chuppa S, Riordon DR, et al. (2014) A Human PluripotentStem Cell Surface N-Glycoproteome Resource Reveals Markers, Extracellular Epitopes, and Drug Tar-gets. Stem cell reports.
The Cell Surface Protein Atlas
PLOS ONE | DOI:10.1371/journal.pone.0121314 April 20, 2015 21 / 22
61. Moest H, Frei AP, Bhattacharya I, Geiger M, Wollscheid B, et al. (2013) Malfunctioning of adipocytes inobesity is linked to quantitative surfaceome changes. Biochimica et biophysica acta 1831: 1208–1216.PMID: 24046861
62. Vom Berg J, Vrohlings M, Haller S, Haimovici A, Kulig P, et al. (2013) Intratumoral IL-12 combined withCTLA-4 blockade elicits T cell-mediated glioma rejection. J Exp Med 210: 2803–2811. doi: 10.1084/jem.20130678 PMID: 24277150
63. Obermair FJ, Fiorelli R, Schroeter A, Beyeler S, Blatti C, et al. (2010) A novel classification of quiescentand transit amplifying adult neural stem cells by surface and metabolic markers permits a defined simul-taneous isolation. Stem Cell Res 5: 131–143. doi: 10.1016/j.scr.2010.05.001 PMID: 20538535
64. Hartmann J, Tran TV, Kaudeer J, Oberle K, Herrmann J, et al. (2012) The stalk domain and the glyco-sylation status of the activating natural killer cell receptor NKp30 are important for ligand binding. J BiolChem 287: 31527–31539. doi: 10.1074/jbc.M111.304238 PMID: 22807449
65. Vizcaino JA, Cote RG, Csordas A, Dianes JA, Fabregat A, et al. (2013) The PRoteomics IDEntifications(PRIDE) database and associated tools: status in 2013. Nucleic acids research 41: D1063–1069. doi:10.1093/nar/gks1262 PMID: 23203882
66. Zielinska DF, Gnad F, Wisniewski JR, Mann M (2010) Precision mapping of an in vivo N-glycoproteomereveals rigid topological and sequence constraints. Cell 141: 897–907. doi: 10.1016/j.cell.2010.04.012PMID: 20510933
67. Keller A, Eng J, Zhang N, Li XJ, Aebersold R (2005) A uniform proteomics MS/MS analysis platform uti-lizing open XML file formats. Molecular systems biology 1: 2005 0017. PMID: 16729052
68. Clough T, Key M, Ott I, Ragg S, SchadowG, et al. (2009) Protein quantification in label-free LC-MS ex-periments. J Proteome Res 8: 5275–5284. doi: 10.1021/pr900610q PMID: 19891509
69. Thomas PD, Campbell MJ, Kejariwal A, Mi H, Karlak B, et al. (2003) PANTHER: a library of protein fam-ilies and subfamilies indexed by function. Genome research 13: 2129–2141. PMID: 12952881
70. MacLean B, Tomazela DM, Shulman N, Chambers M, Finney GL, et al. (2010) Skyline: an open sourcedocument editor for creating and analyzing targeted proteomics experiments. Bioinformatics 26: 966–968. doi: 10.1093/bioinformatics/btq054 PMID: 20147306
The Cell Surface Protein Atlas
PLOS ONE | DOI:10.1371/journal.pone.0121314 April 20, 2015 22 / 22